Article

A Data-Driven Approach to Predict the ROP of Deep Wells in Fukang Sag

1
Engineering Technology Research Institute, CNPC Xinjiang Oilfield Branch, Karamay 834000, China
2
College of Petroleum Engineering, China University of Petroleum, Beijing 102249, China
*
Author to whom correspondence should be addressed.
Appl. Sci. 2023, 13(22), 12471; https://doi.org/10.3390/app132212471
Submission received: 19 October 2023 / Revised: 13 November 2023 / Accepted: 15 November 2023 / Published: 18 November 2023
(This article belongs to the Special Issue Geomechanics and Reservoirs: Modeling and Simulation)

Abstract

:
In the deep well drilling process in the Fukang Depression of the Eastern Junggar Basin, rock fracturing issues and low rate of penetration (ROP) have posed significant challenges to drilling efficiency. Accurate predictions of ROP prior to drilling are of considerable value in this context. Precise predictions enable on-site engineering teams to proactively identify drilling difficulties and anticipate potential complex scenarios, facilitating them in designing preventive measures in advance, such as selecting appropriate drill bits, adjusting drilling parameters, or employing specific drilling techniques to address these issues. This, in turn, enhances drilling efficiency and greatly reduces drilling risks. Traditional mechanical-specific energy drilling rate models, despite their widespread use, exhibit significant disparities with actual results when predicting ROP. These models only consider the influence of drill bits, drilling tools, and some drilling parameters on ROP, failing to adequately account for the variations caused by engineering factors and failing to capture the interrelationships between various parameters, especially when dealing with complex subsurface formations in the Fukang Depression. Random forest is a non-parametric algorithm in the field of machine learning that is suitable for analyzing and predicting ROP affected by various complex and non-linear drilling parameters. This paper establishes a Random forest model based on a dataset containing multiple variables of logging parameters and the actual ROP. The model ranks and assesses the important feature parameters of ROP to reveal their impact. Additionally, the model uses bootstrap sampling and feature random selection to construct multiple decision trees, reducing the risk of overfitting and endowing the model with a high generalization capability. Evaluation metrics indicate that the model exhibits a high prediction accuracy and performs well, significantly improving the accuracy of mechanical drilling rate predictions in the deep wells of the Fukang Depression. This model provides robust support and serves as a positive demonstration for addressing mechanical drilling rate issues in complex subsurface formations in the future.

1. Introduction

The Fukang Fault Zone in the Junggar Basin, located in front of the Bogda Mountains [1,2], has undergone complex structural deformations and oil and gas reservoir formation processes due to the superimposition of multiple tectonic movements, like the Himalayas, Yanshan, and Haisi [3]. Within the Fukang Depression, vertical sedimentary sequences are characterized by multiple intricate layers [4,5,6], representing a typical low porosity and ultra-low permeability reservoir [7]. In deep formations, where deep formations demonstrate a low ROP [8], with an average drilling rate of only 1.56 m per hour in the Permian strata [9]. The mechanical drilling rate is a crucial indicator for assessing drilling efficiency, making the development of efficient and accurate mechanical drilling rate prediction models of great significance. This is essential for optimizing drilling parameters and reducing drilling costs in the Fukang Depression, ultimately promoting efficient exploration and development [10,11].
Experts and scholars worldwide have conducted extensive research on mechanical drilling rate prediction methods. Commonly employed methods include prediction based on field experience, prediction based on drilling rate equations, and numerical simulation-based predictions [12]. Bourgoyne et al. [13] introduced a mechanical drilling rate prediction method based on multivariate regression, but this method involves several empirical parameters in its calculations. Rastegar et al. [14] enhanced the prediction model for ROP by taking into account factors like bit wear, hydraulic parameters, and formation characteristics. Liu et al. [15] developed a drilling rate prediction model related to bit weight through the analysis of laboratory test data. Li et al. and Chen et al. [16,17] derived drilling rate equations based on rock strength criteria and mechanical-specific energy theory. However, due to the complex and variable subsurface conditions, accurately depicting the relationship between ROP and variables, like formation properties and engineering parameters, poses a challenge: ROP cannot be predicted by a simple mapping relationship. Soares et al. [18] highlighted the limitations of traditional mechanical drilling rate prediction methods based on analytical equations. These equations, as well as laboratory tests, struggle to comprehensively consider the influence of various drilling parameters, engineering factors, and geological conditions on ROP. Additionally, these parameters can interact with each other, making it difficult to predict ROP accurately using a standard equation. Existing equations for mechanical drilling rate predictions are often one-sided and exhibit significant deviations.
With the rapid advancement of artificial intelligence, an increasing number of researchers are applying machine learning methods to the petroleum industry. Amer et al. [19] used artificial neural networks (ANNs) to establish a mechanical drilling rate prediction model based on drilling and bit parameters, although the considered influencing parameters are not comprehensive. Shi et al. and Zhao et al. [20,21] employed extreme learning machines (ELMs) for the prediction of ROP in offshore wells. However, ELMs struggle to provide highly transparent and interpretable predictive results and are susceptible to overfitting. Ahmed et al. [22] explored several machine learning approaches for predicting ROP, including neural network (ANN), extreme learning machine, support vector regression, and least-square support vector regression (LS-SVR), all demonstrating commendable performance. Nevertheless, these methods face challenges in handling high-dimensional data, sensitivity to noise, and capturing nonlinear relationships. Nevertheless, most of these studies focus primarily on data mapping relationships and overlook mechanistic models or provide explanations for the causes of mechanical drilling rate anomalies.
This study takes a mechanistic modeling approach, utilizing the mechanical specific energy theory to predict ROP in deep wells within the Fukang Depression, while analyzing the reasons behind the lower drilling rates in deep formations. Subsequently, driven by data, a model suitable for predicting ROP in deep wells of the Fukang Depression is developed using the random forest algorithm, with engineering parameters like weight on bit, rotational speed, and drilling fluid equivalent density as the feature variables. The model’s validity is assessed based on the correlation of influencing parameters with the mechanistic model. The analysis results indicate that, compared to traditional mechanical drilling rate prediction models, data-driven mechanical drilling rate prediction demonstrates higher accuracy and applicability. This offers valuable guidance for predicting ROP in complex deep formations.

2. ROP Prediction Based on Mechanical-Specific Energy Theory

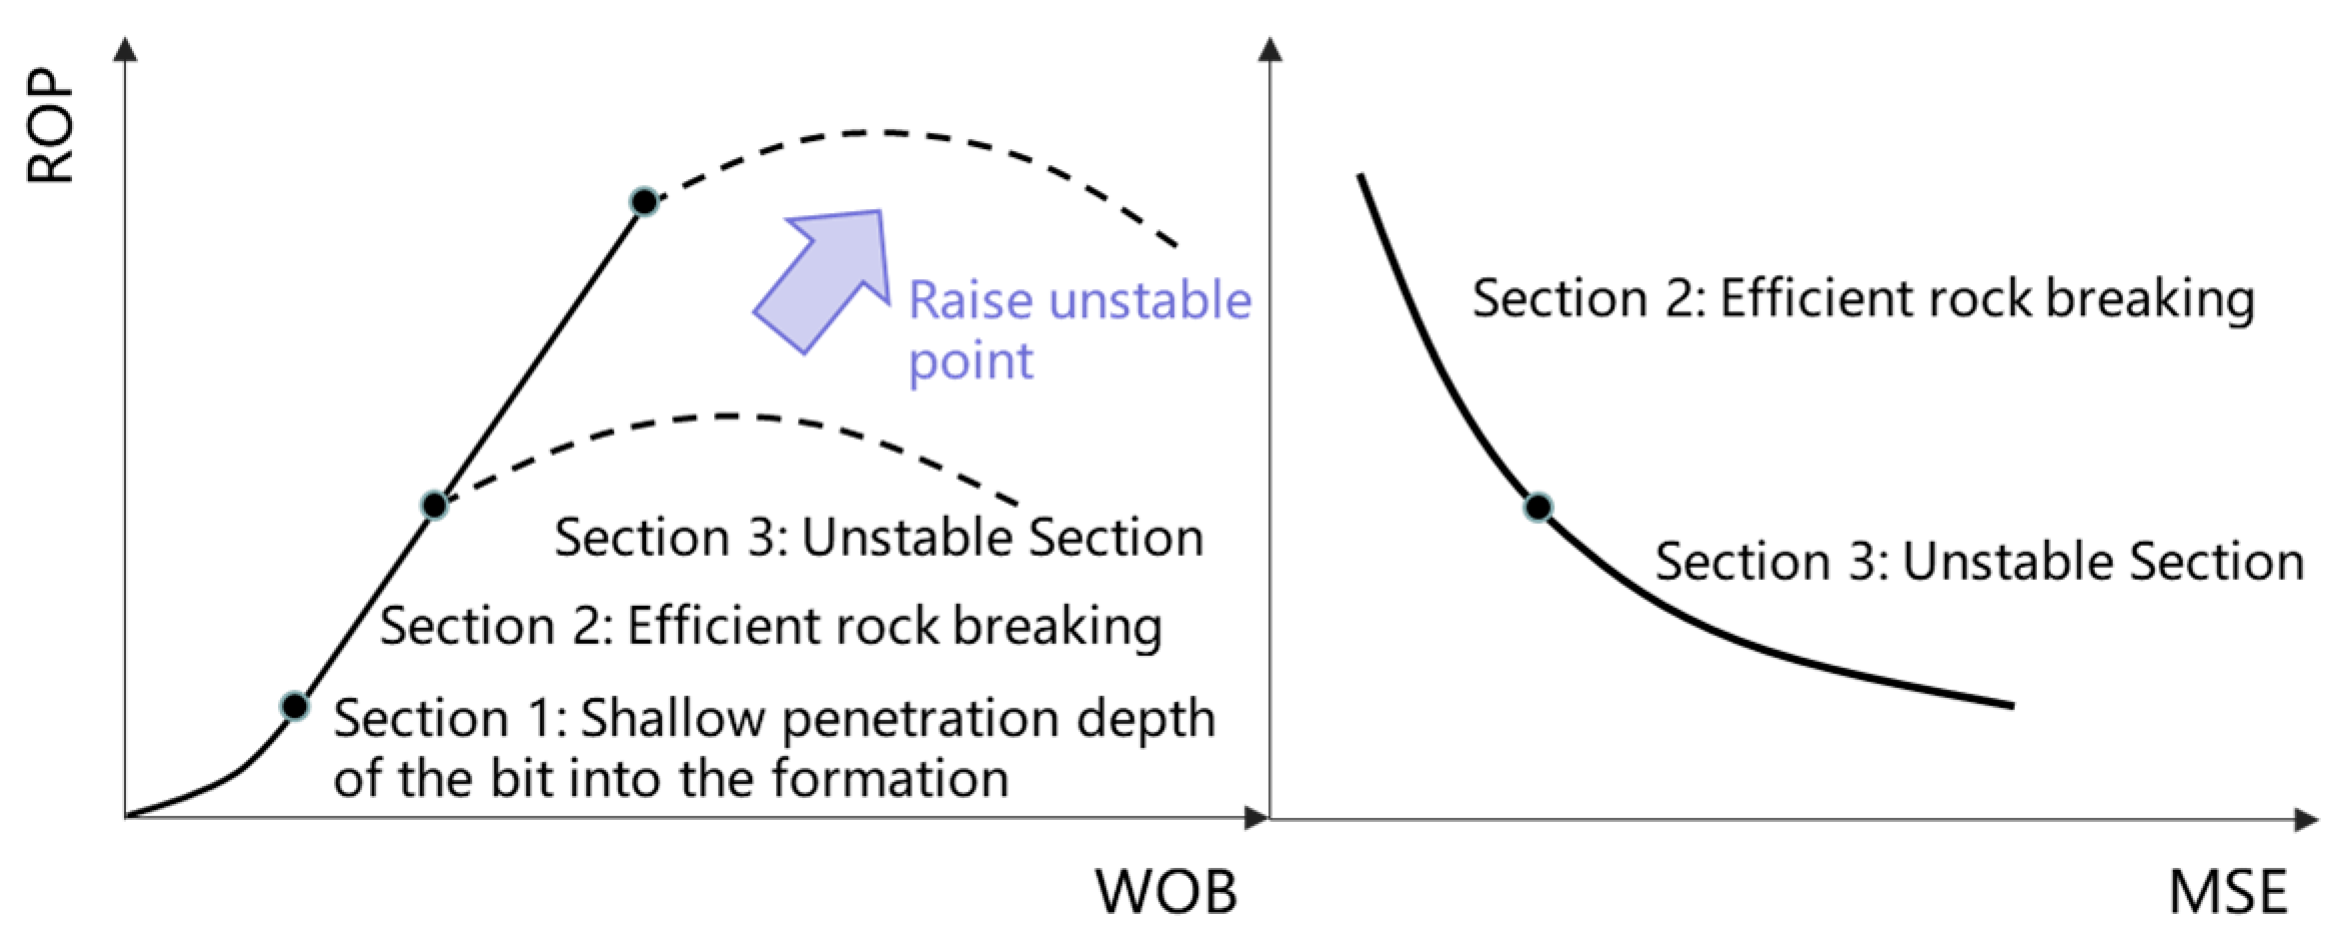
2.1. Drilling Rate Equations Based on Mechanical-Specific Energy Theory

Mechanical drilling rate prediction based on mechanical-specific energy theory is a method used to estimate the mechanical drilling rate during underground drilling processes. The fundamental idea of this theory is that mechanical drilling rate depends on the mechanical performance of the drill bit and the physical properties of the formation.
In the latter half of the 19th century, R. Teale [23] proposed the mechanical-specific energy theory through extensive laboratory experiments on rock fragmentation. Its expression is as follows:
M = 4 W π D b 2 + 480 r T b D b 2 R
where M is the mechanical specific energy, MPa; W is the drilling pressure, KN; D b is the diameter of the drill bit, mm; r is the rotational speed, r/min; T b is the torque of the drill bit, KN·m; and R is the ROP, m/h.
The mechanical-specific energy theory assumes that the formation is homogeneous and isotropic. The M value represents the ease of cutting rock or formation materials under unit cutting energy, and this degree is determined by factors such as the drill bit type and drilling tool parameters.
In the process of rock breaking with a drill bit, rock strength plays a crucial role. The unconfined compressive strength (UCS) of rock represents the actual compressive strength of rocks under confinement. However, during drilling calculations, the uniaxial compressive strength is still often used. This is because true triaxial rock mechanic experiments are costly and require strict experimental conditions, making it difficult to obtain a large amount of experimental data.
The Mohr-Coulomb criterion is an essential tool for analyzing and predicting the fracture and shear behavior of rocks under stress conditions. It is based on graphical representation and employs the Mohr circle and the angle of friction to describe the shear behavior of materials, as expressed below:
τ = c + σ tan ϕ
where τ represents shear strength, MPa; c is the cohesion of the rock (shear strength typically measured under unconfined conditions), MPa; σ denotes normal stress, MPa; and ϕ is the internal friction angle, °.
When subsurface rocks are subjected to confining pressure, their compressive strength increases significantly. Using uniaxial compressive strength to describe subsurface rocks under these conditions would result in significant deviations. Therefore, in practical engineering, it is common to perform an equivalent substitution using the Mohr-Coulomb criterion. This involves replacing the parameters in Equation (2) with stress parameters under lateral confinement to obtain the rock’s lateral confinement compressive strength:
C C S = U C S + D p + 2 D p + sin ϕ 1 sin ϕ D p = E C D P p
where C C S is the confined compressive strength, MPa; U C S is the uniaxial compressive strength, MPa; D p is the difference between drilling fluid pressure and formation pressure, MPa; ϕ is the internal friction angle of the rock, °; E C D is the circulating drilling fluid pressure, MPa; and P p is the formation pressure, MPa.
Based on Equations (1) and (3), that is, based on the mechanical-specific energy theory while considering other drilling parameters, such as drill bit characteristics, the drilling rate equation can be derived as:
R = 480 r T b M D b 2 4 W π = 4.06 μ r D b 0.6446 C C S E F F W 101.6 π D b 2
where μ is the specific sliding friction factor of the drill bit, dimensionless; E F F is the mechanical efficiency, %; and the other variables are the same as those that were previously mentioned.
E F F is an indicator that represents the performance of a mechanical system, typically used to measure losses in energy conversion processes. Mechanical efficiency is usually expressed as a percentage, indicating the ratio between the actual output power and input power. In this experiment, the data from laboratory quasi-triaxial rock mechanic experiments were used in conjunction with Equation (2). The values were regressed to obtain the mechanical efficiency. The maximum and minimum mechanical efficiency values for five neighboring wells (Fu4, Fu9, Fu10, Fu48, and Fu49) based on well logging data were expressed by the following equation:
E F F m i n = 0.031 C C S + 7.932 E F F m a x = 0.047 C C S + 12.645
where E F F m i n is the minimum mechanical efficiency, %; and E F F m a x is the maximum mechanical efficiency, %. Taking the average of the equation above yields the mechanical efficiency for the target well:
E F F = 0.039 C C S + 10.289
Mechanical-specific energy can represent drilling efficiency during the drilling process. At a constant mechanical drilling rate, a smaller mechanical-specific energy indicates that less energy is required to break a unit volume of rocks, indicating more reasonable drilling parameters. During the drilling process, the drilling pressure acts on the cutting teeth of the drill bit, causing them to penetrate the rock for rock breaking. The relationship curve between the mechanical drilling rate and drilling pressure is shown in Figure 1 [24]. In an ideal scenario, ROP should exhibit a direct proportionality with WOB, implying that an increase in WOB should correspondingly enhance the ROP.
However, in certain drilling conditions, as described in Stage 3, anomalies may occur. Instances like encountering bit balling, bottom hole pack-off, or drilling tool vibrations can lead to additional WOB being applied to the drill bit. Despite the increase in WOB, the ROP decreases due to the adverse effects of these conditions. This disruption signifies that the expected relationship of the mechanical-specific energy theory is disturbed in these specific circumstances. Therefore, in practical drilling operations, it is essential to adapt flexibly to various challenges to maintain the efficiency and safety of the drilling process.

2.2. ROP Prediction Results

Using the mechanical-specific energy theory, we conducted a mechanical drilling rate prediction analysis for the deep section of Well 39 in the Fukang Depression, located in the eastern part of the Junggar Basin. The comparison between the predicted mechanical drilling rate calculated using Equation (4) and the actual values is shown in Figure 2. It is evident that there is a significant difference between the mechanical drilling rate predictions and the real values. Upon comparing the drilling parameters with the measured ROP, we found that the drilling rate in this section has a negative correlation with the weight on bit (WOB). However, in the mechanical-specific-energy-based drilling rate prediction formula, the drilling rate has a positive correlation with WOB. The drilling records indicate that within the range of 3800–5000 m in Well 39, there was a mud cake at the bottom of the well during the drilling process. This caused the drill bit to become stuck and resulted in a decrease in the drilling fluid’s performance. As a result, it had an impact on the mechanical drilling rate prediction based on the mechanical-specific energy theory for this well section, leading to a significant deviation between the predicted and actual values. Hence, it is evident that the drilling rate prediction based on the Teale model of the mechanical-specific energy theory is not suitable for challenging subsurface formations in the Fukang Depression.

3. ROP Prediction Based on the Random Forest Machine Learning Model

3.1. Principles of the Random Forest Algorithm

Random forest belongs to the Bagging class of ensemble machine learning algorithms. As shown in Figure 3, ensemble learning involves training multiple weak learners to form a strong learner. In the Random Forest, the weak model chosen is the CART decision tree. The Random Forest utilizes bootstrap sampling to collect multiple different subsets of the original samples for training the decision trees. The final result is obtained by averaging the predictions of all the decision trees.
When training an individual CRAT decision tree model, consider a scenario as depicted in Figure 3. In this scenario, the primary factors influencing mechanical drilling rate are whether the drilling tool’s rotation speed exceeds 50 r/min. The decision tree divides the dataset into two groups based on this criterion, grouping data points with rotation speeds below 50 r/min together. The average of this group represents the tree’s prediction for the mechanical drilling rate under this condition.
As the decision tree model’s other feature variables, such as drilling pressure, vary, the mechanical drilling rate normally increases with the increase in the drilling pressure. However, during the drilling process, situations like those illustrated in Stage 3 of Figure 1, such as bit mud packing, bottom-hole mud packing, and tool vibrations, can lead to increased drilling pressure and a decrease in the mechanical drilling rate. However, a mechanical drilling rate model driven by a mechanistic model cannot reflect this anomalous change in the mechanical drilling rate caused by complex situations. Continuing to use a traditional mechanical drilling rate model would yield a trend opposite to the actual values. On the other hand, a data-driven approach, which considers only the mapping relationship between data points, can capture this anomalous trend in the mechanical drilling rate and effectively addresses the problem of deep well mechanical drilling rate prediction in complex situations.
For the sake of facilitating comprehension of this model, further detailed formulaic explanations regarding the Random Forest can be found in Appendix A.

3.2. Factor Analysis

Parameter correlation analysis and feature importance ranking are important tools for optimizing the prediction performance of random forest models. They can improve model performance, reduce feature dimensions, enhance model execution speed, and increase prediction accuracy. Additionally, they help in understanding the causal relationships behind the mechanism-based theoretical model.
This study involved a total of 5 training wells (Fu4, Fu9, Fu10, Fu48, Fu49, and Kangtan1) and 2 test wells (Fu39 and Kangtan2). A total of 50,000 data sets were selected for the training set, and 10,000 data sets for the test set. Among these wells, Fu4, Fu9, Fu10, Fu48, and Fu49 belong to the same block, while Kangtan1 and Kangtan2 are located at a greater distance from the other 5 wells and belong to adjacent blocks. Choosing Kangtan2 well as a test well also served, to some extent, as a test of the generalization ability of the random forest drilling speed prediction model.
The dataset established for this study comprises a total of 10 feature parameters and has undergone fundamental statistical description, as illustrated in Table 1.
First, the relationships between the engineering parameters, such as annular pressure, torque, drilling pressure, rotation speed, equivalent density, viscosity, inlet flow rate, outlet flow rate, total pump speed, and ROP, were analyzed. Pearson’s correlation coefficients were used to assess the strength of linear relationships between the parameters, as shown in Figure 4. The results indicate that the drilling fluid equivalent density and viscosity are negatively correlated with ROP, while torque, rotation speed, drilling fluid flow rate, and pump speed are positively correlated with ROP. This is consistent with our understanding based on the traditional mechanistic models. However, there is a negative correlation between the drilling pressure and ROP, which is inconsistent with the mechanistic model’s understanding. The main reason for this discrepancy is the occurrence of complex situations, such as mud packs or drilling tool vibrations in difficult drilling sections. This also explains the opposite trend between the ROP predicted by the mechanical-specific energy model in Fu39 well, as shown in Figure 2.
Feature importance ranking is of great significance in data analysis and machine learning. It helps us to understand data and models and make more informed decisions. Importance ranking explains the prediction results of a model, providing information about which features have a greater impact on the model’s output. This is crucial for understanding the decision-making process of the model and why it makes specific predictions. In some cases, feature importance ranking can be used to identify potential issues or anomalies.
In this study, feature importance rankings and their impact percentages on the drilling speed for two test wells provided by the random forest model were combined with mechanistic models to explain the degree of coupling between model predictions and actual results.
An analysis of the factors affecting the drilling speed in well Fu39 is shown in Figure 5. The main factors influencing the drilling speed of this well are the drilling fluid equivalent density, annular pressure, inlet flow rate, and pump speed, with the drilling fluid equivalent density having the highest feature importance share, around 0.39.
According to the mechanistic model, the choice of the appropriate drilling fluid density can make it easier for the drill bit to penetrate the subsurface, reducing the risk of the drill bit becoming stuck or failing. Therefore, the selection of equivalent density is crucial for maintaining a stable drilling process. In the model, this means that we should pay close attention to the equivalent density because it has a significant impact on the drilling speed and can significantly change the drill bit’s penetration into the formation.
Other important factors include the annular pressure, inlet flow rate, and pump speed. Annular pressure refers to the pressure of the drilling fluid inside the wellbore, which affects the cuttings’ transport and wellbore stability. Adequate annular pressure helps to maintain wellbore stability and prevents issues like wellbore collapse and bit sticking. Inlet flow rate refers to the speed at which the drilling fluid enters the wellbore through the drill bit and affects the cuttings’ removal efficiency. A sufficient inlet flow rate can effectively remove cuttings from the wellbore, preventing wellbore blockages and improving drilling efficiency. An inadequate inlet flow rate may lead to cuttings’ accumulation at the bottom of the wellbore, reducing the drilling efficiency and potentially causing sticking. Pump speed refers to the rate at which the drilling fluid is pumped, directly impacting inlet flow rate and bottom hole pressure. Appropriate pump speed ensures an adequate inlet flow rate, maintains the required bottom hole pressure, and improves the drilling efficiency.
Therefore, during on-site drilling operations, various parameters, especially those predicted as important by the model, should be considered comprehensively to ensure a safe and efficient mechanical drilling process. An inadequate parameter configuration can lead to drilling accidents, wellbore collapse, sticking, and other issues, increasing the risks and costs of drilling operations.
A feature importance analysis of the factors influencing the drilling speed in well Kangtan2 is shown in Figure 6. The main factors affecting the drilling speed of this well are the drilling fluid equivalent density, standpipe pressure, viscosity, and drilling pressure, with the drilling fluid equivalent density having a feature importance share of over 0.6, significantly higher than the importance level of well Fu39. Through laboratory experiments on core samples taken at the same depth from both wells, it was found that the reservoir rock permeability in well Kangtong2 is higher. Additionally, according to the log interpretation data, this well has a complex formation pressure system, strong formation heterogeneity, and highly variable geological characteristics. It is influenced by factors such as the presence of argillaceous rocks, burial depth, and tight lithology. As a result, it exhibits a stronger dependence on the drilling fluid equivalent circulation density (ECD).

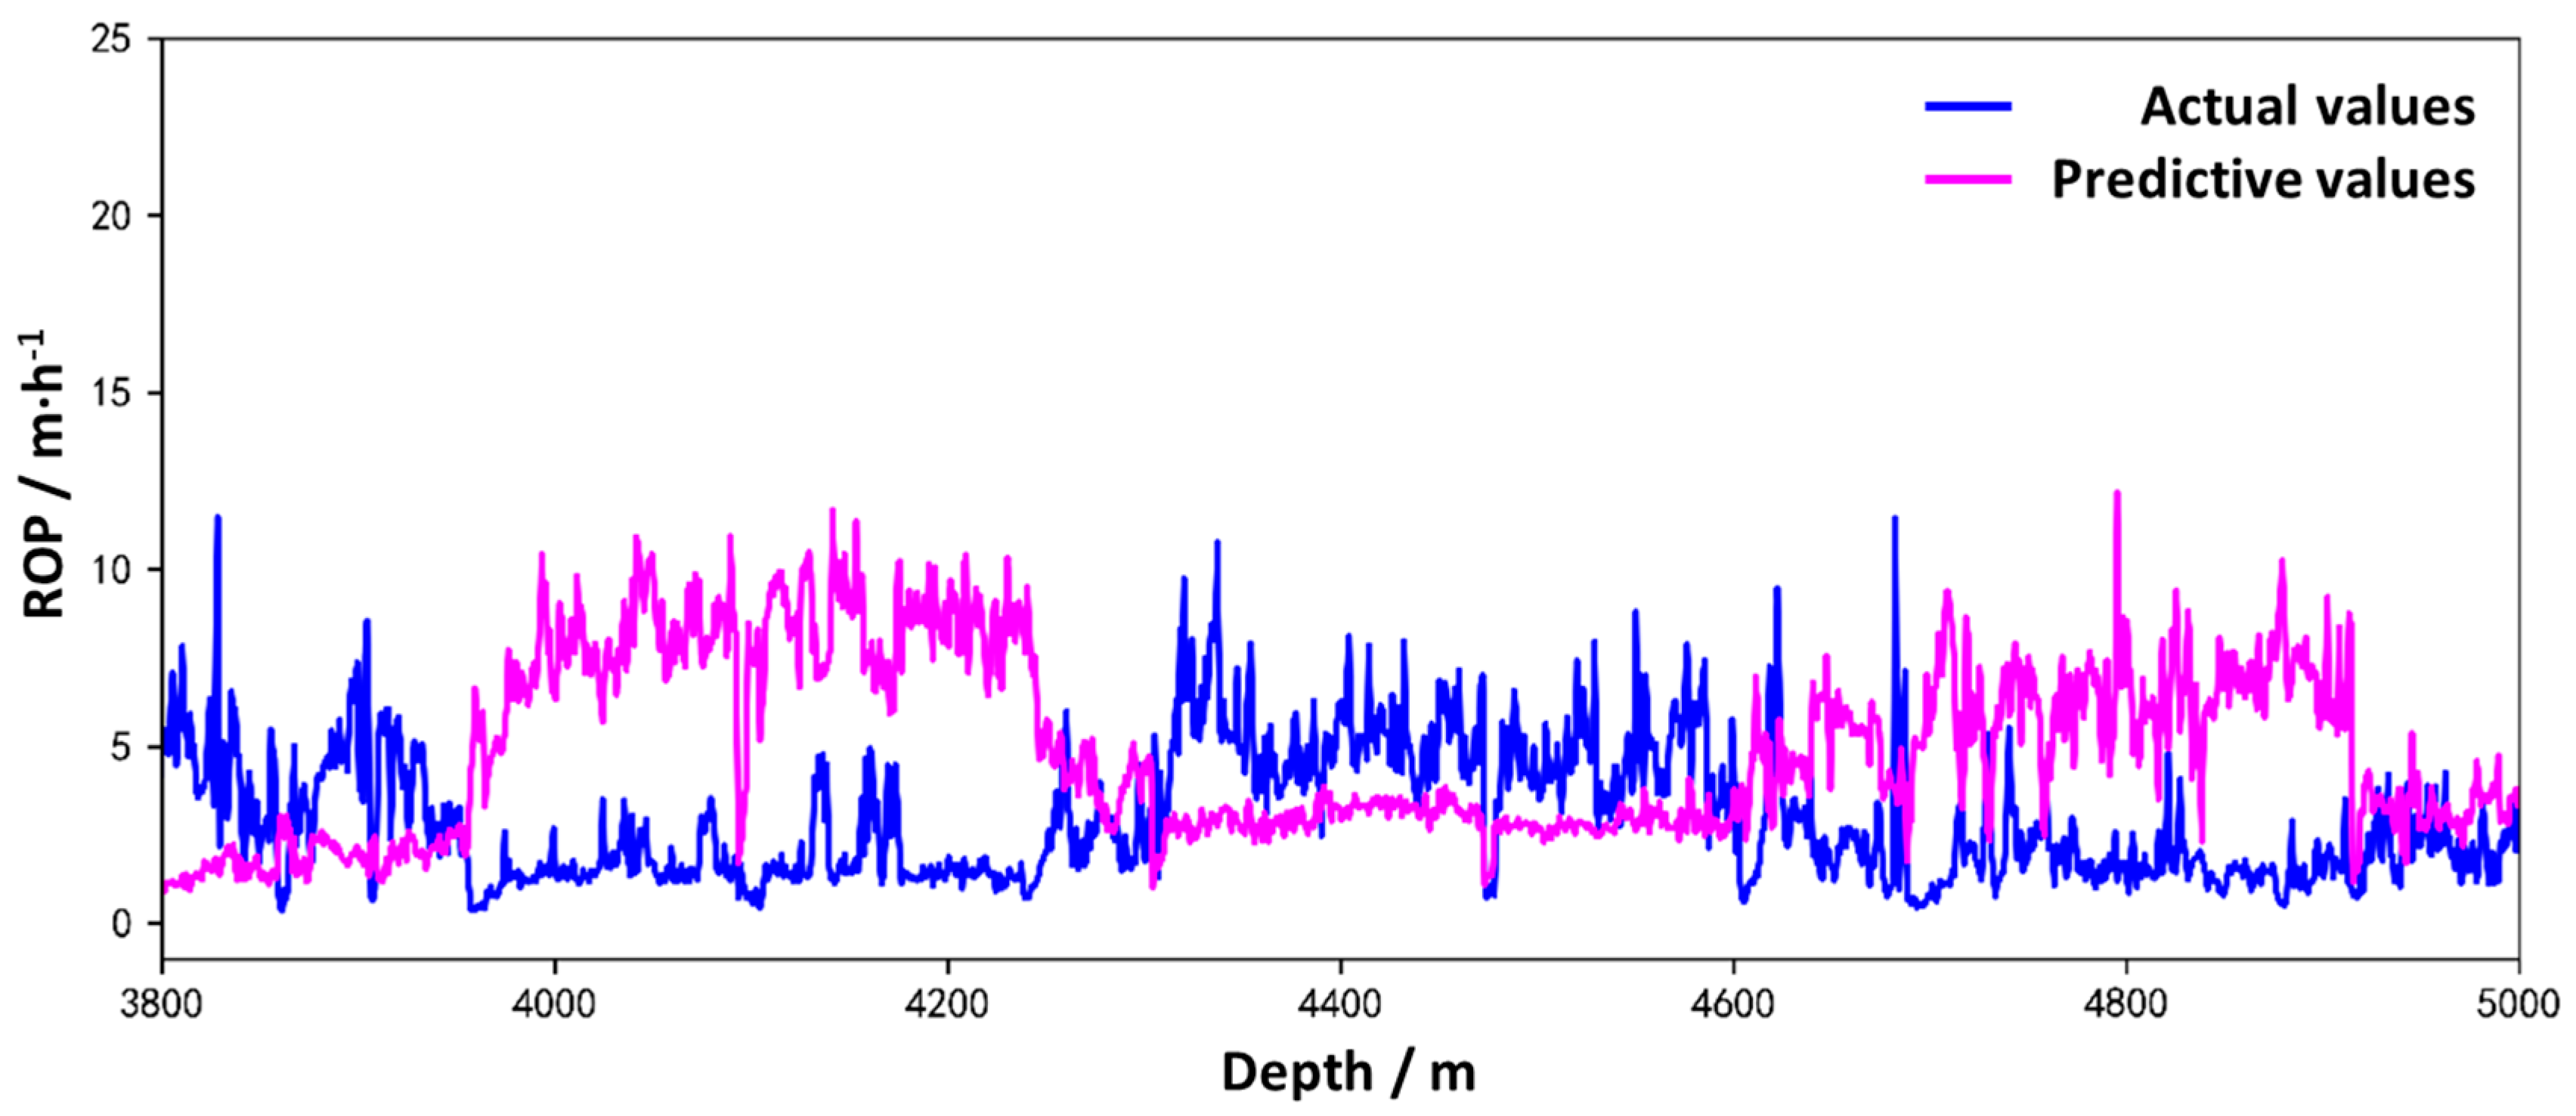
3.3. Prediction Results and Model Performance Evaluation

In this paper, a prediction model was constructed using the random forest regression algorithm. Logging data, including standpipe pressure, torque, drilling pressure, rotary speed, equivalent density, viscosity, inlet flow rate, outlet flow rate, total pump speed, and drilling speed, were used to train the relationship between engineering parameters and ROP.
To visually evaluate the performance of the prediction model, a comparison was made between the predicted ROP and the actual values for the two test wells. Additionally, evaluation metrics were introduced to assess the model’s performance.
The mean squared error (MSE) is a common metric used to measure the goodness of fit of a prediction model [25]. It quantifies the average squared difference between predicted values and the actual values in the dataset. The objective of minimizing MSE is to find model parameters (e.g., in the case of a random forest, the tree structures) that make the MSE as small as possible [26]. This means that the model attempts to find the best parameter combination to minimize the total squared difference between its predicted values and the actual target values. During the training process of the random forest model, the objective function used to minimize the mean squared error (MSE) between the predicted and actual values is set to the MSE itself, resulting in the smallest MSE between the predicted and actual values.
In this paper, the model’s performance was evaluated using the R-squared (R2) value, expressed as follows:
R 2 = 1 i m y ^ i y i i m y ¯ y i
where m represents the number of data points; y i is the actual drilling rate value; y ^ i is the predicted drilling rate value; and y ¯ is the mean drilling rate.
Figure 7 represents the drilling speed prediction results for well Fu39. It can be observed that the predicted ROP closely matches the actual values, and the overall trend is consistent. The R-squared (R2) value reaches 0.94, indicating a good overall prediction performance. Moreover, for the abnormally low-speed sections at well depths of 3950–4300 m and 4700–5000 m, the random forest model is also capable of capturing the unusual ROP trends effectively. This is an achievement that traditional mechanism-driven ROP prediction models cannot accomplish.
The well Kangtan2 is located far away from the other training wells and has a longer test interval, resulting in greater fluctuations in the mechanical drilling rate compared to Well Fu39. The mechanical drilling rate prediction results for Kangtan2 are illustrated in Figure 8. Although there is some deviation between the predicted results and the actual drilling rate in the relatively high-speed interval of 2000–3500 m, the model effectively captured the fluctuation trend of the mechanical drilling rate, yielding an R2 value of 0.83 and demonstrating a good overall prediction performance. This also confirms the strong generalization capability of the data-driven mechanical drilling rate prediction model based on the random forest model.

4. Discussion

In this study, a random forest model was utilized to predict the ROP in the complex subsurface formations of Fukang. The following are some key discussion points:
An analysis was conducted on algorithms such as ELM (extreme learning machine), ANN (artificial neural network), SVR (support vector regression), and LS-SVR (least squares support vector regression) to identify their limitations in predicting ROP. Furthermore, the advantages of machine learning algorithms in predicting ROP in complex deep subsurface formations were explained. These advantages include their suitability for handling large-scale datasets and their capability to capture complex nonlinear relationships between parameters.
Through the mean square error (MSE) evaluation, we validated the performance of the random forest model developed in this study. The evaluation results indicate that the model demonstrates a high accuracy and reliability in predicting ROP.
The importance ranking of features within the model was analyzed. This helps us to understand which subsurface properties play a critical role in predicting ROP. Feature ranking indicates that, in the deep well sections of the Fukang Depression in the eastern Junggar Basin, variables such as the equivalent density, annular pressure, inflow rate, and pump speed may significantly influence ROP. Mechanistic explanations of these important parameters were also provided.
The model’s performance is still constrained by data quality and feature selection. Additionally, geological conditions and drilling operations may vary across different locations and times; thus, the model may need customization to adapt to specific drilling scenarios.
To enhance the accuracy of ROP predictions further, future research can explore the integration of more complex subsurface attributes, including seismic data and core analysis. Moreover, research can focus on developing tailored prediction models for different geological conditions.

5. Conclusions

We established a mechanistic drilling speed prediction model based on the mechanical-specific energy theory. We also explained the limitations of the model in predicting ROP in complex geological formations and pointed out that the model cannot account for the anomalous conditions caused by engineering factors, which makes it unsuitable for deep and complex formations.
We developed a data-driven random forest model, which demonstrated high accuracy and generalization capabilities in drilling speed prediction.
We emphasized the critical role of subsurface properties in ROP and provided valuable insights for future drilling projects.
We further highlighted some limitations of the model, including data quality and geological variability. However, the model provides a valuable tool for optimizing drilling operations, reducing costs, and enhancing safety.

Author Contributions

Methodology, Y.W. and Q.T.; Validation, Y.W. and H.C.; Formal analysis, Y.Z.; Investigation, Q.T.; Data curation, D.W., H.C. and Y.Z.; Writing-original draft, Q.T.; Writing—review & editing, N.H.; Project administration, Y.W.; Funding acquisition, D.W. All authors have read and agreed to the published version of the manuscript.

Funding

This research was funded by “Optimized Fast Drilling and Well Completion Technology and Experiment in Key Areas such as the Southern Margin of Junggar and Mahu” of the Major Science and Technology Special Project of China National Petroleum Corporation (CNPC), Project No.: 2019F-33.

Institutional Review Board Statement

Not applicable.

Informed Consent Statement

Not applicable.

Data Availability Statement

Data are contained within the article.

Conflicts of Interest

Yingjie Wang, Desheng Wu, Hao Chen, and Yuxuan Zhao are employed by the Engineering Technology Research Institute, CNPC Xinjiang Oilfield Branch. The remaining authors declare that the research was conducted in the absence of any commercial or financial relationships that could be construed as a potential conflict of interest. The funders had no role in the design of the study; in the collection, analyses, or interpretation of data; in the writing of the manuscript; or in the decision to publish the results.

Appendix A

To help readers understand the model, the formulas involved in the random forest algorithm are explained below:
Exhaustive search is used to select the split variable and split point when training the CART decision tree. It involves iterating through each feature and its values to find the optimal feature combination. The evaluation criterion for the split variable and split point is represented by the impurity of the resulting nodes, which is the weighted sum of impurities G x i , v i j in each child node. The equation is as follows:
G x i , ν i j = n l e f t N s H X l e f t + n r i g h t N s H X r i g h t
where x i is the variable to be split, and v i j is the corresponding split value. n l e f t , n r i g h t , and N s represent the number of training samples in the left, right, and current child nodes after the split, respectively. X l e f t and X r i g h t are the training sample sets for the left and right child nodes, respectively. H ( X ) denotes a function to measure the impurity of a node.
Different impurity functions are generally used for classification and regression tasks. In this study, the mean squared error (MSE) was used as the impurity function for ROP regression prediction. The calculation formula is as follows:
H ( X m ) = 1 N m i N m y i y ¯ m 2
where y ¯ m is the average value of the target variable for the current node’s samples; and y i is the predicted value for the current node’s samples.
Tree models can also quantify feature importance, which indicates the extent to which a feature influences the prediction results. In a random forest, the importance of a feature is the average importance across all decision trees. In this study, the Gini index was used as the evaluation metric to measure feature importance. The calculation formula is as follows:
G I m = k = 1 , k k K p m k p m k = 1 k = 1 K p m k 2
where G I m represents the Gini index of node m, k represents the number of classes, and p m k represents the proportion of class k in the node.
The importance of the feature X j at node m, as the change in the Gini index before and after branching, is expressed by:
V I M j m Gini = G I m G I l G I r
where V I M j m ( G i n i ) represents the change in the Gini index before and after branching; and G I l and G I r represent the Gini indices of the two new nodes after branching.
Assuming the random forest model has n trees, then:
V I M j G i n i = i = 1 n V I M i j G i n i
where V I M i j ( G i n i ) represents the importance of the feature X j in the i tree; and V I M j ( G i n i ) represents the sum of importance of feature X j over all trees.
After normalizing, the feature importance score can be obtained as shown in the following formula:
V I M j = V I M j i = 1 n V I M i
where V I M j represents the normalized importance score of feature X j across all trees in the random forest model.

References

  1. Han, Z.; Wu, Z.; Lin, Z.; Wang, X.; Jiang, Z.; Ji, H.; Lai, Q.; Hu, H. Control of tectonic uplift and denudation on uranium mineralization in the eastern Junggar Basin. China Coal Soc. 2023, 48, 3471–3482. [Google Scholar] [CrossRef]
  2. Liu, D.; Wang, Y.; Yang, H.; Li, S.; Liu, C.; Han, Y.; Chen, M. Genesis types and distribution of crude oil in Fukang Sag and its peripheral bulges, Junggar Basin. China Pet. Explor. 2023, 28, 94–107. [Google Scholar]
  3. Liu, H.; Zhu, Y.; Liu, L.; Yi, H.; Wang, X.; Du, X. Geological characteristics and exploration potential of shale oil of Permian Lucaogou Formation in hanging wall of Fukang fault zone, Junggar Basin. Lithol. Reserv. 2023, 35, 90–101. [Google Scholar]
  4. Liu, Z.; Zhao, L.; Zeng, Z.; Tian, J.; Li, Z.; Luo, J.; Hu, M. Shale oil accumulation conditions of Permian Lucaogou Formation in Fukang fault zone, Junggar Basin. Lithol. Reserv. 2023, 35, 126–137. [Google Scholar]
  5. Kuang, L.; Zhi, D.; Wang, X.; Li, J.; Liu, G.; He, W.; Ma, D. Oil and gas accumulation assemblages in deep to ultra-deep formations and exploration targets of petroliferous basins in Xinjiang region. China Pet. Explor. 2021, 26, 1–16. [Google Scholar]
  6. Shan, X.; Dou, Y.; Liu, C.; Pan, J.; Guo, H.; Peng, B.; Li, K. Characteristics and Controlling Factors of Deep Tight Sandstone Reservoirs: A Case Study of the Upper Wuerhe Formation in the Fukang Depression, Junggar Basin. Acta Sedimentol. Sin. 2023, 1–18. [Google Scholar] [CrossRef]
  7. Wang, Q.; Liu, C.; Yan, W.; Li, S.; Li, H.; Chen, M.; Li, Z. Characteristics and Development Patterns of Deep-to-Ultra-Deep Reservoirs in the Upper Wuerhe Formation, Zhundong Sag. Nat. Gas Geosci. 2023, 1–22. Available online: http://KNs.cnki.net/kcms/detail/62.1177.TE.20231018.1515.006.html (accessed on 5 November 2023).
  8. Chen, S.; Jiang, Y.; Zhang, J.; Zeng, Y. Research and Application of Fast Drilling Technology in the Fudong Area of the Junggar Basin. Nat. Gas Technol. Econ. 2013, 7, 32–35+78. [Google Scholar] [CrossRef]
  9. Liu, Z. A Method of Improve the Drilling Speed of Hard Formation of Permian in Wuxia Fault Zone. Xinjiang Oil Gas 2020, 16, 12–15+4. [Google Scholar]
  10. Su, Y.; Chen, Y.; Yan, T.; Sun, X.; Wang, L.; Wang, K. Risk prediction of bit balling in gas drilling and its influential factors. Nat. Gas Ind. 2016, 36, 60–65. [Google Scholar]
  11. Jing, N.; Fan, H.; Ji, R.; Zhai, Y.; Liu, T. Data Mining Technology-based Research on the Prediction Method of Deepwell ROP. Pet. Mach. 2012, 40, 17–20. [Google Scholar]
  12. Lin, Y.; Zong, Y.; Liang, Z.; Shi, T.; Li, R. The Developments of ROP Prediction for Oil Drilling. Oil Drill. Technol. 2004, 10–13. [Google Scholar]
  13. Bourgoyne, A.T., Jr.; Young, F.S., Jr. A Multiple Regression Approach to Optimal Drilling and Abnormal Pressure Detection. Soc. Pet. Eng. J. 1974, 14, 371–384. [Google Scholar] [CrossRef]
  14. Rastegar, M.; Hareland, G.; Nygaard, R.; Bashari, A. Optimization of multiple bit runs based on ROP models and cost equation: A new methodology applied for one of the Persian Gulf carbonate fields. In Proceedings of the IADC/SPE Asia Pacific Drilling Technology Conference and Exhibition. OnePetro, Jakarta, Indonesia, 25–27 August 2008. [Google Scholar]
  15. Liu, S.; Yang, J.; Zhou, J.; Tang, H.X.; Wei, H.S.; Li, S.G. Research on relationship between weight-on-bit and drilling rate during jetting drilling in sub-bottom deepwater. Oil Drill. Prod. Technol. 2011, 33, 12–15. [Google Scholar]
  16. Li, C.; Zhao, J.; Yang, C.; Zhang, C.; Xu, S. Novel approach for assessing real-time bit working efficiency. Oil Drill. Technol. 2012, 36, 1–4. [Google Scholar]
  17. Chen, X.; Fan, H.; Guo, B.; Gao, D.; Wei, H.; Ye, Z. Real-Time Prediction and Optimization of Drilling Performance Based on a New Mechanical Specific Energy Model. Arab. J. Sci. Eng. 2014, 39, 8221–8231. [Google Scholar] [CrossRef]
  18. Soares, C.; Daigle, H.; Gray, K. Evaluation of PDC bit ROP models and the effect of rock strength on model coefficients. J. Nat. Gas Sci. Eng. 2016, 34, 1225–1236. [Google Scholar] [CrossRef]
  19. Amer, M.M.; Dahab, A.S.; El-Sayed, A.A.H. An ROP Predictive Model in Nile Delta Area Using Artificial Neural Networks. In Proceedings of the SPE Kingdom of Saudi Arabia Annual Technical Symposium and Exhibition, Dammam, Saudi Arabia, 24–27 April 2017. [Google Scholar]
  20. Shi, X.; Liu, G.; Gong, X.; Zhang, J.; Wang, J.; Zhang, H. An Efficient Approach for Real-Time Prediction of Rate of Penetration in Offshore Drilling. Math. Probl. Eng. 2016, 2016, 3575380. [Google Scholar] [CrossRef]
  21. Z, Y.; Sun, T.; Yang, J.; Li, Y.; Huang, Y.; Yan, Y. Offshore drilling machinery drilling speed monitoring and real-time optimization based on extreme learning machine. China Offshore Oil Gas 2019, 31, 138–142. [Google Scholar]
  22. Ahmed, O.S.; Adeniran, A.A.; Ariffin, S. Computational intelligence-based prediction of drilling rate of penetration: A comparative study. J. Pet. Sci. Eng. 2018, 172, 1–12. [Google Scholar] [CrossRef]
  23. Teale, R. The concept of specific energy in rock drilling. Int. J. Rock Mech. Min. Sci. 1965, 2, 57–63. [Google Scholar] [CrossRef]
  24. Chen, X.; Fan, H.; Gao, D.; Guo, B.; Peng, Q.; Liu, J.; Wang, E. Mechanical specific energy theory and its application in drilling engineering. Drill. Process 2015, 38, 6–10. [Google Scholar]
  25. Chicco, D.; Warrens, M.J.; Jurman, G. The coefficient of determination R-squared is more informative than SMAPE, MAE, MAPE, MSE and RMSE in regression analysis evaluation. PeerJ Comput. Sci. 2021, 7, e623. [Google Scholar] [CrossRef] [PubMed]
  26. Tofallis, C. A better measure of relative prediction accuracy for model selection and model estimation. J. Oper. Res. Soc. 2015, 66, 1352–1362. [Google Scholar] [CrossRef]
Figure 1. Schematic diagram of WOB, MSE, and ROP.
Applsci 13 12471 g001
Figure 2. ROP prediction results of well Fu39 based on the mechanical-specific energy model.
Applsci 13 12471 g002
Figure 3. Random Forest model structure diagram.
Applsci 13 12471 g003
Figure 4. Correlation matrix diagram between the drilling parameters.
Applsci 13 12471 g004
Figure 5. Importance ranking of features affecting ROP in well Fu39.
Applsci 13 12471 g005
Figure 6. Importance ranking of features affecting ROP in well Kangtan2.
Applsci 13 12471 g006
Figure 7. ROP prediction results of well Fu39 based on random forest (R2 = 0.94).
Applsci 13 12471 g007
Figure 8. ROP prediction results of well Kangtan2 based on random forest (R2 = 0.83).
Applsci 13 12471 g008
Table 1. Fundamental statistical description for the dataset.
CountMeanStdMinMax
SPP/MPa50,00022.56802.950711.1825.64
Torque/KN·m50,0007.24732.73844.1820.51
WOB/KN50,00050.705326.311410201
RPM50,000109.653537.356746185
ECD/g·cm−350,0001.46580.14571.031.82
Viscosity/s50,00088.304822.363012152
INF/L·s−150,00047.27384.734024.7458.26
OUTF/L·s−150,00039.44095.959922.7956.45
Pump Speed50,000133.812336.342668192
ROP/m·s−150,00019.133016.24760.37130.43
Disclaimer/Publisher’s Note: The statements, opinions and data contained in all publications are solely those of the individual author(s) and contributor(s) and not of MDPI and/or the editor(s). MDPI and/or the editor(s) disclaim responsibility for any injury to people or property resulting from any ideas, methods, instructions or products referred to in the content.

