Article

Study on Catastrophe Information Characteristics of Strain-Structural Plane Slip Rockburst in Deep Tunnels

1
School of Civil Engineering, Henan Polytechnic University, Jiaozuo 454003, China
2
School of Highway, Chang’an University, Xi’an 710064, China
3
Key Laboratory of Ministry of Education on Safe Mining of Deep Metal Mines, Northeastern University, Shenyang 110819, China
*
Author to whom correspondence should be addressed.
Appl. Sci. 2023, 13(22), 12396; https://doi.org/10.3390/app132212396
Submission received: 19 October 2023 / Revised: 10 November 2023 / Accepted: 13 November 2023 / Published: 16 November 2023
(This article belongs to the Special Issue Future Trends in Tunnel and Underground Engineering)

Abstract

:
Rigid structural planes encountered during construction have an obvious influence on rockburst intensity and occurrence mechanism. The high-intensity rockburst induced by the structural plane poses a great threat to the safety construction of the tunnel. A novel 3D discrete element numerical analysis method for rockburst is proposed with the help of the bonded block model and multi-parameter rockburst energy index. According to this method, the influence of multivariate information characteristics such as stress, energy, fracture, and rockburst proneness index on the surrounding rock during the strain-structural plane slip rockburst in deep tunnels is systematically investigated. The results are drawn as follows: The results show that from the analysis of multivariate information characteristics of strain-structural plane slip rockburst, the rock between the plane and tunnel is a typical rockburst risk area. The dip angle, length, and relative distance of the structural plane have a significant influence on the multivariate catastrophe information characteristics of the surrounding rock: As the dip angle increases, the fracture propagation range within the risk rock expands, but the rockburst intensity and the occurrence range gradually decrease; as the length increases, the fracture propagation range, rockburst intensity and occurrence range within the risk rock increase slightly; as the relative distance increases, the fracture propagation range and rockburst intensity gradually weaken, and the occurrence range of rockburst first increases and then decreases. Using the “11.28” strain-structural plane slip rockburst case as a basis, engineering validation research was conducted. The simulation results are found to be essentially consistent with the rockburst condition on the field, validating the rationality and applicability of the novel rockburst analysis method proposed in this paper.

1. Introduction

The presence of structural plane or other defects in deep rock mass is an unavoidable and complex heterogeneity medium. Their random distribution has an obvious deteriorating impact on the rock’s mechanical behavior and greatly impacts the tunnel’s surrounding rock stability [1,2,3,4]. As the construction depth increases, along with the geological environment and construction characteristics by three “high” and one “disturbance”, a large amount of strain energy accumulates in deep hard rock, providing the essential condition for the rockburst occurrence [5]. The existence of rigid structural planes with different scales is likely to induce extremely intense rockbursts, and the structural plane effect plays a critical part in the rockburst catastrophe [6,7,8]. Therefore, revealing the rockburst catastrophic mechanism induced by tunnel excavation with rigid structural planes is of great engineering significance for the safe and normal construction of deep tunnels.
Currently, rockburst can be categorized into strain-type rockburst, structural-slip rockburst, and strain-structural plane slip rockburst according to the occurrence mechanism, in which the strain-structural plane slip rockburst is mainly controlled by factors such as rigid structural plane and high ground stress [9]. According to the rock lithology and the stress state during the strain-structural plane slip rockburst in engineering sites, numerous scholars have conducted a series of laboratory tests with different rock samples, loading paths, and boundary conditions, and they have explored the catastrophic process and influencing factors of this type of rockburst. Ratan Das et al. [10] carried out strain-structural plane rockburst tests on fissured sandstone under uniaxial compression to analyze the fissure propagation pattern and rockburst prediction. Cheng et al. [11] studied the effect of rigid structural planes on rockbursts under biaxial compression, they analyzed the rockburst evolution process and its microscopic characteristics. Gong et al. [12] carried out rockburst tests of granite with different fissure angles under true triaxial single-sided unloading, and they discussed the occurrence mechanism of rockburst from the mechanical properties and energy evolution characteristics. The above studies have revealed the disaster-causing mechanism of this rockburst type from the experimental view. Considering the difficulty in prefabricating the structural plane within the sample, the difficulty in controlling structural plane parameters, and the difficulty in reproducing the catastrophic process of this rockburst type during loading, scholars have explored the structural plane effect on rockburst from the engineering scale combined with the numerical methods. Manouchehrian et al. [13] used the Abaqus2D code to study the structural plane effect on the occurrence and damage of rockburst, they found that if the location and orientation of the structural plane increase the stress or decrease the system stiffness, rockburst may be induced. Combining the finite element method, Feng et al. [14] conducted a numerical study on the failure characteristics and mechanism of a deep hard rock cavern under the influence of structural planes. Moreover, Rock failure is a gradual process from continuous to discontinuous discrete coupling, and more scholars have begun to use the discrete element method or the finite-discrete element coupling method to conduct in-depth research on the geotechnical engineering and tunnel failure mechanism [15]. Yi et al. [16] analyzed the progressive face failure of a shield tunnel with the coupled discrete element and finite difference method. Zhou et al. [17] used GDEM to study the influence of the number and scale of the vertical structural plane on the mechanical motion characteristics of the surrounding rock and revealed the evolution mechanism of structural plane rockburst. Numerical simulation has been widely used to analyze the structural plane effect on rockburst catastrophe characteristics. Previous studies mainly focused on one physical field information, such as displacement, stress, or energy, and lacked a comparative study on the surrounding rock response characteristics of multivariate catastrophic information during rockburst. This study mainly used the 3D discrete element numerical analysis method; compared with the single finite element method, the 3D discrete element method can more truly simulate the discontinuous deformation behavior of rock mass such as fracture propagation and rock ejection during rockburst.
A novel 3D discrete element rockburst numerical analysis method is proposed using the bonded block model and multi-parameter rockburst energy index. This method numerically reproduces the features of the strain-structural plane slip rockburst and compares and analyzes the mechanical response characteristics of multivariate catastrophe information such as stress, energy, fracture, and rockburst proneness index within the surrounding rock during rockburst with the variation of structural plane geometric parameters, which has been successfully applied to the case of strain-structural plane slip rockburst during the tunnel construction at the Jinping II hydropower station. Research results can provide a relevant reference basis for revealing the mechanism of this rockburst type, risk prediction, prevention, and control for rockburst research.

2. A Novel 3D Discrete Element Numerical Analysis Method for Rockburst

2.1. Shortcomings of Previous Rockburst Analysis Methods

The occurrence of rockbursts is extremely complex and affected by many factors. It is difficult to use mathematical analysis methods to simply analyze its inoculation mechanism and catastrophic process. In contrast, numerical methods have become a powerful tool for studying rock mechanical behaviors in recent years, and the numerical simulation of the rockburst catastrophic process can effectively reveal its disaster-causing mechanism. Considering that there are a large number of micro cracks and other defects in the rock itself, the characteristics of the rock mass are mainly characterized by structural discontinuity due to the cutting effect of cracks and joints. Therefore, numerical methods based on discontinuous medium mechanics have been widely applied [18]. Currently, scholars usually use the discrete element method (DEM) to simulate the rockburst ejection characteristics. The discrete element block can produce displacement, rotation, and even complete separation under the action of external force and can accurately recognize the new contacts generated in numerical simulations. Block discrete element code (3DEC) is part of the DEM, and the shape of the polygonal block in 3DEC is closer to the engineering rock mass. The computational region is discretized into blocks by intersecting discontinuous surfaces, and each block is divided into a mesh by the finite element method. The mechanical motion characteristics of each element can better simulate the rock failure characteristic and more truly reflect the mechanical response of discrete medium under dynamic and static loads during rockburst.
Based on the cognition of the rockburst mechanism and the gradual maturity of numerical simulation, some scholars have conducted numerical simulation research on rockburst risk evaluation in combination with the rockburst discriminant index. The quantitative relationship between rockburst risk parameters (such as rockburst location and intensity grade) and numerical indexes is established, which can consider the influence of parameters such as strength–stress ratio, energy ratio, and critical buried depth [19,20]. By analyzing the distribution range of the rockburst index in numerical space, the location and damage depth of the rockburst can be effectively determined. Summarizing the previous rockburst indexes, most of the existing indexes only consider the three-way compression state of the rock mass, ignoring the possible two-way compression and one-way tension state, which cannot truly reflect the stress state of the rock unit before and after excavation. With the further revelation of the rockburst mechanism, the increase in engineering practice, and the in-depth development of numerical research, the research about the rockburst index gradually shows a significant trend from the single index to the composite multi-parameter index.

2.2. Multi-Parameter Rockburst Proneness Index Based on Energy Theory

Based on the shortcomings of the above-mentioned rockburst index, considering that rock failure is a coupling process of energy from accumulation to dissipation and release, the analysis from the energy perspective can more truly reflect the rockburst essence. According to the overall element failure criterion proposed by Xie et al. [21], the ratio relationship between the internally accumulated releasable strain energy Ue and the critical surface energy U0 required for rock failure can be obtained when the rock undergoes overall failure under tensile and compressive stress states. The expression is as follows [22]:
U e U 0 = ( σ 1 σ 3 ) 2 E 0 U e σ c 3 ( σ 3 0 ) U e U 0 = σ 3 2 E 0 U e σ t 3 ( σ 3 < 0 )
where σc and σt are the compressive and tensile strength of rock, respectively, and σ1 and σ3 are the maximum and minimum principal stress, respectively. E0 is the initial elastic modulus, and Ue is the storage elastic strain energy. The expression is shown in Equation (2), and U0 is the ultimate elastic strain energy.
U e = 1 2 E 0 σ 1 2 + σ 2 2 + σ 3 2 2 v σ 1 σ 2 + σ 2 σ 3 + σ 1 σ 3
where σ2 is the intermediate principal stress, and v is the Poisson’s ratio.
Based on this, Zhang et al. considered the importance factor of rock brittleness on rockburst and proposed the multi-parameter rockburst energy index Crs (Criterion of rockburst) [23] under different stress states. The expression is as follows:
C r s = σ c σ t U e U 0
where σc/σt represents the brittleness coefficient, and Ue/U0 is the energy storage factor.
This index eliminates the one-sidedness using energy or brittleness index alone to judge rockburst (the larger the Ue/U0 and σc/σt, the greater the rockburst proneness). Combined with the boundary value division of the rockburst index given by Jiang et al. [24], the probability that the boundary index of different factors reaches the maximum value at the same time is small. For the convenience of practical application, the intensity classification of the index Crs is shown in Table 1.

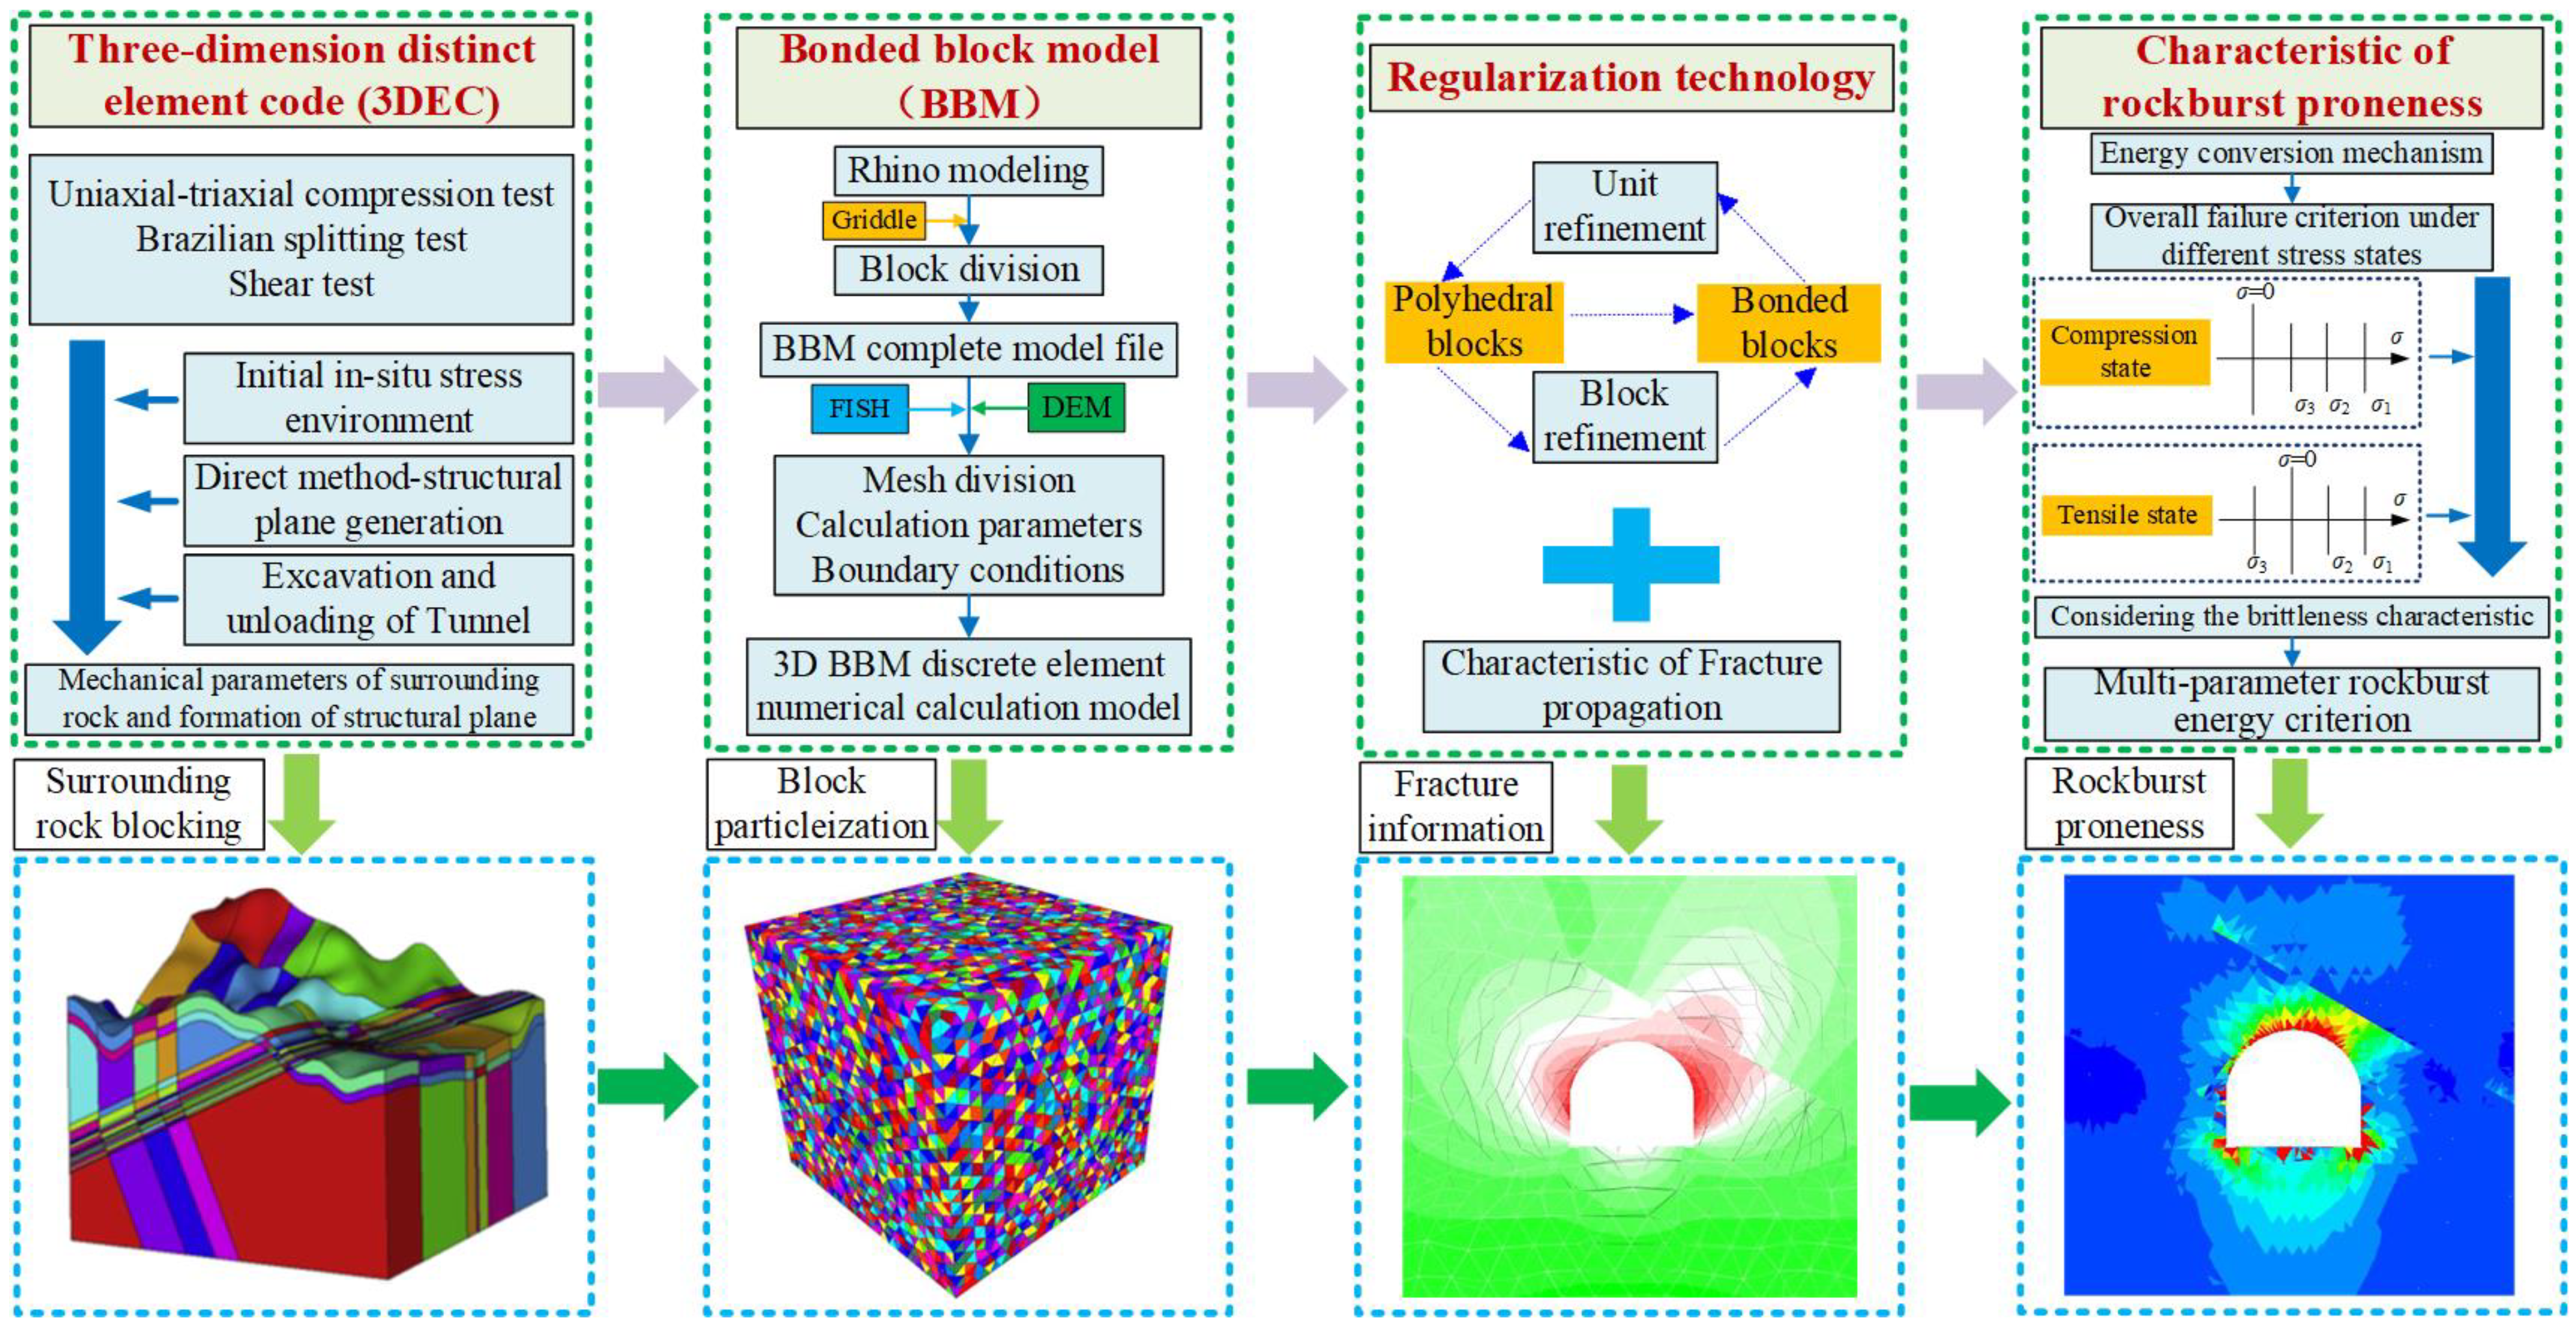
2.3. Rockburst Simulation Analysis Method Based on the Bonded Block Model and Energy Index

The Bonded block model (BBM) is a 3D block model developed based on 3DEC [25]. The numerical model is established by Rhino, and the surface mesh and volume mesh are divided by the Griddle plug-in. In the Griddle plug-in, the Gint command can automatically generate interactive mesh, while the Gsurf command is used to re-divide the selected surface mesh into the required block size and type. The surface mesh is further used as input data to the Gvol command for volume subdivision, which can fill tetrahedral blocks to generate a file format for 3DEC. Through the ‘‘Rhino-Griddle-3DEC’’ numerical modeling method, the BBM complete model file is output and directly imported into numerical code. Then, the gen edge command can be used for secondary meshing in 3DEC. The above meshing principle can effectively adjust the quality and size of the mesh, and an appropriate meshing can balance the calculation accuracy and calculation efficiency. With the help of the BBM, the connection between the block and micro crack in the model can be well simulated, and the initiation, inoculation, and propagation process of the simulated crack within the rock mass can be realized. BBM block elements can be characterized by polyhedral geometry, such as Voronoi and tetrahedral elements. Each block is interlocking with its surrounding blocks and bonded together through contact points. The contact represents a network of non-perforating and open cracks, and the block itself represents a complete block. The interaction between blocks is transmitted through contact points, which can characterize both the macroscopic mechanical behavior of rock mass and the microscopic characteristics of fracture propagation between blocks accurately. Many scholars have conducted relevant numerical research based on BBM [26,27].
To accurately depict the characteristics of the fracture information and strain-structural plane slip rockburst catastrophe, a novel rockburst numerical analysis method is proposed using the BBM and rockburst index Crs. Affected by factors such as computational efficiency, the block is composed of tetrahedral units, and the technical links of the method are shown in Figure 1. The method solves the shortcomings of traditional direct modeling or FISH modeling, speeds up modeling, and improves computational accuracy. It can not only simulate the fracture of initiation, propagation, and interaction between blocks but also consider the various stress states of the surrounding rock. The visual analysis of the surrounding rock’s multivariate information response, the rockburst intensity and its occurrence range, and the real simulation of the control effect of rigid structure plane on rockburst are realized under a three-dimensional stress state.

3. Numerical Model and Simulation Scheme of the Strain-Structural Plane Slip Rockburst

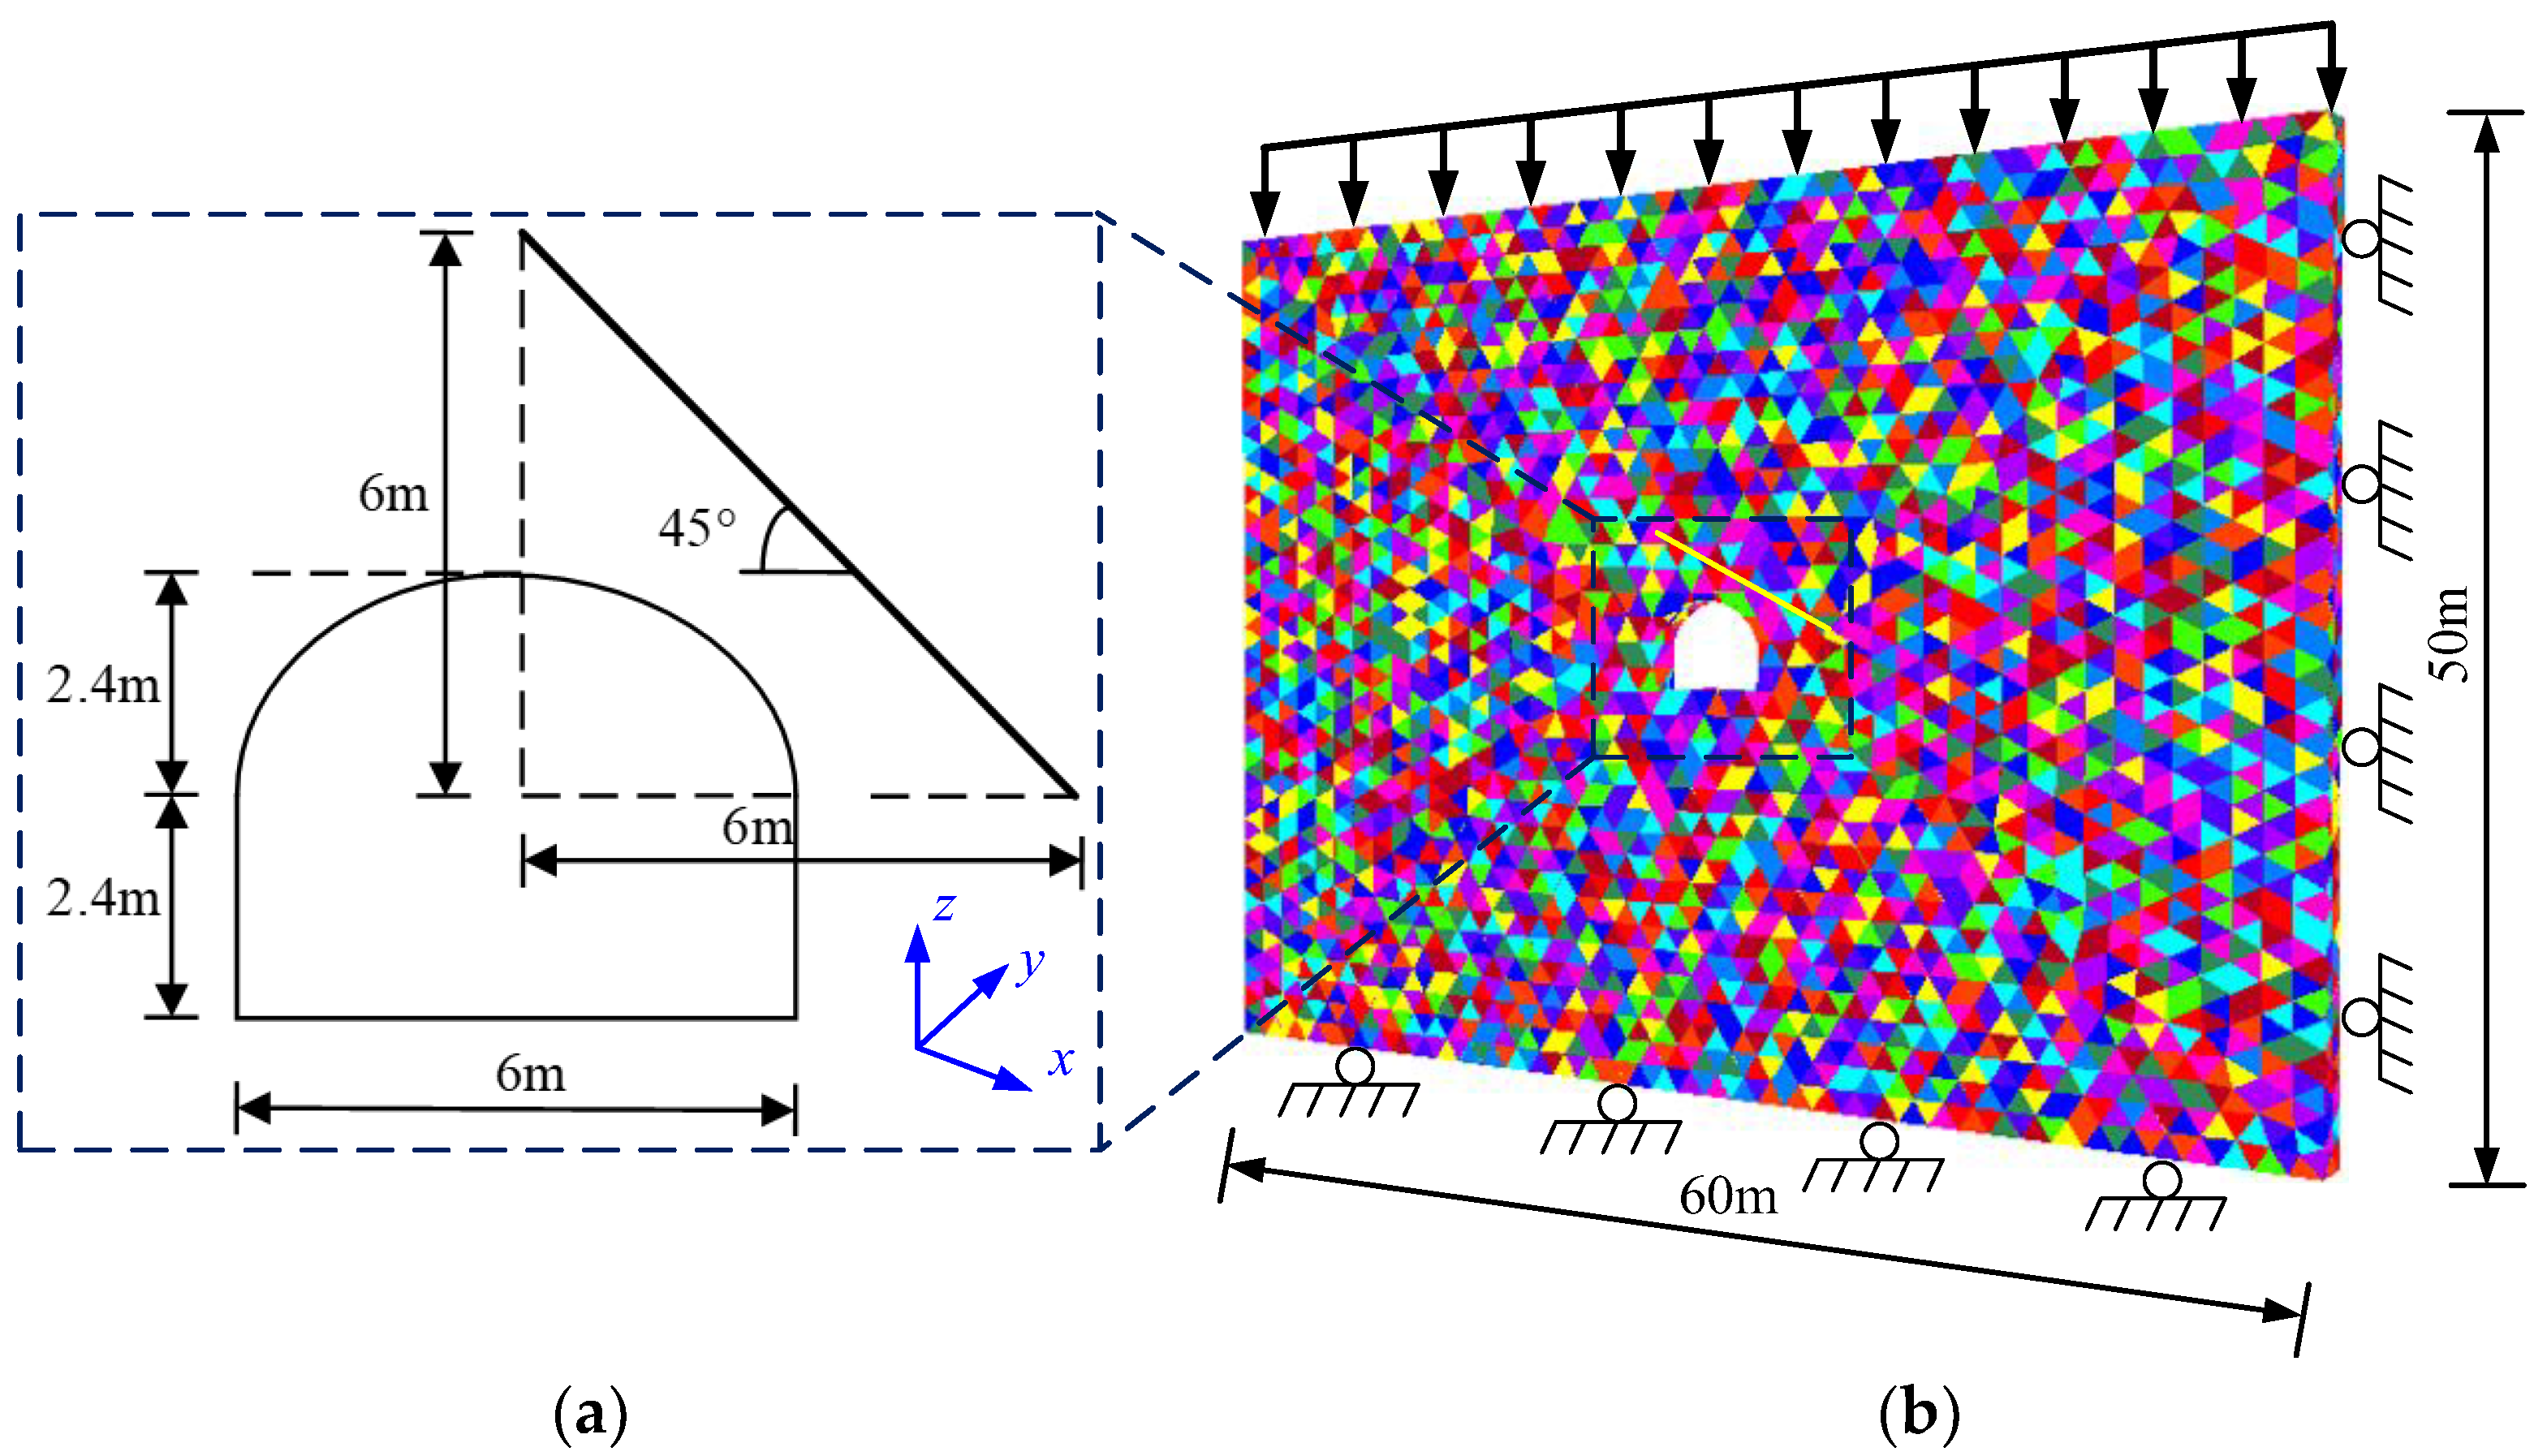
3.1. Numerical Model and Boundary Conditions

Taking a deep tunnel as an example, the tunnel adopts the section form of a straight wall arch, the specific dimensions, and relative positions of the tunnel and structural plane are shown in Figure 2a. To simplify the calculation process, ensure the reliability of the simulation results, and eliminate the boundary effect caused by calculation, we adopted a plane strain model and set its length in the y direction to 2 m. According to the principle of Saint–Venant and the excavation effect, the model width and height are set to be 60 m and 50 m, respectively. Referring to previous studies, the dimension of a model for simulating underground tunnels mainly ranged from 0.1 m to 0.75 m [28,29]. In view of the boundary effect and calculation time of the model, the block size is divided into 0.5 m on average by griddle in Rhino, and the edge length of the block is re-divided into 0.1 m after the modeling in 3DEC. The model is divided into 16,730 blocks, each of which is considered a rock block. The model obtained through Griddle modeling is shown in Figure 2b, where the tunnel model is composed of rock blocks and joints.
The model’s upper boundary and the free surface formed by excavation were free boundaries, and vertical stress was applied to the upper boundary. The remaining boundary conditions were normal displacement constraint boundaries. Assuming the buried depth of the tunnel is 1000 m, both the horizontal stress σH and σh are set to 42.72 MPa, while the vertical stress σv is 28.48 MPa. The initial stress field is applied to the model according to the ratios of σH/σv = 1.5 and σh/σv = 1.5.

3.2. Constitutive Model and Material Mechanical Parameters

The Mohr-Coulomb constitutive model is a yield criterion that can describe the mechanical behavior of hard rock, and the yield function was used as follows [30]:
f s = ( σ 1 σ 3 ) 2 c cos φ ( σ 1 + σ 3 ) sin φ
where c and φ are the cohesion force and friction angle, respectively.
The failure envelope of the criterion corresponds to the shear and tensile stress yield functions, which is a flow rule related to tensile failure. When fs < 0, the rock shear failure occurs. To truly reflect the stress state of surrounding rock and the interaction of contact between blocks, the Mohr-Coulomb model is adopted for surrounding rock mass (change Cons = 2), and the Coulomb-slip model is adopted for virtual joints and structural plane (change Jcons = 1). In a 3DEC-BBM model, the mechanical properties of the blocks and contacts need to be calibrated so that the blocks can represent the actual mechanical behavior of a given rock. This study adopted a “trial-and-error method” for calibrating the rock mechanical parameters [31]: The rock mechanical parameters are directly obtained from the laboratory test results in the research report from the research group. The numerical simulations are conducted, and the input parameters are varied until the mechanical behavior of the numerical simulation closely matches the data from the laboratory test. The fictitious contact parameters are derived based on the laboratory test data and the empirical formula, and the real joint-like structural plane’s contact parameters are set according to the previous study [32]. The rock calculation parameters and contact parameters are shown in Table 2 and Table 3, respectively.

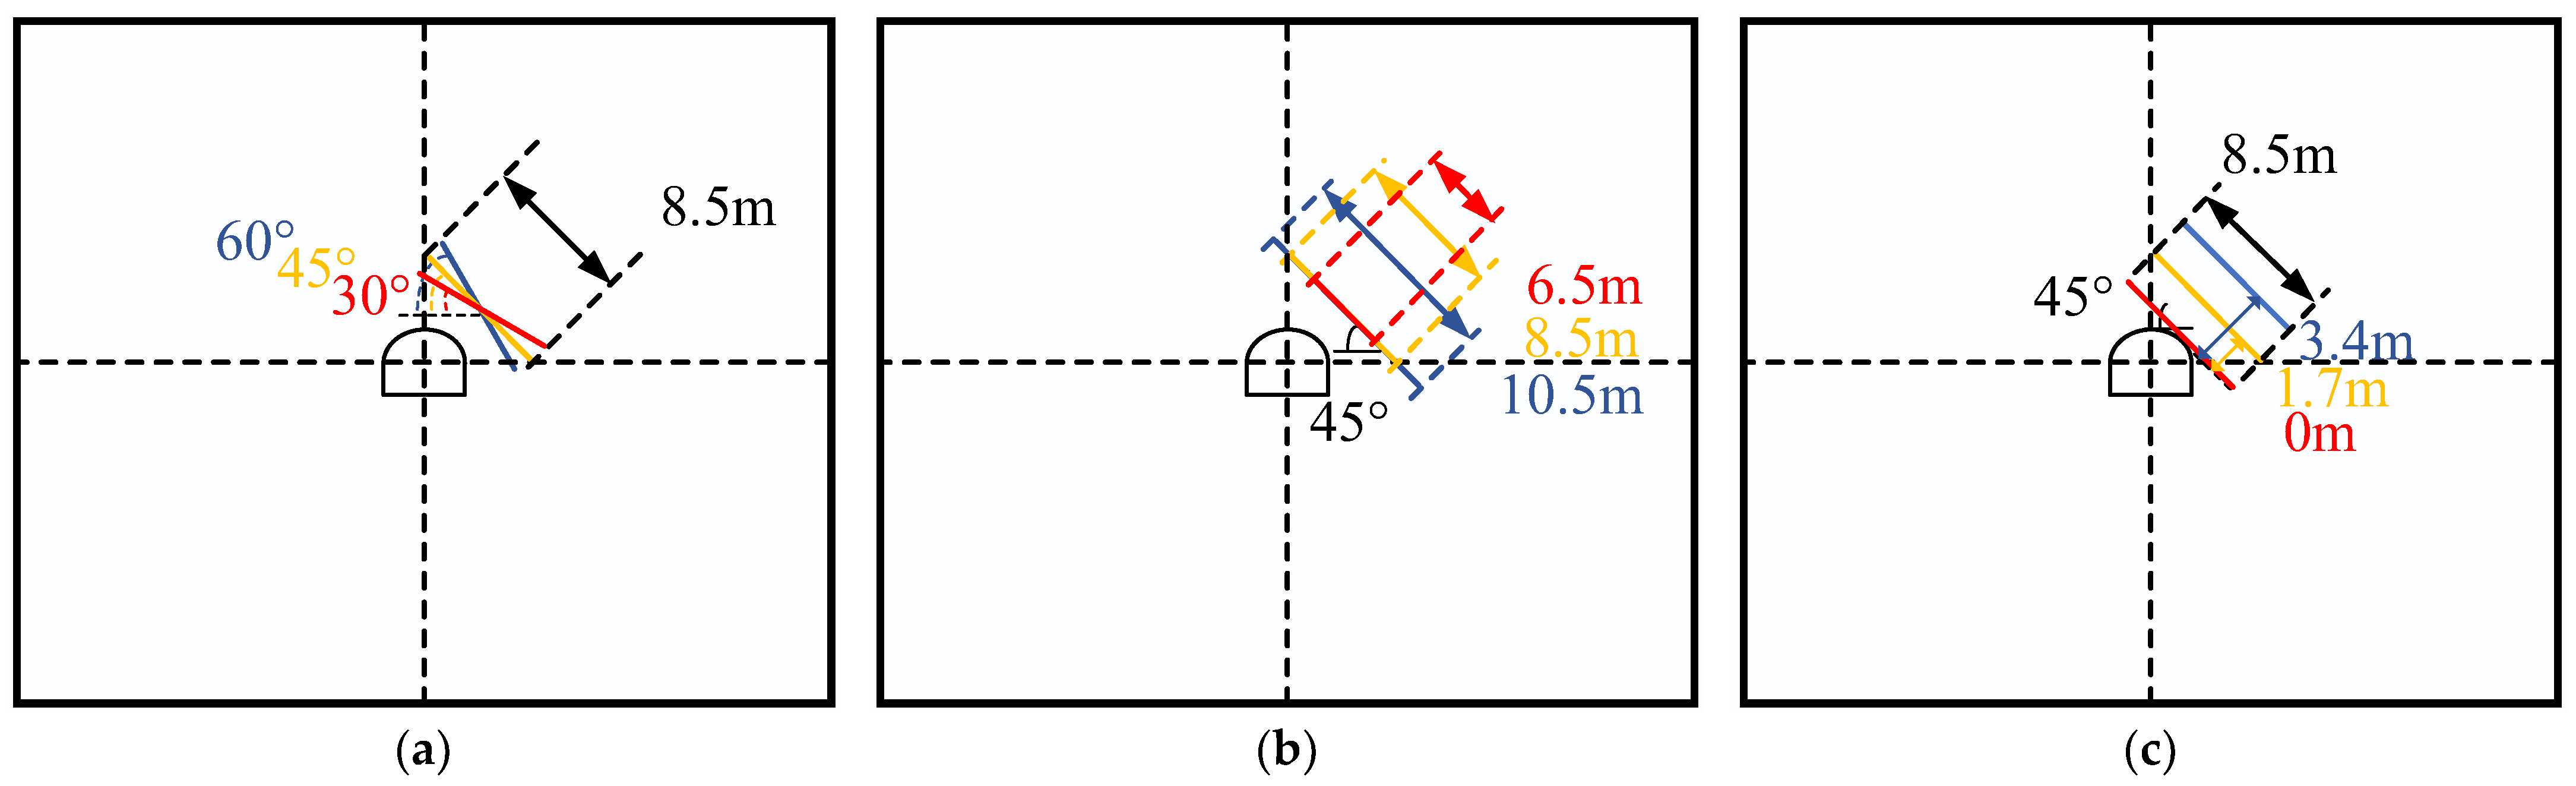
3.3. Numerical Simulation Scheme

To explore the influence of the structural plane geometric parameters on the information response characteristics of the surrounding rock, three working conditions are set up. The structural plane in Figure 2 is taken as a reference, and the geometric parameters are adjusted on this basis. The length and relative distance of the structural plane are fixed. Taking the center point of the structural plane as the horizontal line, the angle is set to be 30°, 45°, and 60°, respectively. The angle and relative distance of the structural plane are fixed; the extension lengths of the structural plane to both sides are set at 6.5 m, 8.5 m, and 10.5 m, respectively. The angle and length of the structural plane are fixed. The relative distance between the structural plane and tunnel was set to 0 m, 1.7 m, and 3.4 m, respectively. The specific forms of each condition are shown in Figure 3.
Considering that this paper mainly studied the influence laws of structural plane geometric parameters on the multivariate information field within the surrounding rock during rockburst, the influence of excavation mode, support, and other conditions is not considered. The excavation method is full-section excavation, and no support is carried out after excavation. The multivariate information characteristics of the surrounding rock under different conditions are studied by controlling variables. The simulation scheme is shown in Table 4.

4. Multivariate Catastrophe Information Characteristics of the Strain-Structural Plane Slip Rockburst under Different Conditions

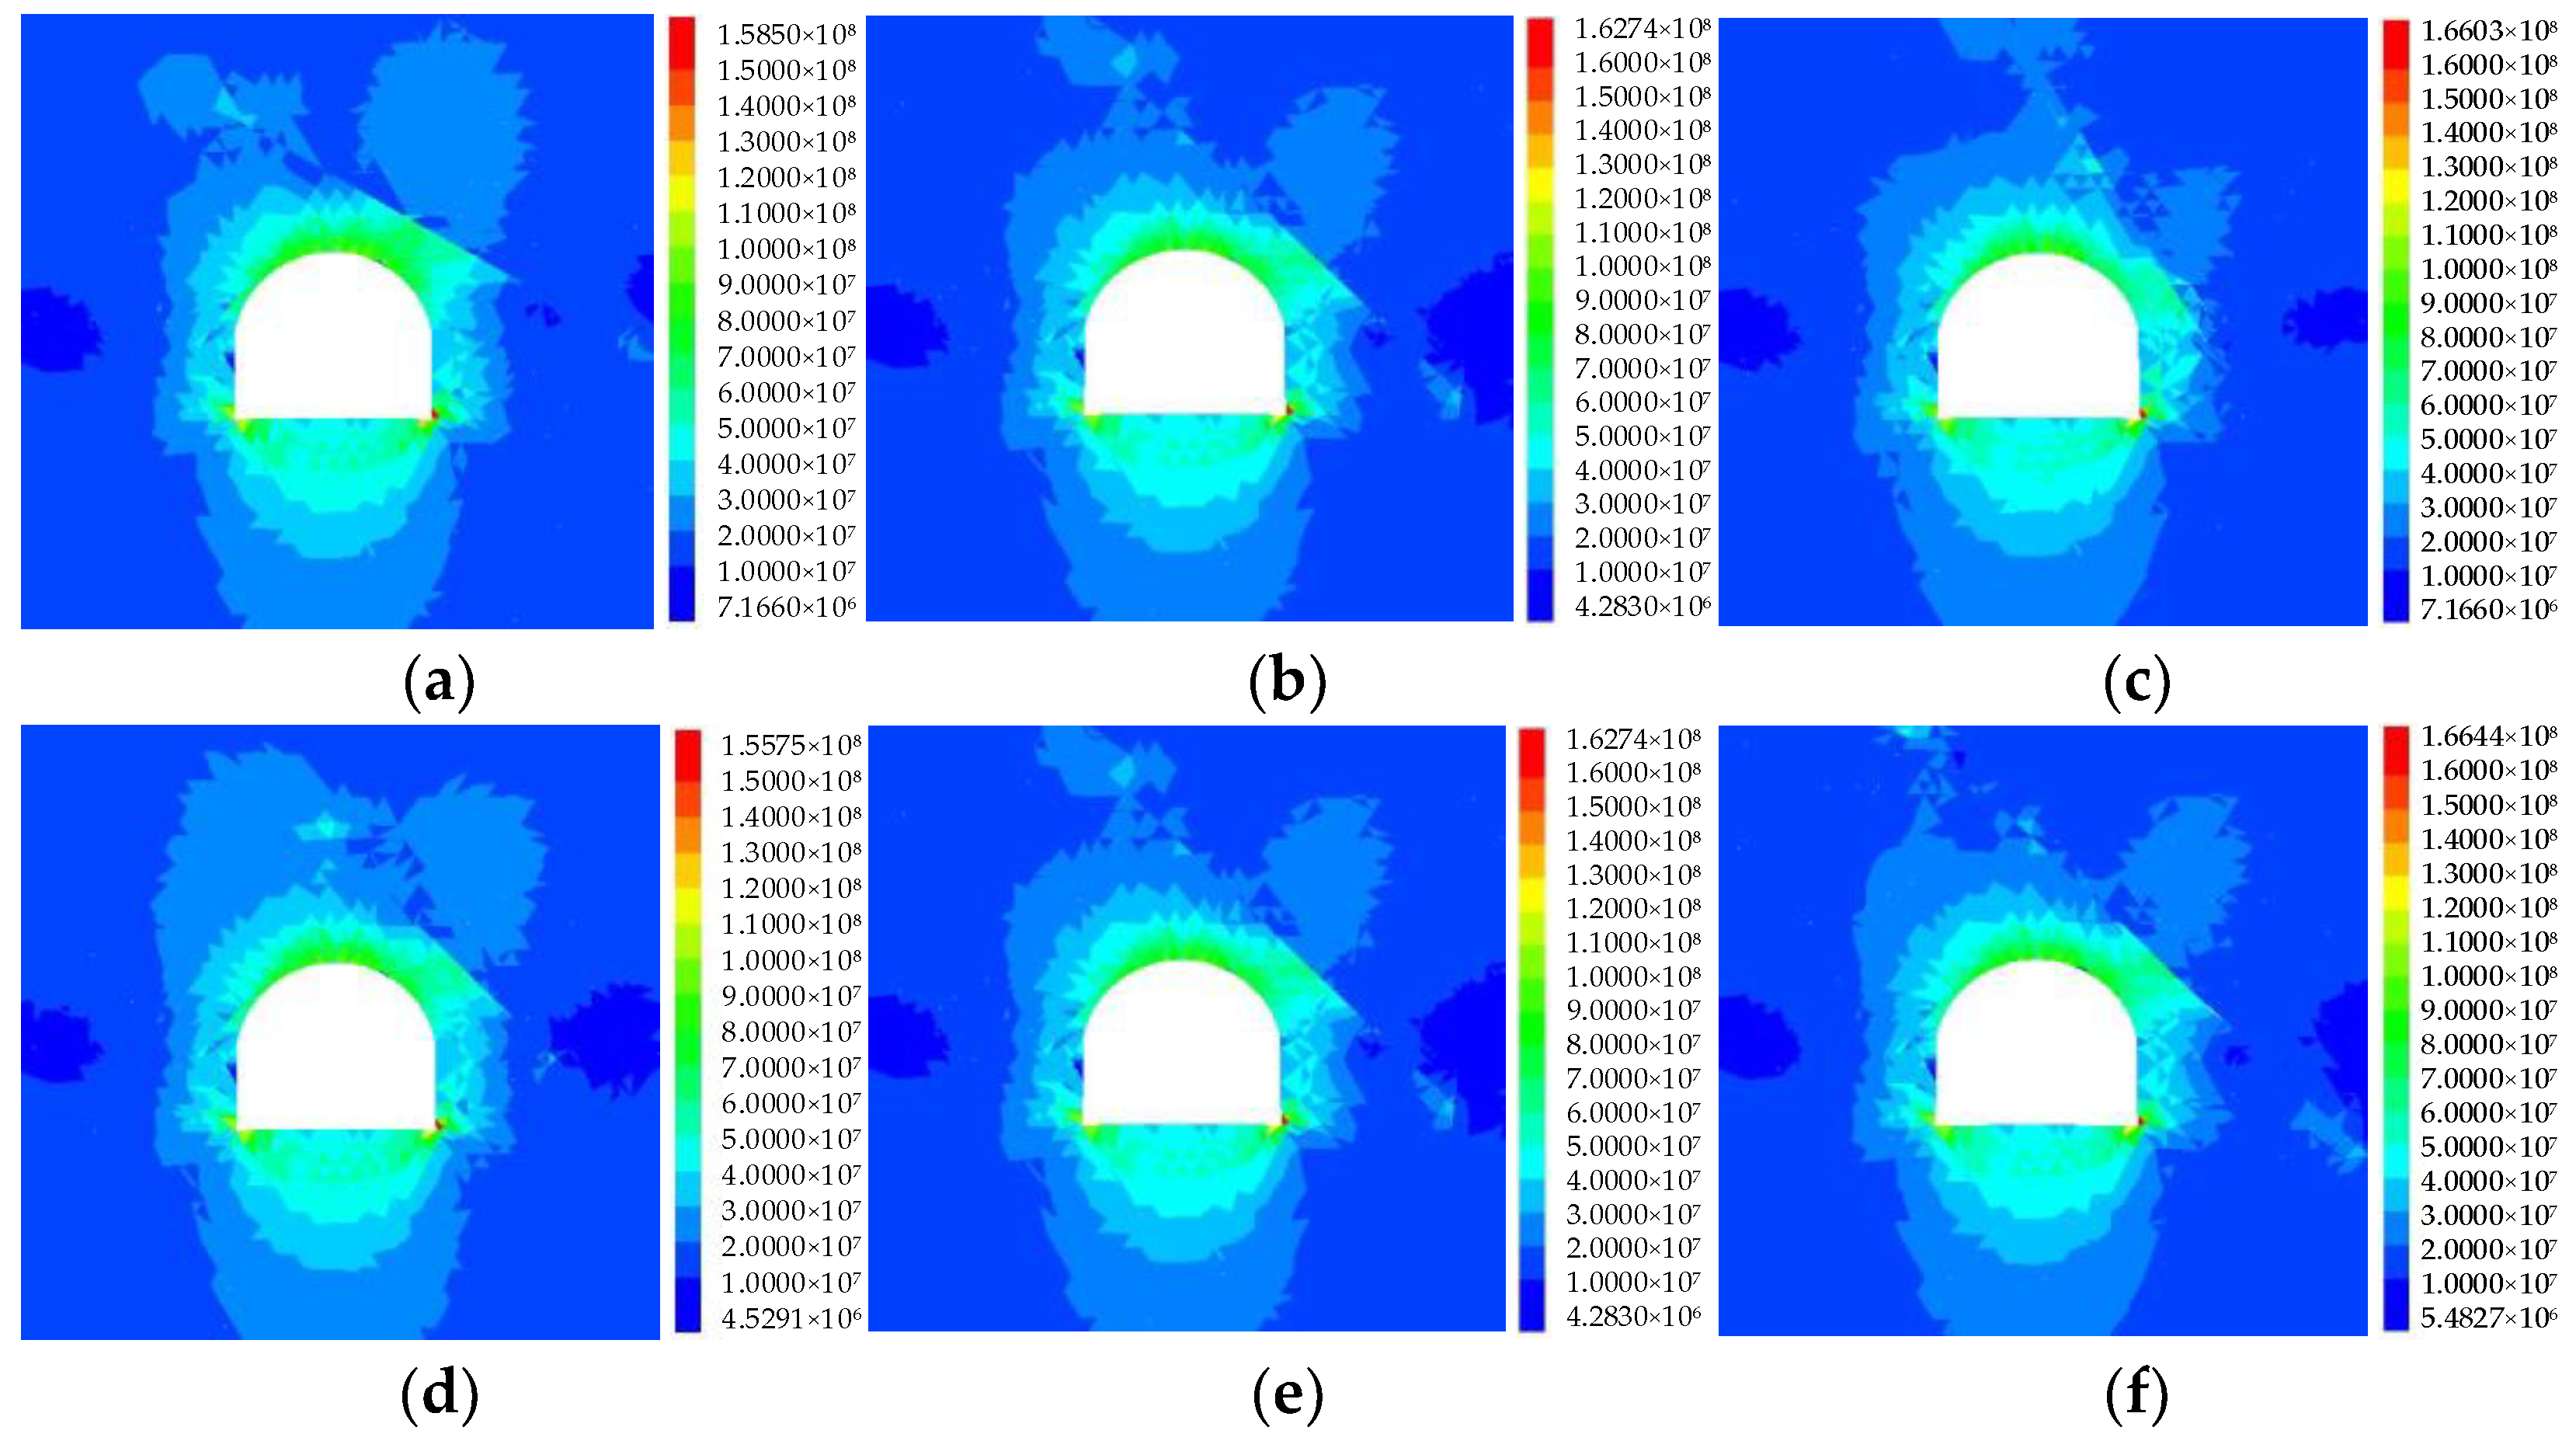
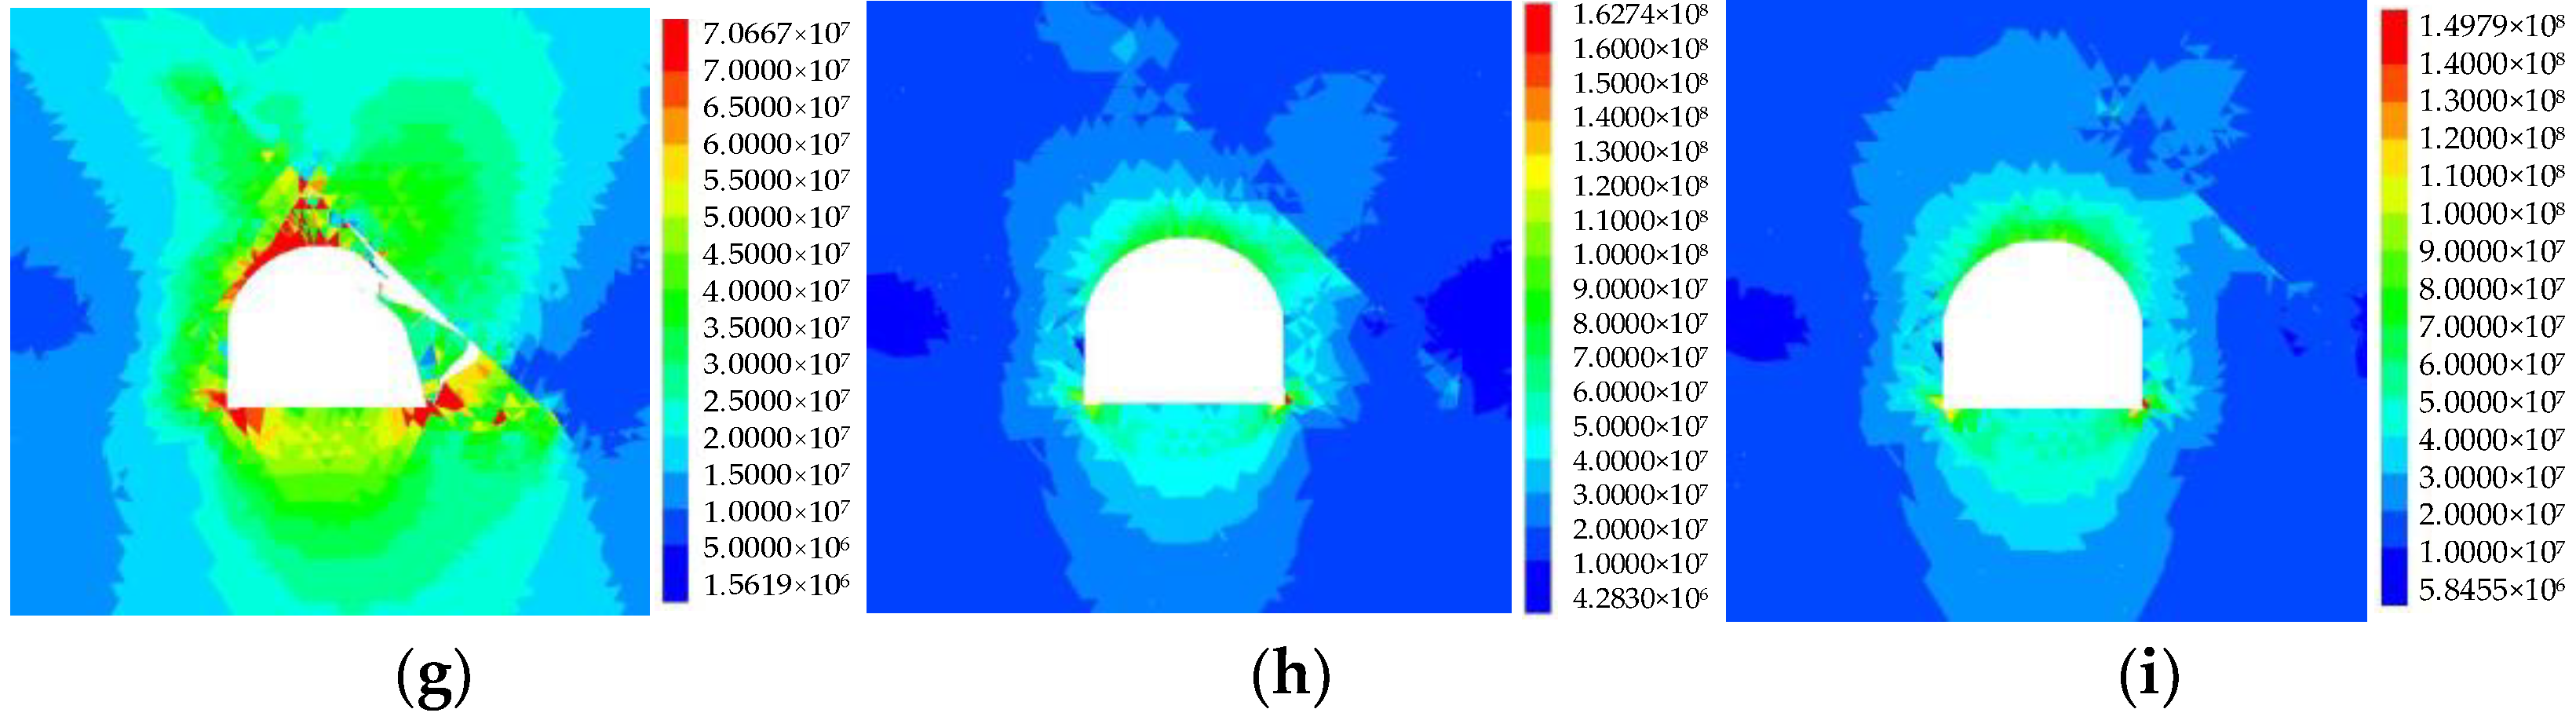
4.1. Characteristics of Stress Information

Figure 4 shows the distribution of the principal stress difference (Δσ = σ1σ3) within the surrounding rock under different conditions. From Figure 4, the larger value of the Δσ is mainly distributed between the structural plane and tunnel, and some blocks exhibit obvious stress concentration at the arch foot. The Δσ distribution shows obvious differences with the variation of the structural plane geometric parameters. The distribution characteristics of the stress field are analyzed under different conditions, and the specific variation laws are as follows.
Observing Figure 4a–c, the effect of θ on the Δσ is reflected in two aspects: On the one hand, θ controls the distribution range of the larger value of Δσ, which gradually decreases as θ increases. The value of Δσ near the structural plane at θ = 60° is only 40~50 MPa; on the other hand, the Δσ distribution above the structural plane is also significantly affected by θ, where the larger value of Δσ above the structural plane likewise decreases as θ increases. Observing Figure 4d–f), when L = 6.5 m, the structural plane has less influence on the Δσ distribution, and the stress field distribution is approximately symmetrical; When L = 8.5 m, the distribution range for the larger value of Δσ extends from structural plane to tunnel wall. When L = 10.5 m, the larger value of Δσ distribution below the structural plane extends further to the top of the right sidewall. As L increases, the stress concentration degree and distribution range of the surrounding rock increase. Observing Figure 4g–i, when D = 0 m, the peak value of Δσ was 70.7 MPa, and the Δσ values between the left spandrel, the vault, and the arch foot on both sides are all larger than 65 MPa, the Δσ value on the right sidewall is relatively small. The degree of stress concentration and distribution range is significantly affected by the structural plane. When D = 1.7 m, the peak value of Δσ is 162.7 MPa, and the larger values of Δσ are located in the vault, both sides of the spandrel and the arch foot, and the distribution range of Δσ on the right spandrel increases gradually. When D = 3.4 m, the peak value of Δσ is 149.8 MPa, and its distribution characteristics are similar to those of D = 1.7 m, the structural plane effect on the stress field is reduced. The peak value of Δσ at D = 0 m is much smaller than that when D is 1.7 m and 3.4 m, which indicates that when there is a certain distance between the structural plane and tunnel, the degree of stress concentration in the surrounding rock is more obvious, but the value of Δσ tends to decrease gradually with the further increase in D.

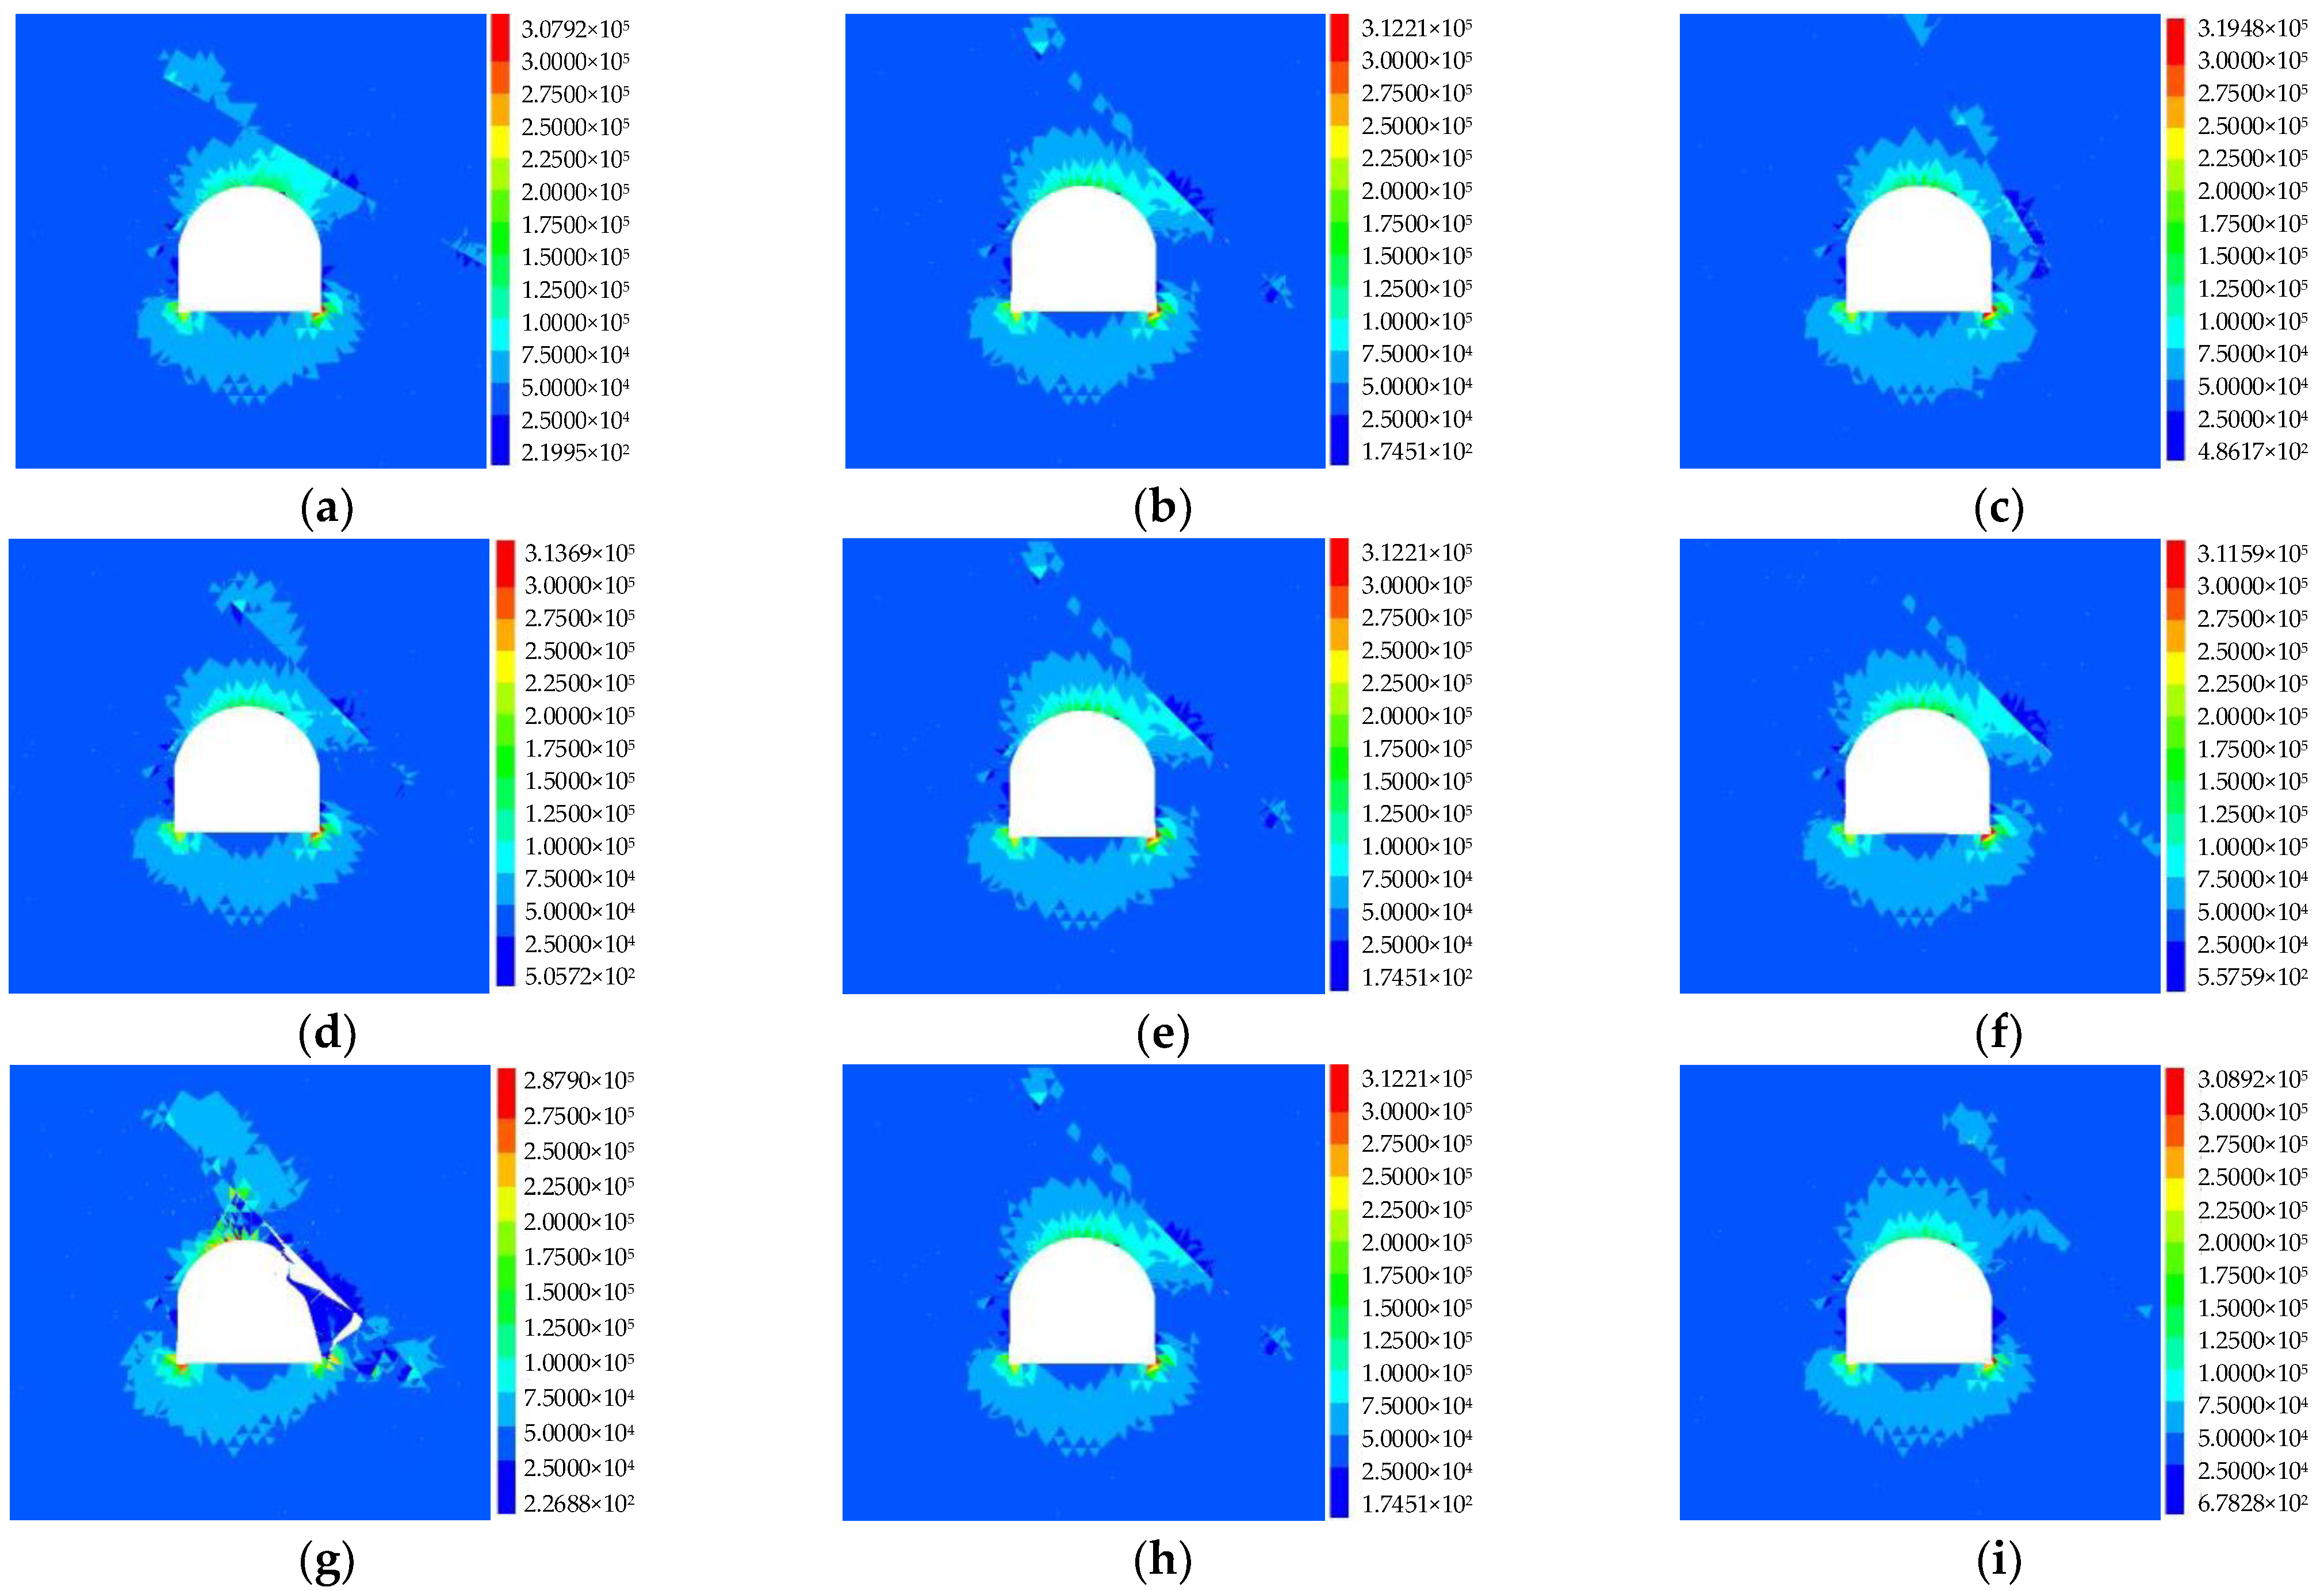
4.2. Characteristics of Energy Information

Energy release is the fundamental reason for the occurrence of rockbursts. Analyzing the mechanical response within the surrounding rock from an energy perspective can partially reflect the energy storage level and the rockburst intensity. The visualization of elastic strain energy Ue is realized using FISH language (Equation (2)), and the energy information characteristics under different conditions are obtained, as shown in Figure 5. Similar to the distribution law of the stress field, the peak energy mainly occurs at the tunnel vault and arch foot, the peak value is basically the same, about 0.31 MJ/m3. The energy accumulation degrees between the tunnel and structural plane are different, and the farther away from the tunnel, the smaller the elastic energy. From 0.20 MJ/m3 at the tunnel contour to 0.10 MJ/m3 at the structural plane, there is almost no energy accumulation above the structural plane and only little energy accumulation near the structural plane tips. Because there is no free surface in this part, the internal energy of the rock mass can only be released through the sliding or failure between the planes.
Observing Figure 5a–c, when θ = 30°, the elastic energy with the largest distribution range and value is concentrated between the tunnel and structural plane. The same is true for the structural plane tips. When θ = 45°, the energy accumulation range is below the structural plane, and the right spandrel decreases. When θ = 60°, energy accumulation occurs only in a small range below the structural plane. As θ increases, the distribution range of the larger value of Ue decreases gradually, and the energy accumulation degree also decreases. The energy accumulation degree at the structural plane tips gradually decreases with the increase in θ. Observing Figure 5d–f, when L = 6.5 m, the energy accumulation at the spandrel is obvious, and energy accumulation partly occurs in the middle and upper tip of the structural plane, with a distribution range of about 5 m near the tip. When L = 8.5 m, the energy accumulation range at the tunnel spandrel is larger, and the energy accumulation range of the structural plane upper tip reduces, with a distribution range of about 2 m. When L = 10.5 m, the distribution of larger energy value for spandrel rocks further increases, and the value remains unchanged, the larger elastic energy is accumulated. As L increases, the energy accumulation range between the structural plane and tunnel gradually expands, the energy value of partly rocks increases, energy accumulation at the structural plane tips decreases, and the energy release above the structural plane increases. It indicates that the structural plane with a larger scale is conducive to the energy accumulation below the structural plane, while the structural plane with a smaller scale is conducive to the energy accumulation at the structural plane tips. Observing Figure 5g–i, when the structural plane intersects with the tunnel (D = 0 m), the energy release drives the rock mass separated from the surrounding rock near the structural plane. The elastic energy mainly accumulates at the vault and arch foot, and some energy accumulates at the structural plane tips. When D = 1.7 m, the rock mass between the lower part of the structural plane and the spandrel accumulates a large amount of elastic energy, which is much higher than that of D = 0 m. When D = 3.4 m, the structural plane has little effect on the energy distribution, and the distribution is approximately symmetrical. Compared with the condition of D = 1.7 m, the energy accumulation range increases slightly, but the energy value decreases slightly.

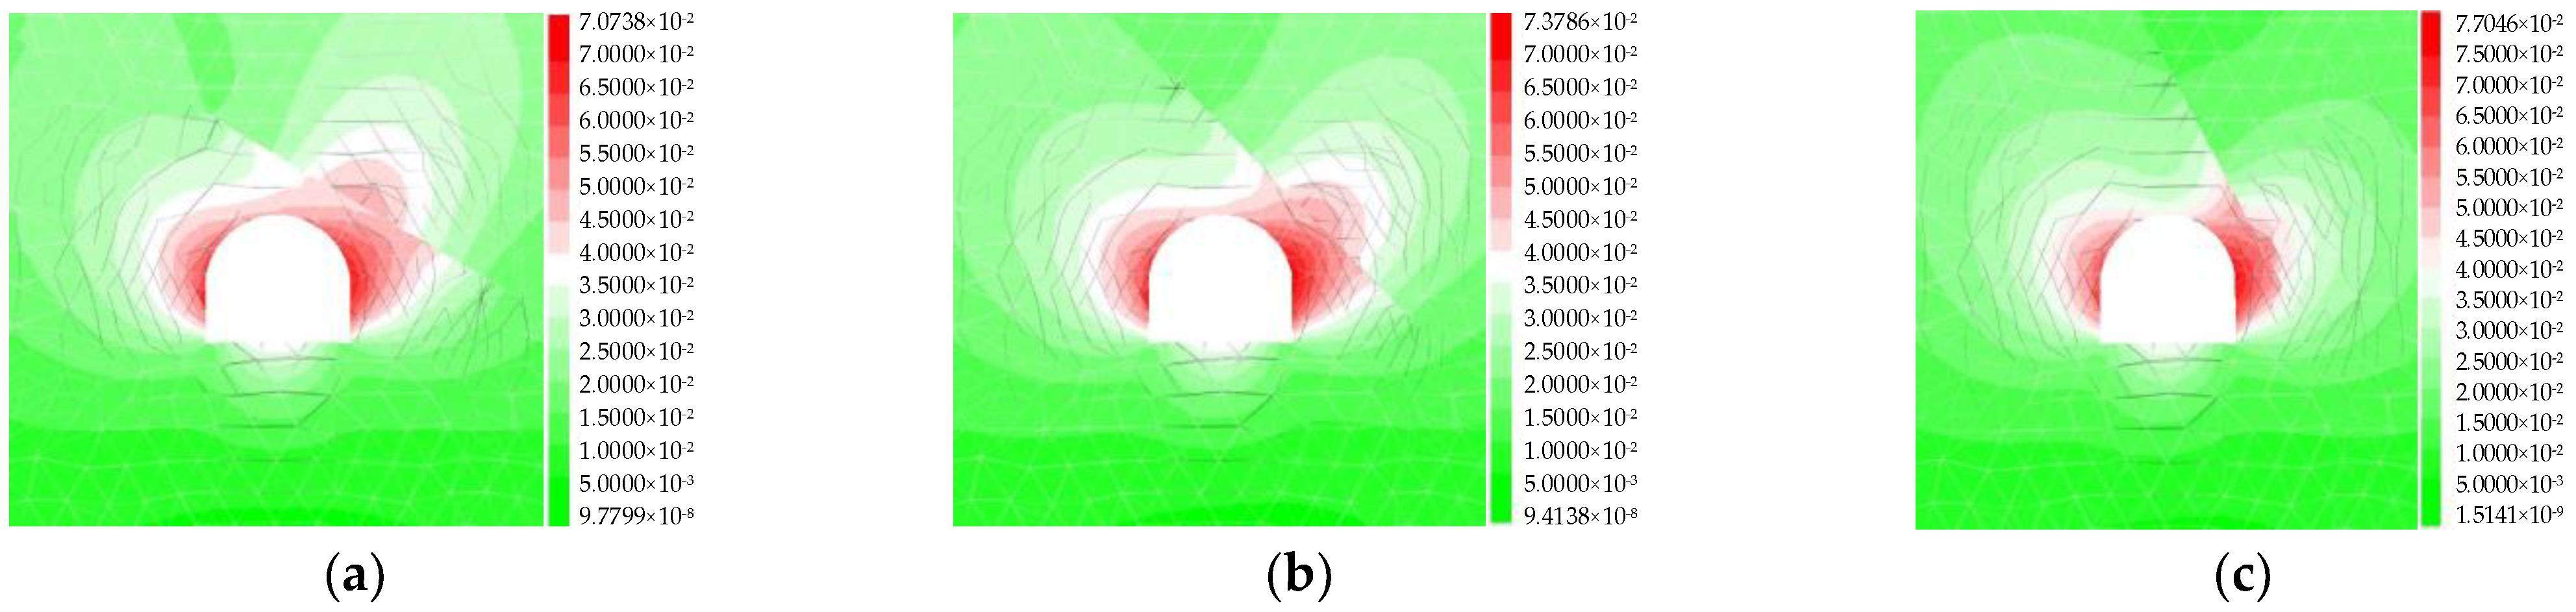
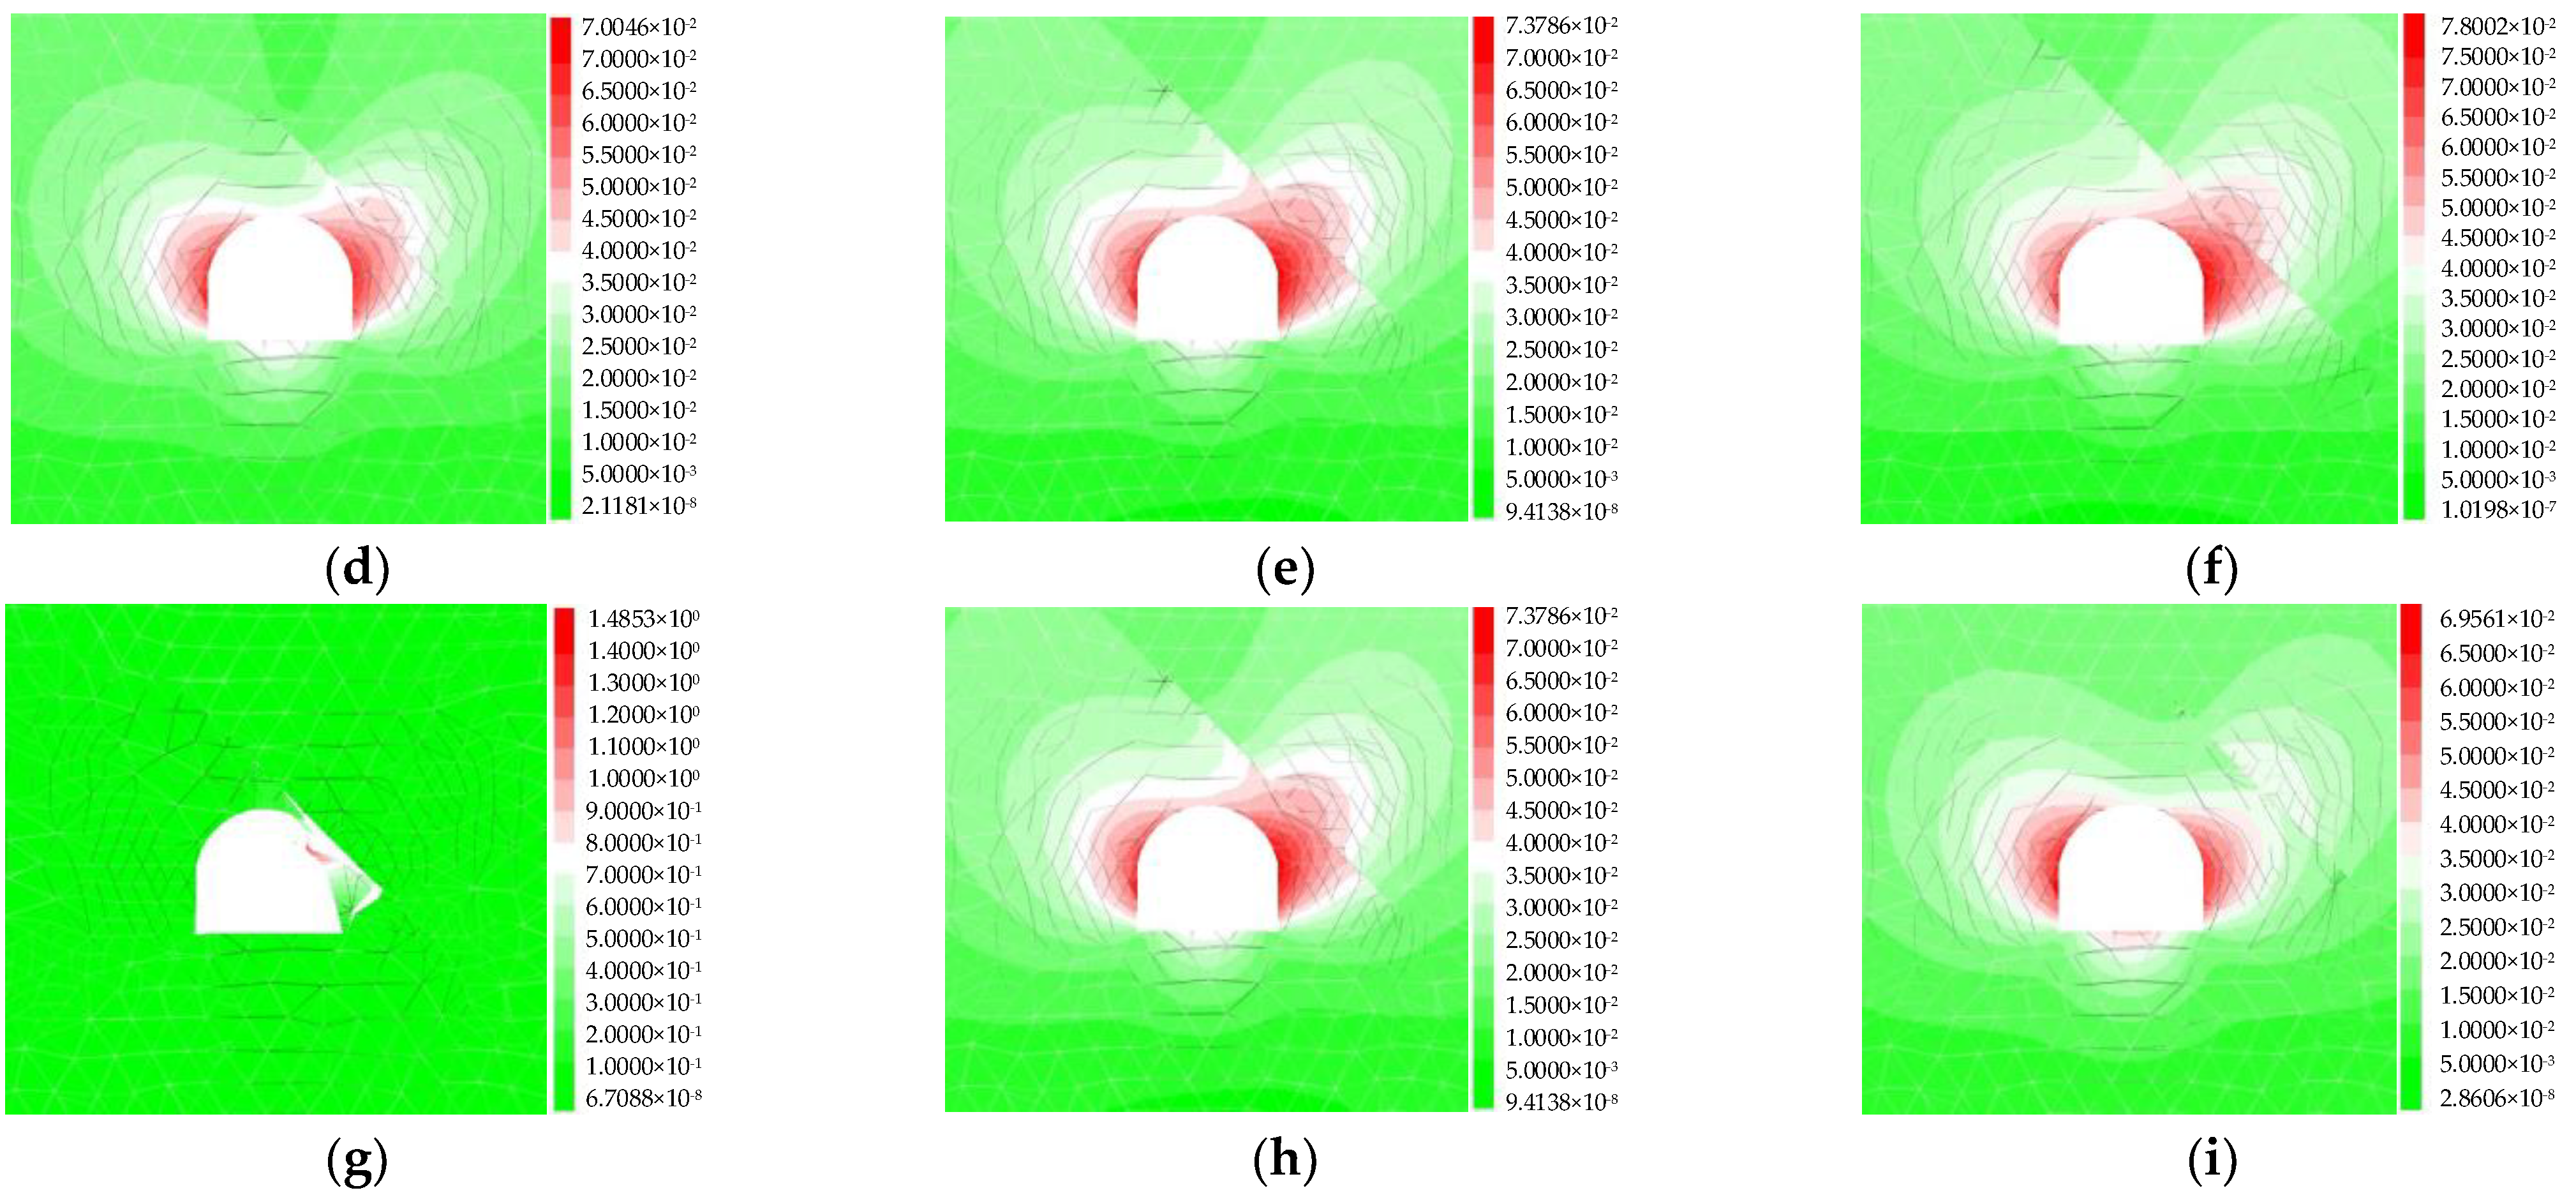
4.3. Characteristics of Fracture Information

Figure 6 is the cloud diagram of fracture propagation under different conditions in the surrounding rock. In the figure, the black and grey lines are the displacement of joints, which can characterize the fracture propagation characteristics of rock mass. The extension range of black and grey lines is the fracture propagation range. The deeper the color, the greater the displacement of joints. The fracture information of surrounding rock under different conditions is analyzed, respectively, and the variation laws are as follows.
Observing Figure 6a–c, the influence of θ on the fracture propagation is mainly reflected in two aspects: on the one hand, the fracture propagation range at the vault increases, the fracture propagation range at the right spandrel decreases, while the fracture propagation range of the right sidewall increases, and the fracture propagation is close to symmetrical distribution. On the other hand, θ with a larger value will increase the fracture width, indicating that the angle has a significant effect on the fracture propagation direction, propagation degree, and fracture width of surrounding rock. Observing Figure 6d–f, when L = 6.5 m, the distribution of fracture propagation is approximately symmetrical. When L = 8.5 m, the rock fracture propagation is greatly affected by the structural plane. The fracture propagation range formed between the upper tip of the structural plane and tunnel increases, and the fracture opening degree of the structural plane tips also increases, while there is no obvious fracture propagation outside the structural plane tips. The fracture propagation range at the structural plane tips increases along the plane direction. When L = 10.5 m, the fracture propagation range of the above two parts further increases. Observing Figure 6g–i, when D = 0 m, only the fracture propagation range at the vault and left arch foot is small, and the fracture propagation in other parts is obvious. When D = 1.7 m, the fracture propagation at the structural plane tips is obvious, and the rock mass below the plane has a larger propagation range along the plane. The rock mass above the plane extends shorter along the plane, but the fracture propagation depth is larger. Compared with D = 0 m, the fracture propagation range of the vault increases under this condition, while the fracture propagation at the right arch foot decreases. When D = 3.4 m, the difference in fracture propagation characteristics of rock mass on both tunnel sides further reduces, showing the characteristics of the approximate symmetrical distribution. The fracture propagation mainly occurs at the arch bottom and side wall. The fracture propagation range and degree at the vault are small, and the fracture propagation range above the structural plane is large. The above results show that as D increases, the fracture propagation range and fracture displacement decrease, especially near the structural plane, indicating that the structural plane effect on fracture information gradually weakens, and when D is small, the fracture displacement color is deeper, that is, the fracture opening degree is larger. As the relative distance increases, the color of the fracture displacement is lighter, and the fracture opening degree decreases.

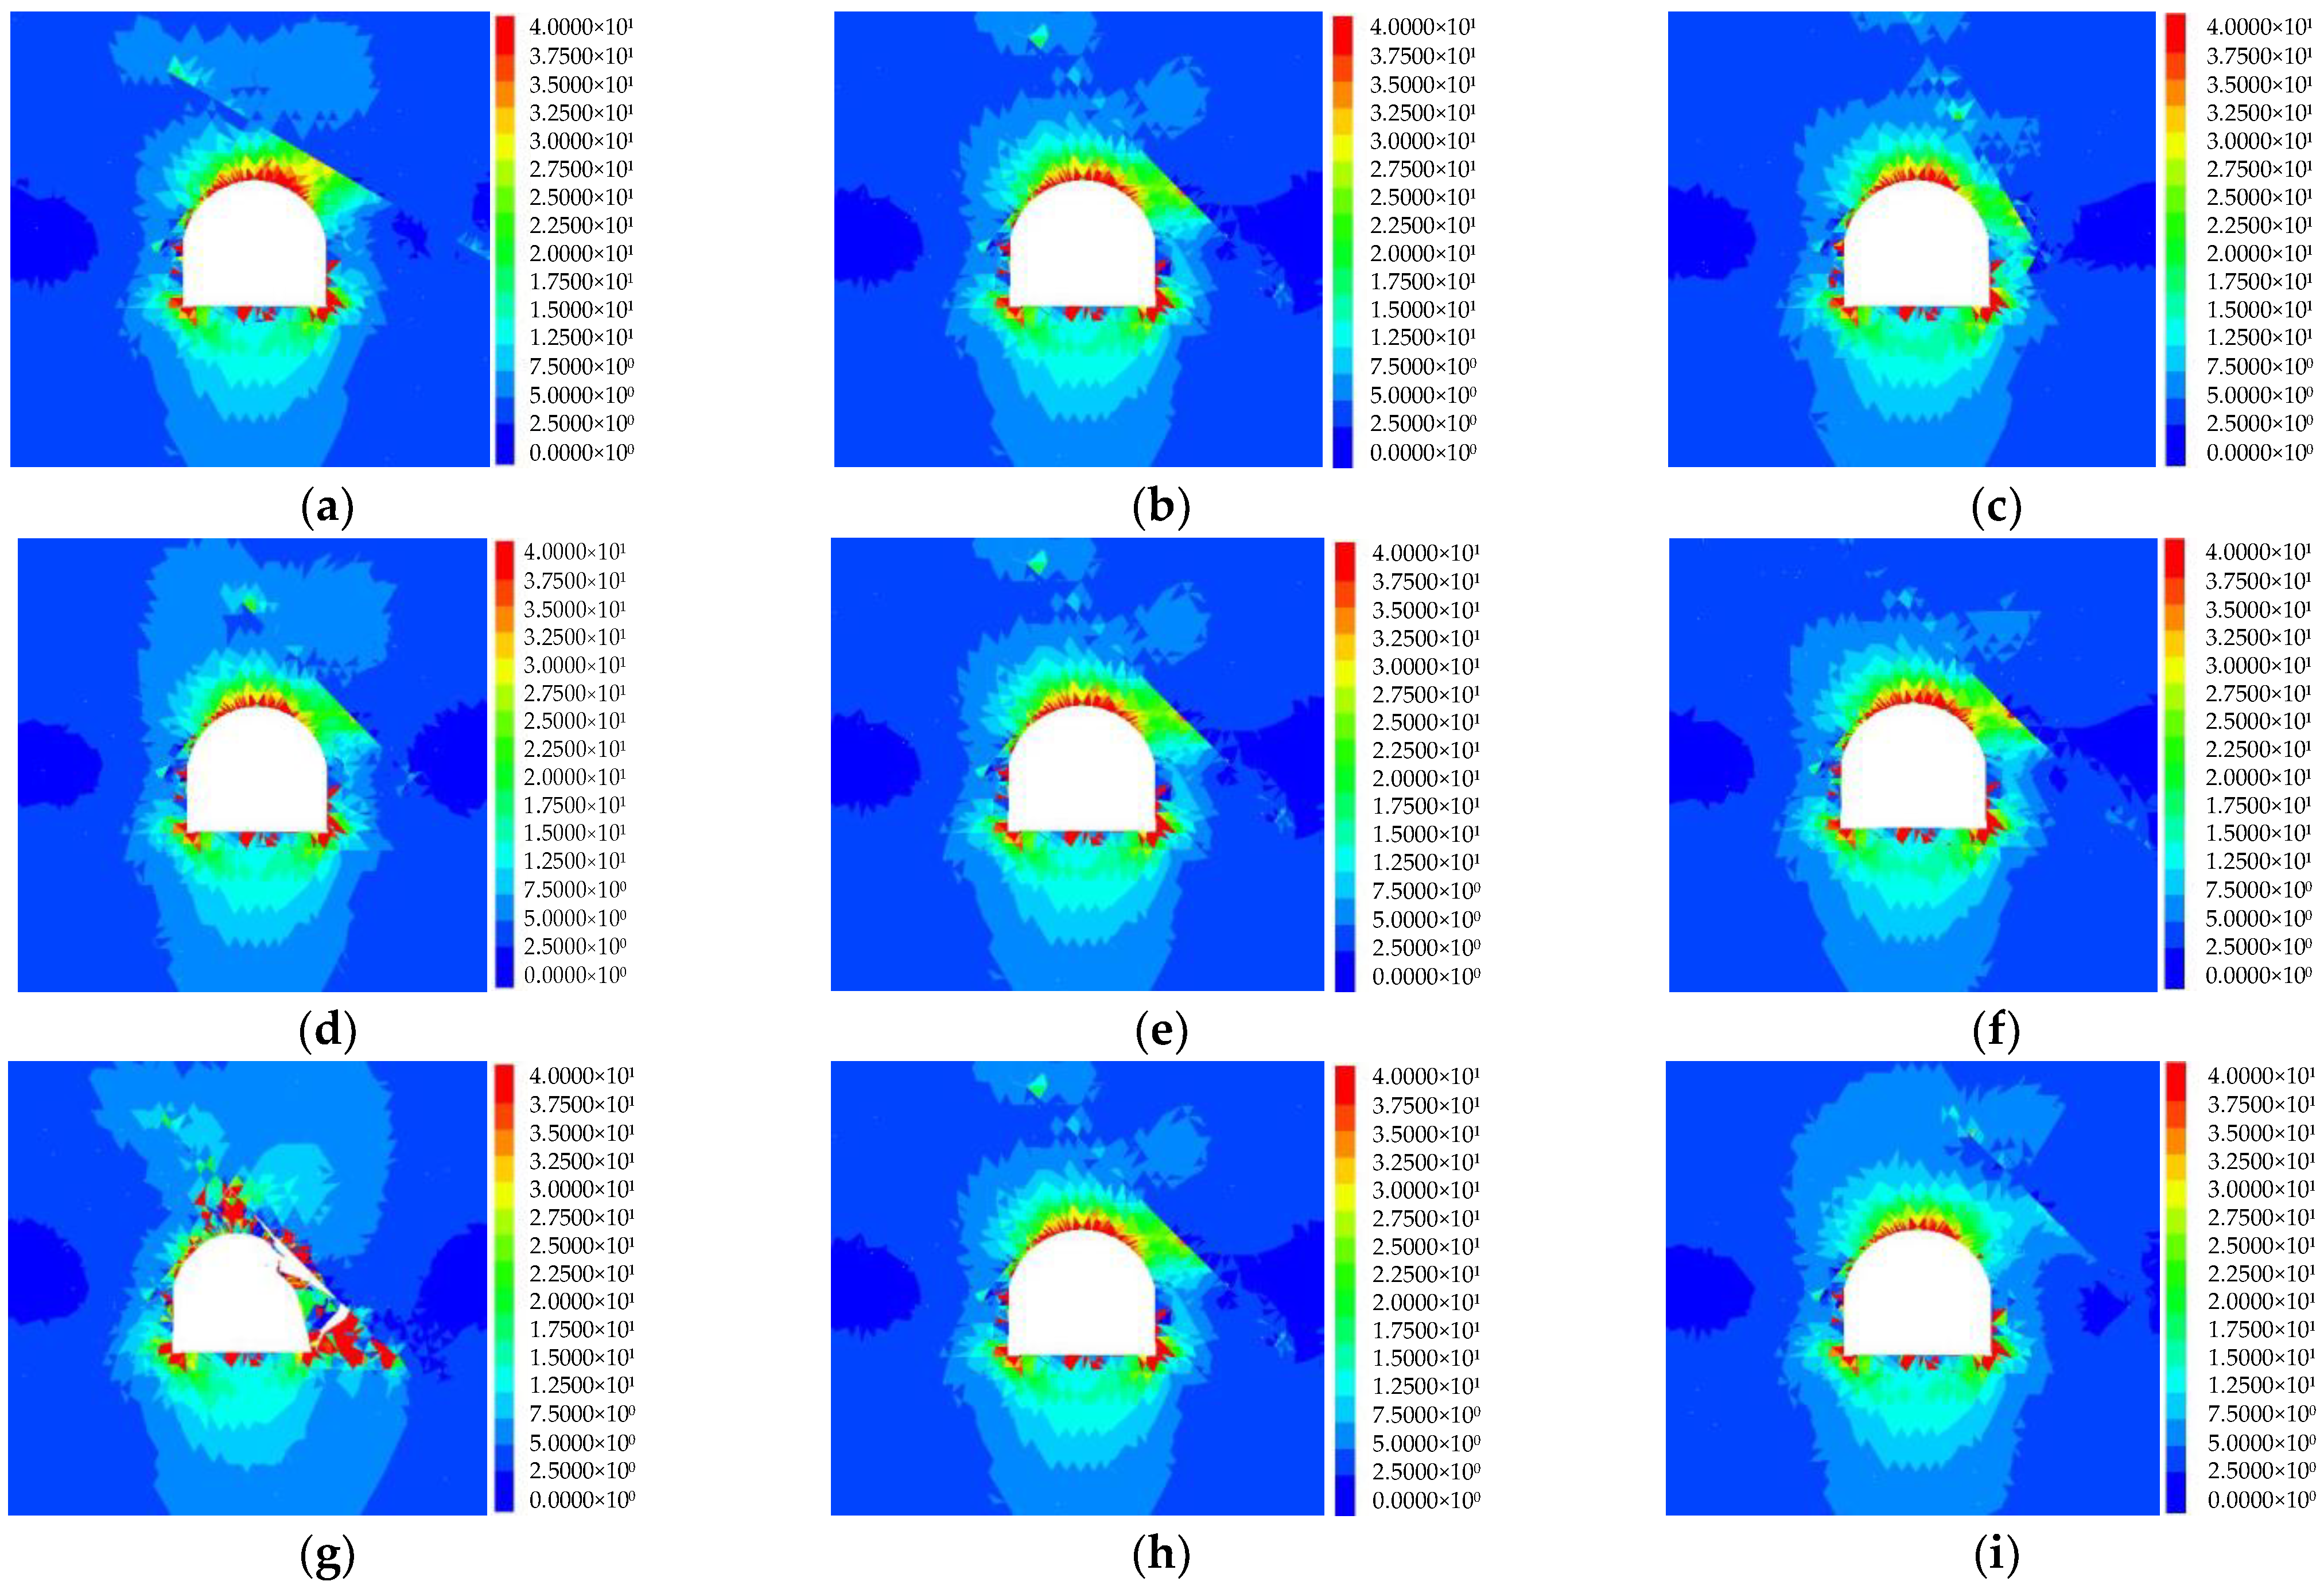
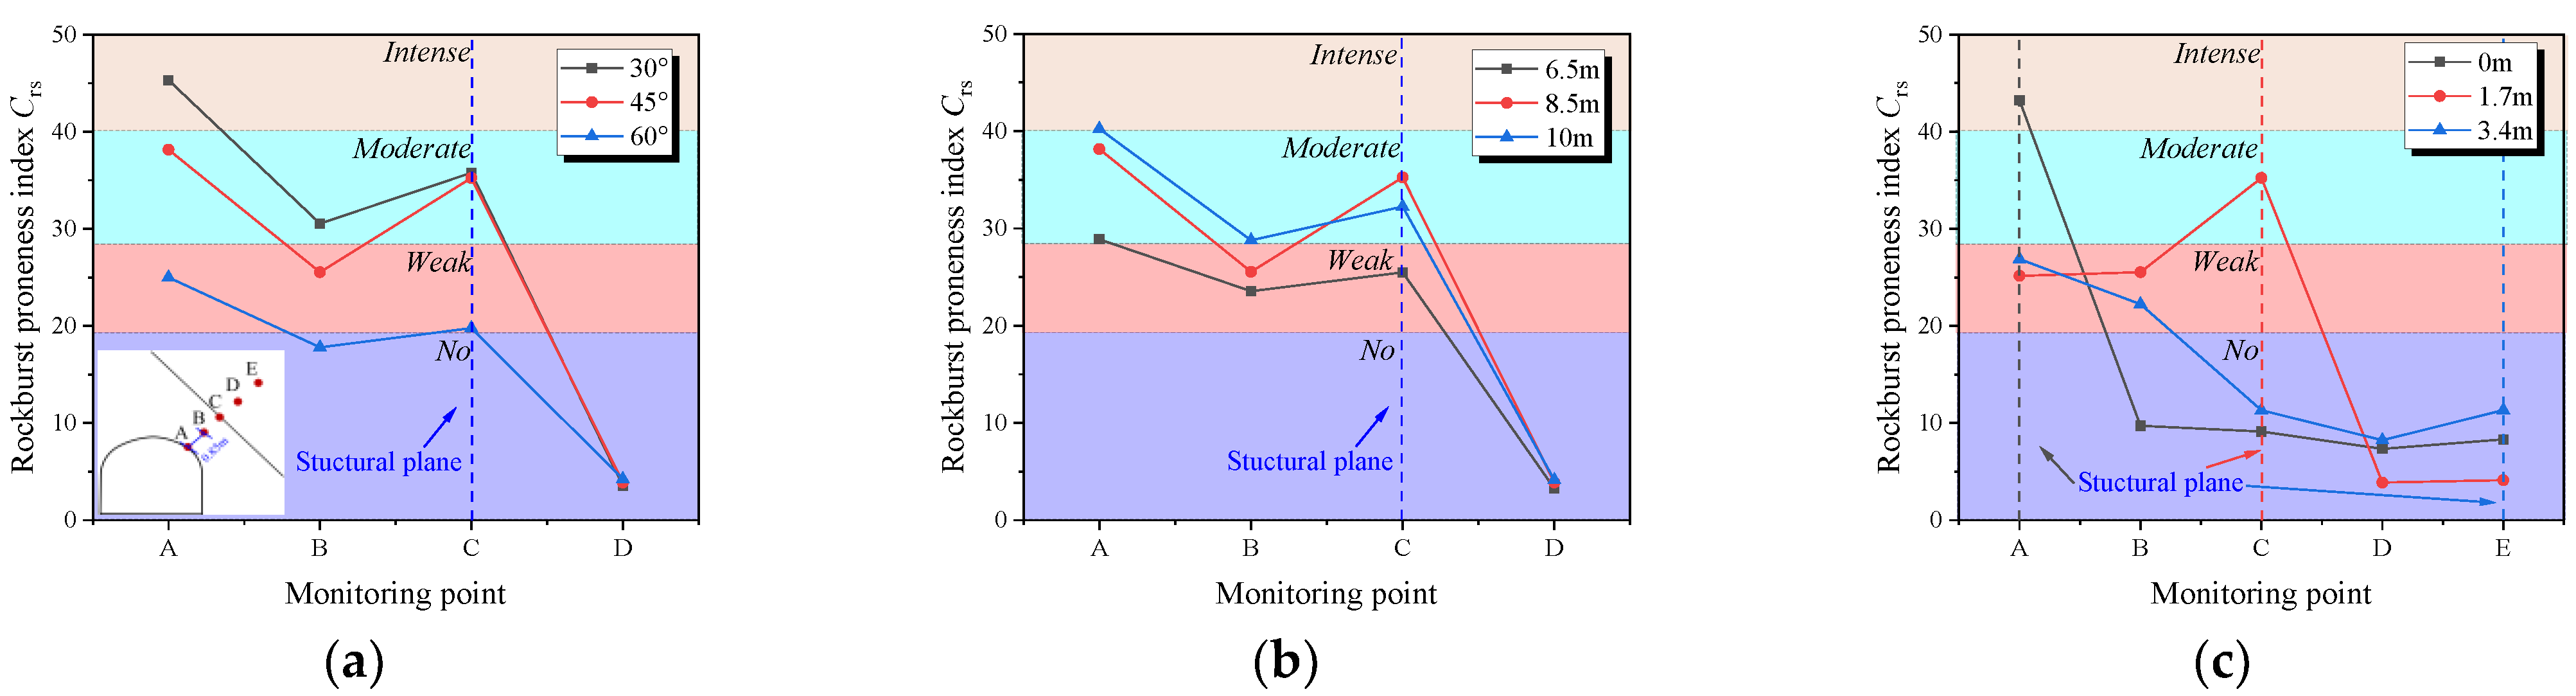
4.4. Characteristics of Rockburst Proneness

Rockburst proneness is the key basis for studying and evaluating rockburst disasters in the deep rock mass. To distinguish the intensity level and location of rockbursts under different conditions, the structural plane effect on rockburst proneness within the surrounding rock is further analyzed. Through the secondary development of 3DEC by FISH language, the distribution of multi-parameter rockburst energy index Crs of surrounding rock under different conditions is obtained, as shown in Figure 7. To quantitatively analyze the relationship between the parameters of the structural plane and the proneness to rockburst, it is critical to consider that different conditions mainly cause the difference in rockburst proneness between the tunnel and structural plane. Taking the nearest position from the tunnel to the structural plane, the monitoring points A~E are set up in turn along the deep rock mass. The layout of the monitoring points and variation trend of the rockburst index Crs value of each monitoring point with the structural plane geometric parameters are shown in Figure 8. Combined with Figure 8, the characteristics of rockburst proneness are further analyzed under different conditions. The specific variation laws are as follows.
Observing Figure 7a–c, when θ = 30°, the Crs value at the right spandrel is the largest, and an intense rockburst occurs. The rockburst proneness gradually weakens as the rock mass depth increases, the Crs value decreases to 30. When the structural plane is contacted, the Crs value is about 35, and a moderate rockburst occurs. When θ = 45°, the occurrence range of rockburst decreases, and the Crs value near the structural plane is 35, which is prone to a moderate rockburst. The Crs value between the tunnel spandrel and structural plane is basically the same, about 25, which is prone to a weak rockburst. When θ = 60°, the distribution of the Crs value around the tunnel is approximately symmetrical. The maximum Crs value at the right spandrel is 25, which is prone to a weak rockburst. The rockburst proneness between the spandrel and structural plane reaches the minimum value. The Crs value is only 17.8, which is not prone to rockburst. The Crs value increases slightly below the structural plane. Observing Figure 7d–f, when L = 6.5 m, the Crs value of the rock mass from the tunnel to the structural plane remains basically unchanged with the increasing depth, about 25, which is prone to a weak rockburst. When L increases to 8.5 m and 10.5 m, the Crs value near the structural plane increases, and the Crs value of partly rock mass exceeds 40, which is prone to an intense rockburst. The range of intense rockbursts increases as the structural plane length increases. With the increase in L, the rockburst intensity grade and occurrence range in the risk area gradually increase. Observing Figure 7g–i, the distribution of the rockburst proneness is greatly different from the variation in the distance from the structural plane to the tunnel. When the structural plane intersects with the tunnel, the Crs values of the vault and the right arch foot are all greater than 40, which is prone to an intense rockburst. The rockburst occurrence range at the vault is small, and the occurrence range at the right arch foot is large, but it is limited to a single or few blocks. A small part of the rock mass on the right spandrel has an intense rockburst, and the rest of the rock mass has no rockburst. When D = 1.7 m, the Crs value at the right spandrel is about 25, which is prone to a weak rockburst and has a larger occurrence range of rockbursts. When D = 3.4 m, the structural plane effect is relatively weakened, and the Crs value is approximately symmetrically distributed. The area of Crs value greater than 19 at the right spandrel decreases, that is, the range of weak rockbursts decreases. According to the Crs distribution characteristics, as D increases, the rockburst occurrence range increases first and then decreases. The distribution characteristics of the Crs value are basically consistent with the variation characteristics of stress and energy.
From Figure 8, with the increase in the surrounding rock depth, the distribution of rockburst proneness index Crs decreases first, then increases, and finally decreases. The rockburst intensity from the tunnel to the structural plane shows “strong, weak, sub-strong, weak” variation characteristics, which induce rockburst between the structural plane and tunnel. It is observed that the phase of rockburst intensity increase is distributed near the structural plane, and its distribution characteristics are consistent with the characteristics of stress and energy information, which is caused by shear slip within the structural plane. The influence of each structural plane’s geometric parameters on rockburst proneness is compared and analyzed, and the order of influence degree for the structural plane on rockburst proneness is relative distance > dip angle > length.

5. Case Study: “11.28” Rockburst in Jinping II Drainage Tunnel

5.1. Project Overview

The Jinping II hydropower station tunnel group is located in Southwest China, which is a strategic key project of the country’s western development. The total length and the maximum buried depth of the tunnel are about 17 km and 2525 m, respectively. The specific geographical location of the tunnel group is shown in Figure 9a,b [33]. The construction of the tunnel group is significantly affected by the high-ground stress condition. During the drainage tunnel excavation from east to west, it encountered many geological disasters such as rockbursts, and the most serious one occurred on 28 November 2009 in the drainage tunnel. There was an extremely intense rockburst that occurred in the tunnel section with the pile numbers SK9 + 283~SK9 + 322 (Figure 9c). The accident caused heavy losses of casualties and failure of the TBM. This rockburst case is also called “11.28” extremely intense rockburst [34]. After the rockburst, a rigid structural plane approximately parallel to the tunnel axis and with a dip angle of 50° is exposed (Figure 9d). The structural plane is straight, smooth, and unfilled. The rock mass below the structural plane collapsed during the rockburst, and a “V” shaped blasting pit with a depth of about 7 m was formed, which conforms to the characteristics of the strain-structural plane slip rockburst [6].

5.2. Model Establishment and Mechanical Parameters

A corresponding 3D tunnel excavation model considering a nearby rigid structural plane is established according to the project overview. The overall dimensions of the numerical model were 40 m × 5 m × 40 m, and the excavation diameter of the drainage tunnel was 7.2 m. To meet the requirements of block size and improve the calculation accuracy and efficiency, from the tunnel to the boundary, the mesh division gradually becomes larger, and the edge length of block size is set between 0.1 m and 1 m. The Mohr-Coulomb constitutive model is adopted for the rock block, and the rock mechanical parameters are determined according to the actual marble of Baishan formation (T2b) on the field, and Table 5 shows the specific macro mechanical parameter values [33]. The contact constitutive model adopts the Coulomb-slip model, considering that it is difficult to calibrate the specific contact parameters of the virtual joints and structural plane in the actual situation, it is assumed that the parameter settings of the structural plane are consistent with the parameters in Section 3.2. The stress boundary conditions are set based on the results of the ground stress test in the Jinping II drainage tunnel. Table 6 shows the specific parameter values, including σx, σy, σz, τxy, τyz, and τxz that are the normal stress and shear stress acting on the x, y, and z planes along the x, y, and z directions, respectively.

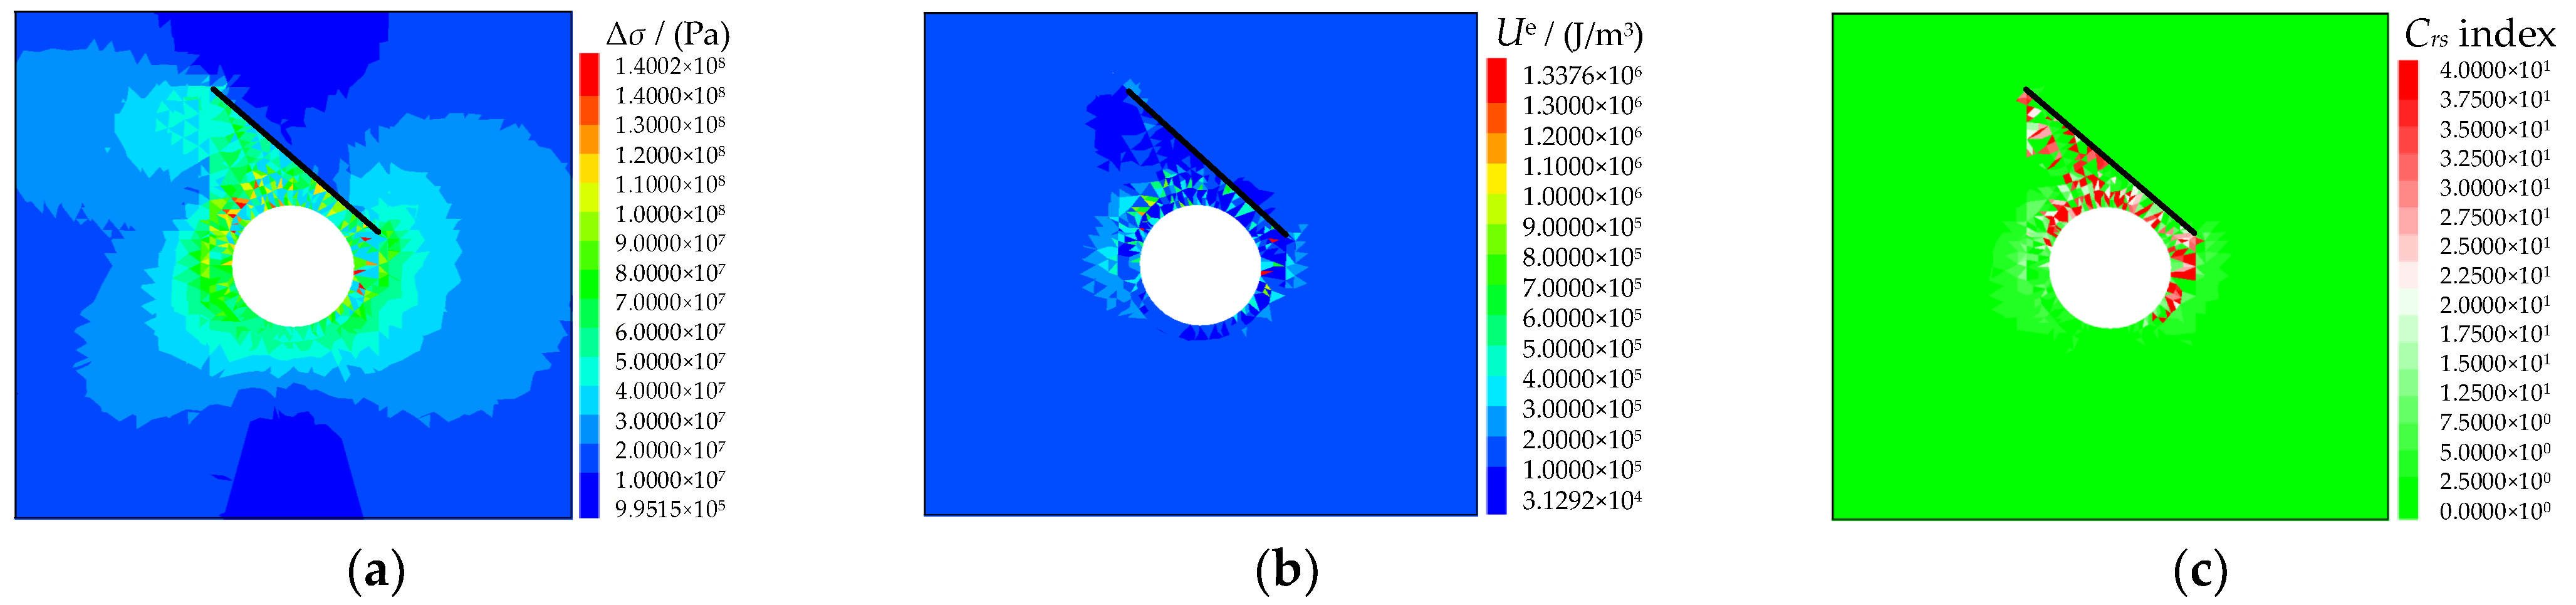
5.3. Simulation Results and Analysis

A numerical simulation was carried out for the “11.28” rockburst case, and the numerical calculation results of the surrounding rock’s multivariate catastrophe information after the tunnel excavation are shown in Figure 10. Figure 10a–c, respectively, represents the distribution law of the principal stress difference Δσ, elastic strain energy Ue, and multi-parameter rockburst energy index Crs value of surrounding rock. According to Figure 10a, the maximum value of Δσ within the surrounding rock is 140 MPa. The Δσ value at the upper left of the tunnel is large. The Δσ value at both sides and the bottom depth of about 3 m of the tunnel is larger than 60 MPa, and the same is true between the tunnel and structural plane, without any obvious stress concentration above the structural plane. According to Figure 10b, energy is mainly concentrated around the surrounding rock and the region between the tunnel and structural plane, with energy accumulation more obvious at the vault and left spandrel of the tunnel. The peak energy value is 1.34 MJ/m3, while there is no obvious energy accumulation above the structural plane. According to Figure 10c, the peak value of Crs between the tunnel and structural plane is larger than 40, and the larger value of Crs shows obvious “V” distribution characteristics. According to the judgment standard of rockburst intensity, the rockburst intensity grade of the rock mass within this range is an intense rockburst, and the occurrence range of rockburst is large.
The simulated rockburst proneness characteristics are compared with the actual situation of the rockburst pit geometric size, and the results are shown in Figure 11. From the figure, the occurrence range and intensity grade of rockburst reflected by the Crs index distribution obtained through simulation are basically consistent with the distribution and intensity of the actual rockburst occurrence pit area on site. The rockburst occurrence range between the tunnel and structural plane is approximately in a “V” type distribution, and the intensity grades are all above the intense rockburst. The rigid structural plane controls the occurrence boundary of the pit created during the rockburst. Affected by excavation disturbance, the internal stress adjustment, energy dissipation, and release of surrounding rock perpendicular to the structural plane led to the rock’s micro-cracks initiating, inoculating, and propagating. The occurrence range of rockburst and fracture propagation further extends to the structural plane, causing friction and slip of the structural plane, which leads to large-scale damage at the arch waist position of the tunnel. The field observation is consistent with the simulated tunnel arch waist rockburst intensity and location in Figure 11c [35]. This further verifies the reliability of using the multi-parameter rockburst energy index Crs to conduct the risk evaluation on the strain-structural plane slip rockburst, and its accuracy still needs to be verified by more engineering cases. It also verifies the rationality and engineering applicability of the novel 3D discrete element rockburst analysis method, which can truly reflect the catastrophic characteristics of the strain-structural plane slip rockburst.

6. Conclusions

Based on the novel numerical method for rockburst, this paper analyzes the variation characteristics of multivariate catastrophe information such as stress, energy, fracture, and rockburst proneness index of surrounding rock with the structural plane geometric parameters after tunnel excavation. The following are the main conclusions:
(1)
A rockburst numerical analysis method is proposed using the bonded block model and the multi-parameter rockburst energy index. This method improves the modeling speed and calculation accuracy. It can not only simulate the fracture initiation, propagation, and interaction between blocks but also consider the various stress states of the rock unit. It realizes the visual analysis of the multivariate information response of the surrounding rock, the rockburst intensity and occurrence range, and the real simulation of the structure plane control effect on rockburst under the three-dimensional stress state.
(2)
As the dip angle increases, the fracture propagation range of rock mass between the tunnel and structural plane generally shows an increasing trend, the fracture width increases, and the intensity level and occurrence range of rockburst gradually decrease. As the length increases, the fracture propagation range, rockburst intensity, and occurrence range of the rock mass increase slightly. As the relative distance increases, the fracture propagation range and rockburst intensity decrease, while the occurrence range of rockburst increases first and then decreases.
(3)
With the increase in the surrounding rock depth, the distribution of rockburst proneness index Crs value presents a tendency of first decreasing, then increasing, and finally decreasing. The rockburst proneness in the risk area is strong-weak-sub-strong-weak and then induces a rockburst. The increasing stage of rockburst intensity is distributed near the structural plane, and its distribution characteristics are basically consistent with the characteristics of stress and energy information. The order of influence degree for the structural plane on rockburst proneness is relative distance > dip angle > length.
(4)
The engineering verification study was conducted on the “11.28” rockburst case in the Jinping II drainage tunnel. The peak value of rockburst index Crs between the tunnel and structural plane is greater than 40, and the larger value is distributed in a “V” shape, which is consistent with the geometric distribution of the actual rockburst pit, and the structural plane controls the boundary of the rockburst pit. The numerical analysis method for rockburst proposed in this paper can better predict and reflect the catastrophic characteristics of the strain-structural plane slip rockburst, and the case study also has verified the rationality and applicability of the method.
In this study, only the parameter design of dip angle, length, and relative distance about one structural plane is considered. However, under the requirements of reasonable structural plane parameter design, the structural plane arrangement also has a significant impact on rockburst. In the future, the corresponding numerical research can be carried out on the parameters of structural plane arrangement, such as spacing and number. And the influence of blasting load on the structural plane cannot be ignored with the drill-blasting method in deep underground engineering. The related research about the influence of blasting load disturbance on structural plane should be carried out, and the coupling effect of blasting load and engineering excavation should be fully considered.

Author Contributions

Conceptualization, J.G. and B.H.; methodology, J.G. and Z.Z.; software, H.Z.; validation, Z.Z. and F.S.; formal analysis, J.G. and Z.Z.; investigation, B.H.; resources, J.G.; data curation, J.G. and Z.Z.; writing—original draft preparation, J.G. and H.Z.; writing—review and editing, Z.Z.; visualization, Z.Z. and F.S.; supervision, B.H.; project administration, J.G.; funding acquisition, J.G. All authors have read and agreed to the published version of the manuscript.

Funding

This research was funded by the National Natural Science Foundation of China (Grant Nos. 52178388, 42307259) and The Opening Project of Key Laboratory of Highway Bridge and Tunnel of Shaanxi Province (Chang' an University) (Grant No. 300102211517).

Institutional Review Board Statement

Not applicable.

Informed Consent Statement

Not applicable.

Data Availability Statement

Data are contained within the article.

Conflicts of Interest

The authors declare no conflict of interest.

References

  1. Park, C.H.; Bobert, A. Crack coalescence in specimens with open and closed flaws: A comparison. Int. J. Rock Mech. Min. 2009, 46, 819–829. [Google Scholar] [CrossRef]
  2. Li, J.C.; Ma, G.W.; Zhao, J. An equivalent viscoelastic model for rock mass with parallel joints. J. Geophys. Res. 2010, 115, B03305. [Google Scholar] [CrossRef]
  3. Su, F.S.; Pan, P.Z.; Gao, Y.H.; Feng, X.T.; Liu, C. Experimental study on failure process and mechanism of marble containing natural hard structural plane. Chin. J. Rock Mech. Eng. 2018, 37, 611–620. [Google Scholar]
  4. Guo, J.Q.; Cheng, L.P.; Zhu, B.Z.; Tian, Y.C.; Huang, X. Shear mechanical properties and energy characteristics of rock joints under continuous excavation effect. Rock Soil. Mech. 2023, 44, 131–143. [Google Scholar]
  5. He, M.C. Status Quo and Prospect of Rock Mechanics in Deep Mining Engineering. In Proceedings of the 8th National Congress on Rock Mechanics and Engineering, Beijing, China, 1 October 2004; pp. 99–105. [Google Scholar]
  6. Zhou, H.; Meng, F.Z.; Zhang, C.Q.; Hu, D.W.; Yang, F.J.; Lu, J.J. Analysis of rockburst mechanisms induced by structural planes in deep tunnels. Bull. Eng. Geol. Environ. 2015, 74, 1435–1451. [Google Scholar] [CrossRef]
  7. Wang, Y.C.; Tang, C.A.; Tang, L.X.; Zhang, S.C.; Li, L.M.; Li, Y.B.; Duan, W.S. Microseismicity Characteristics Before and After a Rockburst and Mechanisms of Intermittent Rockbursts in a Water Diversion Tunnel. Rock Mech. Rock Eng. 2022, 55, 341–361. [Google Scholar]
  8. Liu, F.; Tang, C.A.; Ma, T.H.; Tang, L.X. Characterizing Rockbursts Along a Structural Plane in a Tunnel of the Hanjiang-to-Weihe River Diversion Project by Microseismic Monitoring. Rock Mech. Rock Eng. 2019, 52, 1835–1856. [Google Scholar]
  9. Feng, X.T.; Xiao, Y.X.; Feng, G.L.; Yao, Z.B.; Chen, B.R.; Yang, C.X.; Su, G.S. Study on the development process of rockbursts. Chin. J. Rock Mech. Eng. 2019, 38, 649–673. [Google Scholar]
  10. Das, R.; Singh, T.N. A novel technique for temporal evolution of rockburst in underground rock tunnel: An experimental study. Environ. Earth Sci. 2022, 81, 420. [Google Scholar]
  11. Cheng, G.T.; Zhang, J.; Gao, Q.; Liu, C. Experimental Study on the Influence Mechanism of the Structural Plane to Rockbursts in Deeply Buried Hard Rock Tunnels. Shock. Vib. 2021, 2021, 9839986. [Google Scholar] [CrossRef]
  12. Gong, H.L.; Luo, Y.; Xu, K.; Wang, X.Y.; Tao, Y.H.; Li, X.P. Mechanical characteristics of failure and rockburst proneness of fractured granite from Shuangjiangkou hydropower station under triaxial loading and unloading. Bull. Eng. Geol. Environ. 2023, 82, 256. [Google Scholar] [CrossRef]
  13. Manouchehrian, A.; Cai, M. Numerical modeling of rockburst near fault zones in deep tunnels. Tunn. Undergr. Space Technol. 2018, 80, 164–180. [Google Scholar] [CrossRef]
  14. Feng, F.; Li, X.B.; Rostami, J.; Li, D.Y. Modeling hard rock failure induced by structural planes around deep circular tunnels. Eng. Fract. Mech. 2019, 205, 152–174. [Google Scholar] [CrossRef]
  15. Wang, P.; Yin, Z.Y.; Hicher, P.Y.; Cui, Y.J. Micro-mechanical analysis of one-dimensional compression of clay with DEM. Int. J. Numer. Anal. Met. 2023, 47, 2706–2724. [Google Scholar] [CrossRef]
  16. Yin, Z.Y.; Wang, P.; Zhang, F.S. Effect of particle shape on the progressive failure of shield tunnel face in granular soils by coupled FDM-DEM method. Tunn. Undergr. Space Technol. 2020, 100, 103394. [Google Scholar] [CrossRef]
  17. Zhou, X.; Meng, F.Z.; Yue, Z.F.; Wang, W.; Xu, R.C.; Zhou, H.; Guan, X.M. Evolution and mechanism of rockburst induced by structural plane based on GDEM. J. China Coal Soc. 2023, 48, 2207–2223. [Google Scholar]
  18. Zhao, C.; Bao, C.; Tian, J.S.; Matsuda, H.; Morita, C. Experimental study of coalescence mode of cracks and strength of rock with double flaws based on strain localization. Chin. J. Rock Mech. Eng. 2015, 34, 2309–2318. [Google Scholar]
  19. Zhang, C.Q.; Zhou, H.; Feng, X.T. An index for estimating the stability of brittle surrounding rock mass: FAI and its engineering application. Rock Mech. Rock Eng. 2011, 44, 401–414. [Google Scholar] [CrossRef]
  20. Su, G.S.; Feng, X.T.; Jiang, Q.; Chen, G.Q. Study on new index of local energy release rate for stability analysis and optimal design of underground rockmass engineering with high geostress. Chin. J. Rock Mech. Eng. 2006, 25, 2453–2460. [Google Scholar]
  21. Xie, H.P.; Ju, Y.; Li, L.Y. Criteria for strength and structural failure of rocks based on energy dissipation and energy release principles. Chin. J. Rock Mech. Eng. 2005, 17, 3003–3010. [Google Scholar]
  22. Zhu, B.Z.; Fan, J.Q.; Shi, X.Y.; Liu, P.F.; Guo, J.Q. Study on Rockburst Proneness of Deep Tunnel Under Different Geo-Stress Conditions Based on DEM. Geotech. Geol. Eng. 2022, 40, 1373–1386. [Google Scholar] [CrossRef]
  23. Zhang, H.Y.; Fan, J.Q.; Guo, J.Q.; Shi, X.Y.; Sun, F.Y. Rockburst Tendency for Deep Underground Engineering Based on Multi-Parameters Criterion. Chin. J. High. Press. Phys. 2022, 36, 176–189. [Google Scholar]
  24. Jiang, B.Y.; Ding, M.J.; Li, W.S.; Gu, S.T.; Ji, H.G. Investigation on Characteristics and Prevention of Rockburst in a Deep Hard and Soft Compound Stratum Tunnel Excavated Using TBM. Sustainability 2022, 14, 3190. [Google Scholar] [CrossRef]
  25. Cheng, Z.H.; Su, S.L.; Wang, X. Study on mining-induced fracture field of contiguous coal seam with BBM-DEM simulation. Coal Sci. Technol. 2019, 47, 1–9. [Google Scholar]
  26. Zhu, D.F.; Tu, S.H.; Ma, H.S.; Zhang, X.W. A 3D Voronoi and subdivision model for calibration of rock properties. Model. Simul. Mater. Sci. 2017, 25, 85005. [Google Scholar] [CrossRef]
  27. Yang, W. Study on Numerical Analysis Method of Hard Rock Failure Process and Mechanism; Chongqing University: Chongqing, China, 2021. [Google Scholar]
  28. Lavoie, T.; Eberhardt, E.; Pierce, M.E. Numerical modelling of rock mass bulking and geometric dilation using a bonded block modelling approach to assist in support design for deep mining pillars. Int. J. Rock Mech. Min. 2022, 156, 105145. [Google Scholar] [CrossRef]
  29. Gao, F.Q.; Kang, H.P.; Li, J.Z. Numerical simulation of fault-slip rockbursts using the distinct element method. Tunn. Undergr. Space Technol. 2021, 110, 103805. [Google Scholar] [CrossRef]
  30. Shi, C.; Chu, W.J.; Zheng, W.T. Block Discrete Element Numerical Simulation Technology and Engineering Application; Architecture and Building Press: Beijing, China, 2016. [Google Scholar]
  31. Fu, T.F.; Xu, T.; Zhu, W.C.; Wang, X.W. Damage characteristics of sandstone under triaxial compression based on polycrystalline discrete element method. J. Northeastern Univ. (Nat. Sci.) 2020, 41, 968–974. [Google Scholar]
  32. Guo, J.Q.; Zhang, H.Y.; Sun, F.Y.; Shi, X.Y.; Zhu, B.Z.; Guo, P. Numerical Simulation Study of Catastrophe Process for Structural–Slip Rockburst. Geotech. Geol. Eng. 2023, 41, 4007–4022. [Google Scholar] [CrossRef]
  33. Zhang, C.Q.; Feng, X.T.; Zhou, H.; Qiu, S.L.; Wu, W.P. Rockmass damage development following two extremely intense rockbursts in deep tunnels at Jinping II hydropower station, southwestern China. Bull. Eng. Geol. Environ. 2013, 72, 237–247. [Google Scholar] [CrossRef]
  34. Zhang, C.Q.; Feng, X.T.; Zhou, H.; Qiu, S.L.; Wu, W.P. Case Histories of Four Extremely Intense Rockbursts in Deep Tunnels. Rock Mech. Rock Eng. 2012, 45, 275–288. [Google Scholar] [CrossRef]
  35. Zhang, R.J.; Liu, Y.R.; Hou, S.K. Evaluation of rockburst risk in deep tunnels considering structural planes based on energy dissipation rate criterion and numerical simulation. Tunn. Undergr. Space Technol. 2023, 137, 105128. [Google Scholar] [CrossRef]
Figure 1. The 3D discrete element numerical analysis method for rockburst in deep tunnels.
Applsci 13 12396 g001
Figure 2. The 3D discrete element numerical model of rockburst: (a) Dimensions of the tunnel and structural plane; (b) Boundary conditions (Colors represents the rock mass, Black arrows represents the vertical stress, and circles represent the displacement constraint boundaries).
Applsci 13 12396 g002
Figure 3. Different structural plane geometry parameter setting forms: (a) Dip angle; (b) Length; (c) Relative distance.
Applsci 13 12396 g003
Figure 4. The distribution of principal stress difference under different conditions (unit: Pa): (a) θ = 30°; (b) θ = 45°; (c) θ = 60°; (d) L = 6.5 m; (e) L = 8.5 m; (f) L = 10.5 m; (g) D = 0 m; (h) D = 1.7 m; (i) D = 3.4 m.
Applsci 13 12396 g004aApplsci 13 12396 g004b
Figure 5. The distribution of elastic strain energy under different conditions (unit: J/m3): (a) θ = 30°; (b) θ = 45°; (c) θ = 60°; (d) L = 6.5 m; (e) L = 8.5 m; (f) L = 10.5 m; (g) D = 0 m; (h) D = 1.7 m; (i) D = 3.4 m.
Applsci 13 12396 g005
Figure 6. The distribution of fracture information under different conditions (unit: m): (a) θ = 30°; (b) θ = 45°; (c) θ = 60°; (d) L = 6.5 m; (e) L = 8.5 m; (f) L = 10.5 m; (g) D = 0 m; (h) D = 1.7 m; (i) D = 3.4 m.
Applsci 13 12396 g006aApplsci 13 12396 g006b
Figure 7. The distribution of rockburst proneness under different conditions: (a) θ = 30°; (b) θ = 45°; (c) θ = 60°; (d) L = 6.5 m; (e) L = 8.5 m; (f) L = 10.5 m; (g) D = 0 m; (h) D = 1.7 m; (i) D = 3.4 m.
Applsci 13 12396 g007
Figure 8. The influence of structural plane geometer parameters on rockburst proneness at each monitoring point: (a) Dip angle; (b) Length; (c) Relative distance. (The influence of structural plane on point D and E are nearly the same in Figure 8a,b, so the point E is ignored).
Applsci 13 12396 g008
Figure 9. Schematic of “11.28” extremely intense rockburst location and structural plane structure: (a) Map of China and location of the station; (b) Location of the tunnels; (c) Location of “11.28” rockburst; (d) Layout of the structural plane.
Applsci 13 12396 g009
Figure 10. The multivariate information distribution of surrounding rock after tunnel excavation: (a) Distribution of stress information; (b) Distribution of energy information; (c) Distribution of rockburst proneness.
Applsci 13 12396 g010
Figure 11. Comparison of “11.28” rockburst failure zone between field observation and numerical simulation: (a) Field situation of rockburst; (b) Schematic of failure area; (c) Simulation result (Red represents the area of intense rockburst proneness).
Applsci 13 12396 g011
Table 1. Intensity classification of rockburst index Crs.
Crs<19.019.0~28.028.0~40.0>40.0
Rockburst intensityNo rockburstWeak rockburstModerate rockburstIntense rockburst
Table 2. Rock calculation parameters.
Elastic Modulus (GPa)Bulk Modulus (GPa)Shear Modulus (GPa)Internal Friction Angle (°)Cohesion Force (MPa)Tensile Strength (MPa)
33.5720.7213.6453.5124.677.17
Table 3. Parameters of the block contacts.
Contact PropertiesNormal Stiffness
(GPa/m)
Shear Stiffness
(GPa/m)
Internal Friction Angle
(°)
Cohesion Force
(MPa)
Fictitious joint70.4552.2053.5124.67
Structural plane1010301
Table 4. The numerical calculation scheme.
ConditionGeometric Parameters of Structural Plane
Dip Angle (θ)Length (L)Relative Distance (D)
a308.51.7
b458.51.7
c608.51.7
d456.51.7
e458.51.7
f45101.7
g458.50
h458.51.7
i458.53.4
Table 5. Mechanical parameters of the surrounding rock [33].
Density (kg/m3)Shear Modulus (GPa)Bulk Modulus (GPa)Poisson RatioElastic Modulus (GPa)Cohesion Force (MPa)Internal Friction angle (°)Tensile Strength (MPa)
27807.6811.660.2318.9015.6025.806.50
Table 6. Boundary condition of stress [33].
σx/MPaσy/MPaσz/MPaτxy/MPaτyz/MPaτxz/MPa
−46.42−51.68−61.48−2.37−0.643.45
Disclaimer/Publisher’s Note: The statements, opinions and data contained in all publications are solely those of the individual author(s) and contributor(s) and not of MDPI and/or the editor(s). MDPI and/or the editor(s) disclaim responsibility for any injury to people or property resulting from any ideas, methods, instructions or products referred to in the content.

