Abstract
Forest ecological security is related to national ecological security. Yunnan Province has a significantly stereoscopic climate characterized by diverse and complex vegetation. Therefore, the ecological security of Yunnan Province’s forests, which span multiple climate zones, must be carefully considered. The purpose of this study is to evaluate the forest ecological security situation and influencing factors in Yunnan Province in 2017. Utilizing data from remote sensing, the Yunnan Province Yearbooks, socioeconomic statistical data, and better pressure-state-response modeling, this work produced an index system containing state and societal pressure. The evaluation indicators were weighted using a combination of entropy weighting and expert weighting, using 16 prefectures in Yunnan Province as samples. Using the fuzzy matter-element technique, the forest ecological security situation in Yunnan Province in 2017 was assessed, and the contributing causes were examined. Results indicate that there are spatial distribution differences in ecological security in various regions of Yunnan Province. The regions with the greatest indices of forest ecological security were found in Xishuangbanna in the south and Nujiang and Diqing in the northwest of Yunnan Province, while those areas with the lowest indices were distributed in Qujing and Zhaotong in the northeast and Baoshan in the west. Results of the grey relation analysis show that those factors that influence forest ecological security across different prefectures showed significant diversity. In Yunnan Province, the main influencing factors include days when the air quality reaches Level 2 or higher, the percentage of natural forest acreage and accumulation, the value of forest ecological service function per unit area, the annual average temperature, and forest coverage. The influence of the forest status index was greater than that of the forest pressure index. The findings of this work can guide decisions related to regional forest ecological security construction across multiple climate zones. In view of the differences in ecological security status and influencing factors in different regions, ecological environment governance should be adapted to local conditions to ensure the coordinated development of nature, the economy, and the ecological environment.
1. Introduction
Biological survival and development are dependent on the ecological environment, and national and regional sustainability is directly influenced by its safety. Population growth and socioeconomic development are causing increasing pressure on the environment, exacerbated contradictions between humans and nature, and a misuse of available resources [1,2,3,4]. Environmental disasters and ecological damages induced by environmental degradation and ecological calamities are increasingly threatening the growth, security, and social advancement of countries and regions all over the world [5,6]. Accordingly, ecological security issues have received significant research attention [7,8,9,10]. The importance of ecological security has also increased in China, both on a regional and national scale [11,12].
The natural ecosystem is dominated by forests that are related to national ecological security. Forests not only maintain the diversity of biological populations but also play an important role in maintaining ecological balance [13,14]. However, with the continuous development of the social economy, humans have imposed unbearable pressure on forests [15]. Human occupation and the resulting deforestation reduce both the area and accumulation of forests [16], which subsequently result in soil loss [17], vegetation reduction [18], species endangerment, ecological imbalance [19], climate change, and increased greenhouse gas emissions, all of which threaten the sustainable development of humans. Aiming at finding ways to ensure the stability of forest ecosystems, a large number of researchers are committed to forest management [20], forest ecological functions [21], forest ecological services [22], forest health [23,24,25], and forest security [26]. While many studies have assessed ecological security across regions, they have only focused on a few forest types and climatic zones and rarely evaluated the ecological security of forests spanning different climatic zones.
China has experienced rapid urbanization and socioeconomic development since its reform and opening up in 1978 [27]. However, China’s development is restricted by its availability of resources and ecological environment. Specifically, to achieve economic development, China has to break its forest ecosystems [28]. In response to this problem, researchers at home and abroad have evaluated the forest ecological security in China at the provincial and national levels [14,29,30]. The Yunnan Forest Ecological Security Index (ESI) was the highest in 2010 and the lowest in 2015 among all provinces within the Yangtze River Economic Belt [26]. There are several factors compromising forest ecological security along the belt’s 1086 counties, including the proportion of secondary industries, urbanization ratio, average per capita loan remainder from financial organizations, cumulative temperature, and wind velocity. However, security is positively influenced by demographic structure, organic materials in soil, and precipitation [26]. From 1999 to 2012, the forest ecological security of 31 provinces, autonomous areas, and municipalities in China showed an overall improvement, but huge differences were observed across these areas. The changes in the forest ecological security in these areas were mainly driven by the quantity and quality of forest resources and pressure from the population. Over the study period, China’s forest ecological security situation has shown continued improvement in all of these provinces, which indicates that China’s forest ecological security has been improved since the study began.
In the southern part of Yunnan Province, there lies a transition zone between the Qinghai–Tibet Plateau and the plains of the middle-lower reaches of the Yangtze River and the Indo-China Peninsula in the northwest corner of the province. This province is the upstream birthplace of the six major rivers in China, including the Yangtze River and Pearl River. Yunnan ranks first in China in terms of vegetation complexity and diversity. The province boasts 12 types of vegetation, including tropical rainforests, evergreen broad-leaved forests, warm coniferous forests, temperate coniferous forests, and savannas. The ecological security of the national and international ecosystems is strongly supported by Yunnan’s rich natural resources, biodiversity aggregation, and fragile ecological environment. As the ecological security barrier and biodiversity treasure house of southwest China, the province plays an important role in the country’s biodiversity conservation. However, the rapid economic development of Yunnan in recent years has greatly affected its forest ecological security. Moreover, only a few studies have evaluated the forest ecological security in Yunnan and its influencing factors. In addition, evaluations of forest ecological security only focus on particular blocks in small ranges, and a recognized evaluation index system is yet to be developed [26]. It is very important to carry out ecological security research in different regions of Yunnan Province to solve the deterioration of the ecological environment, the adverse effects on social and economic development, and to maintain the sustainable development of social economy and social stability in Yunnan Province. The Pressure-State-Response (PSR) model was used to construct an integrated system of forest ecological security evaluation indices. A combination of entropy weighting and expert weighting was used to determine the weight of each index. As part of an evaluation unit in Yunnan Province, 16 prefectures were evaluated in 2017 for their forest ecological security, and factors that influence the forest ecological security were discussed.
2. Materials and Methods
2.1. Research Area
Yunnan is a plateaued mountainous province in southwest China with coordinates of 21°8′32″–29°15′8″ N, 97°31′39″–l06°11′47″ E. It runs from east to west and north to south, 865 km in the south and 990 km in the north. The northwest has a high terrain, while the southeast has a low terrain. On the southeastern side of the Qinghai–Tibet Plateau, there is a distinct plateau monsoon climate with stereoscopic climate characteristics owing to the tilted terrain, the large elevation difference, and the complex geographical conditions and landforms. In addition, Yunnan has three climate zones: cold, warm, and hot (including subtropical). There is a distinct dry and wet season even though the differences in annual temperature are small. Temperatures in Yunnan range from 4.7 °C to 23.7 °C on average. In July, the province has the highest monthly average temperature of 11.9 °C, while January has the lowest at −2.9 °C, with a 10–15 °C difference annually. In most areas of the province, precipitation is less than 1000 mm per year, but its distribution varies widely depending on the season and the region. According to Yunnan Vegetation (1987), the province has 12 vegetation types, 34 vegetation subtypes, 169 formations, and 209 associations. These vegetation types include rainforest, monsoon forest, evergreen broad-leaved forest, hard-leaved evergreen broad-leaved forest, deciduous broad-leaved forest, warm coniferous forest, temperate coniferous forest, bamboo forest, sparse shrub grass, shrub, meadow, and lake aquatic vegetation. The vegetation types, vegetation subtypes, and formations in Yunnan account for 41.4%, 54.8%, and 30.2% of all types, subtypes, and formations in China, respectively.
2.2. Data Source
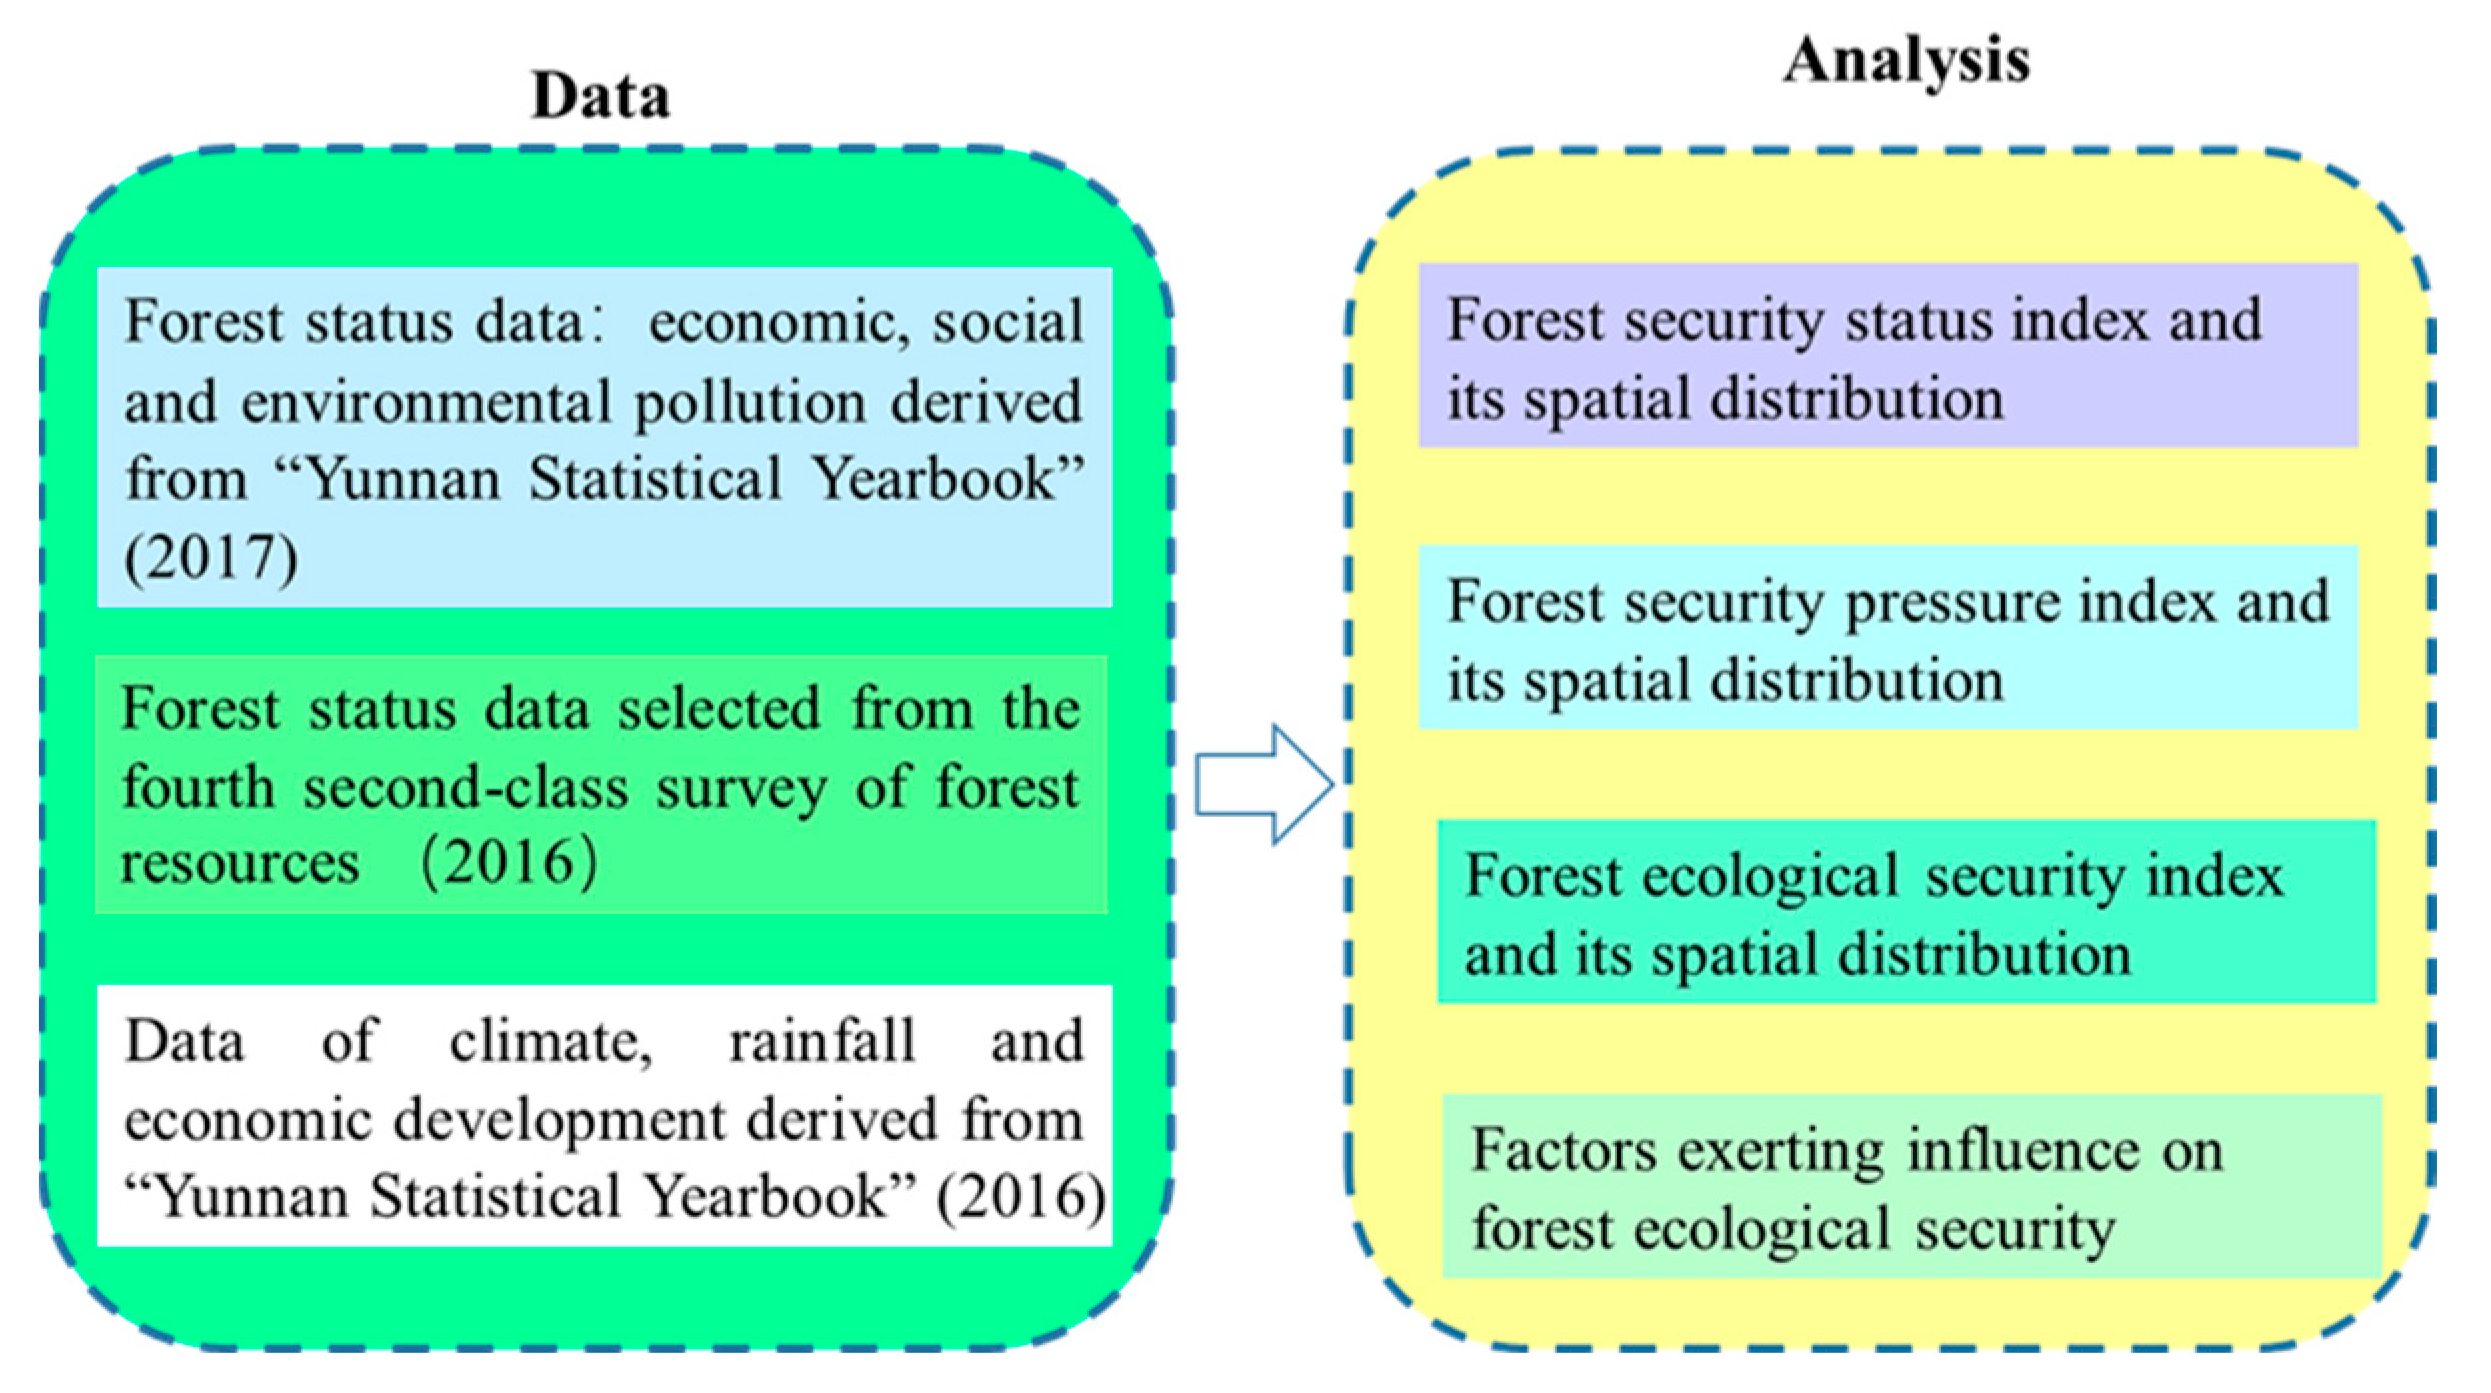
According to the Yunnan Statistical Yearbook (2017) [31], economic, social, and environmental pollution data were collected in this study. Data on the forest status of Yunnan were primarily obtained from the fourth second-class survey of forest resources conducted in 2016 [32]. Based largely on the Yunnan Statistical Yearbook (2016) [33], we collected data on weather, rainfall, and economic development. Figure 1 explains our research map as follows:
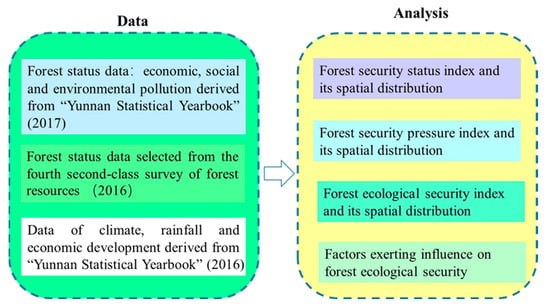
Figure 1.
Research map of the forest ecological study.
2.3. Construction of the Evaluation Index System
A forest ecological security index was developed from two angles to fully represent Yunnan’s forest ecological security status. For assessing ecological security, the PSR model is used most commonly. Accordingly, the constructed index was improved based on the pressure-state-response (PSR) model, and the pressure, state, and response indicators of this model were reorganized into forest state and forest pressure indicators. This index system can also be used for frequency analysis. For the first step of the definition of ecological security, a large number of ecological security studies with high citation rates, high author authority, and high journal levels were reviewed [26,34,35,36]. Second, the index system was constantly revised, and 28 indices were identified by reviewing technical and professional scientific models and consulting with forestry and ecology experts.
2.4. Evaluation Model and Data Processing
The multi-factor comprehensive evaluation model was used in this study. Entropy weighting and expert weighting were applied to compute for ESI as follows:
where ESI, SSI, and SPI denote the ecological security index, security state index, and security pressure index, respectively, and en and ex represent the values accounted for by entropy weighting and expert weighting, respectively.
The fuzzy matter element method and European closeness degree were used to evaluate ESI. Afterward, the ESI was revised using the ecological location model. A higher ESI value indicates a higher regional ecological security.
2.4.1. Calculation of ESI
SSI was calculated as follows:
where is the weight received by entropy weighting; is the weight received by expert weighting; and is the state index value obtained after correction.
2.4.2. Calculation of Forest Pressure Index
SPI was calculated as follows:
where is the ecological pressure index value obtained after correction.
2.4.3. Entropy Weighting
Entropy weighting can provide an objective substitution method for avoiding subjectivity in weight setting. The entropy weighting process is divided into several steps as discussed below.
Step 1: Construct the following judgement matrix:
where m is the quantity of evaluation target subjects and n is the quantity of evaluating indices.
Step 2: Distinguish the maximum and minimum values from the basic value of the index after standardizing this index. Formulas (11) and (12) were used to calculate the positive and negative indexes, respectively.
where and are the standardized data and basic data of the index, respectively, and and are the maximum and minimum raw values of the index, respectively.
Step 3: Calculate information utility () as follows:
Step 4: Calculate the weight of the j-th index as follows:
Step 5: Reset the indicator data. The data is standardized as , (j = 1, 2..., n), and is calculated as
2.4.4. Expert Weighting
To form an expert group, several professors and experts were invited. This group included some experts from the Yunnan Forestry Investigation and Planning Institute. They provided their opinions via back-to-back communications. As each expert gave a score, the advice of the experts became more concentrated. Based on these expert scores, the index weight was calculated as follows:
where k is the number of experts and is the j-th indicator of expert scoring.
2.4.5. Fuzzy Matter-Element Method
There are several indicators that make up the forest ecological security index. We used the fuzzy matter-element method to address the incompatibility of these indicators. , , and denote the fuzzy matter-element, characteristic value, and fuzzy value, respectively. If there are m specimen copies and n indicators, then represents the i-th sample, represents the j-th indicator of the i-th sample, and represents the fuzzy value of the j-th indicator of the i-th sample. The composite fuzzy matter-element of forest ecological security in Yunnan was computed as
- (1)
- Calculation of optimal membership
For each index of forest ecological security, Formulas (18) and (19) were used to calculate its superior membership degree relative to standard things:
where is the superior membership degree of each index, and and are the maximum and minimum values of each index, respectively.
On the basis of above calculation, a new fuzzy matter element was obtained as
- (2)
- Calculation of standard fuzzy matter-element and difference square fuzzy matter-element
Given that the in each index had a maximum value of 1, the standard fuzzy matter element was calculated as:
The difference square was calculated according to and , and the difference square fuzzy matter element was calculated as
2.4.6. Euclidean Closeness and Comprehensive Evaluation
The Euclidean closeness formula was used to calculate ESI after standardization. To calculate the RPH between an optimal scheme and the other schemes, we first determined the optimal scheme, and then computed its degree of closeness. An improved scheme has a higher degree of closeness. In this study, the composite fuzzy matter-element RPH was calculated using the method as follows:
where w′j is the j-th index weight; is the ESI square difference of the j-th index of the i-th sample; RPH is the set of ESI from the first to the m-th sample; and is the ESI of the i-th sample.
2.5. Spatial Distribution of the Evaluation Index
The natural breakpoint (Jenks) function in ArcGIS was used to divide each index into the following levels in order to visualize the spatial distribution of SSI, SPI, and ESI in 2017. A different color was used to represent each level on the figures: “larger”, “large”, “medium”, “small”, and “smaller”.
2.6. Correlation Analysis of Indicators
A correlation analysis was then conducted in Yunnan Province and its prefectures. On the basis of the calculated ESI for each prefecture, the grey correlation method in grey system theory, which was in SPSSAU (Version 22.0), was applied to analyze the main influencing indicators of ecological security in each prefecture in 2017. For grey correlation analysis, ESI was used as the “reference value” and 0.50 was used as the resolution coefficient. Similarly, the evaluation item dimension and the reference value were transformed to 1 using the mean value method. Using the mean correlation degree for each prefecture, the correlation coefficient of each influencing indicator was determined. Indicators were correlated between ESI and a value between 0 and 1, with a higher value indicating a stronger correlation.
3. Results
3.1. System of Evaluation Index
According to the geographical location of its 16 prefectures, Yunnan Province was divided into seven regions, namely northwest (Diqing, Nujiang, and Lijiang), west (Dali, Baoshan, and Dehong), southwest (Lincang and Puer), south (Xishuangbanna), central (Chuxiong, Yuxi, and Kunming), southeast (Honghe and Wenshan), and northeast (Zhaotong and Qujing).
As shown in Table 1, the proposed system of evaluation index of 16 prefectures in Yunnan in 2017 mainly included 19 forest status indicators and 9 forest pressure indicators. Those indicators marked with “+” were positive, whereas those marked with “−” were negative.

Table 1.
Detailed information of indicators of forest ecosystem.
3.2. Forest Security State Index and Its Spatial Distribution
Five areas had “larger, large, medium, small, and smaller” SSI values in 16 prefectures (Figure 2). Those prefectures with “larger” and “large” SSIs had high forest population and forest resources index values and a low disaster index value, whereas those with “small” and “smaller” SSIs had low forest population and forest resources index values and a high disaster index value.
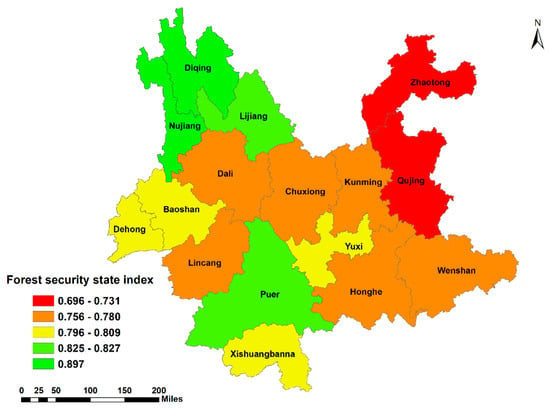
Figure 2.
Forest ecological state index in Yunnan province.
Among the prefectures, Nujiang and Diqing had “larger” SSIs (0.897), Lijiang and Puer had “large” SSIs (0.825–0.827), Baoshan, Dehong, Xishuangbanna, and Yuxi had “medium” SSIs (0.796–0.809), Dali, Lincang, Chuxiong, Kunming, Honghe, and Wenshan had “small” SSIs (0.756–0.780), and Zhaotong and Qujing had “smaller” SSIs (0.696–0.731).
In 2017, the mean SSI value of all prefectures in Yunnan was 0.795, with Nujiang and Diqing obtaining the largest value (0.897) and Zhaotong obtaining the lowest (0.696). These findings indicate an imbalanced spatial distribution of SSIs. Specifically, the northwest and south regions had the largest SSIs, while the northeast region had the smallest SSI.
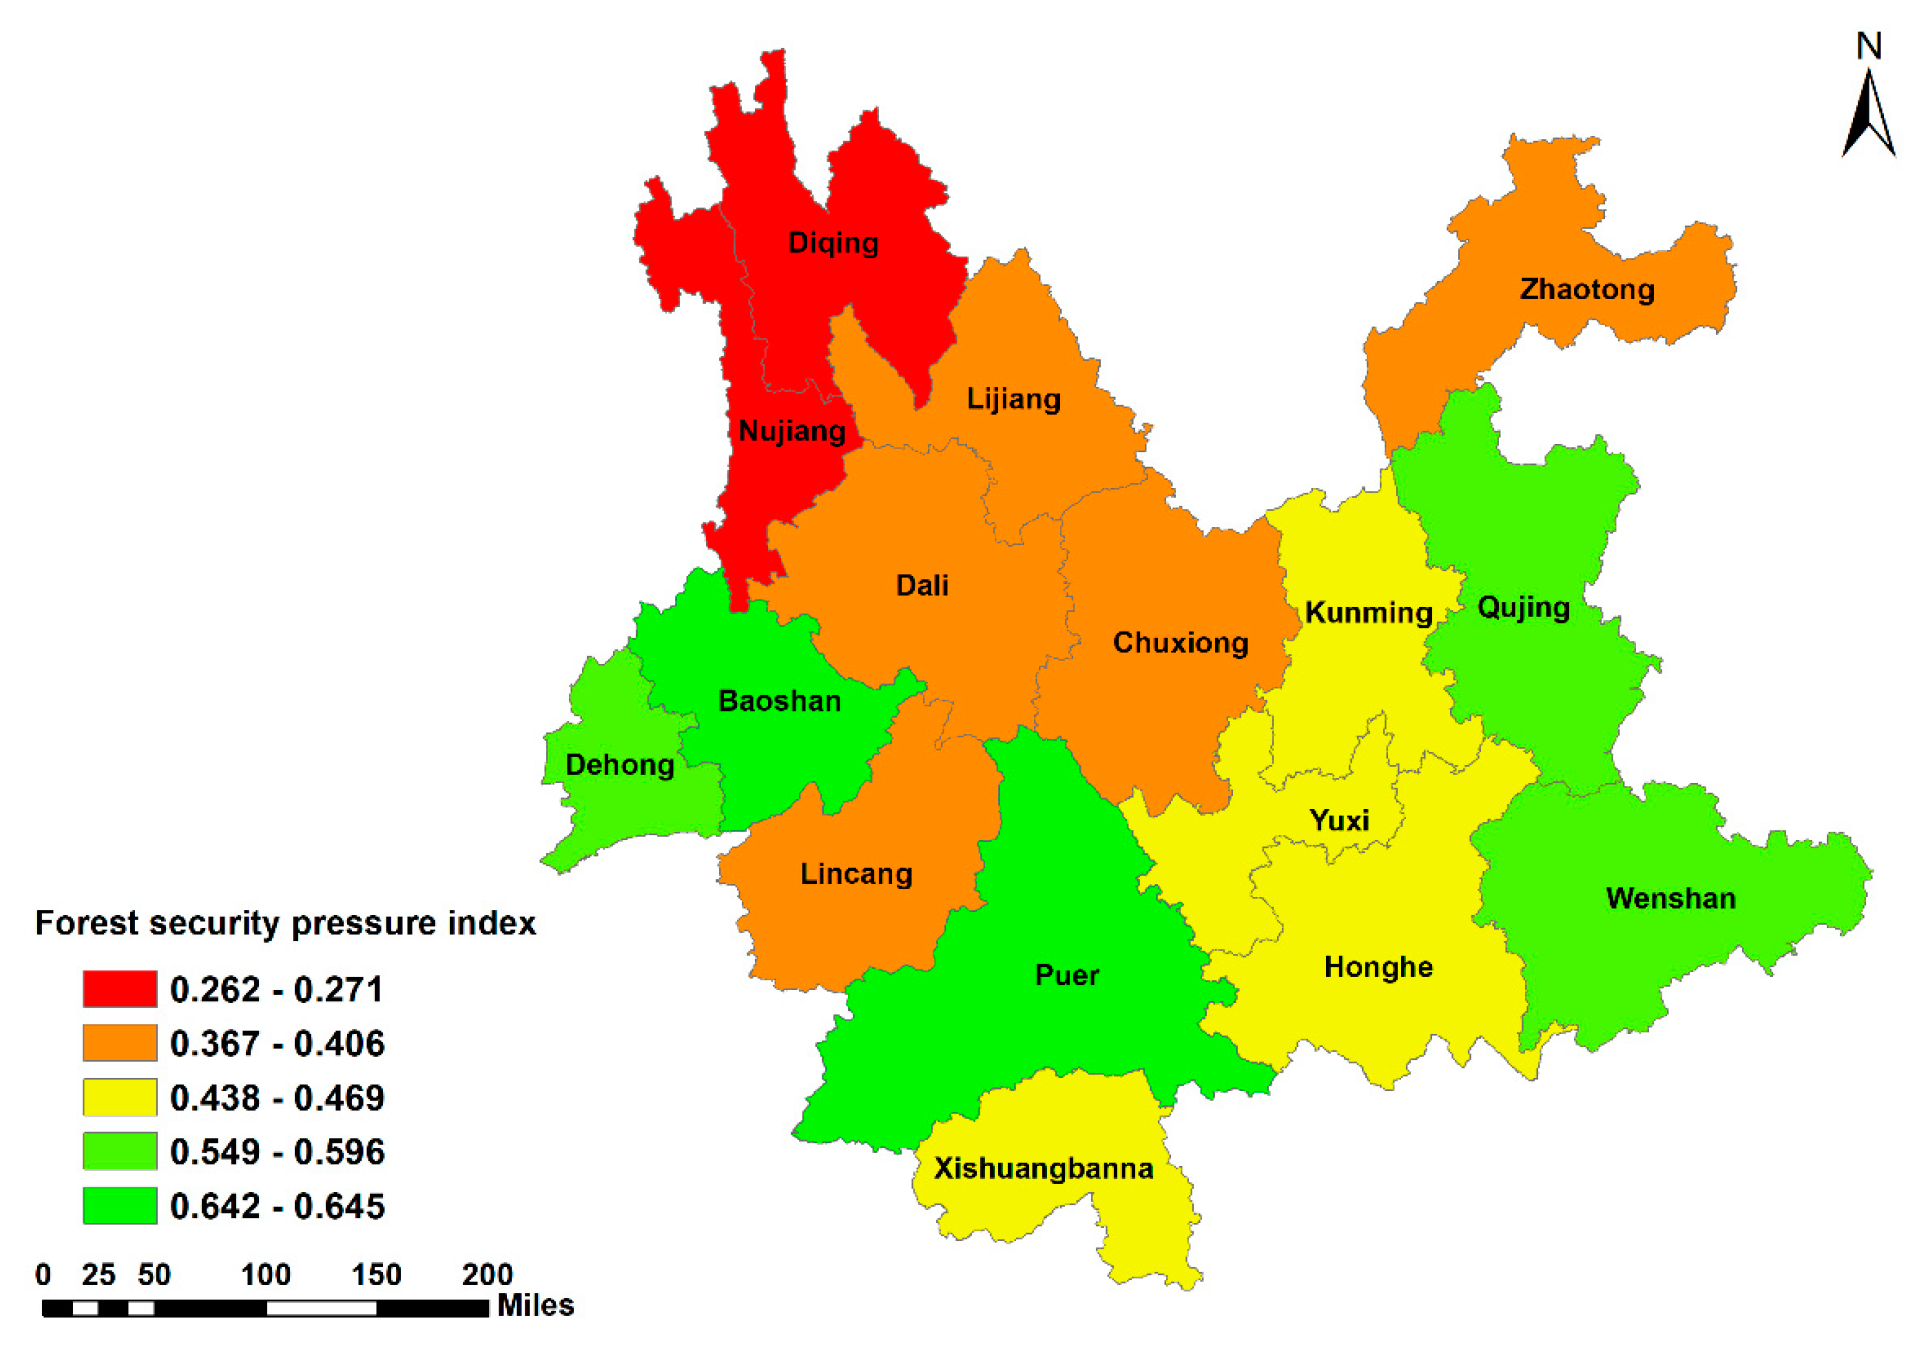
3.3. Forest Security Pressure Index and Its Spatial Distribution
The SPI spatial distribution is illustrated in Figure 3. Baoshan and Puer had the “larger” SPIs (0.642–0.645), Wenshan and Qujing had “large” SPIs (0.549–0.596), Kunming, Yuxi, Honghe, and Xishuangbanna had “medium” SPIs (0.438–0.469), Lijiang, Dali, Chuxiong, Lincang, and Zhaotong had “small” SPIs (0.376–0.406), and Nujiang and Diqing had “smaller” SPIs (0.267–0.271).

Figure 3.
Forest security pressure index in Yunnan province.
The mean SPI value of these prefectures in 2017 was 0.456, with Baoshan obtaining the largest value (0.645) and Diqing obtaining the lowest (0.252). These findings indicate an imbalanced spatial distribution of SPIs. Specifically, the northwest region had the smallest SPI, while the west (Baoshan) and southwest (Puer) regions had the largest SPIs.
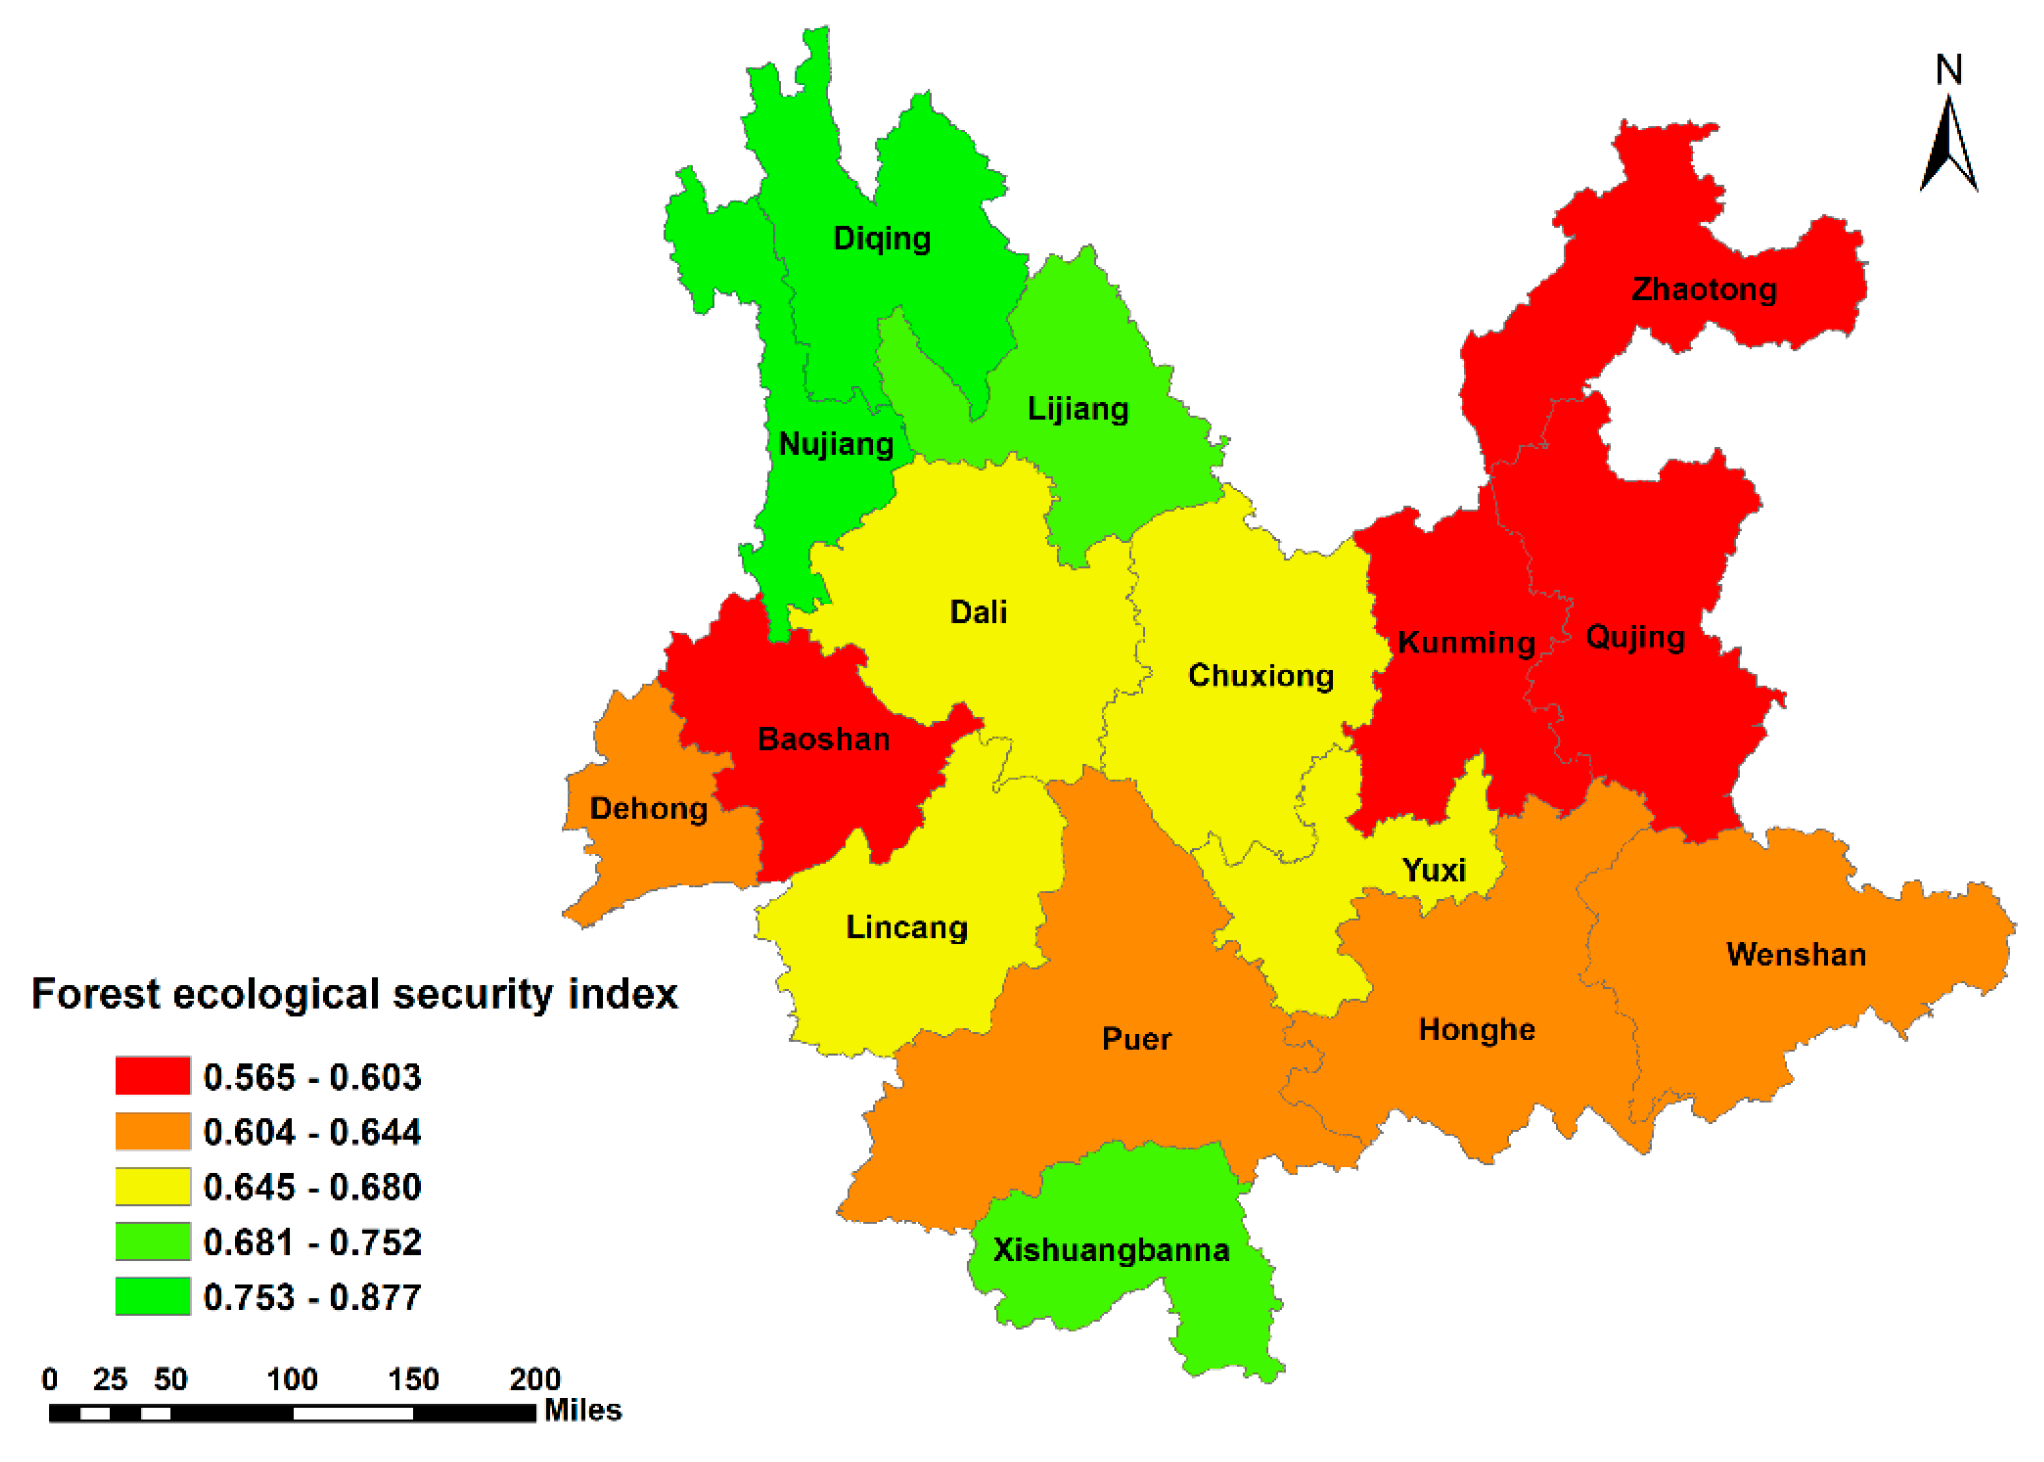
3.4. Forest Ecological Security Index and Its Spatial Distribution
The ESI spatial distribution is illustrated in Figure 4. Nujiang and Diqing had “larger” ESIs (0.753–0.877), Lijiang and Xishuangbanna had “large” ESIs (0.681–0.752), Dali, Chuxiong, Yuxi, and Lincang had “medium” ESIs (0.645–0.680), Dehong, Puer, Honghe, and Wenshan had “small” ESIs (0.604–0.644), and Baoshan, Kunming, Zhaotong, and Qujing had “smaller” ESIs (0.565–0.603).

Figure 4.
Forest ecological security index in Yunnan province.
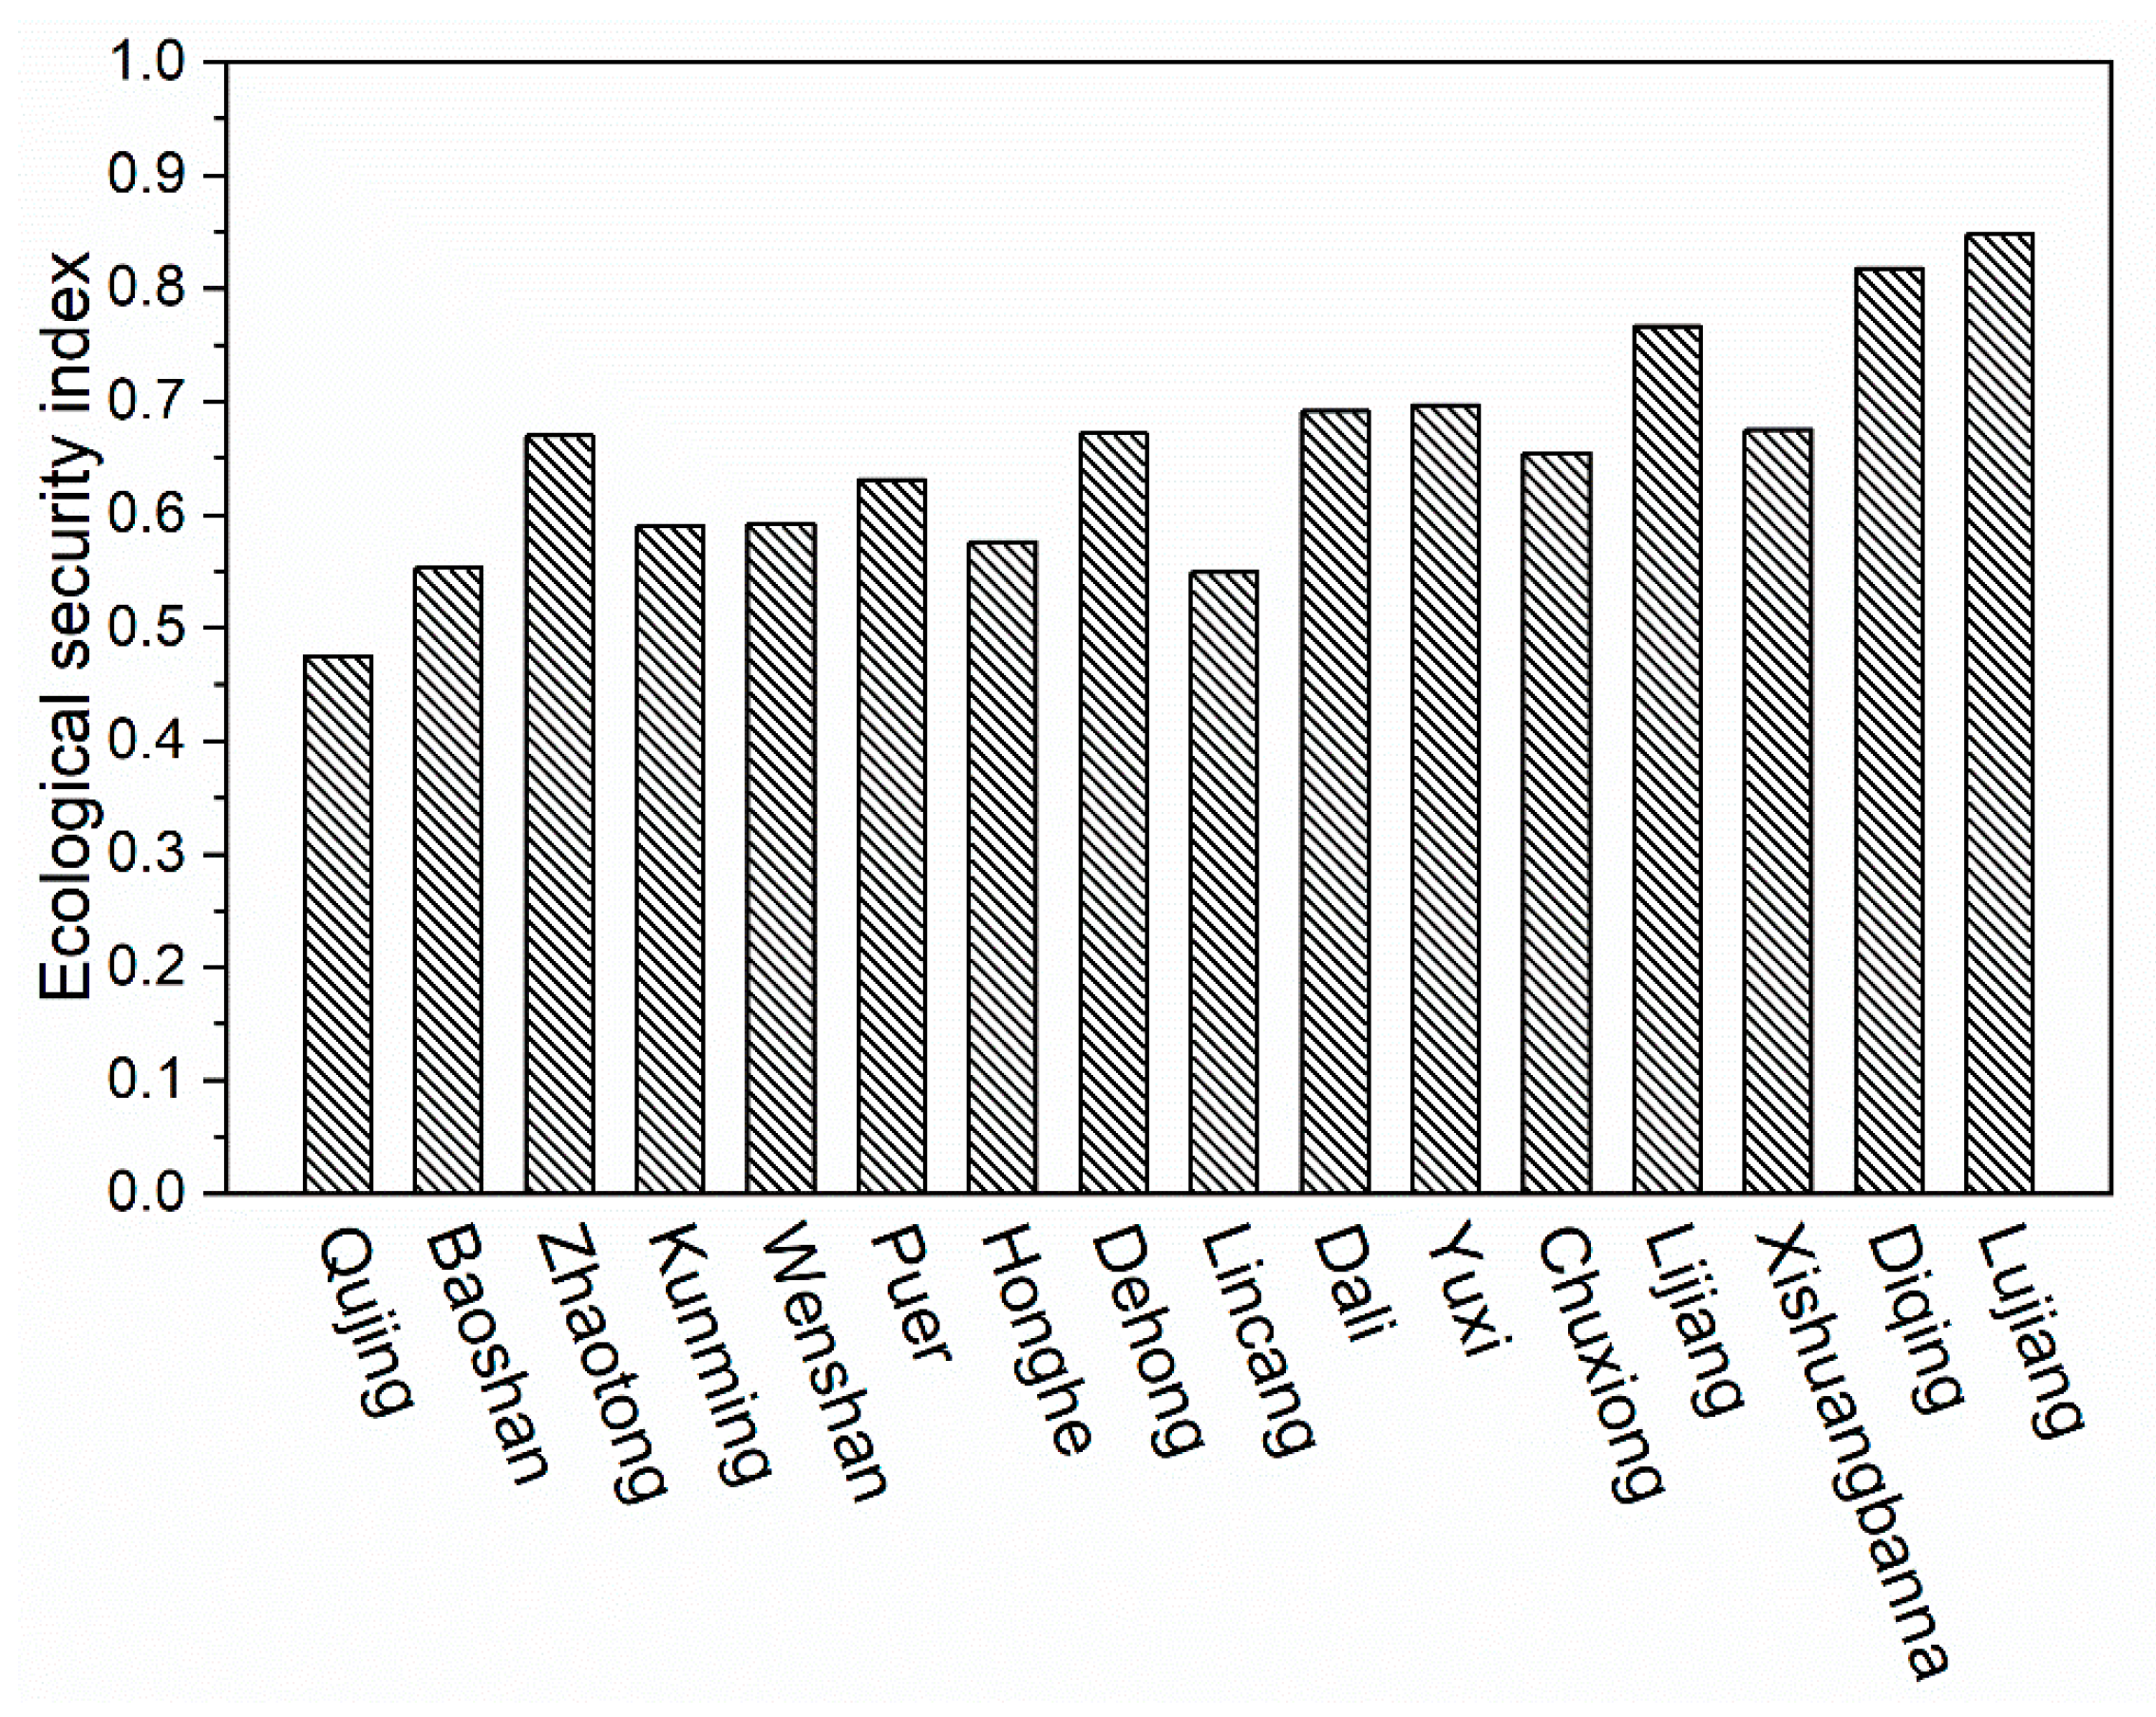
The ESI values of prefectures are shown in Figure 5. In 2017, the mean ESI value in Yunnan was 0.654, with Nujiang obtaining the highest value (0.877) and Qujing obtaining the lowest (0.565). These findings indicate an imbalanced ESI spatial distribution. Specifically, the northwest and south regions had the largest ESIs, while the northeast region had the smallest ESI.
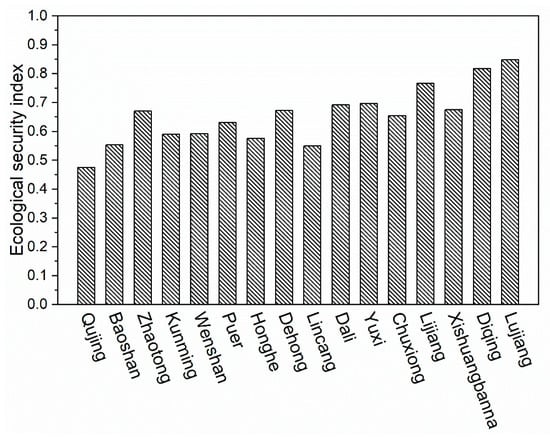
Figure 5.
Forest ecological security index in different prefectures.
Nujiang and Diqing had the largest area of natural forests in the entire Yunnan Province, with their forest coverage rate reaching up to 75%. The natural forest acreage and natural forest accumulation in these prefectures accounted for more than 90% of the total forest acreage and accumulation in the province (Table 2).
Table 2.
Pressure index values and state index values of forest ecosystem.
These two prefectures, Nujiang and Diqing, also had the highest concentration of primitive forest distribution in Yunnan and preserved the authenticity of their ecosystems. They also had low population densities of 37 and 18 people/km2, respectively. Nujiang and Diqing also had underdeveloped industrial production, which explained their relatively low degree of environmental pollution, undisturbed forest ecological environments, minimal pressures on their forest ecological systems, and highest forest ecological security index among all prefectures in Yunnan.
The low forest ecological security evaluation index of Qujing and Zhaotong can be ascribed to several reasons. First, these prefectures have a long history of development that is accompanied by high population density, extensive damage to their forests, low forest coverage, high pressure on their forest ecosystems, and threatened forest ecological security. As shown in Table 2, Qujing had a population density of 209 people/km2 and a forest coverage of 43.33%. The secondary industry in this prefecture accounted for 39.39% of its entire economy, and its resource consumption was second only to the provincial capital of Kunming. Meanwhile, Zhaotong had a population density of 242 people/km2, a forest coverage of 34.98%, and a natural forest acreage of only 52.12%, most of which were residual secondary forests. The secondary industry in this prefecture accounted for 43.5% of its entire economy, hence producing huge amounts of environmental pollution that greatly disturbs its forest ecological environment [24].
3.5. Factors Influencing Forest Ecological Security
3.5.1. Prefecture-Specific Influences
Forest ecological security was influenced differently by the influencing factors in 16 prefectures based on gray correlation degree (Table 3 and Table 4), thereby suggesting huge differences in the influencing factors in these prefectures. The major influencing factors in Nujiang included the percentage of natural forest stock (0.993), forest coverage (0.976), natural forest acreage (0.964), intensity of chemical fertilizer application (0.944), and intensity of government forestry investment (0.924). The gray correlation degree of forest state index in this prefecture was greater than that of its forest pressure index, thereby indicating that humans were not the main pressure factor that threatened forest ecological security in Nujiang. Meanwhile, the major influencing factors in Qujing, which obtained the lowest forest ecological security index in the whole of Yunnan, included forest ecological service function value per unit acreage (0.988), forest coverage (0.987), mixed forest percentage (0.983), forest age composition (0.974), and annual average temperature (0.957), thereby suggesting that forest pressure was not the main influencing factor. The major influencing factors in Lijiang, which obtained a high ecological security index, included percentage of secondary industries (1), number of days when the air quality reached or exceeded level II (0.987), forest coverage (0.981), population density (0.979), percentage of the primary industry (0.977), and annual average temperature (0.968). In sum, forest status and forest pressure indicators had the greatest influence on forest ecological security in these prefectures.
Table 3.
Grey correlations of forest state index in prefectures of Yunnan Province.
Table 4.
Grey correlations of forest pressure index in Yunnan Province.
3.5.2. Influencing Factors in Yunnan Province
Forest status indicators had the greatest influence on forest ecological security in the entirety of Yunnan Province (Table 5). The major indicators included the number of days when the air quality reached or exceeded level II (0.965), natural forest acreage (0.964), natural forest stock (0.960), forest ecological service function per unit acreage (0.952), annual average temperature (0.948), forest cover (0.948), and percentage of the secondary industry (0.931). The correlation among the other forest pressure indicators was below the forest status index value, thereby confirming forest status as the main influencing factor in the province.
Table 5.
Gray correlative analysis result of Yunnan Province.
4. Discussion
4.1. Forest State Index Is the Main Influencing Factor of Forest Ecological Security
The number of days when the air quality reached or exceeded level II represents the environmental quality of forest growth. A larger number of days corresponds to better environmental quality, which is beneficial for the growth of trees in forests [14]. Given that the plant community in natural forests is more stable than that in artificial forests, a higher percentage of natural forest acreage corresponds to better forest quality. The forest coverage reflects the forest cover acreage. Therefore, higher forest coverage corresponds to a more complete forest ecosystem and a better forest state. In this case, improving forest coverage, strengthening natural forest protection, and maintaining the authenticity of forest ecosystems are important measures for improving forest ecological security.
Annual average temperature greatly affected forest ecological security in Yunnan Province. The results of this study are similar to those of Lu’s study [26]. The effects of temperature on forest cover are very complex [26,37]. On the one hand, productivity level is determined by temperature, and forest growth is accelerated by an increase in temperature. On the other hand, the transpiration of plants is accelerated by an increase in temperature, which in turn aggravates drought and suppresses the growth of forest stock [26,38].
4.2. Negative Influence of Industrial Structure on Forest Ecological Security
Forest ecological security in the province was greatly affected by the percentage of secondary industries due to their high energy consumption and environmental pollution [38]. The discharge water from this industry also contaminates the surface water and groundwater for forests, and exhaust gas dumping has a negative effect on vegetation respiration. Qujing, Zhaotong, and Kunming all had relatively high percentages of secondary industries and energy consumption, both of which imposed great pressures on their forests.
To solve the above problems, local governments can adjust their industrial structures, facilitate the development of tertiary industries, and reduce the percentage of secondary industries. They should vigorously support and develop a circular economy and build industrial parks to form an ecological industrial chain where different companies can share resources and recycle their waste.
4.3. Socioeconomic Conditions Significantly Affect Forest Ecological Security
Socioeconomic conditions have obvious effects on forest ecological security, the results of this study are similar to those of other research studies [26,39,40]. Highly developed areas have a high demand for wood that drives their occupation of forest land, and their local economic development generates serious levels of pollution that impose great pressure on their forests and threaten their forest ecological security. Zhang et al. also got similar research results [41]. The significance of the current study is also supported by recent research [42,43,44]. Meanwhile, in economically backward areas, humans minimally interfere with nature, thereby minimizing pressures on their forest ecosystems. For example, Qujing and Kunming are economically developed prefectures in Yunnan with a low forest ecological security index and high pressure on forest ecological security, while Nujiang, Diqing, and Xishuangbanna are economically backward prefectures with high ESI and low pressure on forest ecological security.
Therefore, the management of forests in different prefectures should be adjusted according to the local conditions. For instance, local governments can standardize the logging system in economically developed areas, balance the conservation and exploitation of forests, and restrict the instant development of high-pollution industries. Local governments of economically backward areas should focus on accelerating their economic development while protecting their environment.
The proposed evaluation index system needs to be improved further. First, the data used in the study were mainly taken from statistical yearbooks rather than measured in the field. Therefore, the evaluation of forest ecological security in this study may be distorted to some extent. Second, Yunnan has a complex ecosystem, and ecological security can be influenced by many factors. Even the 28 evaluation indicators used in this study have their own limitations.
5. Conclusions
While Yunnan Province has a relatively safe forest ecological environment, huge differences can be observed in the forest ecological security levels of its prefectures. Nujiang and Diqing in the northwest and Xishuangbanna in the south obtained the highest ecological security index, whereas Qujing, Zhaotong, and Kunming in the northeast received the lowest index. The main factors that affect the forest ecological environment also varied across the prefectures of Yunnan due to their natural geographical conditions, climate, and economic development. The forest status index was the main factor that influenced forest ecological security in the province. Forest ecological security was clearly related to social economic development in various prefectures. Population density, economic development, and environmental pollution have significant effects on the forest environment. Some measures should be adopted to address these problems, such as regulating the harvesting of forest resources, balancing the conservation and exploitation of forest resources, and limiting the instant development of high-pollution industries.
Future studies may consider establishing multi-disciplinary, multi-scale, and multi-level indicators. Third, the weighting method of the proposed forest ecological security index system had its own limitations. Specifically, combining entropy weighting with expert weighting could not overcome the deviation of weight setting from the actual problem. Future studies should consider using measured data and adopting additional analysis methods to ensure a precise evaluation and to bring their analysis results closer to the facts.
Author Contributions
Conceptualization, writing, data curation, and original draft preparation, Z.C.; supervision, reviewing, and editing, funding, C.Z.; data curation, reviewing, and editing, S.T.R. All authors have read and agreed to the published version of the manuscript.
Funding
The Yunnan Special Fundamental Research Project General Project (Grant No. 202101AT070178).
Institutional Review Board Statement
Not applicable.
Informed Consent Statement
Not applicable.
Data Availability Statement
Data will be provided on demand.
Acknowledgments
The authors acknowledge the Yunnan Special Fundamental Research.
Conflicts of Interest
The author declares that there are no known competing financial interests or personal relationships that influenced the work reported in this paper.
References
- Pham, V.T.; Do, T.A.T.; Tran, H.D.; Do, A.N.T. Assessing the impact of ecological security and forest fire susceptibility on carbon stocks in Bo Trach district, Quang Binh province, Vietnam. Ecol. Inform. 2022, 74, 101962. [Google Scholar] [CrossRef]
- Costanza, R.; Arge, R.D.; de Groot, R.; Farber, S.; Grasso, M.; Hannon, B.; Limburg, K.; Naeem, S.; Oneill, R.V.; Paruelo, J.; et al. The value of the world’s ecosystem services and natural capital. Nature 1997, 387, 253–260. [Google Scholar] [CrossRef]
- Walker, B.; Hollin, C.S.; Carpenter, S.R.; Kinzig, A. Resilience, adaptability and transformability in social-ecological systems. Ecol. Soc. 2004, 9, 5. [Google Scholar] [CrossRef]
- Hooper, D.U.; Chapin, F.S.; Ewel, J.J.; Hector, A.; Inchausti, P.; Lavorel, S.; Lawton, J.H.; Lodge, D.M.; Loreau, M.; Naeem, S.; et al. Effects of biodiversity on ecosystem functioning: A consensus of current knowledge. Ecol. Monogr. 2005, 75, 3–35. [Google Scholar] [CrossRef]
- Wang, Y.; Zhang, D.; Wang, Y. Evaluation Analysis of Forest Ecological Security in 11 Provinces (Cities) of the Yangtze River Economic Belt. Sustainability 2021, 13, 4845. [Google Scholar] [CrossRef]
- Chu, X.; Deng, X.Z.; Jin, G.; Wang, Z.; Li, Z.H. Ecological security assessment based on ecological footprint approach in Beijing-Tianjin-Hebei region, China. Phys. Chem. Earth 2017, 101, 43–51. [Google Scholar] [CrossRef]
- Zou, S.; Zhang, L.; Huang, X.; Osei, F.B.; Ou, G. Early ecological security warning of cultivated lands using RF-MLP integration model: A case study on China’s main grain-producing areas. Ecol. Indic. 2022, 141, 109059. [Google Scholar] [CrossRef]
- Zhang, R.; Li, P.; Xu, L. Evaluation and analysis of ecological security based on the improved three-dimensional ecological footprint in Shaanxi Province, China. Ecol. Indic. 2022, 144, 109483. [Google Scholar] [CrossRef]
- Han, B.; Liu, H.; Wang, R. Urban ecological security assessment for cities in the Beijing-Tianjin-Hebei metropolitan region based on fuzzy and entropy methods. Ecol. Model. 2015, 318, 217–225. [Google Scholar] [CrossRef]
- Li, W.; Kang, J.; Wang, Y. Spatiotemporal changes and driving forces of ecological security in the Chengdu-Chongqing urban agglomeration, China: Quantification using health-services-risk framework. J. Clean. Prod. 2023, 389, 136135. [Google Scholar] [CrossRef]
- Sun, K.; He, W.; Shen, Y.; Yan, T.; Liu, C.; Yang, Z.; Han, J.; Xie, W. Ecological security evaluation and early warning in the water source area of the Middle Route of South-to-North Water Diversion Project. Sci. Total Environ. 2023, 868, 161561. [Google Scholar] [CrossRef] [PubMed]
- Sun, M.; Zhang, L.; Yang, R.; Li, X.; Zhang, Y.; Lu, Y. Construction of an integrated framework for assessing ecological security and its application in Southwest China. Ecol. Indic. 2023, 148, 110074. [Google Scholar] [CrossRef]
- Wang, Y.; Zhang, L.; Song, Y. Study on the Construction of the Ecological Security Pattern of the Lancang River Basin (Yunnan Section) Based on InVEST-MSPA-Circuit Theory. Sustainability 2023, 15, 477. [Google Scholar] [CrossRef]
- Guo, Y.; Ma, X.; Zhu, Y.; Chen, D.; Zhang, H. Research on Driving Factors of Forest Ecological Security: Evidence from 12 Provincial Administrative Regions in Western China. Sustainability 2023, 15, 5505. [Google Scholar] [CrossRef]
- Lima Magalhaes, J.L.; Lopes, M.A.; de Queiroz, H.L. Development of a Flooded Forest Anthropization Index (FFAI) applied to Amazonian areas under pressure from different human activities. Ecol. Indic. 2015, 48, 440–447. [Google Scholar] [CrossRef]
- Yu, D.; Zhou, L.; Zhou, W.; Ding, H.; Wang, Q.; Wang, Y.; Wu, X.; Dai, L. Forest Management in Northeast China: History, Problems, and Challenges. Environ. Manag. 2011, 48, 1122–1135. [Google Scholar] [CrossRef]
- Sun, L.; Liu, Z.; Zheng, M.; Cai, Q.; Fang, H. Temporal variations of ecological security with soil and water loss stress in black soil region of northeast China: A case study on Baiquan County. Springerplus 2013, 2, S6. [Google Scholar] [CrossRef]
- Kirkpatrick, J.B.; Marsden-Smedley, J.B.; Di Folco, M.-B.; Leonard, S.W.J. Influence of grazing and vegetation type on post-fire floristic and lifeform composition in Tasmania, Australia. Plant Ecol. 2016, 217, 57–69. [Google Scholar] [CrossRef]
- Moraes, R.; Landis, W.G.; Molander, S. Regional risk assessment of a Brazilian rain forest reserve. Hum. Ecol. Risk Assess. 2002, 8, 1779–1803. [Google Scholar] [CrossRef]
- Martín-Fernández, S.; Martinez-Falero, E. Sustainability assessment in forest management based on individual preferences. J. Environ. Manag. 2018, 206, 482–489. [Google Scholar] [CrossRef]
- Yang, J.; Dai, G.H.; Wang, S.R. China’s national monitoring program on ecological functions of forests: An analysis of the protocol and initial results. Forests 2015, 6, 809–826. [Google Scholar] [CrossRef]
- Rideout, D.B.; Ziesler, P.S.; Kernohan, N.J. Valuing fire planning alternatives in forest restoration: Using derived demand to integrate economics with ecological restoration. J. Environ. Manag. 2014, 141, 190–200. [Google Scholar] [CrossRef] [PubMed]
- Trumbore, S.; Brando, P.; Hartmann, H. Forest health and global change. Science 2015, 349, 814–818. [Google Scholar] [CrossRef] [PubMed]
- Haidari, H.; Namiranian, M.; Gahramani, L.; Zobeiri, M.; Shabanian, N. Study of vertical and horizontal forest structure in northern zagros forest (case study: West of Iran, oak forest). J. Exp. Biol. 2013, 3, 268–278. [Google Scholar]
- Hartmann, H.; Bastos, A.; Das, A.J.; Esquivel-Muelbert, A.; Hammond, W.M.; Martínez-Vilalta, J.; McDowell, N.G.; Powers, J.S.; Pugh, T.A.M.; Ruthrof, K.X.; et al. Climate change risks to global forest health: Emergence of unexpected events of elevated tree mortality worldwide. Annu. Rev. Plant Biol. 2022, 73, 673–702. [Google Scholar] [CrossRef]
- Lu, S.; Tang, X.; Guan, X.; Qin, F.; Liu, X.; Zhang, D. The assessment of forest ecological security and its determining indicators: A case study of the Yangtze River Economic Belt in China. J. Environ. Manag. 2020, 258, 110048. [Google Scholar] [CrossRef]
- Guan, X.; Wei, H.; Lu, S.; Dai, Q.; Su, H. Assessment on the urbanization strategy in China: Achievements, challenges and reflections. Habitat Int. 2018, 71, 97–109. [Google Scholar] [CrossRef]
- Li, F.; Lu, S.; Sun, Y.; Li, X.; Xi, B.; Liu, W. Integrated Evaluation and Scenario Simulation for Forest Ecological Security of Beijing Based on System Dynamics Model. Sustainability 2015, 7, 13631–13659. [Google Scholar] [CrossRef]
- Zhang, Q.; Wang, G.; Mi, F.; Zhang, X.; Xu, L.; Zhang, Y.; Jiang, X. Evaluation and scenario simulation for forest ecological security in China. J. For. Res. 2019, 30, 1651–1666. [Google Scholar] [CrossRef]
- Gao, X.; Wang, G.Y.; Innes, J.L.; Zhao, Y.; Zhang, X.C.; Zhang, D.H.; Mi, F. Forest ecological security in China: A quantitive analysis of twenty five years. Glob. Ecol. Conserv. 2021, 32, e01821. [Google Scholar] [CrossRef]
- Statistical Bureau of Yunnan Province. Yunnan Statistical Yearbook; China Statistics Press: Beijing, China, 2017. [Google Scholar]
- Yunnan Provincial Forestry Department. Yunnan Forest Resources Survey Report; Yunnan Publishing Group, Co., Ltd.: Kunming, China; Yunnan Science and Technology Press: Kunming, China, 2016. [Google Scholar]
- Statistical Bureau of Yunnan Province. Yunnan Statistical Yearbook; China Statistics Press: Beijing, China, 2016. [Google Scholar]
- Huang, H.; Chen, B.; Ma, Z.; Liu, Z.; Zheng, S.; Yu, W.; Liao, J.; Hu, W.; Du, J.; Chen, G. Assessing the ecological security of the estuary in view of the ecological services- A case study of the Xiamen Estuary. Ocean Coast. Manag. 2017, 137, 12–23. [Google Scholar]
- Vogt, K.A.; Vogt, D.J.; Palmiotto, P.A.; Boon, P.; Ohara, J.; Asbjornsen, H. Review of root dynamics in forest ecosystems grouped by climate, climatic forest type and species. Plant Soil 1996, 187, 159–219. [Google Scholar] [CrossRef]
- Elias, P.E.; Burger, J.A.; Adams, M.B. Acid deposition effects on forest composition and growth on the Monongahela National Forest, West Virginia. For. Ecol. Manag. 2009, 258, 2175–2182. [Google Scholar] [CrossRef]
- Wang, D.; Li, G.; Mo, Y.; Cai, M.; Bian, X. Effect of Planting Date on Accumulated Temperature and Maize Growth under Mulched Drip Irrigation in a Middle-Latitude Area with Frequent Chilling Injury. Sustainability 2017, 9, 1500. [Google Scholar] [CrossRef]
- Ni, J. Impacts of climate change on Chinese ecosystems: Key vulnerable regions and potential thresholds. Reg. Environ. Change 2011, 11, S49–S64. [Google Scholar] [CrossRef]
- Lin, L.; Fan, Y.; Xu, M.; Sun, C. A Decomposition Analysis of Embodied Energy Consumption in China’s Construction Industry. Sustainability 2017, 9, 1583. [Google Scholar] [CrossRef]
- Barr, C.M.; Sayer, J.A. The political economy of reforestation and forest restoration in Asia–Pacific: Critical issues for REDD+. Biol. Conserv. 2012, 154, 9–19. [Google Scholar] [CrossRef]
- Zhang, X.H.; Gao, J.X.; Dong, W.; Song, C.Y. Ecological security assessment and affectingfactors analysis of longitudinal range gorge region in Yunnan Province China. J Univ. Sci. Technol. Beijing 2018, 30, 1–6. (In Chinese) [Google Scholar]
- Wu, A.; Zhao, Y.X.; Qin, Y.J.; Liu, X.; Shen, H. Analysis of Ecological Environment Quality and Its Driving Factors in the Beijing-Tianjin-Hebei Region of China. Sustainability 2023, 15, 7898. [Google Scholar] [CrossRef]
- Liu, D.; Chang, Q. Ecological security research progress in China. Acta Ecol. Sin. 2015, 35, 111–121. [Google Scholar] [CrossRef]
- Fan, J.; Abdulmana, A.; Wang, L.; Wang, Z.; Liu, H. Dynamic assesment and sustainability strategies of ecological security in the irtysh ricer basin of xinjiang, China. China Geogr. Sci. 2023, 33, 393–409. [Google Scholar] [CrossRef] [PubMed]

Disclaimer/Publisher’s Note: The statements, opinions and data contained in all publications are solely those of the individual author(s) and contributor(s) and not of MDPI and/or the editor(s). MDPI and/or the editor(s) disclaim responsibility for any injury to people or property resulting from any ideas, methods, instructions or products referred to in the content. |
© 2023 by the authors. Licensee MDPI, Basel, Switzerland. This article is an open access article distributed under the terms and conditions of the Creative Commons Attribution (CC BY) license (https://creativecommons.org/licenses/by/4.0/).