Abstract
Spectrum-based fault localization (SBFL), a widely recognized technique in automated fault localization, has limited effectiveness due to its disregard for the internal information of the program under test suites. To overcome this limitation, a novel TrustRank-based fault localization (TRFL) technique is introduced. TRFL enhances traditional SBFL by incorporating internal data dependencies of the program under the test suite, thereby providing a more comprehensive analysis. It constructs a node-weighted program execution network and employs the TrustRank algorithm to analyze network centrality and re-rank program entities based on their suspiciousness. Furthermore, a bidirectional TrustRank algorithm (Bi-TRFL) is extended that takes into account the influence relationship between network nodes for more accurate fault localization. When applied to large-scale datasets with real faults, such as Defects4J, TRFL, and Bi-TRFL, it significantly outperforms traditional SBFL methods in fault localization. They demonstrate up to 40% and 13% improvement in Top-1 and Top-5 rankings, respectively, proving their robustness and efficiency with minimal sensitivity to related parameters.
1. Introduction
Software testing is a critical step in ensuring software quality and reliability and can effectively reduce the enormous economic losses and personnel safety risks caused by software faults [1]. In the software development process, traditional manual debugging requires huge human resources and time costs, making automated testing particularly important [2,3]. In this process, software fault localization is a key step. Fault localization refers to the process of identifying the specific locations or program entities within a software system that are responsible for causing observed failures or errors. It involves analyzing various sources of information, such as execution traces, test cases, and program dependencies, to pinpoint the root causes of failures. The goal of fault localization is to narrow down the search space and provide developers with actionable insights to efficiently and effectively fix the identified faults. By accurately localizing faults, developers can save time and effort in debugging and troubleshooting software systems. The emergence of program fault localization technology has improved software quality, reduced development resources, and reduced economic losses [4]. Therefore, researching and applying software fault localization technology can further improve the accuracy and efficiency of software fault localization technology, which is of great significance to software development and maintenance.
In the past few decades of academic exploration, program fault localization has been widely studied. A large number of fault localization techniques has been proposed, including program spectrum-based fault localization techniques [5,6,7], mutation-based program fault localization techniques [2,8,9], slicing-based program localization techniques [10,11], information retrieval-based program localization techniques [12], and machine learning-based fault localization techniques [3,13]. These methods have undoubtedly contributed to the research of program fault localization, but there is still a large amount of information and features hidden within the program itself and during the program running process that have not been explored by current research. Therefore, it is necessary to find more efficient methods to improve fault localization technology. Among the above research methods, spectrum-based fault localization technology is called the most widely used program fault localization technology due to its lightweight, scalability, and applicability [2,14]. However, traditional fault localization methods only consider the coverage information of test cases, which directly affects the effectiveness of program fault localization. Redundant coverage information can also reduce the accuracy of fault location and consume testing personnel’s energy. In addition, due to the limitations of the suspiciousness value calculation formula (the calculation method is based only on program coverage information), if elements are ranked solely based on the results of the suspiciousness value calculation, it will lead to problems with elements being equally ranked in the list of sorts where identical suspiciousness values are placed in the same position [15].
Some researchers focus their studies on the creation and modification of fault localization formulas [16], while others attempt to improve the accuracy of fault localization formulas by modifying or enhancing the program spectrum [17]. However, these research perspectives overlook the interaction between programs and the data flow within programs. Data dependency can serve as a new research perspective as it can reveal the correlation and influence between variables in a program, thereby aiding in understanding and locating faults. Data dependency can not only reveal the execution flow of a program but also narrow down the scope of fault localization. In complex software systems, faults may be hidden in a large amount of code. By analyzing data dependencies, attention can be focused on code segments directly related to faults, thereby improving fault localization efficiency.
In this paper, in order to overcome the limitations of existing SBFL methods, the data dependency relationships within the program during runtime are fully considered by utilizing test cases and program execution information. The data dependencies obtained through analysis are combined into a program execution network within the program under test or between the program under test and the test suite. Ultimately, a network centrality analysis algorithm is used to analyze suspicious situations in the program. Based on an understanding of the current research status, an automatic debugging technology called TrustRank-based fault localization (TRFL) is proposed. The TrustRank algorithm is used to fully consider implicit testing information to improve traditional fault localization technology. TRFL captures links between test cases and program entities (e.g., traditional coverage spectra) as well as links between internal program elements (e.g., data dependency graphs). The TrustRank algorithm can adaptively assign different weights to program elements based on their impact, and program entities linked with suspicious entities may also be more suspicious because they may have propagated fault states to linked entities. In addition, an improved TrustRank algorithm (Bi-TRFL) is proposed that fully considers fault propagation between adjacent links of fault program elements and positive influence propagation between fully trusted nodes and adjacent nodes. Finally, program elements are ranked according to their analyzed suspiciousness levels by the algorithm, which helps eliminate interference from duplicate suspiciousness scores and perform fault localization. Details about TRFL and Bi-TRFL are presented in Section 3. The experimental object is the specific location of 348 real faults in the Defects4J benchmark for fault localization.
Overall, this research work makes the following contributions:
- (1)
- A fault localization research method is proposed that extracts data dependency relationships during program execution combines effective content analyzed by SBFL with the TrustRank method, and rebuilds new suspicious score levels, thereby expanding the original SBFL method and improving automatic debugging efficiency while reducing the workload and research costs of researchers;
- (2)
- The TrustRank algorithm (TRFL) is improved to obtain a bidirectional TrustRank algorithm (Bi-TRFL), which fully considers the influence relationship between node outdegree and indegree on adjacent nodes in the network. Experiments show that Bi-TRFL can improve the overall ranking of fault locations in the suspicious list;
- (3)
- TRFL and Bi-TRFL are compared with traditional SBFL, using Top-N ranking and EXAM scores on the Defects4J benchmark dataset for experimental evaluation. The experimental results show that TRFL is significantly better than the state-of-the-art SBFL techniques (e.g., TRFL can improve nearly 40% over traditional SBFL at Top-1, almost all traditional localization techniques can be improved using calculation formulas, while Bi-TRFL can save 10% of overall localization costs compared to TRFL);
- (4)
- The performance of the algorithm is verified by modifying the decay factor in the TRFL and Bi-TRFL methods. The experimental results show that changing the decay factor within 4% has little effect on the performance of the algorithm, demonstrating the good robustness of the algorithm.
The remaining research work in this paper is arranged as follows. Section 2 reviews related work on spectrum-based fault localization (SBFL), complex networks, network centrality, etc. Then, the proposed TRFL and Bi-TRFL methods are analyzed in Section 3. Section 4 explains the experimental dataset, tools, and evaluation metrics. In Section 5, the experimental results are discussed. Finally, conclusions are drawn, and prospects for future research work are presented in Section 6.
2. Related Work
2.1. Spectrum-Based Fault Localization Method
In software fault localization technology research, SBFL is one of the more mature methods currently applied [2]. SBFL is a dynamic program analysis technique [18] that integrates coverage information and execution results (pass or fail) of a test case set into a program spectrum form. Then, based on a statistical suspiciousness calculation formula, it calculates a suspiciousness value as a fault probability for program entities (such as statements, predicates, branches, basic blocks, and methods). According to this probability, it sorts program entities from high to low and finally obtains a ranking list to assist workers in locating program entities.
The concept of program spectrum was proposed in 1987 [19], which is easy to obtain and can intuitively reflect program running information. In 2000, to solve the problem of date data format and storage caused by century-spanning changes, program spectrum was first applied to software fault localization. In order to more intuitively reflect the information in the program spectrum on the location of fault program entities, Jones et al. [19] proposed a suspiciousness value calculation formula called Tarantula. The principle of Tarantula is that program entities executed by more failed test cases are more likely to be erroneous than other entities. After Tarantula appeared, many other suspiciousness value calculation formulas were introduced, such as the Jaccard formula based on the clustering analysis method [20]; Ochiai evolved from biology-inspired [21], Ochiai 2, which considers the influence of unexecuted or passed test cases [22], Op2, which performs best in single fault localization [22], and Dstar, which has been proven to have the best and most effective comprehensive ranking effect [23]. However, there is no suspiciousness value calculation formula that can perfectly apply to all tested programs [24].
In order to improve the accuracy and efficiency of software fault localization technology, researchers have explored and improved it from two points of view: feature extraction; and sorting technology. Xie et al. [25] proposed a universal data augmentation method to improve the effectiveness of the program spectrum, which balances the number of failed and successful test cases in the original data, providing new ideas for fault localization method research. Some people have also proposed a fault localization formula based on call frequency information, creating a call count structure that depends on the number of times a dependent test case is executed to eliminate the influence of a large number of repeated calls generated by loops on the fault localization formula. In addition, Zhang et al. [26] proposed to analyze the relationship between test cases and tested programs through the PageRank algorithm, assign weights to different test cases, and combine fault localization technology with complex network centrality analysis methods for the first time. Overall, researchers are currently trying to reduce the limitations of the program spectrum on SBFL technology. As for the research described in this paper, it attempts not only to use program spectrum but also to improve traditional SBFL methods by capturing the link relationship between test cases and program entities using a bidirectional TrustRank algorithm.
2.2. Program Execution Network
Program execution network can simulate complex data flow during program execution, establish impact propagation and interaction relationships between program entities, and understand program dynamic behavior. The idea of a program execution network comes from a complex network model, which has been widely used by researchers due to its robustness and applicability. Studies have shown that complex networks are powerful tools for researchers to understand complex software programs [27], as they can analyze the importance of program entities and understand program context relationships. It is worth mentioning that with the support of the complex network model, a program execution network can comprehensively consider the entire relationship of large programs.
Qu et al. [28] proposed a dynamic changing network that combines dynamic call relationships during program execution with complex networks to construct a call network with methods as nodes and call relationships as edges. Zakari et al. [29] also used software network technology and analyzed fault localization by measuring network metrics. In order to analyze the impact relationship of faults, Vancsics et al. [30] constructed a new method based on counting different function call contexts to analyze the propagation of program faults. In order to reduce the impact range of fault nodes in software networks, Zhao et al. [31] constructed a directional call network, proposed their own influence propagation relationship calculation method, and analyzed the local centrality of fault nodes in software networks. This paper uses a software execution network to represent data flow behavior during program execution and identifies and locates fault program statements’ positions by leveraging complex network analysis capabilities.
2.3. TrustRank Algorithm
TrustRank is a link-ranking algorithm proposed by Zoltan Gyongyi and Hector Garcia-Molina from Stanford University and Jan Pedersen from Yahoo (Hong Kong, China), which is used to optimize query speed and quality [32]. It is a variant of the PageRank algorithm used in Google search engine. In the traditional PageRank algorithm, the ranking of a page is based on the link relationship between pages, and pages with more links are more likely to be considered important. However, this method is vulnerable to link manipulation and spam pages, which can lead to a decrease in the quality of search results. TrustRank mitigates these issues by introducing the concept of trusted sources. TrustRank aims to combat spam by filtering out unreliable networks. This method requires selecting a small group of seed pages that are evaluated by experts. Once reputable seed pages are manually identified, crawling that extends outward from the seed set will look for similar reliable and trustworthy pages. The reliability of TrustRank decreases as the distance between documents and seed sets increases.
The intuition behind the TrustRank algorithm is that for every node in a network, if it is an important node, then nodes linked to it should also be equally important due to its influence, and this importance relationship will weaken with increasing distance between nodes. In other words, nodes with closer links to important nodes are relatively more important than those linked to less influential nodes in the same network.
Zhang et al. [33] used the TrustRank algorithm to differentiate citation values of different-level journals by leaving journals as seeds for evaluating journal rankings. Li et al. [34] proposed an auditor suspicious ranking algorithm based on community discovery and TrustRank to solve the problem of lack of supervised learning data for detecting spam senders. The experimental results show that this algorithm performs better than baseline methods in ranking spam senders and can effectively improve their ranking performance in unsupervised environments.
Inspired by complex network link ranking algorithms, TrustRank simulates the propagation of program faults by considering the link relationship between nodes. In network analysis, this simulation can help us better understand the structure and behavior of networks. Moreover, TrustRank propagates the degree of influence of a node to its adjacent nodes through influence propagation algorithms. This propagation mechanism can help us evaluate the entire network and better identify important nodes in the network. In addition, different versions of programs have different link relationships, which makes the complex network to be analyzed more diversely. By using the TrustRank algorithm, the influence propagation relationship between these networks can be better identified and their structure better understood. This study starts with the degree of impact of software faults and analyzes the impact of program entities’ importance on software suspiciousness using the TrustRank algorithm.
3. Proposed Approach
The focus of this experimental research is to enhance the accuracy of software fault localization techniques by analyzing the centrality of software execution networks through the TrustRank algorithm, and it is completed through the following steps. First, by extracting data behavior from the dynamic execution process of the program under test from the test case set, the topological structure of the software execution network is constructed. Considering that most SBFL techniques are limited by redundant test case execution information, in order to alleviate the negative impact of redundant coverage information on SBFL calculation formulas, the obtained network structure will focus on failed test cases’ execution traces on the program under test. On the other hand, a software network that has undergone redundancy elimination can also eliminate ranking ties among program entities caused by identical suspicion values. Then, based on traditional SBFL techniques, suspicion values are calculated for program entities in the software execution network and used as node weights in the software execution network. These weights serve as a basis for selecting seed sets in the TrustRank algorithm. Finally, we execute the TrustRank algorithm to assign error probabilities to nodes in the software execution network to improve the performance of traditional fault localization methods.
Here, the TrustRank algorithm determines the suspicion level of program elements based on the data dependencies of the program under test and their propagation effects, which is also a key indicator of program localization techniques. From the perspective of influence propagation between program elements, the following research hypotheses are proposed for this experiment:
- (1)
- The more suspicious program elements pointing to a certain program element, the higher the suspicion value of that element;
- (2)
- The higher the suspicion value of suspicious program elements pointing to a certain element, the higher the suspicion value of that element;
- (3)
- The more trustworthy program elements pointing to a certain program element, the lower its suspicion value;
- (4)
- The lower the suspicion value of trustworthy program elements pointing to a certain element, the lower its suspicion value.
The method framework used in this paper can be found in Figure 1. The method used in this paper is characterized by constructing a program execution network and using the TrustRank algorithm to evaluate the risk of each execution statement. As shown in the figure, the program fault localization process is divided into two stages: data pre-processing and algorithm construction. In the first stage, two parts of data will be obtained. One is a brief analysis of the tested program using traditional fault localization techniques, and the analysis results will serve as the basis for subsequent algorithms. The other is to extract features of the target program’s source code using a dynamic call relationship generator. In the second stage, an analysis model is constructed based on the above features, and the TrustRank algorithm is used to rank statements.
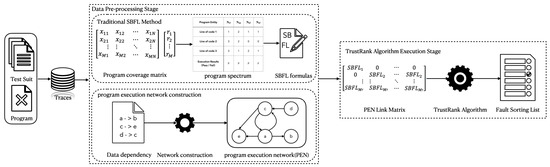
Figure 1.
A Framework for Fault Localization Methods Based on TrustRank Algorithm.
Next, the implementation process of these two stages will be introduced in turn.
3.1. Data Pre-Processing
3.1.1. Program Fault Localization Using Traditional SBFL Techniques
Program spectra are an important concept in frequency-based fault localization techniques, used to represent information about a program’s dynamic behavior and execution paths. It is generated by collecting and analyzing data during program execution and can help developers understand the program’s execution process. In fault localization research, program spectra are seen as a measurement unit and are typically described in matrix form to represent statement coverage during program runtime. Statement coverage spectra are one of the most basic types of program spectra. It records which statements were executed and which statements were not executed during program execution. When using statement coverage spectra in practice, the results of test case execution are often combined, and comparing the program coverage spectra corresponding to passed and failed test cases can help rank program elements using suspiciousness calculation formulas. The more frequently a program element is executed in failed tests, and the less frequently it is executed in passed tests, the more suspicious it is considered to be.
Suspiciousness value is an indicator used in frequency-based fault localization techniques to measure the potential fault likelihood at different locations in the code. By analyzing program spectra information, four values in Table 1 can be obtained. Based on these four parameters, the suspiciousness value of each program element in the program can be calculated using the suspicious value calculation formula in Table 2, which only lists some commonly used formulas. Algorithm 1 shows the process of calculating suspiciousness values using the SBFL algorithm.
| Algorithm 1 SBFL Algorithm | |
| Input: Program: P Spectrum: Sp | |
| Output: Suspicious statements list: S | |
| 1: | for si in P do |
| 2: | get Nef, Nep, Nnf, Nnp from Sp |
| 3: | Dstar = (Nef)**2/(Nep + Nnf) |
| 4: | end for |
| 5: | S = rank si in P according to Dstar (si) |
| 6: | return S |

Table 1.
Four major elements of spectrum-based program fault localization techniques.
Table 2.
Spectrum-based formulas for calculating the suspicion value of program fault localization.
3.1.2. Construction of Program Execution Network
The program execution trajectory records the execution path between the test case and the tested program. In this process, static software code analysis information is not considered because it contains a lot of relationship information, such as call relationships, dependency relationships, control flow relationships, and data flow relationships, that are not executed during program runtime. Information about redundant relationships may mislead the propagation of fault effects and cause the fault location to deviate from reality.
In this paper, a record of the runtime program execution path is obtained based on the development and use of Java tracer. This process involves parsing the source code, building a symbol table, and then performing control flow and data flow analysis. First, the definition, read, and write operations of each variable in the code are identified. By tracking these operations, a transfer path between variables can be established. When performing the control flow analysis, conditional branches, loops, and method call relationships are identified to capture the code execution process. Next, based on the results of data flow analysis, a data dependency graph is constructed where each line of code is treated as a node. It is identified which variables are read or written in each line of the code, and then the dependency relationships between the variables are established. The edges in the graph represent data transfer paths pointing to variable usage in other lines of the code. When the execution of the test code is complete, the dependency relationships of the data are fully saved in the trace files.
The trace file records a binary tuple DR that represents the data dependency relationships during the program execution as follows:
The source code line is an identifier for the starting point of the data transfer that affects the data transfer between variables. In dependency relationships, the value of the source code lines affects the target code lines. The target code line is an identifier for the endpoint affected by the data transfer in each line of the code. In dependency relationships, the target code lines are affected by the source code lines. The identifier is a combination of the full class name, the method name, and the code line. It should be noted that this paper treats code lines as unique identifiers, meaning that when class names and method names are the same but code lines are different, they will be recognized as different dependency relationships in the analysis granularity. This paper defines DR as a generalized data dependency relationship that also applies to representing some special relationships such as method calls, control dependency relationships, and cross-file dependency relationships. Special relationships are handled normally because they do not affect the program network construction and link-sorting algorithm analysis.
To make the program execution path clear, the dependency relationships in the trace file will be further divided into program execution sets, which refer to the set of data dependency relationships executed by the test case t. The definition of Tracet is as follows:
For a given program fault version, the execution of the test t will produce a single execution trajectory Tracet. Therefore, extracting program execution processes and calculating test coverage can be easily performed in subsequent processes. In addition, for ease of storage and retrieval, the identifiers for each line of the code are replaced with unique integers.
The dynamic execution relationship of the program and the test case coverage information can be extracted from the trace file. By constructing a program execution network that integrates implicit information from program spectra and interaction relationships, fault localization suspiciousness analysis based on complex networks becomes possible. Since traditional frequency-based fault localization techniques require dynamic testing processes, the Program Execution Network (PEN) is constructed as a node-weighted directed dynamic network representing program execution trajectories as follows:
where is a set of program element nodes. is a set of program execution trajectories, where is the endpoint of the execution relationship, and is the starting point of the execution relationship. means that has an impact on . is a set of node weights, and the weight of each node is the suspiciousness value of the program element, which can be calculated using the formula in Section 3.1.1. To focus on TrustRank algorithm analysis, this study focuses on failed test case execution trajectories when constructing the program execution networks.
3.2. Algorithm Construction
3.2.1. Basic TrustRank Algorithm
TrustRank is a web ranking algorithm designed to evaluate the credibility and authority of web pages to help search engines provide higher-quality search results. It focuses on obtaining information from trusted sources, transmitting credibility through links, and reducing reliance on untrusted or spam pages, ultimately affecting ranking results.
Before the algorithm is executed, a seed set needs to be selected. These seeds are often manually selected. The so-called seed set is a set of nodes that need to be pre-marked before the algorithm is executed. These nodes are used as standards for information transmission to obtain scores for all nodes. First, they need to be added to the seed set according to the coverage and test results of the test case based on specific screening criteria, and initial values are assigned to these nodes. In the program execution network, the suspiciousness of program nodes is used as a metric indicator for discovering key nodes in the network. Nodes with higher suspiciousness are more likely to propagate program faults to nearby nodes, so they occupy relatively high positions in the program execution network. Since the calculation method of frequency-based suspiciousness value is relatively simple and highly suspicious nodes are mostly program fault nodes, suspiciousness value is used as an indicator for selecting seed sets.
The initial assignment method of seed set S generally selects highly suspicious nodes in the program execution network as suspicious nodes for the assignment; that is, only suspicious nodes are assigned values. Selecting n highly suspicious nodes to form a seed set, then the number of suspicious nodes in the seed set is n, and each node is assigned 1/n, while other nodes are assigned 0. The specific formula is as follows:
where ϕ represents a set of highly suspicious nodes in the seed set, and n represents the number of nodes in the set ϕ. According to this partitioning method, the fault impact relationship between highly suspicious nodes in the program execution network can be better understood. The selection of seed sets is very important and may affect the propagation path of impact relationships and the allocation of impact degree, thereby affecting the effectiveness of the TrustRank algorithm.
In Section 3.1.2, the network composed of data dependency relationships between test cases and tested programs during program execution has been successfully viewed as a graph, where nodes represent program elements and edges represent data dependency relationships between program elements. The number of pointing relationships from the program element p to the program element q represents the weight of the edge <p, q>. The transition matrix represents the probability matrix of data transfer between program elements. The transition matrix T in the program execution network is as follows:
where ε is a set of edges and out(q) is the outdegree of node q.
The core suspiciousness value formula for the TrustRank algorithm is as follows:
where is a decay factor, usually set to 0.85 [32], T is the transition matrix of the program execution network, and d is the initial seed set value. In general, the initial TR value is set to the seed set value, and these seed nodes are the starting point of the algorithm, gradually transmitting impact relationships and affecting the impact scores of other nodes. Algorithm 2 describes the execution process of the TrustRank algorithm.
| Algorithm 2 The TRFL algorithm | |
| Input: The transfer matrix: T Number of nodes of the program execution network: N Number of restrictions on the seed set: L Threshold for controlling suspicious seeds: H Decay factor: Number of iterations: M | |
| Output: Suspiciousness values for all nodes: TR | |
| 1: | //Assignment of values to nodes in a program execution network using SBFL formula s = SBFL(...) |
| 2: | //Reorder the elements in N in descending order of their s-scores σ = Rank({1,…,N}, s) |
| 3: | //Segmentation of the seed set according to the score of s d = 0N |
| 4: | for i = 1 to L do |
| 5: | if σ(i) ≥ H then |
| 6: | d(σ(i)) = 1 |
| 7: | end if |
| 8: | end for |
| 9: | //Normalized static score distribution vector d d = d/|d| |
| 10: | //Calculating TrustRank Score TR = d |
| 11: | for i = 1 to M do |
| 12: | TR = αB ·T· TR +(1−α) · d |
| 13: | end for |
| 14: | return TR |
3.2.2. Improved TrustRank Algorithm
As mentioned in Section 3.2.1, since there is a method of dividing the seed set according to suspicious nodes, there is also a way to divide it according to completely trustworthy and safe nodes. That is to say, according to the method of dividing by suspicious nodes, the seed set can also be divided according to the condition that the program suspiciousness value is lower than a certain threshold. In this way, selecting m nodes with lower suspiciousness to form a seed set, then the number of trustworthy nodes in the seed set is m. According to the impact logic of suspicious propagation, the impact relationship between trustworthy nodes and fault nodes in the program execution network should be a reverse propagation relationship because it will have a positive impact on fault propagation in the entire network and reduce the value of suspicious programs. Unlike Formula (4), the specific formula is as follows:
where ψ represents a set of trustworthy nodes in the seed set, and m represents the number of nodes in set ψ.
Considering that the TrustRank algorithm only considers one-way impact propagation relationships, the improved TrustRank algorithm considers that node scores propagate simultaneously in both directions in the network. There are two common link relationships in program execution networks: links from suspicious nodes to trustworthy nodes; and links from trustworthy nodes to suspicious nodes. In other words, the improved TrustRank algorithm no longer solely relies on the increase in suspicion level brought about by suspicious nodes when judging the influence relationship between nodes in a complex network. Instead, it takes into account the inhibitory effect of trustworthy nodes on their suspicious programs. The final node ranking queue takes into account the mutual constraints of error nodes and trustworthy nodes.
Combining two methods of seed set partitioning based on Formulas (4) and (7), the mixed assignment method is used to assign values to seed sets for the algorithm impact propagation relationships using both forward and reverse impact relationships between the nodes. This method assigns initial values to both trusted and spam nodes in seed sets, with initial values for trusted nodes being positive and initial values for spam nodes being negative. The calculation method is as follows:
where n represents the number of suspicious nodes in the seed set; m represents the number of trustworthy nodes in the seed set; ϕ represents a set of suspicious nodes in the seed set, and ψ represents a set of trustworthy nodes in the seed set.
Since the improved TrustRank algorithm is based on bidirectional information propagation, if only positive values are assigned to suspicious seeds, or only negative values are assigned to trustworthy seeds when assigning initial values to seed sets, it cannot fully utilize the inhibitory features of bidirectional transmission models. Therefore, this paper uses the mixed assignment method to assign values to seed sets. On the one hand, the negative values are assigned to trustworthy seed nodes, and the algorithm will suppress suspicious value propagation to trustworthy nodes during iteration; on the other hand, the positive values are assigned to suspicious nodes, which will also suppress trust value propagation in suspicious nodes.
Therefore, it is necessary to consider an additional inverse transition matrix U:
where in(p) is the indegree of node p.
At this time, combining transition matrix T and inverse transition matrix U to obtain a mixed transition matrix td can achieve bidirectional information propagation:
where γ and δ are two parameters representing the proportion of forward and reverse propagation, respectively, and γ + δ = 1.
Algorithm 3 describes the execution of the bidirectional TrustRank algorithm.
| Algorithm 3 The Bi-TRFL algorithm | |
| Input: The transfer matrix: T The inverse transfer matrix: U Coefficients of the control transfer matrix: γ Coefficients of the control inverse transfer matrix: δ Seed set: d Decay factor: Number of iterations: M | |
| Output: Suspiciousness values for all nodes: t | |
| 1: | //Calculating the hybrid transfer matrix td = γ · T + δ · U |
| 2: | //Calculating the bidirectional TrustRank score for i = 1 to M do |
| 3: | t = αB · td · t + (1 − α) · d |
| 4: | end for |
| 5: | return t |
4. Experimental Settings
4.1. Experiment Subjects
In this experiment, the proposed method was evaluated on Defects4J [35], a mature experimental dataset widely used in software fault research, mainly for Java programs. Defects4J provides a set of real open-source Java projects that contain artificially inserted real defects and versions that have fixed these defects. The goal of Defects4J is to help researchers and developers test and improve fault detection and repair techniques. Defects4J is widely used in academia and industry and is considered a standard defect research benchmark. Many research papers and projects have used Defects4J for experimentation and evaluation. The experiment used the real fault dataset Defects 4J (version 1.1.0), which includes six open-source Java projects: JFreeChart; Google Closure Compiler; Apache Commons Lang; Apache Commons Math; Joda-Time; and Mockito. All fault versions of the benchmark programs can be downloaded from the Defects4j repository. For each fault, Defects4J provides a series of tools and scripts for downloading, compiling, running projects, and accessing defect and repair versions. Note that 348 real faults selected from Defects4J were used, excluding the project Mockito, which tracks system issues, and the other 16 faults because the program faults were not located inside methods or constructors, and some fault projects could not obtain execution traces through the trackers. Table 3 shows detailed information about the Defects4J dataset.
Table 3.
Defects4J dataset.
4.2. Experimental Tools
Javassist (Java Programming Assistant version 3.29.1-GA) is an open-source library for bytecode manipulation at runtime (https://github.com/jboss-javassist/javassist, accessed on 12 August 2022). It allows the developers to dynamically generate, modify, and enhance the bytecode of Java classes without modifying the source code. Javassist provides a higher-level API that makes bytecode manipulation easier, especially for tasks such as generating proxies, implementing AOP, and dynamic code generation. In this paper, Javassist is used to explore the program’s execution trace in the following way: First, the byte code representation of the target class is obtained through the ClassPool class in the Javassist library, which can obtain the underlying byte code data of the class. Then, through the CtClass class, detailed information such as methods, fields, and annotations of the class can be accessed. For each method, its bytecode is obtained using Javassist, and its instructions are carefully analyzed. In this analysis process, bytecode instructions are examined one by one with special attention to variable read/write operations to accurately trace data propagation paths. In bytecode, variables are usually represented by the index or name. By determining the local variables and class member variables used in methods and their read/write operations in instructions, variable propagation paths within methods and between different methods can be accurately traced through detailed analysis of these instructions. Note that all third-party libraries and Java internal libraries were ignored during analysis for time efficiency and research accuracy.
The information obtained through analysis tools is ultimately transformed into a program execution network structure that conforms to the input format for subsequent algorithm analysis. The specific experimental data network structure information is shown in Table 4.
Table 4.
Structural information of the PEN.
4.3. Evaluation Metrics
Two widely used performance evaluation metrics, EXAM and Top-N, are used in this paper to evaluate the effectiveness of the studied fault localization technique. Note that not all metrics consider test code.
- EXAM (Expected-Maximum)
The EXAM is a commonly used performance evaluation metric for fault localization techniques [36]. It measures the percentage of elements that must be checked before discovering the fault element. Its calculation formula is as follows:
where N represents the number of lines of code in the codebase, n represents the total number of faults in the program, and rank(i) represents the number of lines of code that need to be checked when detecting the i-th fault. The EXAM fully considers the cost required for the researchers to locate the program faults. In the best case, the researchers only need to check as many program elements as there are faults by sorting them according to their suspiciousness scores to locate all faults. In the worst case, the researchers need to check all the elements in the list. Therefore, a smaller value of the EXAM indicates better fault localization performance because it means that the fault locations are closer to the front in sorting;
- Top-N
The Top-N is another performance evaluation metric for fault localization techniques that mainly focuses on whether the top N recommended code locations contain fault locations [36]. In Top-N metrics, the top N recommended code locations by fault localization techniques are considered candidates, and their performance is evaluated by comparing whether they contain true fault locations or not. That is, counting how many correct fault locations are included in the top N recommended code locations. A higher value of Top-N indicates a better performance because it means that more correct fault locations are included in the top N recommended code locations by fault localization techniques. It is worth noting that the developers usually only check elements with high rankings [37], so N is generally set to numbers such as 1, 3, and 5. Top-N is extremely important in practical fault localization applications.
5. Results and Analyses
Using the proposed research method, this paper fully mines the hidden information inside the tested program and proposes a program execution network structure. By using network centrality analysis algorithms, the accuracy of fault localization techniques is improved. From the input data of the algorithm, it can be seen that the actual effect of the algorithm may be influenced by the seed set and decay factor. To comprehensively verify the effectiveness and practicality of the experiment, this section selects six SBFL techniques that determine seed set selection results as benchmarks, whose calculation formulas are defined in Table 2, and evaluates the proposed method from three aspects:
RQ1: How does the fault localization technique based on the TrustRank algorithm compare with the traditional SBFL techniques in terms of accuracy and efficiency?
RQ2: How does the improved bidirectional TrustRank algorithm compare with the TrustRank algorithm in terms of performance?
RQ3: How does the decay factor in the TrustRank algorithm affect the performance of the proposed algorithm?
Similar to the traditional SBFL experiments, the most time-consuming stage in this paper is obtaining test-case execution information that meets experimental content using a tracker. The subsequent time for network construction and TrustRank algorithm operation is only a few seconds, which has little impact on fault localization performance and can be ignored. Therefore, this chapter will not analyze time as a research variable.
5.1. RQ1: How Does the Fault Localization Technique Based on the TrustRank Algorithm Compare to Traditional SBFL Techniques in Terms of Accuracy and Efficiency?
In this case study, the primary task is to explore the overall performance of the proposed method. Six suspiciousness calculation formulas from traditional SBFL methods were used in the experiment to verify the performance improvement brought by using the TrustRank algorithm analysis. Traditional SBFL analysis was performed on five projects that met the requirements of this experiment in Defects4J, and six benchmark performances of fault localization techniques were established for each project. In the comparison process, the benchmark was compared with the best results of the TrustRank algorithm analysis. Since the proposed method requires using traditional SBFL formulas to initialize node weights in PEN and divide seed sets according to these weights, it is necessary to separately evaluate the experimental results using these six SBFL formulas. Here, in order to analyze in detail the best performance of the TrustRank algorithm under different SBFL calculation formulas, experiments were evaluated from several metrics, including the Top-1, Top-3, Top-5, and EXAM. The TrustRank algorithm used default settings, i.e., a = 0.85, and seed sets were controlled at 30% of the total node count. Table 5 presents overall results where different rows represent different effectiveness metrics, and different columns represent projects and suspiciousness calculation formulas used.
Table 5.
Experimental results of SBFL and TRFL for each project in Defects4j.
In the 348 projects of Defect4j, Top-N shows varying degrees of growth between SBFL and TRFL techniques. Figure 2, Figure 3 and Figure 4 respectively present improvements of TRFL and six traditional SBFL methods compared to Top-1, Top-3, and Top-5 in the Defects4J dataset for five projects. In terms of Top-1, the number of TRFLs is nearly double that of SBFL, while the increase in the number of Top-5 is smaller. In terms of EXAM scores, different SBFL techniques and different programs under test show different degrees of improvement, with specific improvement ranges varying from 0.87% to 32.12%. Overall, this technique proposed in this paper is significantly better than traditional SBFL methods in terms of accuracy for program fault localization, especially showing outstanding performance on the Dstar.
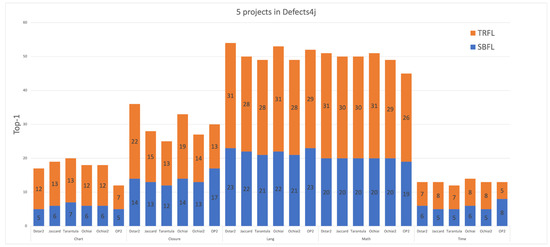
Figure 2.
The performance of TRFL and SBFL in terms of TOP-1 score using 6 suspiciousness calculation formulas on 5 projects in Defects4j.
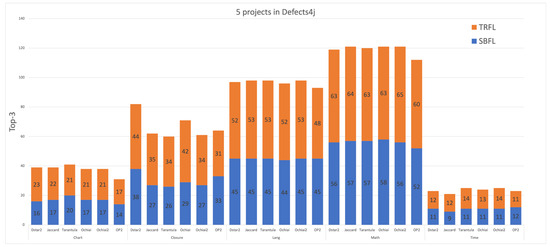
Figure 3.
The performance of TRFL and SBFL in terms of TOP-3 score using 6 suspiciousness calculation formulas on 5 projects in Defects4j.
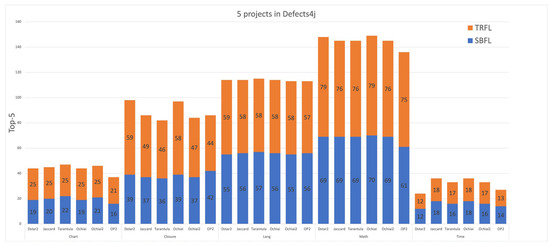
Figure 4.
The performance of TRFL and SBFL in terms of TOP-5 score using 6 suspiciousness calculation formulas on 5 projects in Defects4j.
5.2. RQ2: How Does the Improved Bidirectional TrustRank Algorithm Compare to the TrustRank Algorithm in Terms of Effectiveness?
As described in Question 1, the efficiency of traditional SBFL methods can be improved by mining internal data dependencies of programs. However, considering that TrustRank only considers one-way propagation in network nodes, this paper improves the TrustRank algorithm to simultaneously consider bidirectional propagation effects. To verify the impact of the improved algorithm on the experimental method in this paper, this case study focuses on comparing the improved TrustRank algorithm with the TrustRank algorithm in fault localization techniques. Similarly, experiments were evaluated from several metrics, including Top-1, Top-3, Top-5, and EXAM. The experimental results are shown in Table 6, which summarizes all erroneous programs in five project versions in Defects4J. Considering that the improved algorithm needs to comprehensively consider multi-directional influencing factors between program elements, this leads to a slight decrease in Top-1 ranking compared to TRFL. However, overall, Bi-TRFL is better than TRFL in the Top-5 ranking. This means that TRFL can significantly improve the accuracy of fault localization, and Bi-TRFL can move the ranking of the potentially erroneous program elements forward as a whole, which will greatly save the time for debuggers to locate all the errors in the program. Figure 5 and Figure 6 reflect changes in the EXAM scores for the TRFL and Bi-TRFL, respectively, where the horizontal axis represents the EXAM scores and the vertical axis represents the percentage of correctly located faults out of total faults. Analyzing the experimental results for EXAM scores shows that our proposed method can locate nearly 80% of faults within an EXAM score of 5%. In addition, under TRFL analysis, all erroneous versions can be found within the top 30% of program listings.
Table 6.
Experimental results of TRFL and Bi-TRFL in Defects4j.
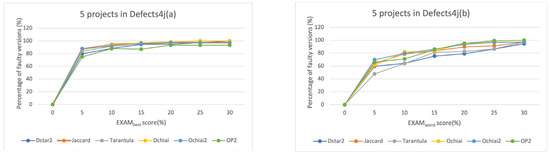
Figure 5.
The EXAMbest (a) and EXAMworst (b) of the TRFL.
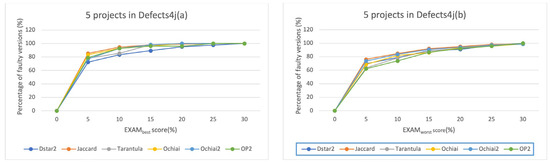
Figure 6.
The EXAMbest (a) and EXAMworst (b) of the Bi-TRFL.
5.3. RQ3: How Does the Decay Factor in the TrustRank Algorithm Affect the Performance of the Proposed Algorithm in This Paper?
To answer this question, it is necessary to supplement the experimental content with different configurations to study the impact of internal factors of the algorithm and understand how to achieve better performance for TRFL. The extended experimental content is to modify the internal influencing factor of the algorithm, i.e., the decay factor, in order to explore how different decay factors affect the localization effect of the algorithm. In order to highlight the cost of using our experimental method for researchers to find fault locations, only the EXAM is considered as a metric indicator in this case study.
From Figure 7, it can be clearly observed how the decay factor in the algorithm affects the EXAM scores. The influencing factors γ and δ in Bi-TRFL are mutually constrained (when γ = 0.1, δ = 0.9), but their sum remains constant, so only changes in γ are considered. The experimental results show that when the decay factor of the algorithm changes, the TrustRank algorithm performance changes within 4%. However, in the TrustRank algorithm, a high value for the decay factor can lower the EXAM scores. In contrast, the Bi-TRFL comprehensively considers bidirectional influences between the nodes, and any impact on the EXAM scores due to high decay factors can be ignored.
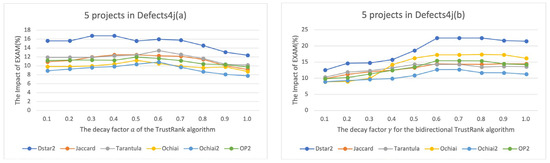
Figure 7.
Impact of decay factor a (a) of TrustRank algorithm and decay factor γ (b) of bidirectional TrustRank on the improvement of EXAM.
6. Limitations and Future Work
In the current research on software fault localization, the research method proposed in this paper has shifted from a single coverage analysis to a more complex analysis of the interaction between the program entities, but there are still some obvious limitations. First, the mining of the program’s internal information is not limited to the data dependencies but also includes multiple analyzable points such as node weight assignment methods and link relationship weight assignment in the construction of the program execution networks. However, these points are often difficult to grasp accurately in practical applications, affecting the accuracy of fault localization. Secondly, this study is limited by the analysis tools and can only be conducted when the object under test is in Java language. This undoubtedly limits the wide application of software fault localization techniques. In addition, the TrustRank algorithm used in this paper adopts a division method based on suspicion values when selecting the seed sets. Although it is representative, it cannot be ruled out that other division methods may change the performance of the TrustRank algorithm.
In response to these limitations, future work directions can include the following: First, developing error localization tools that support multiple programming languages. Due to the diversity of programming languages, developing an error localization tool that can adapt to various programming language environments will have a wide application prospect. Second, more network construction methods and network centrality analysis algorithms can be explored. As research on software fault localization techniques shifts toward complex network structures, this will become a future research hotspot. Finally, for the TrustRank algorithm, different seed set selections and division methods can be tried to improve its performance. Overall, with current enthusiasm for software fault localization research and numerous related papers being published, it is expected that more researchers will focus on finding fault localization problems and providing specific solutions in the future.
7. Conclusions
Fault localization is an important and complex task in software debugging, especially manual debugging, which not only troubles researchers but also consumes a lot of funds. Spectrum-based fault localization (SBFL) is a widely researched technique that helps researchers locate faults by analyzing program coverage. However, this method overlooks the interaction between software entities and the data flow, resulting in a large amount of duplication in the suspicion obtained from the analysis.
To solve this problem, this paper proposes a novel method. First, the data dependencies of test cases on the program under test during runtime are transformed into a program execution network. Then, the TrustRank algorithm is used to analyze the centrality of the execution network and reflect the distribution of suspicion among program elements. To further improve algorithm efficiency, the TrustRank algorithm is optimized and extended to obtain a Bi-directional TrustRank algorithm. This new algorithm considers both the propagation impact of error nodes and the positive impact of the trustworthy nodes on error suspicion.
Through this method, a suspicious list is finally obtained to assist researchers in locating fault locations and improving the ranking of error elements in the list. To verify the effectiveness of this method, five cases of the open-source benchmark programs were studied and compared with six related suspicion calculation formulas. The experimental results show that compared with traditional SBFL localization methods, our method significantly outperforms existing state-of-the-art SBFL techniques and can significantly narrow down code inspection range, especially within the high-performance range (i.e., top 5% elements and Top-N), thereby significantly improving software fault localization performance.
Author Contributions
Formulation or evolution of overarching research goals and aims and management and coordination responsibility for the research activity planning and execution, X.F.; application of statistical, mathematical, computational, or other formal techniques to analyze or synthesize study data, K.W.; application of statistical, mathematical, computational, or other formal techniques to analyze or synthesize study data, K.W. and S.Z.; oversight and leadership responsibility for the research activity planning and execution, including mentorship external to the core team and provision of study materials, reagents, materials, patients, laboratory samples, animals, instrumentation, computing resources, or other analysis tools, L.Y., W.Z. and Y.G. All authors have read and agreed to the published version of the manuscript.
Funding
This research was funded by the National Natural Science Foundation of China (Grant/Award No. 61867004) and the Youth Fund of the National Natural Science Foundation of China (Grant/Award No. 42261070).
Data Availability Statement
The data that support the findings of this study are openly available at https://github.com/rjust/defects4j (accessed on 13 April 2023).
Conflicts of Interest
The authors declare that there are no conflict of interest regarding the publication of this paper.
References
- Tassey, G. The Economic Impacts of Inadequate Infrastructure for Software Testing. Natl. Inst. Stand. Technol. 2002, 3, P125. [Google Scholar] [CrossRef]
- Pearson, S.; Campos, J.; Just, R.; Fraser, G.; Abreu, R.; Ernst, M.D.; Pang, D.; Keller, B. Evaluating and improving fault localization. In Proceedings of the 2017 IEEE/ACM 39th International Conference on Software Engineering (ICSE), IEEE 2017, Buenos Aires, Argentina, 20–28 May 2017; pp. 609–620. [Google Scholar]
- Ishimoto, Y.; Kondo, M.; Ubayashi, N.; Kamei, Y. PAFL: Probabilistic Automaton-based Fault Localization for Recurrent [4] Neural Networks. Inf. Softw. Technol. 2023, 155, 107117. [Google Scholar] [CrossRef]
- Zou, D.; Liang, J.; Xiong, Y.; Ernst, M.D.; Zhang, L. An empirical study of fault localization families and their combinations. IEEE Trans. Softw. Eng. 2019, 47, 332–347. [Google Scholar] [CrossRef]
- Jones, J.A.; Harrold, M.J.; Stasko, J. Visualization of test information to assist fault localization. In Proceedings of the 24th International Conference on Software Engineering, Orlando, FL, USA, 19–25 May 2002; pp. 467–477. [Google Scholar]
- Xie, X.; Chen, T.Y.; Kuo, F.-C.; Xu, B. A theoretical analysis of the risk evaluation formulas for spectrum-based fault localization. ACM Trans. Softw. Eng. Methodol. (TOSEM) 2013, 22, 31. [Google Scholar] [CrossRef]
- Xie, X.; Kuo, F.C.; Chen, T.Y.; Yoo, S.; Harman, M. Provably optimal and human-competitive results in sbse for spectrum based fault localization. In Proceedings of the International Symposium on Search Based Software Engineering, St. Petersburg, Russia, 24–26 August 2013; Springer: Berlin/Heidelberg, Germany, 2013; pp. 224–238. [Google Scholar]
- Papadakis, M.; Le Traon, Y. Metallaxis-FL: Mutation-based fault localization. Softw. Test. Verif. Reliab. 2015, 25, 605–628. [Google Scholar] [CrossRef]
- Li, Z.; Wang, H.; Liu, Y. Hmer: A hybrid mutation execution reduction approach for mutation-based fault localization. J. Syst. Softw. 2020, 168, 110661. [Google Scholar] [CrossRef]
- Reis, S.; Abreu, R.; d’Amorim, M. Demystifying the Combination of Dynamic Slicing and Spectrum-based Fault Localization. In Proceedings of the International Joint Conference on Artificial Intelligence (IJCAI-19), Macao, 10–16 August 2019; pp. 4760–4766. [Google Scholar]
- Cao, H.; Wang, F.; Deng, M.; Li, L. The improved dynamic slicing for spectrum-based fault localization. PeerJ Comput. Sci. 2022, 8, e1071. [Google Scholar] [CrossRef]
- Le, T.D.B.; Lo, D.; Le Goues, C.; Grunske, L. A learning-to-rank based fault localization approach using likely invariants. In Proceedings of the 25th International Symposium on Software Testing and Analysis, Saarbrucken, Germany, 18–20 July 2016; pp. 177–188. [Google Scholar]
- Widyasari, R.; Prana, G.A.A.; Haryono, S.A.; Tian, Y.; Zachiary, H.N.; Lo, D. XAI4FL: Enhancing spectrum-based fault localization with explainable artificial intelligence. In Proceedings of the 30th IEEE/ACM International Conference on Program Comprehension, Pittsburgh, PA, USA, 16–17 May 2022; pp. 499–510. [Google Scholar]
- Lemos Ribeiro, H.; Amario de Souza, H.; de Andrioli Araujo, R.P.; Lordello Chaim, M.; Kon, F. Evaluating data-flow coverage in spectrum-based fault localization. In Proceedings of the 2019 ACM/IEEE International Symposium on Empirical Software Engineering and Measurement (ESEM), IEEE, Porto de Galinhas, Brazil, 19–20 September 2019; pp. 1–11. [Google Scholar]
- Sarhan, Q.I.; Beszédes, Á. A survey of challenges in spectrum-based software fault localization. IEEE Access 2022, 10, 10618–10639. [Google Scholar] [CrossRef]
- Laghari, G.; Demeyer, S. On the Use of Sequence Mining within Spectrum Based Fault Localisation. In Proceedings of the Acm/Sigapp Symposium on Applied Computing, ACM, Pau, France, 9–13 April 2018; pp. 1916–1924. [Google Scholar] [CrossRef]
- Renieres, M.; Reiss, S.P. Fault localization with nearest neighbor queries. In Proceedings of the 18th IEEE International Conference on Automated Software Engineering, Montreal, QC, Canada, 6–10 October 2003. [Google Scholar] [CrossRef]
- Laghari, G.; Murgia, A.; Demeyer, S. Fine-tuning spectrum based fault localisation with frequent method item sets. In Proceedings of the 31st IEEE/ACM International Conference on Automated Software Engineering, Singapore, 3–6 September 2016; pp. 274–285. [Google Scholar]
- Reps, T.; Ball, T.; Das, M.; Larus, J. The use of program profiling for software maintenance with applications to the year 2000 problem. In Software Engineering—ESEC/FSE’97. ESEC SIGSOFT FSE 1997; Lecture Notes in Computer Science; Jazayeri, M., Schauer, H., Eds.; Springer: Berlin/Heidelberg, Germany, 1997; Volume 1301. [Google Scholar] [CrossRef]
- Chen, M.Y.; Kiciman, E.; Fratkin, E.; Fox, A.; Brewer, E. Pinpoint: Problem determination in large, dynamic internet services. In Proceedings of the International Conference on Dependable Systems and Networks, IEEE, Washington, DC, USA, 23–26 June 2002; pp. 595–604. [Google Scholar]
- Abreu, R.; Zoeteweij, P.; Golsteijn, R.; van Gemund, A.J. A practical evaluation of spectrum-based fault localization. J. Syst. Softw. 2009, 82, 1780–1792. [Google Scholar] [CrossRef]
- Naish, L.; Lee, H.J.; Ramamohanarao, K. A model for spectra-based software diagnosis. ACM Trans. Softw. Eng. Methodol. (TOSEM) 2011, 20, 11. [Google Scholar] [CrossRef]
- Wong, W.E.; Debroy, V.; Gao, R.; Li, Y. The DStar method for effective software fault localization. IEEE Trans. Reliab. 2013, 63, 290–308. [Google Scholar] [CrossRef]
- Yoo, S.; Xie, X.; Kuo, F.C.; Chen, T.Y.; Harman, M. No pot of gold at the end of program spectrum rainbow: Greatest risk evaluation formula does not exist. RN 2014, 14, 14. [Google Scholar]
- Xie, H.; Lei, Y.; Yan, M.; Yu, Y.; Xia, X.; Mao, X. A universal data augmentation approach for fault localization. In Proceedings of the 44th International Conference on Software Engineering, Pittsburgh, PA, USA, 22–24 May 2022; pp. 48–60. [Google Scholar]
- Zhang, M.; Li, Y.; Li, X.; Chen, L.; Zhang, Y.; Zhang, L.; Khurshid, S. An empirical study of boosting spectrum-based fault localization via pagerank. IEEE Trans. Softw. Eng. 2019, 47, 1089–1113. [Google Scholar] [CrossRef]
- Matas, N. Comparing Network Centrality Measures as Tools for Identifying Key Concepts in Complex Networks: A Case of Wikipedia. J. Digit. Inf. Manag. 2017, 15. [Google Scholar] [CrossRef]
- Qu, Y.; Guan, X.; Zheng, Q.; Liu, T.; Zhou, J.; Li, J. Calling network: A new method for modeling software runtime behaviors. ACM SIGSOFT Softw. Eng. Notes 2015, 40, 1–8. [Google Scholar] [CrossRef]
- Zakari, A.; Lee, S.P.; Chong, C.Y. Simultaneous localization of software faults based on complex network theory. IEEE Access 2018, 6, 23990–24002. [Google Scholar] [CrossRef]
- Vancsics, B.; Horváth, F.; Szatmári, A.; Beszédes, Á. Fault localization using function call frequencies. J. Syst. Softw. 2022, 193, 111429. [Google Scholar] [CrossRef]
- Zhao, G.; He, H.; Huang, Y. Fault centrality: Boosting spectrum-based fault localization via local influence calculation. Appl. Intell. 2022, 52, 7113–7135. [Google Scholar] [CrossRef]
- Gyöngyi, Z.; Garcia-Molina, H.; Pedersen, J. Combating web spam with trustrank. In Proceedings of the Thirtieth International Conference on Very Large Data Bases, Toronto, BC, Canada, 31 August–3 September 2004; Volume 30, pp. 576–587. [Google Scholar]
- Zhang, X.; Lyu, D.; Ruan, X.; Cheng, Y.; Ju, X. Journal Evaluation Method Based on the Integration of Peer-Review Consensus and Bibliometric Indicators. J. China Soc. Sci. Tech. Inf. 2022, 41, 486–496. [Google Scholar]
- Li, Y.; Zhang, S. A community discovery and TrustRank based approach for spammer ranking. In Proceedings of the 2020 International Conference on Culture-oriented Science & Technology (ICCST), IEEE, Beijing, China, 28–31 October 2020; pp. 279–283. [Google Scholar]
- Just, R.; Jalali, D.; Ernst, M.D. Defects4J: A database of existing faults to enable controlled testing studies for Java programs. In Proceedings of the 2014 International Symposium on Software Testing and Analysis, San Jose, CA, USA, 21–25 July 2014; pp. 437–440. [Google Scholar]
- Pearson, S.; Campos, J.; Just, R.; Fraser, G.; Abreu, R.; Ernst, M.D.; Pang, D.; Keller, B. Evaluating & Improving Fault Localization Techniques; Tech. Rep. UW-CSE-16-08-03; University of Washington Department of Computer Science and Engineering: Seattle, WA, USA, 2016; p. 27. [Google Scholar]
- Kochhar, P.S.; Xia, X.; Lo, D.; Li, S. Practitioners’ expectations on automated fault localization. In Proceedings of the 25th International Symposium on Software Testing and Analysis, Saarbrücken, Germany, 18–20 July 2016; pp. 165–176. [Google Scholar]
Disclaimer/Publisher’s Note: The statements, opinions and data contained in all publications are solely those of the individual author(s) and contributor(s) and not of MDPI and/or the editor(s). MDPI and/or the editor(s) disclaim responsibility for any injury to people or property resulting from any ideas, methods, instructions or products referred to in the content. |
© 2023 by the authors. Licensee MDPI, Basel, Switzerland. This article is an open access article distributed under the terms and conditions of the Creative Commons Attribution (CC BY) license (https://creativecommons.org/licenses/by/4.0/).