Abstract
Keratoconus is an eye disease that distorts the shape of the cornea. This study aimed to analyze the effect of an increase in intraocular pressure applied to eyes with different severity of keratoconus disease using patient-specific models. Finite element models of the normal eye, eye with keratoconus, and eye with keratoglobus were constructed. The loading conditions considered the intraocular pressure increment as well as their physiological intraocular pressure. The analysis was performed with distinct materials for normal and keratoconic eyes. The finite element analysis revealed differences in the three models in terms of their deformation and maximum principal stress, and differences were observed in corneal curvature and thickness. These findings could enhance research in the biomechanical area, leading to more successful treatment options and a more individualized approach in the field of practical ophthalmology. Further investigation with larger sample sizes and more precise data on eye material would allow us to evaluate whether these disparities could inform the diagnosis of keratoconus.
Keywords:
keratoconus; 3D model; pentacam®; ectasia corneal; finite element; biomechanics; eye; deformation 1. Introduction
The cornea is a transparent, convex structure that forms the front and outer parts of the human eye. It is located on the anterior surface of the eyeball and is an essential part of vision, as it plays several crucial roles in the visual process [1]. One of these functions is to protect the eye from factors such as dust and germs and to control the entry of light [2]. However, for the cornea to achieve its goal, it must be transparent, and it is imperative to maintain adequate curvature [2]. The morphological characterization of the cornea is key in clinical practice because it is pertinent to visualize the changes in the cornea that could affect the visual quality of patients, the evolution of the disease, the diagnosis, and subsequent treatment in certain ocular pathologies [3].
Keratoconus is an ocular pathology that occurs in the cornea of the eye, produces image distortion, and progressively reduces vision. It is a bilateral, non-inflammatory corneal ectasia that causes myopic astigmatism and decreased visual acuity [4]. This degenerative disease arises from a constant thinning of the thickness of the cornea in the central and paracentral areas, in addition to a change in the normal spherical curvature of the eye, thus creating a cone-shaped cornea [5]. The onset of this disease commonly occurs in only one eye, whereas the other remains normal. There have been keratoconus cases in which patients reported decreased visual acuity, frequent lens changes, image distortion, and varying degrees of contact lens discomfort early in the disease [6]. Keratoconus is affecting more and more people around the world, especially in places with high exposure to ultraviolet rays, such as Ecuador. This pathology produces a high level of astigmatism that hinders clear vision. In addition, severe cases of this disease may require a surgical procedure of corneal transplant due to the opacity generated by corneal ectasia [5]. This condition has been the focus of several studies due to its severity in the human eye; hence, several methods have been developed to characterize this pathology. Some methods are as non-invasive as possible, avoiding the use of anesthesia or having direct contact with the eye during the integral characterization of the corneal topography [7]. Ophthalmologic examinations, such as corneal topography and optical coherence tomography (OCT), that map the surface and internal structure of the cornea are typically used for early diagnosis [8]. Early treatment, such as rigid contact lenses, can help correct vision in the early stages of the disease, while corneal transplants are an option in severe situations, as this can considerably improve the patient’s vision and quality of life [8].
Pentacam® is capable of capturing data from the surface of the anterior cornea to the posterior capsule of the lens [9]. This camera provides sharp and bright images, improving image quality compared to other optical cameras [10]. Pentacam® provides data on anterior and posterior corneal topography, elevation maps, pachymetry, 3D camera analysis, intraocular pressure (IOP), and many other parameters to support the diagnosis and subsequent treatment of the disease [11].
This work proposes a three-dimensional approach to investigate the biomechanics of the eyes affected by keratoconus, thus showing the creation process of geometric models for patients with ectasia in the case of keratoconus type, keratoglobus, and a non-pathological eye. The strategy for this study was to create a realistic customized 3D model, as it provides accuracy in how certain geometric aspects of the cornea influence the biomechanics and progression of the disease. With these aspects, it was possible to build an investigation using the data of the examination of patients from an authorized database in the form of point clouds exported by Pentacam®; Rhinoceros® processed these points to build the 3D models.The model was executed in ABAQUS®, in which a finite element analysis was performed [12]. The objective was to simulate the behavior and deformation of corneas under a defined load for comparison with a healthy cornea model. Insights from this study could help develop more research in the biomechanical area, leading to more successful treatment options and a more individualized approach in the field of practical ophthalmology.
2. Materials and Methods
The analysis was performed on data from three patients with different severities: normal, keratoconus, and keratoglobus. The data for the three eye models were obtained from demonstrative material of OCULUS Pentacam® that was available for use with a license provided by a distributor, ANDREC. Moreover, this type of demonstrative material has been used in previous publications [13,14,15,16,17]. The method of selection of the patients consisted of two main criteria: they were chosen if the eyes presented the disease, either keratoconus or keratoglobus, or if they were normal, and they were excluded if they had any other condition (e.g., glaucoma), since this could interfere with the results. Other variables, such as social group, demography index, and other clinical features, were not available due to the anonymization of the data. Furthermore, despite these efforts, the sample size could not be increased due to a lack of data in the authorized database, which limited the use of statistical tools.
To make the 3D model of these eyes, the following is needed: (i) a cloud of points belonging to the anterior and posterior surface of the cornea, (ii) reconstruction of the surface, (iii) solid modeling, and (iv) biomechanical analysis: finite element method.
2.1. Pentacam®
Pentacam® is a 360-degree rotating Scheimpflug camera that takes about two seconds to generate an image of the anterior part of the eye [18]. It provides topographic data on the posterior and anterior corneas. The anterior and posterior elevations of the cornea can be mapped relative to a standardized reference shape, such as a circle or ellipsoid [19].
2.2. Point Cloud
In the demo, there are data on the points of the anterior and posterior parts of the cornea. This point cloud is in the format of geometric coordinates x, y, and z. However, in some cases, the data are usually in polar coordinates; thus, it is crucial to transform them into Cartesian coordinates to establish the surface. The point cloud represented the topography of the anterior and posterior cornea; then, this point cloud was sent to the Rhinoceros® v7.0 software, where the data were imported. There were 19,881 (141 × 141) points for each corneal surface. Data were imported in a .csv file, and with the help of Excel tools, the variables were ordered to allow Rhinoceros® v7.0 to read the file.
2.3. Rhinoceros®
The .csv files containing the point clouds for the anterior and posterior faces of the cornea were then imported to the Rhinoceros® v7.0 software. Following the method described in [9], a surface was created from the set of points using the interpolation method embedded in the Patch function of this software. There were 141 surface segments for both directions (u, v) for 19,881 (141 × 141) points. Since the surface was formed as a square, it needed to be given a cornea-like shape by cutting the patch into a cylinder of a 4 mm radius with a center at the origin [20]. Although it was cut in an unnatural cylindrical shape, the model still mimicked the unique topography of the patient. This resulted in the solid 3D model used in ABAQUS® Figure 1. The model was then split in half to contrast the topography of the keratoconus corneas from different stages with a normal cornea, thus showing a side view that exposed the differences between their corneal thickness and how they were distributed Figure 2.
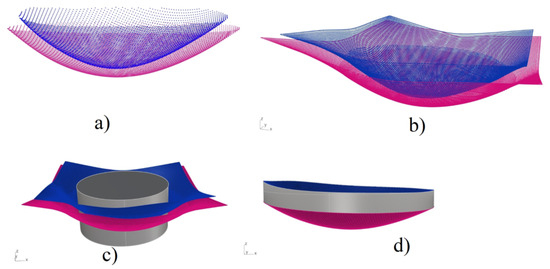
Figure 1.
Description of the process of construction of the solid model (right cornea): (a) point clouds of the anterior and posterior surfaces of the cornea. (b) square-like surfaces obtained from the point clouds. (c) cylinder that sliced the surfaces to match its circular form, and (d) final stage of the 3D model.
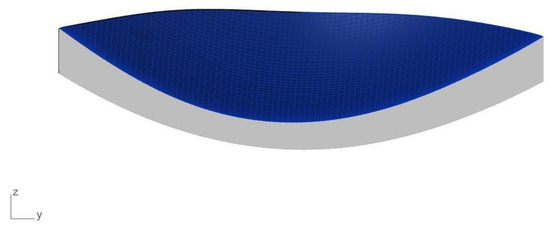
Figure 2.
Side view of the keratoconus cornea.
2.4. Abaqus®: Undeformed Geometry and Finite Elements Analysis
To perform finite element analysis, it is necessary to know the mechanical properties of the material used. In this case of the cornea, it is a challenging task to complete because it is a live tissue that is not likely to be uniform [21]. However, because it is a matter of great importance for the development of new applications, some studies have attempted to model corneas’ material behavior using different approaches [22]. By conducting in vivo tests, some studies have attempted to model the cornea numerically, including linear, as in elastic models, nonlinear, as in viscoelastic models [23], or hyperelastic [3,24,25] materials. Others have described the cornea as anisotropic due to the collagen fibers’ particular distribution [26,27].
For this model of the cornea, we considered isotropic hyperelastic materials for nonpathological and keratoconus eyes described in [24] as second-order Ogden models, with specific constants due to their computational simplicity and material data that were more readily accessible [24]. The incorporation of anisotropic materials is beyond the scope of this study.
Boundary conditions for this model were placed at the edges of the cornea with respect to the horizontal axis; it is of interest to mention that the model was constrained against displacement and rotation (Figure 3) [28]. In addition, the mesh used for these models was hexahedral and had a lineal geometrical order. The seed size was 250 m. This meshing resulted in the normal model having 4524 elements and 5910 nodes, the keratoconus cornea with 3285 elements and 4584 nodes, and the model for keratoglobus with 3504 elements and 4876 nodes (Figure 4).
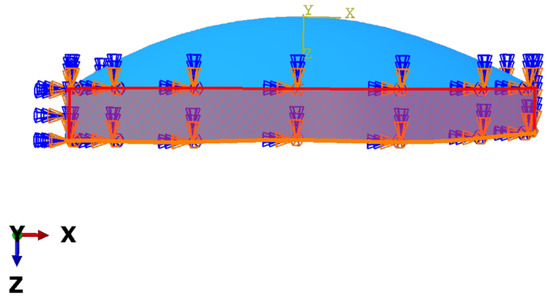
Figure 3.
Boundary condition of displacement and rotation applied to the edge of the cornea model.
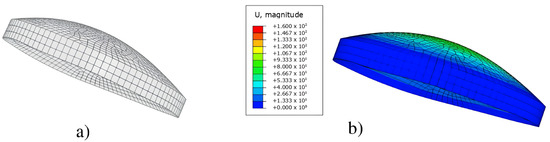
Figure 4.
(a) Meshed model of the left keratoconus cornea, (b) results of the finite element simulation for the magnitude of displacement of the nodes.
Concerning the loads that were taken into consideration for the simulation, this study contemplated that since the model was based on in vivo data collection, it was already deformed by forces such as normal IOP or atmospheric pressure. An important part of simulating a patient-specific cornea is retrieving the undeformed geometry related to the unstressed state. The data obtained from the Pentacam correspond to a physiological state in which there are already forces acting upon the model. The most significant would be IOP, which varies among patients. In this work, the recovery of undeformed geometry was preferred over the pre-stress state. In this matter, the cornea models were subjected to successive analysis under physiological IOP (normal = −1.8 mmHg; keratoconus = 7.1 mmHg; keratoglobus = 13.9 mmHg), as described in [26], in which the first set of coordinates were the physiological corneas:
- The IOP was applied to the internal surface of the cornea.
- The resulting deformation was subtracted from the physiological state, thus creating a new set of coordinates.
- The new set of coordinates was compared to its predecessor by the magnitude of the difference in their sequential coordinates.
- The first three steps were iterated until the magnitude was smaller than the defined tolerance (5% of the minimum thickness of that cornea).
- The obtained undeformed geometry was used to conduct further simulations.
The physiological IOPs were applied as a load to the obtained models. Simultaneously, this simulation worked with the IOP variation in the eye experiences throughout the day of approximately 1.5 mmHg or 199.984 Pa [28] to compare how different corneas would behave in the same increment of IOP. The model units were micrometers, and the coherent unit for pressure was GPa; thus, the load was applied as GPa. The same was true for the IOPs. These loads were applied to the posterior surface of each cornea, as shown in Figure 5. The analysis in ABAQUS® was performed using these data (Figure 4). The nonpathological, keratoconus, and keratoglobus cornea contour maps were compared to identify their differences. Further, the means of the magnitude of displacement and principal maximum stress were obtained to compare the three levels of disease severity.
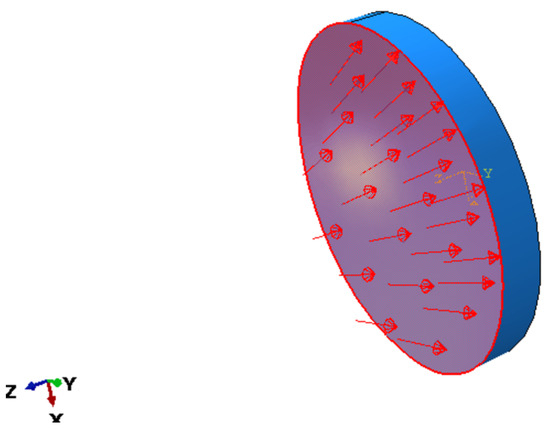
Figure 5.
The direction of the applied load (IOP variation).
3. Results
3.1. Results for a Model with Deformation Parameter
Depending on the geometry of the crystalline surface, it is possible to calculate the deformation that introduces an oscillating-traversing wavefront. In particular, we can obtain corneal deformation in ectasia [20,29].
In the color maps showing the magnitude of the displacement of the nodes for each model presented in Figure 6, the keratoglobus case shows the highest values in the central corneal zone out of the three patients; keratoconus patients showed lower magnitudes than the keratoglobus in the leading site but higher than in the non-pathological case. The model for the average eye showed the lowest displacement values for the same area. The graphic results clearly show how different the three models deform when the load condition is applied.
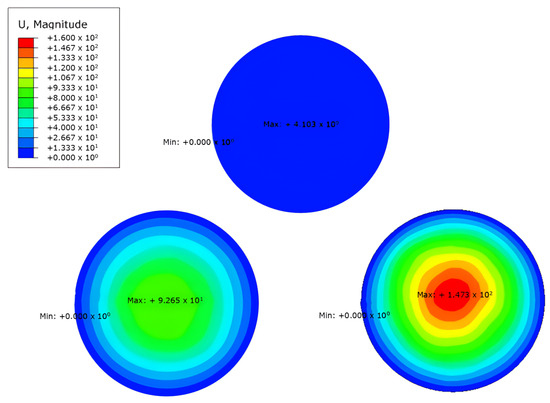
Figure 6.
Results obtained in ABAQUS® of the different models using the deformation parameter.
The maximum registered deformation is of the keratoglobus with GPa, which occurs in the central zone. The value of the maximum absolute deformation of keratoconus is GPa and appears in the centre area. Table 1 presents an average comparison of the displacement.

Table 1.
Comparison of displacement means of the nodes of the model (deformation of the cornea) for the three levels of severity.
3.2. Results for a Model with Maximum Principal Stress Parameters
For the maximum principal stress model presented in this article, the most severe maximum prevalent stress concentrations appear only in the case of the keratoglobus. For the case of average severity, the highest value of principal stresses occurs in the extreme lower temporal area of the cornea. The highest stress value appears in the outer superior temporal space for keratoconus. The most elevated maximum stress occurs at the upper nasal end for the third model, the keratoglobus. The maximum pressures mentioned above can be seen at the bottom of Figure 7, where the stresses for the healthy model are observed. The other two models appear in the upper part, both keratoconus, and keratoglobus, with their respective tensions. The units of the stresses are in GPa.
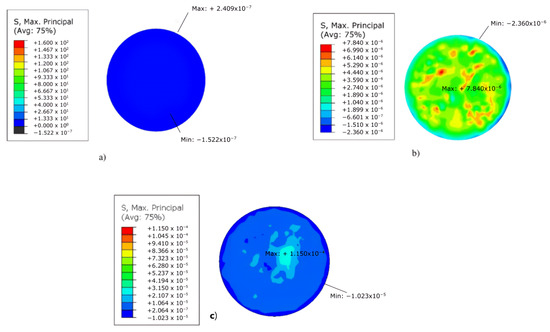
Figure 7.
Results obtained in ABAQUS® of the models for: (a) normal cornea, (b) keratoconus cornea, and (c) keratoglobus cornea, using the max. principal stress parameter.
The maximum principal stress recorded is of the keratoglobus with GPa, and this occurs in the area of the upper nasal ends. The absolute value of the maximum principal stress of keratoconus is GPa and appears in the upper temporal area. Table 2 presents an average comparison of the top strains developed.
Table 2.
Comparison of maximum principal stress registered means on the nodes of the model for the three levels of severity.
3.3. Results for Model with Variation in Corneal Curve
Corneal curvature, described by the corneal radius (R), did not vary; it remained at 10 mm for the corneas (normal and keratoconus-type ectasias), but there was a difference in the thickness of the corneas. We obtained a maximum thickness of 900 m and a minimum thickness of 593 m in the normal cornea. By contrast, the cornea with keratoconus-type ectasia has the following thicknesses: maximum thickness, 703 m; and minimum thickness, 361 m. However, the keratoglobus had a maximum thickness of 500 m, and the minimum was 137 m. Figure 8 shows the corneal trend difference (Table 3). However, the linearity of the material resulted in a lower estimate than that of the normal cornea. This is mainly because the bending effects are much more pronounced with linear material [30]. Figure 8 shows that an unaffected cornea with a radius of 10 mm is presented in the upper part. The simulation was carried out for a linear model of hyperelastic material. The results are shown in Figure 8. As in the two previous parametric studies, the deformation and geometry of the IOP were taken into account. Having different thicknesses between the different corneas and more in the keratoglobus, the corneal curvature increased due to keratoconus-type ectasia, with reduced structural resistance. As shown in Figure 8, there was thinning in the white/transparent part of the simulation and deformation models. Further, there was no linearity in the cornea and the aqueous humor in the keratoglobus; that is, there was damage that needed urgent treatment in these areas. The changes in the corneal radius (R) were slightly more pronounced with an increase in the rigidity of the material, as well as with ectasia, which, in this case, was of the keratoconus type [31].
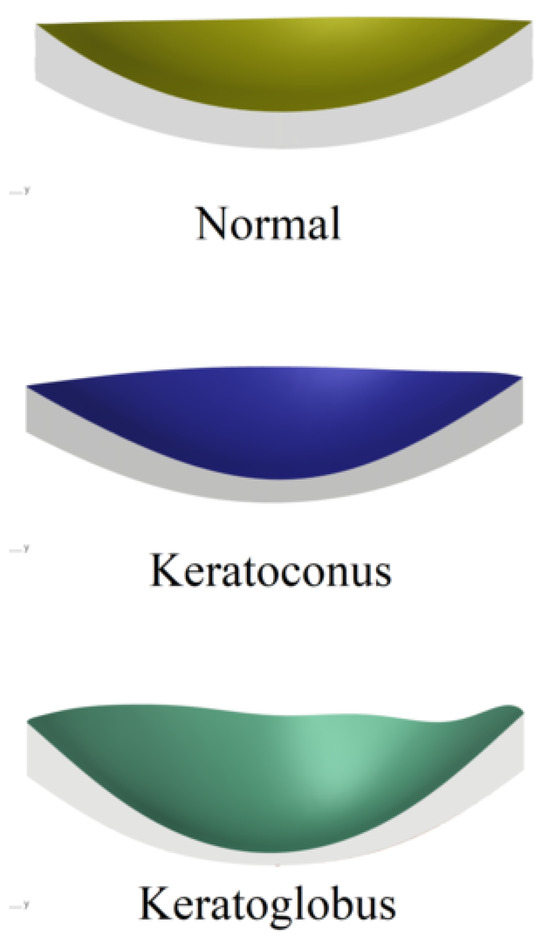
Figure 8.
Results obtained from the different models of the variation in corneal curve.
Table 3.
Corneal curve registered on the nodes of the model for the three levels of severity.
From Figure 8, we can collect the deformation in the variation of the curvature of the cornea. In the upper part of the common condition, it is possible to appreciate an utterly healthy eye. Next, the keratoconus is slightly elevated in the white/transparent part. Finally, keratoglobus has a total deformation in the curvature of the cornea and a non-linearity between the cornea and the aqueous humor. Table 3 presents a comparison of curvature values of the cornea of each case with its maximum and minimum value.
4. Discussion
The Pentacam Scheimpflug camera has become a useful tool for doctors treating eye diseases. This software allows evaluation of the structure, differences in foreign bodies, and corneal lesions. Although its use is becoming more frequent, studies using finite element analysis have not yet been carried out using the camera to determine the consequences of keratoconus ectasia in the eye [32]. Knowing the parameters as ectasia progresses is essential; thus, applying an individualized 3D model can increase confidence in the results to more accurately differentiate the different stages of the condition. In this study, we had access to some parameters, such as clinical symptoms of patients, diagnostic process, or elaboration of the methodology, treatments, and their results, as indicated in Table 4. Therefore, developing a finite analysis of elements enhanced the reliability of the results. However, it is necessary to establish certain assumptions to allow for the creation of more advanced technologies for the detection of this type of ectasia.
Table 4.
Related work for the keratoconus symptoms, diagnostics and treatments.
According to [20], the maximum principal stresses were in directions (i = 1, 2, 3). The post-surgical stressed corneal tissue volume obtained was two times more significant than in the pre-surgical configuration. This causes the probability of corneal stiffness to be derived as a quantification of the overall increase in corneal stresses. On the other hand, ref. [20] used a predictive finite element ocular model to analyze explosions from 24 different locations, resulting in 96 simulations; maximum principal stress (MPa) in the corneoscleral obtained that the maximum principal stress reached 10.22 MPa.
This paper presents three finite element models of the eye with keratoconus-type corneal ectasias by level of severity. The first model analyzed a normal eye, the second an eye with corneal ectasia of the keratoconus type, and the third model with the keratoglobus type. When the principal maximum stress exceeded [36], the presence of keratoconus was obtained but without indication of the level. In the keratoconus model, the main maximum stress was located in the upper temporal area. With an active keratoglobus, control of the main maximum stress was lost, which could become a surgical procedure. The main routine maximum stress with keratoconus-type corneal ectasia is GPa [36], and this value is smaller than the reported stresses in this paper ( GPa; Figure 9). This indicates that the non-concordance of values may be due to the geographical location of the patient.
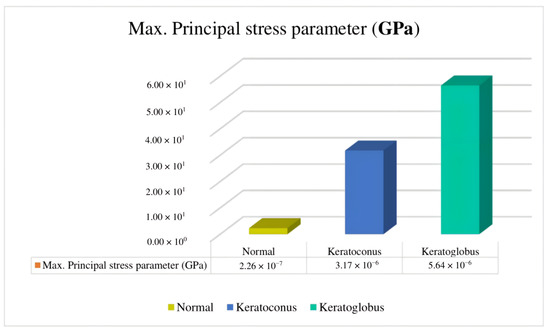
Figure 9.
Comparison of maximum principal stress parameters identifying the mean/average of the different models described in this paper.
Researchers in [37] reported that cases of flat corneas (20.00 D to 41.50 D) have been present since the beginning of the last century and are linked to genetic alterations; therefore, it is essential to find adequate methods to diagnose these pathologies. According to a corneal topographer investigating corneal curves [38], the topographic image of a clinical case of corneal curvature shows a small-diameter ectasia, which is better defined in the left eye. For such cases, it would have been convenient to spend more time without glasses, but the patients’ vision without glasses was too low. In the topographic image, curvature values were found in the central area close to 63.00 D and 300 mm of curvature [39,40]. This is classified as grade IV keratoconus according to the Amsler Krumeich scale, and it produces high corneal eccentricity in areas of ectasia [40].
The current methods for keratoconus diagnosis are keratometry and photo and video keratoscopy, and they have proven efficient [41,42]. This paper presents two models of keratoconus-type ectasia with different degrees or severity and a healthy model. In the first healthy model, we observed a curvature that varied between 593 mm and 596 mm in the apical area. However, in the second and third models, which already presented corneal ectasia, we had to consider the different levels of severity based on the corneal radius (mm). All corneal radius curvatures are 4 mm [43]. In our study, we observed statistically significant differences in the amplitude of the anterior chamber between the three groups—normal patients with keratoconus and keratoglobus—as well as in the dimensions, with an increase in the same order in an anteroposterior direction (Figure 10). Recent studies have also compared changes in this variable between similar study groups. In some cases, no significant difference was found, while in others, the behavior of the curve was observed.
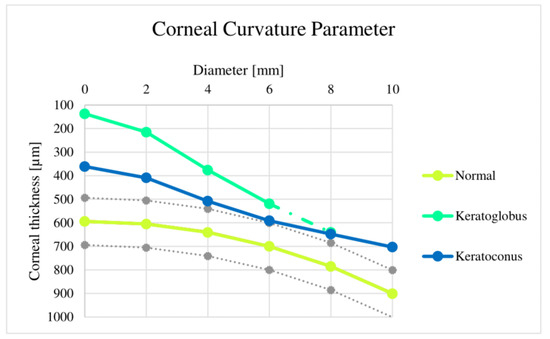
Figure 10.
Corneal curvature parameter variation comparison, where it is possible to identify the curvature of the different models used in this article and, at the same time, its severity level in each case.
Finally, these models have significant differences regarding deformation and maximum principal stress. According to the simulation, there were differences in the reactions of the three eyes when their natural pressure was applied, even between keratoconus and keratoglobus, in which the material used was the same so topography could have played a part in how the model reacted to the load. The outcomes of these simulations suggest that this method could potentially distinguish a keratoconus eye from a regular eye in diagnosis. Comparing a nonpathological eye with the suspect or even the keratoconus suspect eyes studied months apart could lead to noticeable differences that would help with diagnosis (Figure 11). Future studies should include numerous cases to support the claim that the studied parameters would actually be valuable for diagnosis compared to current methods [44,45,46].
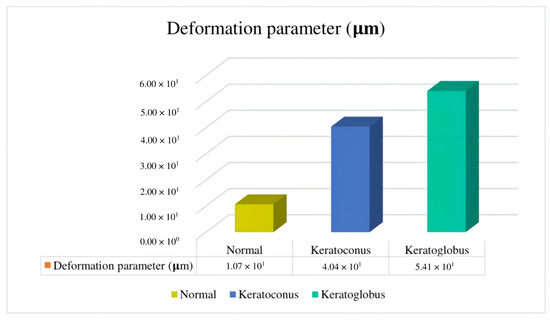
Figure 11.
Deformation parameter comparison, where it is possible to identify the mean average of the different models used in this paper.
5. Conclusions
Values obtained in the ABAQUS® 2021 software indicate how the tensions act on each cornea model. In this study, the relevance of 3D geometric models to demonstrate and treat corneal ectasia can be noted, as these models could provide remarkable information in ophthalmology to achieve better treatment of ocular pathologies. In this research work, we observed that the three corneal models reacted differently when applying IOP. Further, when the principal maximum stress exceeded , there was the presence of keratoconus, and the principal maximum stress was found in the superior temporal area of the cornea. The keratoglobus model showed a loss of control of the maximum primary effort, which makes it a surgical procedure. The curvature of each model did not show any similarity; the normal model had an almost perfect curvature, while the keratoconus inclined toward linearity, which is due to the structural resistance that wears away. However, the most chronic was the model with a keratoglobus, since the curvature did not maintain a sequence but instead had points sprinkled on all sides. This model did not show a direction toward the normal model when curvature was applied. However, a comparison of the thickness in the corners of each one revealed a difference, with the normal cornea showing higher values than the corneas with ectasia. These findings imply that when there is a difference in thickness between the different corneas, with more in the left eye, the corneal curvature increases due to keratoconus-like ectasia, resulting in decreased structural strength. Analyses conducted ABAQUS® with the three cornea models presented the keratoglobus model with the highest values of exile in the central zone, followed by the cornea model with keratoconus. The model of the normal cornea showed lower displacement values. We also observed that the keratoglobus model displayed a maximum strain value of GPa, which was found in the central area of the commissures. In the case of the keratoconus model, it presented a value of the maximum absolute deformation of GPa, which was located in the superior temporal area of the cornea. The keratoglobus model presented greater severity than the keratoconus model, which presented medium severity.
Author Contributions
Conceptualization, E.S.-R., D.O.-H., A.F.-C., R.D.-A., M.M.-P., C.C.-M., D.A.-G., C.G., A.T.-E. and F.V.-M.; methodology, E.S.-R., D.O.-H., A.F.-C., R.D.-A., M.M.-P., C.C.-M., D.A.-G., C.G., A.T.-E. and F.V.-M.; software, E.S.-R., D.O.-H., A.F.-C., R.D.-A., M.M.-P., C.C.-M., D.A.-G., C.G., A.T.-E. and F.V.-M.; validation, E.S.-R., D.O.-H., A.F.-C., R.D.-A., M.M.-P., C.C.-M., D.A.-G., C.G., A.T.-E. and F.V.-M.; formal analysis, E.S.-R., D.O.-H., A.F.-C., R.D.-A., M.M.-P., C.C.-M., D.A.-G., C.G., A.T.-E. and F.V.-M.; investigation, E.S.-R., D.O.-H., A.F.-C., R.D.-A., M.M.-P., C.C.-M., D.A.-G., C.G., A.T.-E. and F.V.-M.; resources, E.S.-R., D.O.-H., A.F.-C., R.D.-A., M.M.-P., C.C.-M., D.A.-G., C.G., A.T.-E. and F.V.-M.; data curation, E.S.-R., D.O.-H., A.F.-C., R.D.-A., M.M.-P., C.C.-M., D.A.-G., C.G., A.T.-E. and F.V.-M.; writing—original draft preparation, E.S.-R., D.O.-H., A.F.-C., R.D.-A., M.M.-P., C.C.-M., D.A.-G., C.G., A.T.-E. and F.V.-M.; writing—review and editing, E.S.-R., D.O.-H., A.F.-C., R.D.-A., M.M.-P., C.C.-M., D.A.-G., C.G., A.T.-E. and F.V.-M.; visualization, E.S.-R., D.O.-H., A.F.-C., R.D.-A., M.M.-P., C.C.-M., D.A.-G., C.G., A.T.-E. and F.V.-M.; supervision, D.A.-G.; project administration, C.G.; funding acquisition, C.G. All authors have read and agreed to the published version of the manuscript.
Funding
This work was supported by Universidad Tecnológica Indoamérica [project number: INV-0012-028; 2021–2025]; Artificial Intelligence Applied to Engineering-IAAI.
Institutional Review Board Statement
Not applicable.
Informed Consent Statement
Not applicable.
Data Availability Statement
Emily Sánchez-Real, Diego Otuna-Hernández, Alisson Fajardo-Cabrera, Rosemary Davies-Alcívar, Mario Madrid-Pérez, Carolina Cadena-Morejón, Diego Almeida-Galárraga, Cesar Guevara, Andrés Tirado-Espín, & Fernando Villalba-Meneses. (2023). Biomechanical Study of the Eye with Keratoconus-Type Corneal Ectasia Using a 3D Geometric Model (1.0.0 < 2.0.0 < 2.1.0 < 2.1.1) [Data set]. Zenodo. (accessed on: September 2023) (https://doi.org/10.5281/zenodo.7606190, accessed on 24 August 2023).
Acknowledgments
With consent and support from the AXA-ICMAT Chair in Adversarial Risk Analysis. Also, we would like to extend our sincere appreciation to Diego Jarrín and ANDREC corporation for generously providing access to the database and usage rights.
Conflicts of Interest
The authors declare no conflict of interest.
References
- Meek, K.M.; Knupp, C. Corneal structure and transparency. Prog. Retin. Eye Res. 2015, 49, 1–16. [Google Scholar] [CrossRef]
- Collar, C.V.; González-Méijome, J.M. El queratocono y su tratamiento. Gac. Ópt. 2009, 435, 16–22. [Google Scholar]
- Rodríguez, E.M.; Vega, O.S.; Garcél, B.R.B.; Ramírez, S.D.; Mograbe, J.Á.S. Caracterización de pacientes con queratocono. Medisan 2011, 15, 1698–1704. [Google Scholar]
- Gualsaquí, M.G.; Delgado, A.S.; González, L.L.; Vaca, G.F.; Almeida-Galárraga, D.A.; Salum, G.M.; Cadena-Morejón, C.; Tirado-Espín, A.; Villalba-Meneses, F. Convolutional neural network for imagine movement classification for neurorehabilitation of upper extremities using low-frequency EEG signals for spinal cord injury. In Smart Technologies, Systems and Applications; Springer International Publishing: Berlin/Heidelberg, Germany, 2022; pp. 272–287. [Google Scholar]
- Herrera-Romero, B.; Almeida-Galárraga, D.; Salum, G.M.; Villalba-Meneses, F.; Gudiño-Gomezjurado, M.E. GUSignal: An Informatics Tool to Analyze Glucuronidase Gene Expression in Arabidopsis Thaliana Roots. IEEE/ACM Trans. Comput. Biol. Bioinform. 2023, 20, 1073–1080. [Google Scholar] [CrossRef]
- Comínches, G.D.; Ronda, A.C.; Cepeda, R.J.; Peláez, R.N. Características epidemiológicas en pacientes portadores de queratocono. Rev. Cuba. Oftalmol. 1999, 12, 1. [Google Scholar]
- Suquilanda-Pesántez, J.D.; Zambonino-Soria, M.C.; López-Ramos, D.E.; Pineda-Molina, M.G.; Milán, N.S.; Muñoz, M.C.; Villalba-Meneses, G.F.; Almeida-Galárraga, D. Prediction of Parkinson’s disease severity based on gait signals using a neural network and the fast Fourier transform. In Artificial Intelligence, Computer and Software Engineering Advances; Springer International Publishing: Berlin/Heidelberg, Germany, 2021; pp. 3–18. [Google Scholar]
- Basu, S.; Vazirani, J. Keratoconus: Current perspectives. Clin. Ophthalmol. 2013, 7, 2019–2030. [Google Scholar] [CrossRef] [PubMed]
- Martínez, F.C. Modelado Geométrico Personalizado de la Córnea Humana y su Aplicación a la Detección de Ectasias Corneales. Ph.D. Thesis, Universidad Politecnica de Cartagena, Cartagena, Spain, 2018. [Google Scholar]
- Vásquez-Ucho, P.A.; Villalba-Meneses, G.F.; Pila-Varela, K.O.; Villalba-Meneses, C.P.; Iglesias, I.; Almeida-Galárraga, D.A. Analysis and evaluation of the systems used for the assessment of the cervical spine function: A systematic review. J. Med. Eng. Technol. 2021, 45, 380–393. [Google Scholar] [CrossRef] [PubMed]
- Cavas-Martínez, F.; Fernández-Pacheco, D.G.; De la Cruz-Sánchez, E.; Nieto Martínez, J.; Fernández Cañavate, F.J.; Vega-Estrada, A.; Plaza-Puche, A.B.; Alió, J.L. Geometrical custom modeling of human cornea in vivo and its use for the diagnosis of corneal ectasia. PLoS ONE 2014, 9, e110249. [Google Scholar] [CrossRef] [PubMed]
- Aguiar-Salazar, E.; Villalba-Meneses, F.; Tirado-Espín, A.; Amaguaña-Marmol, D.; Almeida-Galárraga, D. Rapid detection of cardiac pathologies by neural networks using ECG signals (1D) and sECG images (3D). Computation 2022, 10, 112. [Google Scholar] [CrossRef]
- Misra, S.; Craig, J.P.; McGhee, C.N.J.; Patel, D.V. A prospective study of pterygium excision and conjunctival autograft with human fibrin tissue adhesive: Effects on vision, refraction, and corneal topography. Asia Pac. J. Ophthalmol. 2014, 3, 202–206. [Google Scholar] [CrossRef]
- Shetty, R.; Arora, V.; Jayadev, C.; Nuijts, R.M.; Kumar, M.; Puttaiah, N.K.; Kummelil, M.K. Repeatability and agreement of three scheimpflug-based imaging systems for measuring anterior segment parameters in keratoconus. Investig. Ophthalmol. Vis. Sci. 2014, 55, 5263. [Google Scholar] [CrossRef] [PubMed]
- Villavicencio, O.F.; Gilani, F.; Henriquez, M.A.; Izquierdo, L.; Ambrósio, R.R. Independent Population Validation of the Belin/Ambrósio Enhanced Ectasia Display: Implications for Keratoconus Studies and Screening. Int. J. Keratoconus Ectatic Corneal Dis. 2014, 3, 1–8. [Google Scholar] [CrossRef]
- Steinberg, J.; Ahmadiyar, M.; Rost, A.; Frings, A.; Filev, F.; Katz, T.; Linke, S.J. Anterior and Posterior Corneal Changes after Crosslinking for Keratoconus. Optom. Vis. Sci. 2014, 91, 178–186. [Google Scholar] [CrossRef] [PubMed]
- Kanellopoulos, A.J.; Asimellis, G. Keratoconus Management: Long-term Stability of Topography-guided Normalization Combined with High-fluence CXL Stabilization (the Athens Protocol). J. Refract. Surg. 2014, 30, 88–93. [Google Scholar] [CrossRef]
- Giannaccare, G.; Murano, G.; Carnevali, A.; Yu, A.C.; Vaccaro, S.; Scuteri, G.; Maltese, L.; Scorcia, V. Comparison of Amsler—Krumeich and Sandali classifications for staging eyes with keratoconus. Appl. Sci. 2021, 11, 4007. [Google Scholar] [CrossRef]
- Motlagh, M.N.; Moshirfar, M.; Murri, M.S.; Skanchy, D.F.; Momeni-Moghaddam, H.; Ronquillo, Y.C.; Hoopes, P.C. Pentacam® corneal tomography for screening of refractive surgery candidates: A review of the literature, part I. Med. Hypothesis Discov. Innov. Ophthalmol. 2019, 8, 177–203. [Google Scholar]
- Ariza-Gracia, M.Á.; Flecha-Lescún, J.; Büchler, P.; Calvo, B. Corneal biomechanics after intrastromal ring surgery: Optomechanical in silico assessment. Transl. Vis. Sci. Technol. 2020, 9, 26. [Google Scholar] [CrossRef]
- Albán-Cadena, A.C.; Villalba-Meneses, F.; Pila-Varela, K.O.; Moreno-Calvo, A.; Villalba-Meneses, C.P.; Almeida-Galárraga, D.A. Wearable sensors in the diagnosis and study of Parkinson’s disease symptoms: A systematic review. J. Med. Eng. Technol. 2021, 45, 532–545. [Google Scholar] [CrossRef]
- Nejad, T.M.; Foster, C.; Gongal, D. Finite element modelling of cornea mechanics: A review. Arq. Bras. Oftalmol. 2014, 77, 60–65. [Google Scholar] [CrossRef]
- Kling, S.; Bekesi, N.; Dorronsoro, C.; Pascual, D.; Marcos, S. Corneal viscoelastic properties from finite-element analysis of in vivo air-puff deformation. PLoS ONE 2014, 9, e104904. [Google Scholar] [CrossRef]
- Lago, M.A.; Rupérez, M.J.; Monserrat, C.; Martínez-Martínez, F.; Martinez-Sanchis, S.; Larra, E.; Díez-Ajenjo, M.A.; Peris-Martínez, C. Patient-specific simulation of the intrastromal ring segment implantation in corneas with keratoconus. J. Mech. Behav. Biomed. Mater. 2015, 51, 260–268. [Google Scholar] [CrossRef] [PubMed]
- Pandolfi, A.; Manganiello, F. A model for the human cornea: Constitutive formulation and numerical analysis. Biomech. Model. Mechanobiol. 2006, 5, 237–246. [Google Scholar] [CrossRef] [PubMed]
- Pandolfi, A. Cornea modelling. Eye Vis. 2020, 7, 2. [Google Scholar] [CrossRef] [PubMed]
- Whitford, C.; Movchan, N.V.; Studer, H.; Elsheikh, A. A viscoelastic anisotropic hyperelastic constitutive model of the human cornea. Biomech. Model. Mechanobiol. 2018, 17, 19–29. [Google Scholar] [CrossRef] [PubMed]
- Jaén-Díaz, J.I.; Cordero-García, B.; de Castro, F.L.; De-Castro-Mesa, C.; Castilla-López-Madridejos, F.; Berciano-Martínez, F. Variabilidad diurna de la presión intraocular. Arch. Soc. Esp. Oftalmol. 2007, 82, 675–679. [Google Scholar] [CrossRef]
- Aguiar Salazar, E.D.; Alcivar Carmigniani, A.S.; Aldaz Luna, B.P.; Clavijo Calderón, D.F.; Echeverría Ortíz, P.P.; Madrid Pérez, M.A.; Villalba-Meneses, G.F.; Almeida-Galárraga, D. Design of a glove controlled by electromyographic signals for the rehabilitation of patients with rheumatoid arthritis. In Information and Communication Technologies; Springer International Publishing: Berlin/Heidelberg, Germany, 2020; pp. 3–11. [Google Scholar]
- Otuna-Hernández, D.; Espinoza-Castro, L.; Yánez-Contreras, P.; Villalba-Meneses, F.; Cadena-Morejón, C.; Guevara, C.; Cruz-Varela, J.; Tirado-Espín, A.; Almeida-Galárraga, D. Diagnosis and degree of evolution in a keratoconus-type corneal ectasia from image processing. In Smart Technologies, Systems and Applications; Springer: Cham, Switzerland, 2023; pp. 284–297. [Google Scholar]
- Ashofteh Yazdi, A.; Melchor, J.; Torres, J.; Faris, I.; Callejas, A.; Gonzalez-Andrades, M.; Rus, G. Characterization of non-linear mechanical behavior of the cornea. Sci. Rep. 2020, 10, 11549. [Google Scholar] [CrossRef]
- Jain, R.; Grewal, S.P.S. Pentacam: Principle and Clinical Applications. J. Curr. Glaucoma Pract. 2009, 3, 20–32. [Google Scholar] [CrossRef]
- Falgayrettes, N.; Patoor, E.; Cleymand, F.; Zevering, Y.; Perone, J.M. Biomechanics of keratoconus: Two numerical studies. PLoS ONE 2023, 18, e0278455. [Google Scholar] [CrossRef]
- Feizi, S.; Jafarinasab, M.R.; Karimian, F.; Hasanpour, H.; Masudi, A. Central and peripheral corneal thickness measurement in normal and keratoconic eyes using three corneal pachymeters. J. Ophthalmic Vis. Res. 2014, 9, 296–304. [Google Scholar]
- Wallang, B.S.; Das, S. Keratoglobus. EYE 2013, 27, 1004–1012. [Google Scholar] [CrossRef]
- Weaver, A.A.; Stitzel, S.M.; Stitzel, J.D. Injury risk prediction from computational simulations of ocular blast loading. Biomech. Model. Mechanobiol. 2017, 16, 463–477. [Google Scholar] [CrossRef] [PubMed]
- Velasco, J.G.V. Radios de curvatura corneal encontrados en diferentes condiciones corneales de carácter hereditario, genético o iatrogénico. Cienc. Tecnol. Para Salud Vis. Ocul. 2009, 7, 109–118. [Google Scholar]
- Pacific, E.O. Corrección del queratocono con microlentes de alta excentricidad. Rev. Cuba. Oftalmol. 2018, 31, 54–60. [Google Scholar]
- Aguiar-Salazar, E.; Cerón-Andrade, B.; Valenzuela-Guerra, A.; Negrete-Bolagay, D.; Fiallos-Ayala, X.; Suntaxi-Dominguez, D.; Villalba-Meneses, F.; Tirado-Espín, A.; Almeida-Galárraga, D. Intelligent electromyograph for early detection of myopathy and neuropathy using EMG signals and neural network model. In Information and Communication Technologies; Springer International Publishing: Berlin/Heidelberg, Germany, 2022; pp. 32–45. [Google Scholar]
- Li, X.; Luo, S.; Wang, Z.; Miao, Y.; Zhu, M.; Zheng, X.; Luo, G.; Bao, F.; Chen, S.; Wang, J. Dynamic topography analysis of the cornea and its application to the diagnosis of keratoconus. Comput. Biol. Med. 2023, 158, 106800. [Google Scholar] [CrossRef] [PubMed]
- Almaguer, M.G.; Díaz, T.C.; Suárez, R.G.P.; Izquierdo, D.C.; Fernández, E.M.; Chavarría, J.A.G. Crosslinking en la cirugía refractiva. Rev. Cuba. Oftalmol. 2018, 31, 1–7. [Google Scholar]
- Zhang, X.; Munir, S.Z.; Karim, S.A.S.; Munir, W.M. A review of imaging modalities for detecting early keratoconus. EYE 2021, 35, 173–187. [Google Scholar] [CrossRef]
- Ramírez, M.E.M.; Parra, Z.P.; Leyva, E.E.; Díaz, L.O.; Hernández, S.M.L.; Villalón, S.M. Estudio comparativo de variables corneales entre ojos normales con sospecha de queratocono y con diagnóstico de queratocono. Rev. Cuba. Oftalmol. 2014, 27, 540–548. [Google Scholar]
- Moreno, N.R.; Srur, A.M.; Nieme, B.C. Cirugía refractiva: Indicaciones, técnicas y resultados. Rev. Méd. Clín. Condes 2010, 21, 901–910. [Google Scholar] [CrossRef]
- Suquilanda-Pesántez, J.D.; Salazar, E.D.A.; Almeida-Galárraga, D.; Salum, G.; Villalba-Meneses, F.; Gomezjurado, M.E.G. NIFtHool: An informatics program for identification of NifH proteins using deep neural networks. F1000Research 2022, 11, 164. [Google Scholar] [CrossRef]
- Tene-Hurtado, D.; Almeida-Galárraga, D.A.; Villalba-Meneses, G. Brain tumor segmentation based on 2D U-net using MRI multi-modalities brain images. In Smart Technologies, Systems and Applications; Springer International Publishing: Berlin/Heidelberg, Germany, 2022; pp. 345–359. [Google Scholar]
Disclaimer/Publisher’s Note: The statements, opinions and data contained in all publications are solely those of the individual author(s) and contributor(s) and not of MDPI and/or the editor(s). MDPI and/or the editor(s) disclaim responsibility for any injury to people or property resulting from any ideas, methods, instructions or products referred to in the content. |
© 2023 by the authors. Licensee MDPI, Basel, Switzerland. This article is an open access article distributed under the terms and conditions of the Creative Commons Attribution (CC BY) license (https://creativecommons.org/licenses/by/4.0/).