
Study on the Performance of Twin Shield Tunnel Excavation below Existing Multi-Arch Culvert Bridge in Close Vicinity

 , ,
, ,
Abstract
:1. Introduction
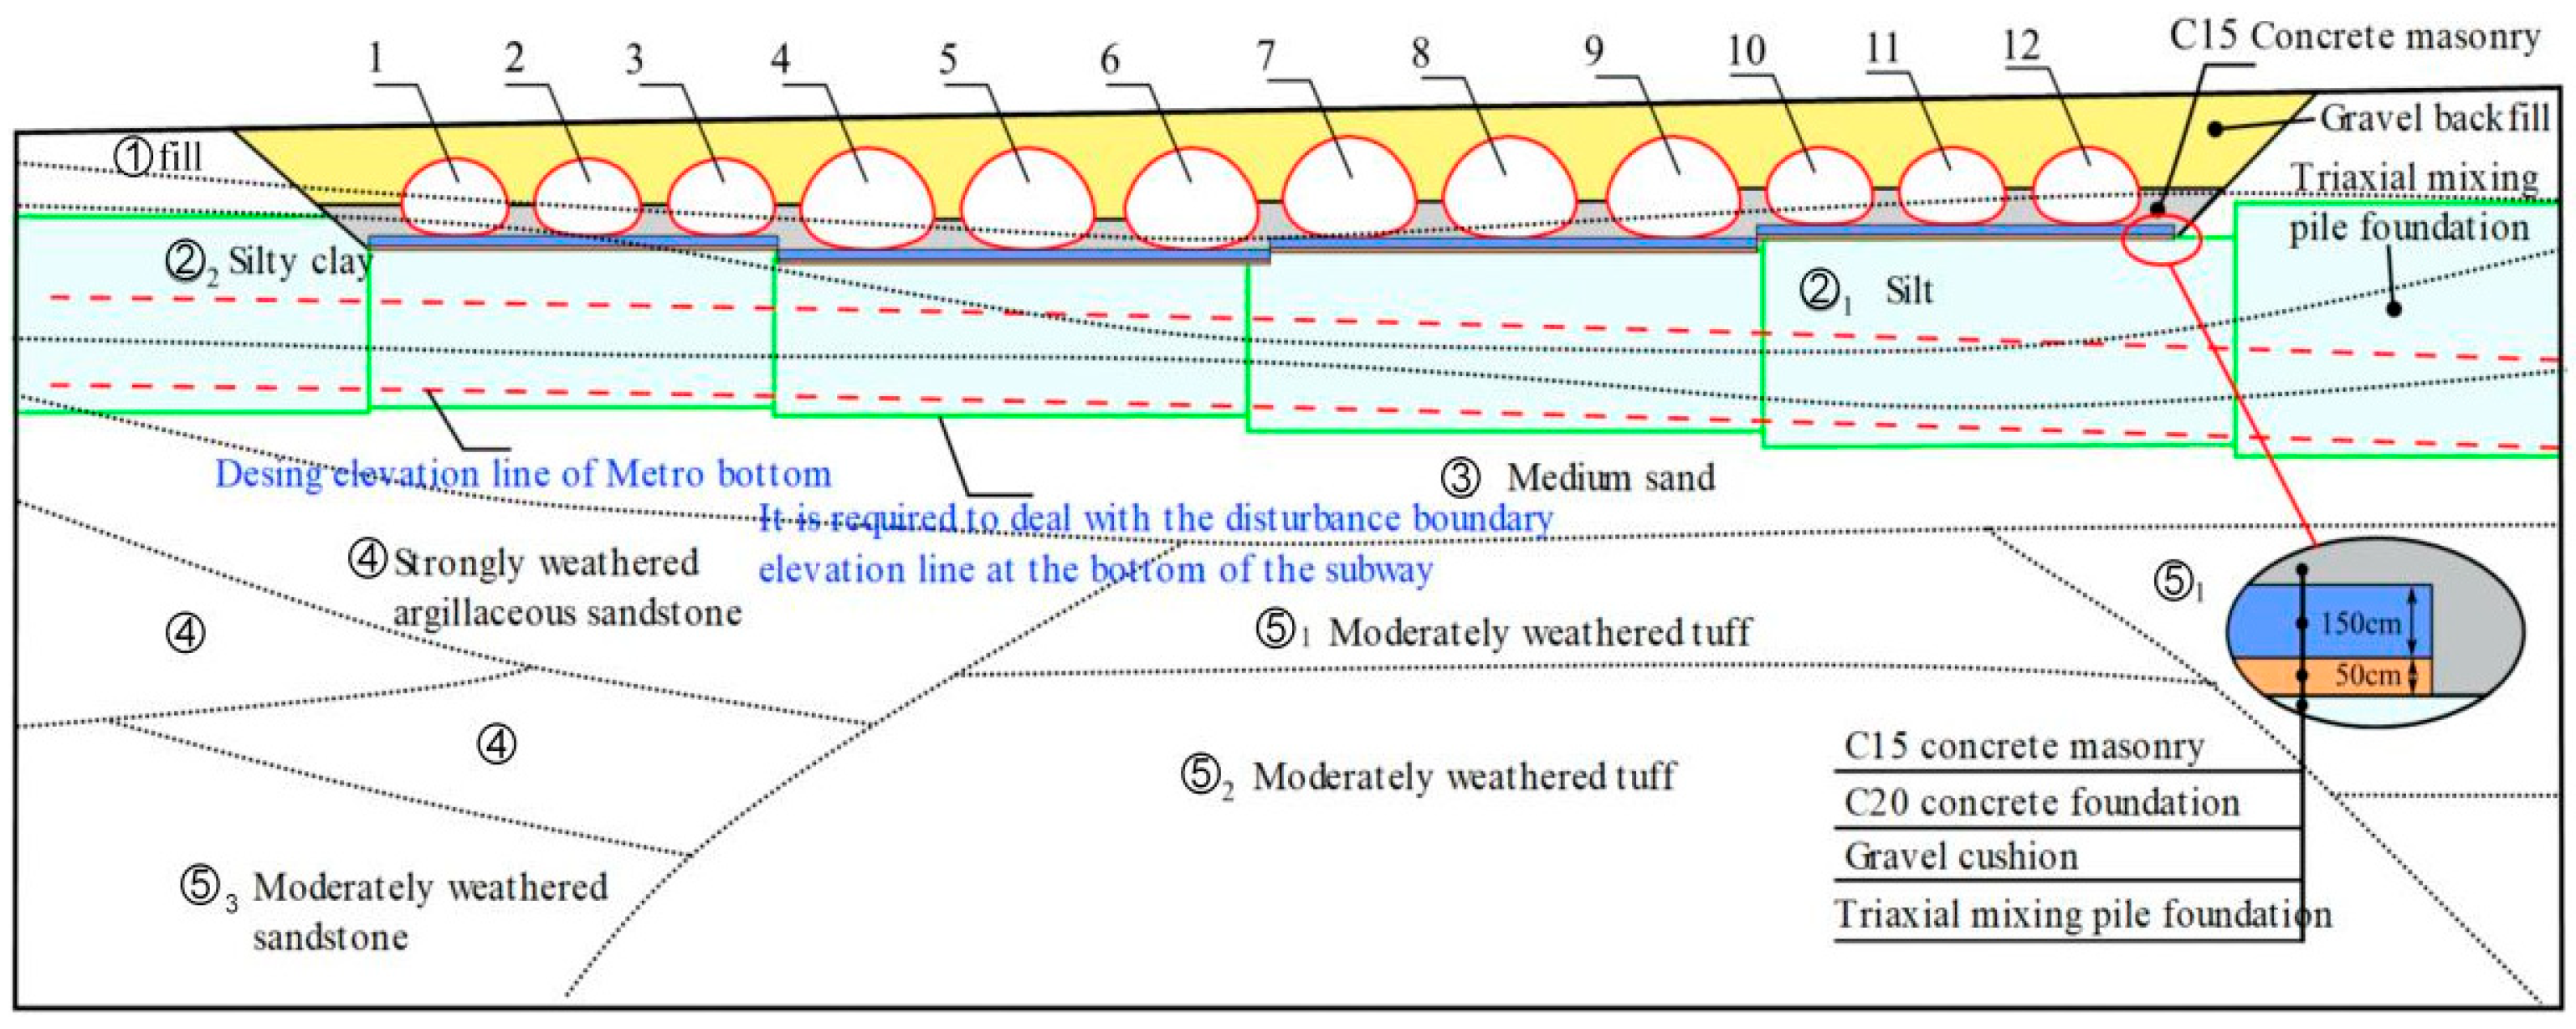
2. Project Overview
3. Numerical Simulation
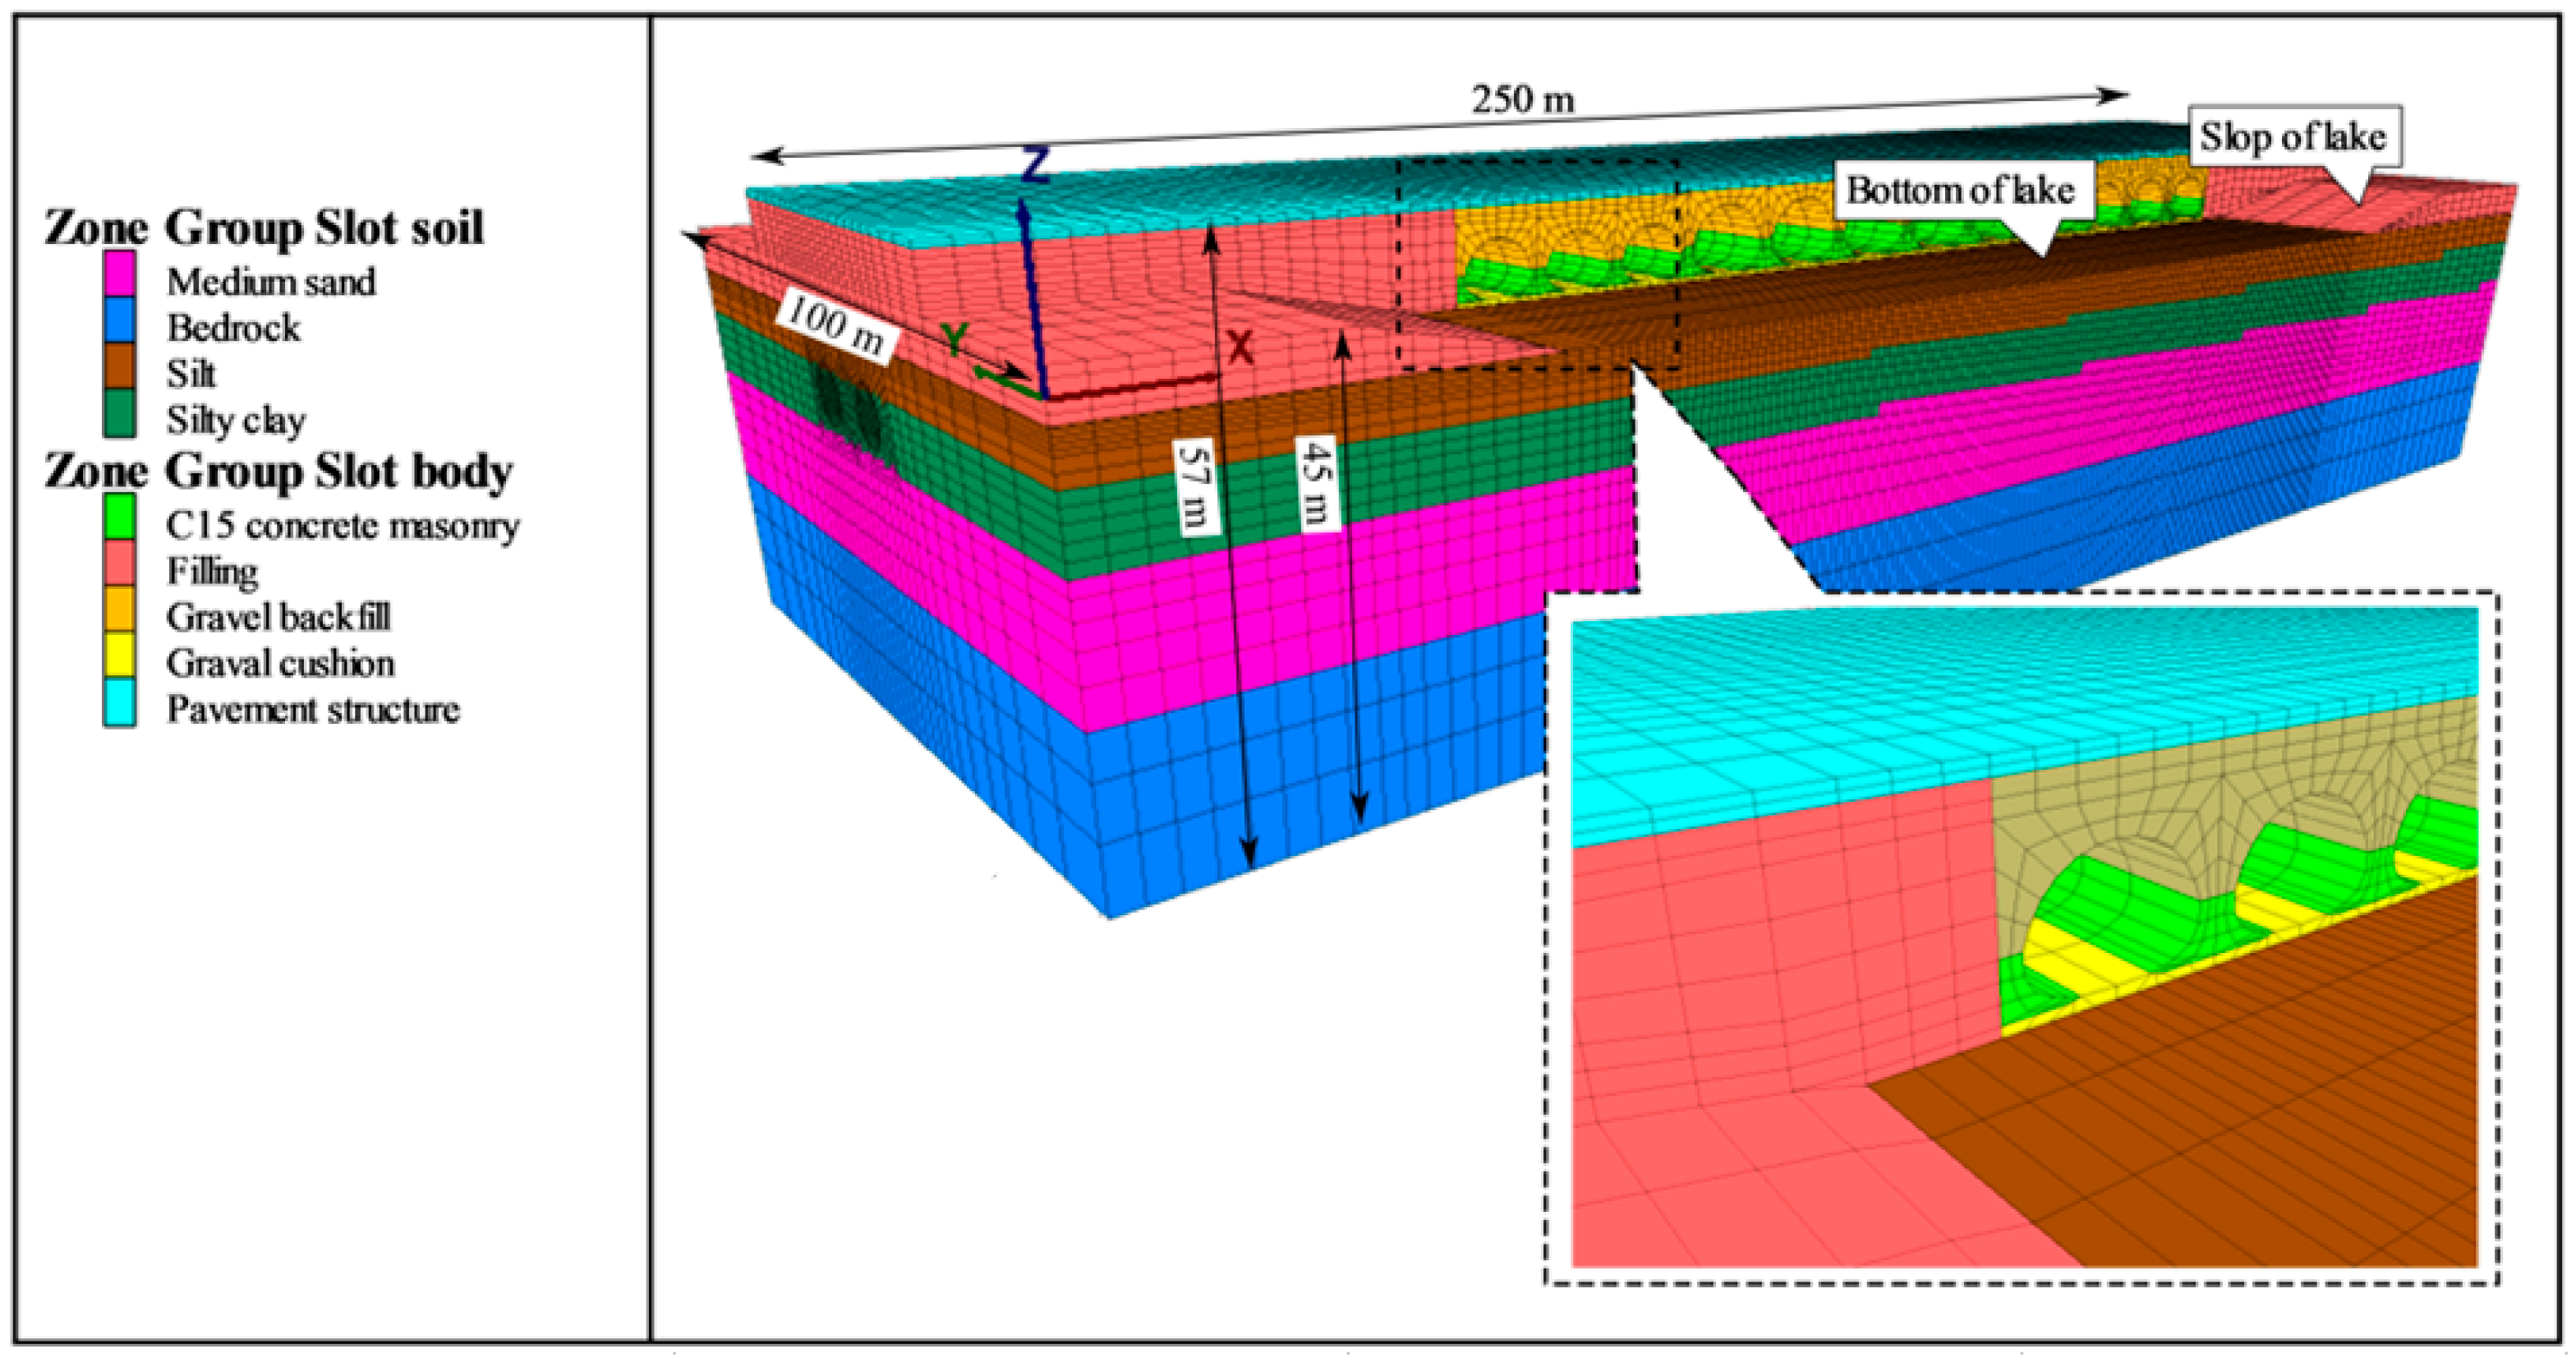
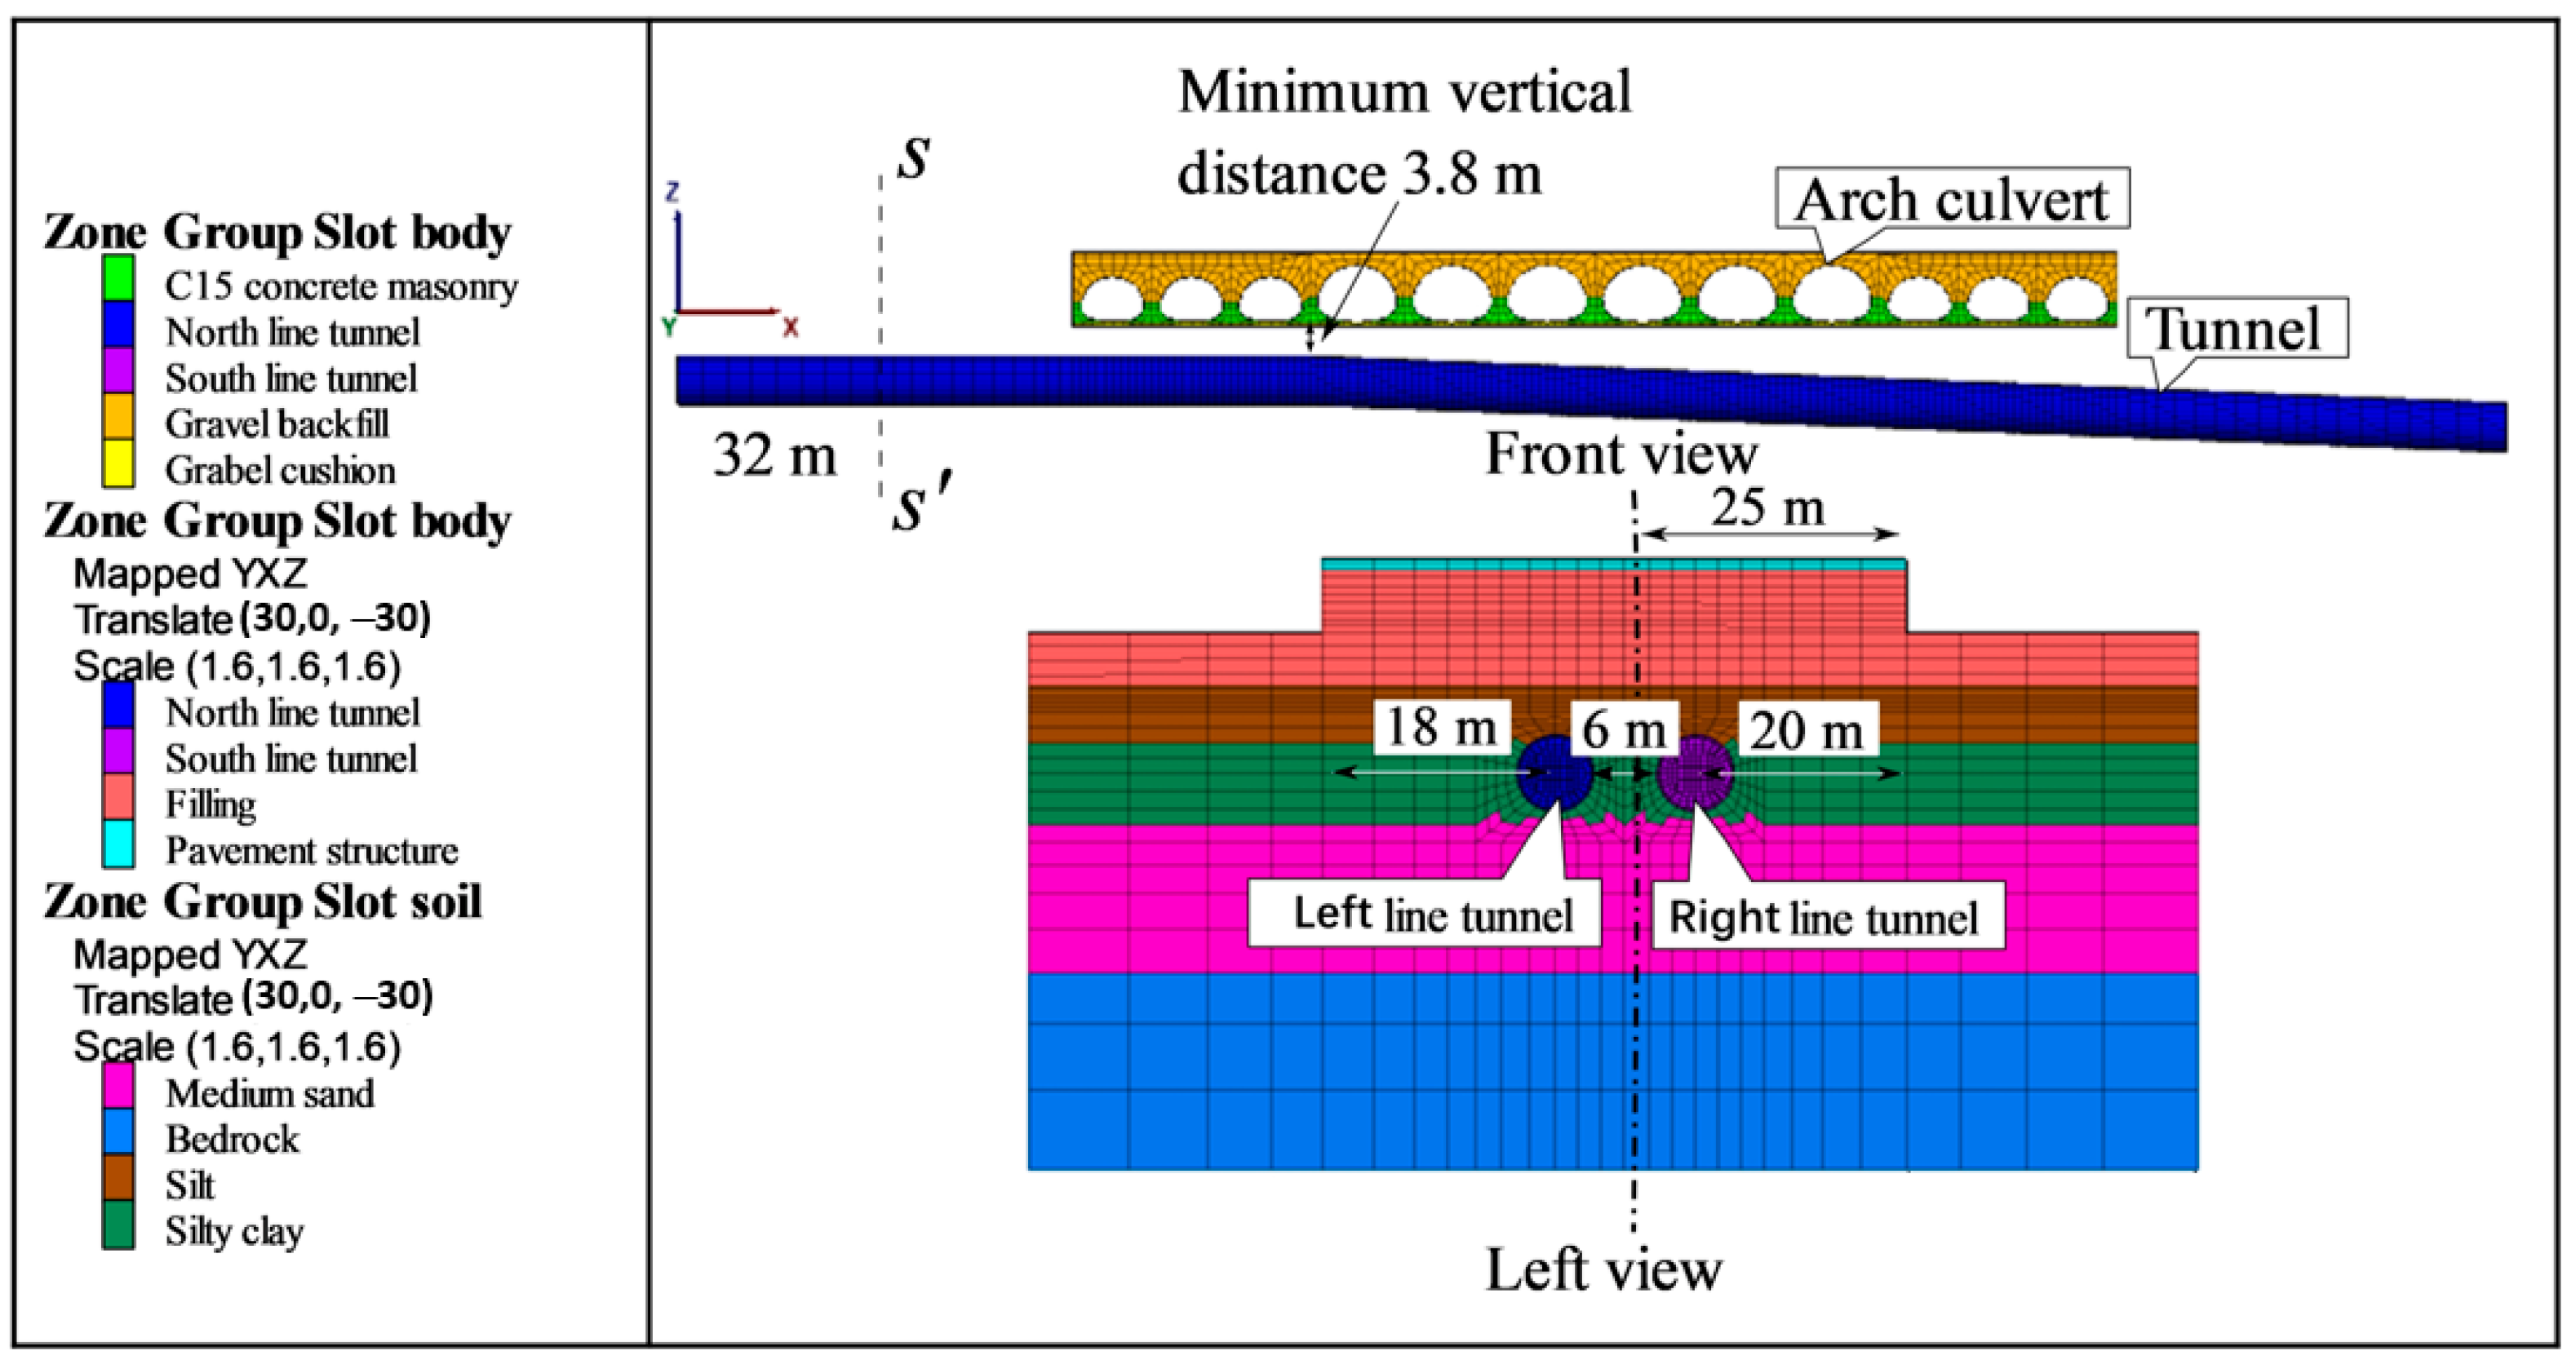
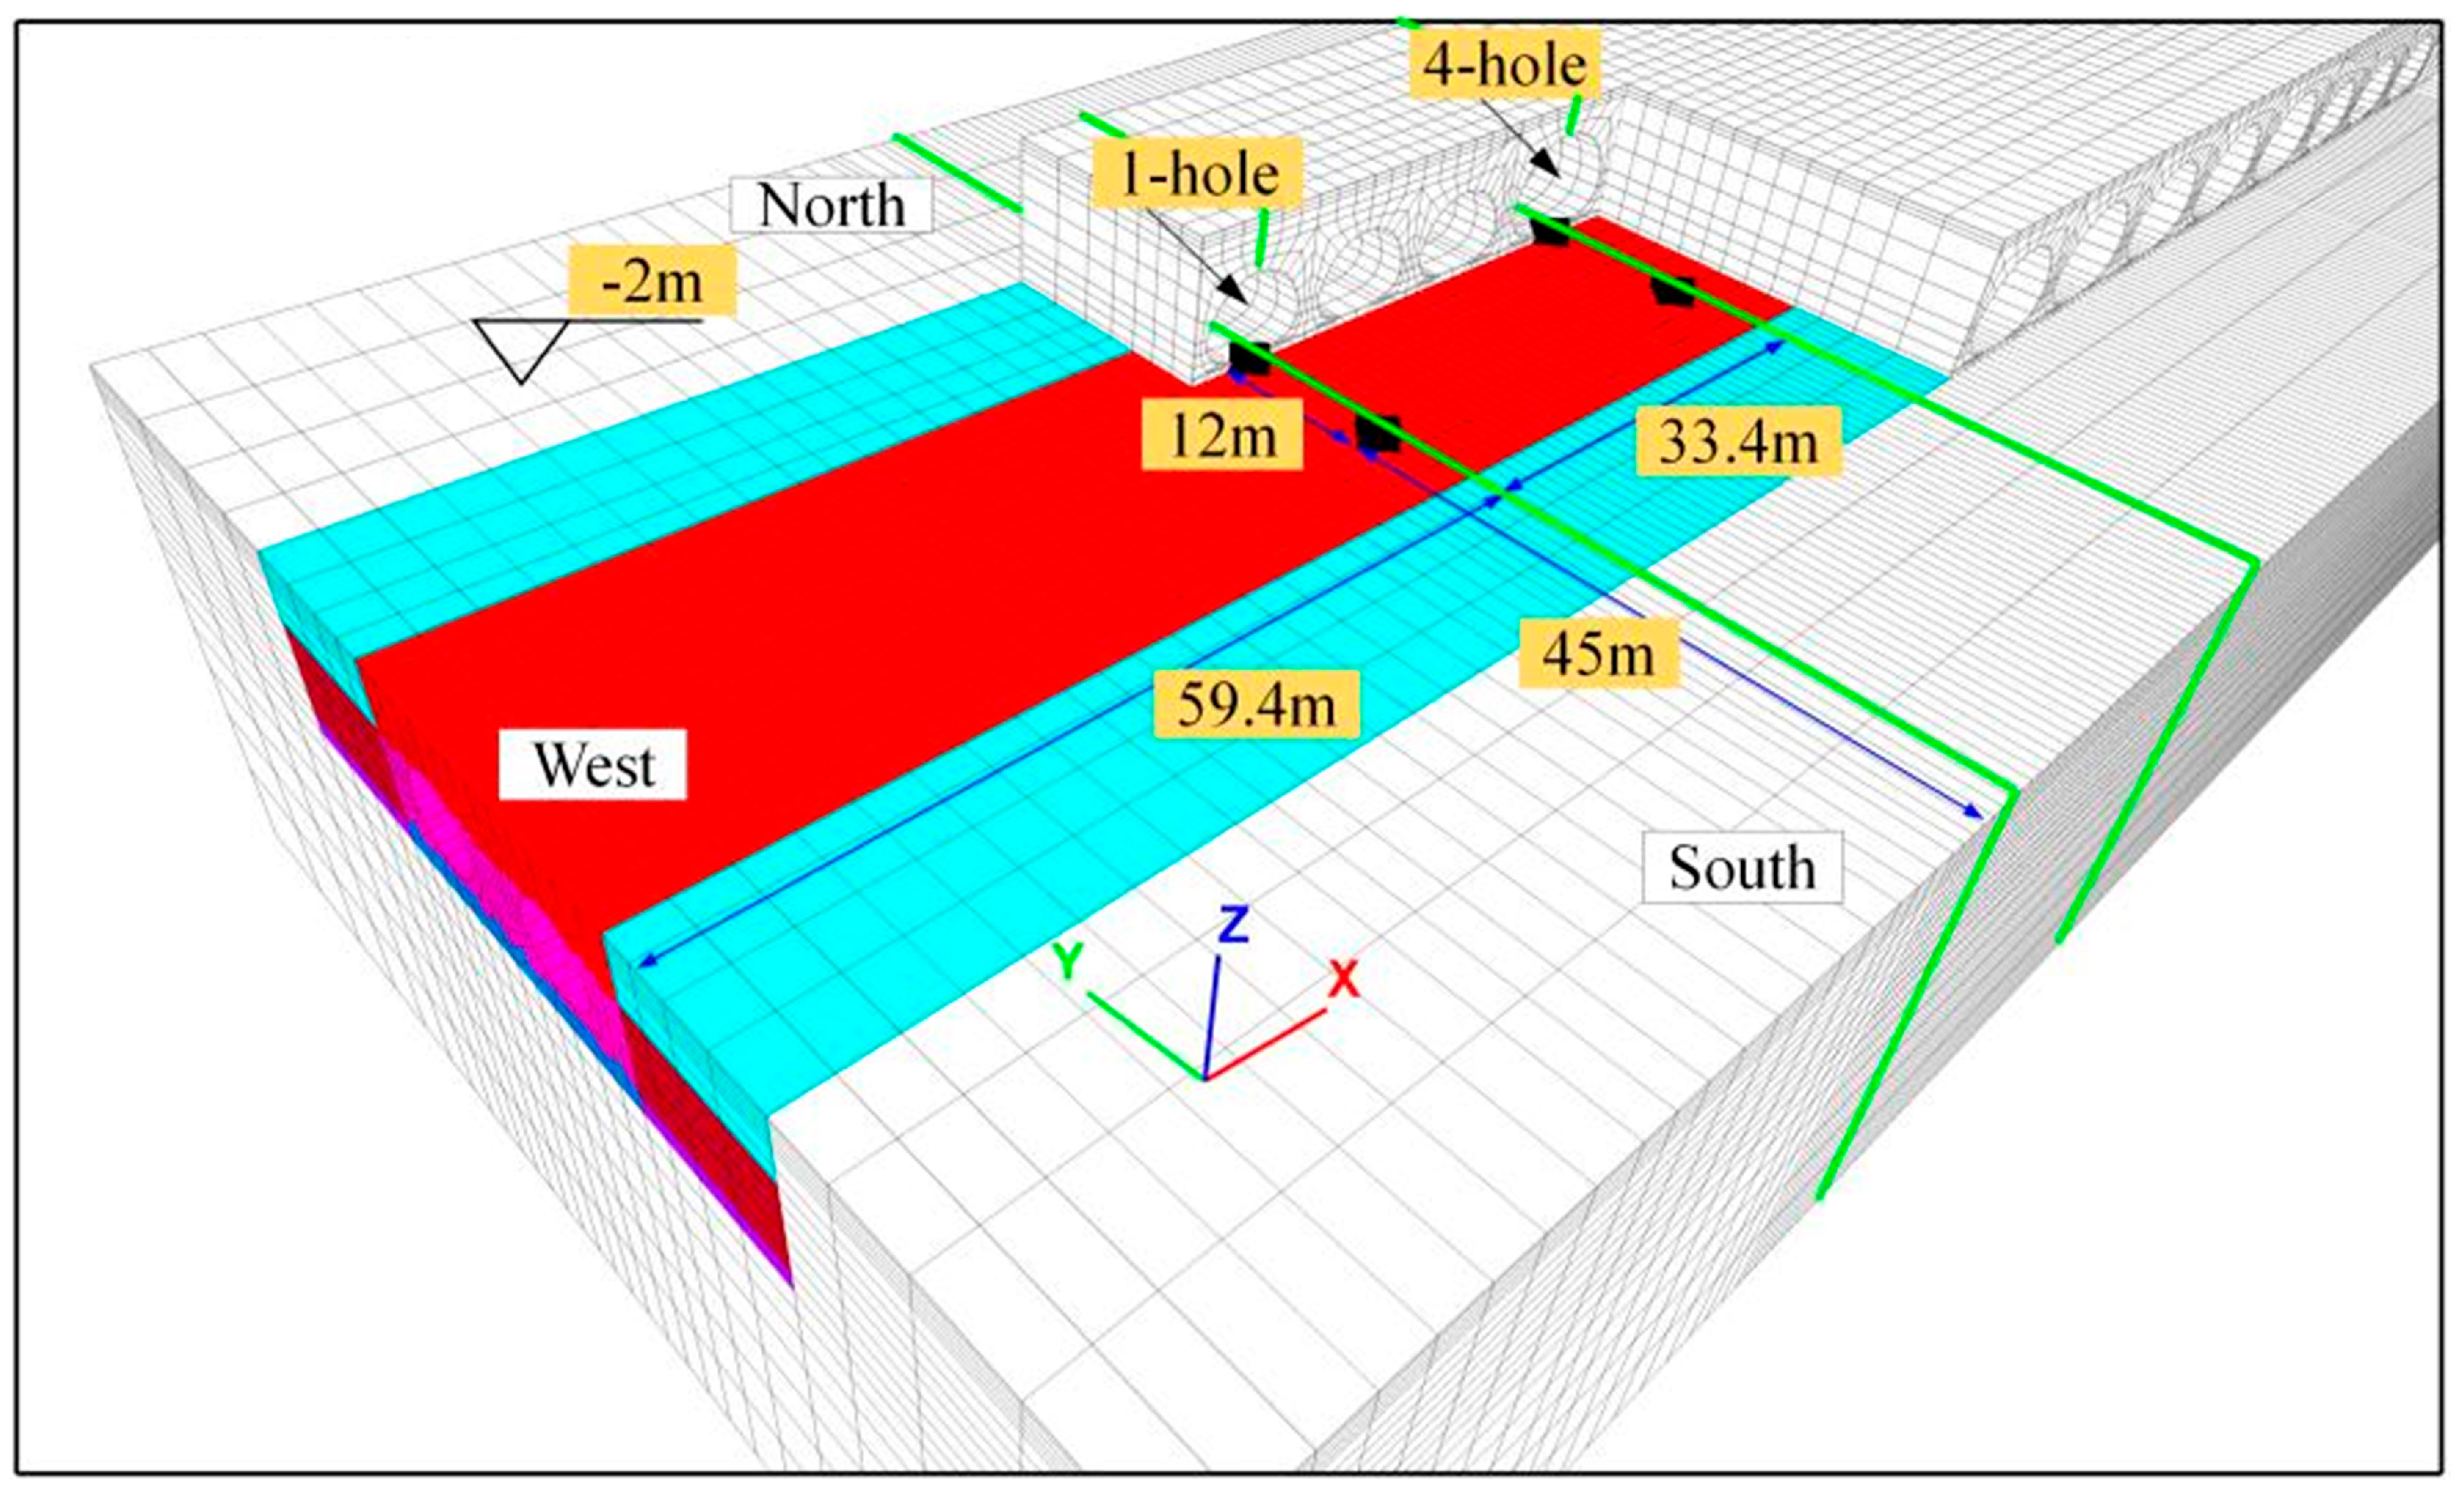
3.1. Finite Element Model
- (1)
- Composite strata parameters were chosen for the non-subway reinforced areas from a safety perspective.
- (2)
- The pile-reinforced area was supposed to be a homogeneous horizontal layer.
- (3)
- The road surface of the multi-arch culvert bridge was treated as horizontally flat, while the geological layers were simplified to be horizontally distributed.
- (4)
- The spatial effects of the shield tunnel excavation were not considered.
3.2. Parameter and Boundary Conditions
- (1)
- The normal displacement of nodes on the four lateral sides of the model are constrained to be fixed.
- (2)
- The displacement in all three directions at the bottom nodes are set to be fixed.
- (3)
- The top boundary is an unconstrained free boundary.
- (4)
- The normal displacement of nodes on the sides along the longitudinal direction of the multi-arch culvert bridge is also set to be fixed.
- (5)
- Non-permeable boundaries are set at the four lateral side boundaries and bottom boundary of the model.
- (6)
- The boundary of the top surface is set as permeable.
3.3. Tunnel Excavation Simulation
- (1)
- Excavate the soil and create liner structural elements attached to the tunnel linings to simulate the shield shells.
- (2)
- Apart from the liner structural elements, fix the displacements of all nodes of the solid and structural elements, and only assign a radial inward velocity of 1 × 10⁻⁴ (m/step) to the liner structural element nodes. Iterate for 130 steps to achieve a uniform radial contraction of 13 mm, simulating the gap between of shield tunnel linings and shield shells.
- (3)
- Fix the displacements of liner structural element nodes and release the node constraints of other solid and structural elements (except for boundaries), and then solve for equilibrium.
- (4)
- After each shield excavation of one ring by 2 m, repeat steps (1) to (3) for a new liner structural element.
3.4. Monitoring Point
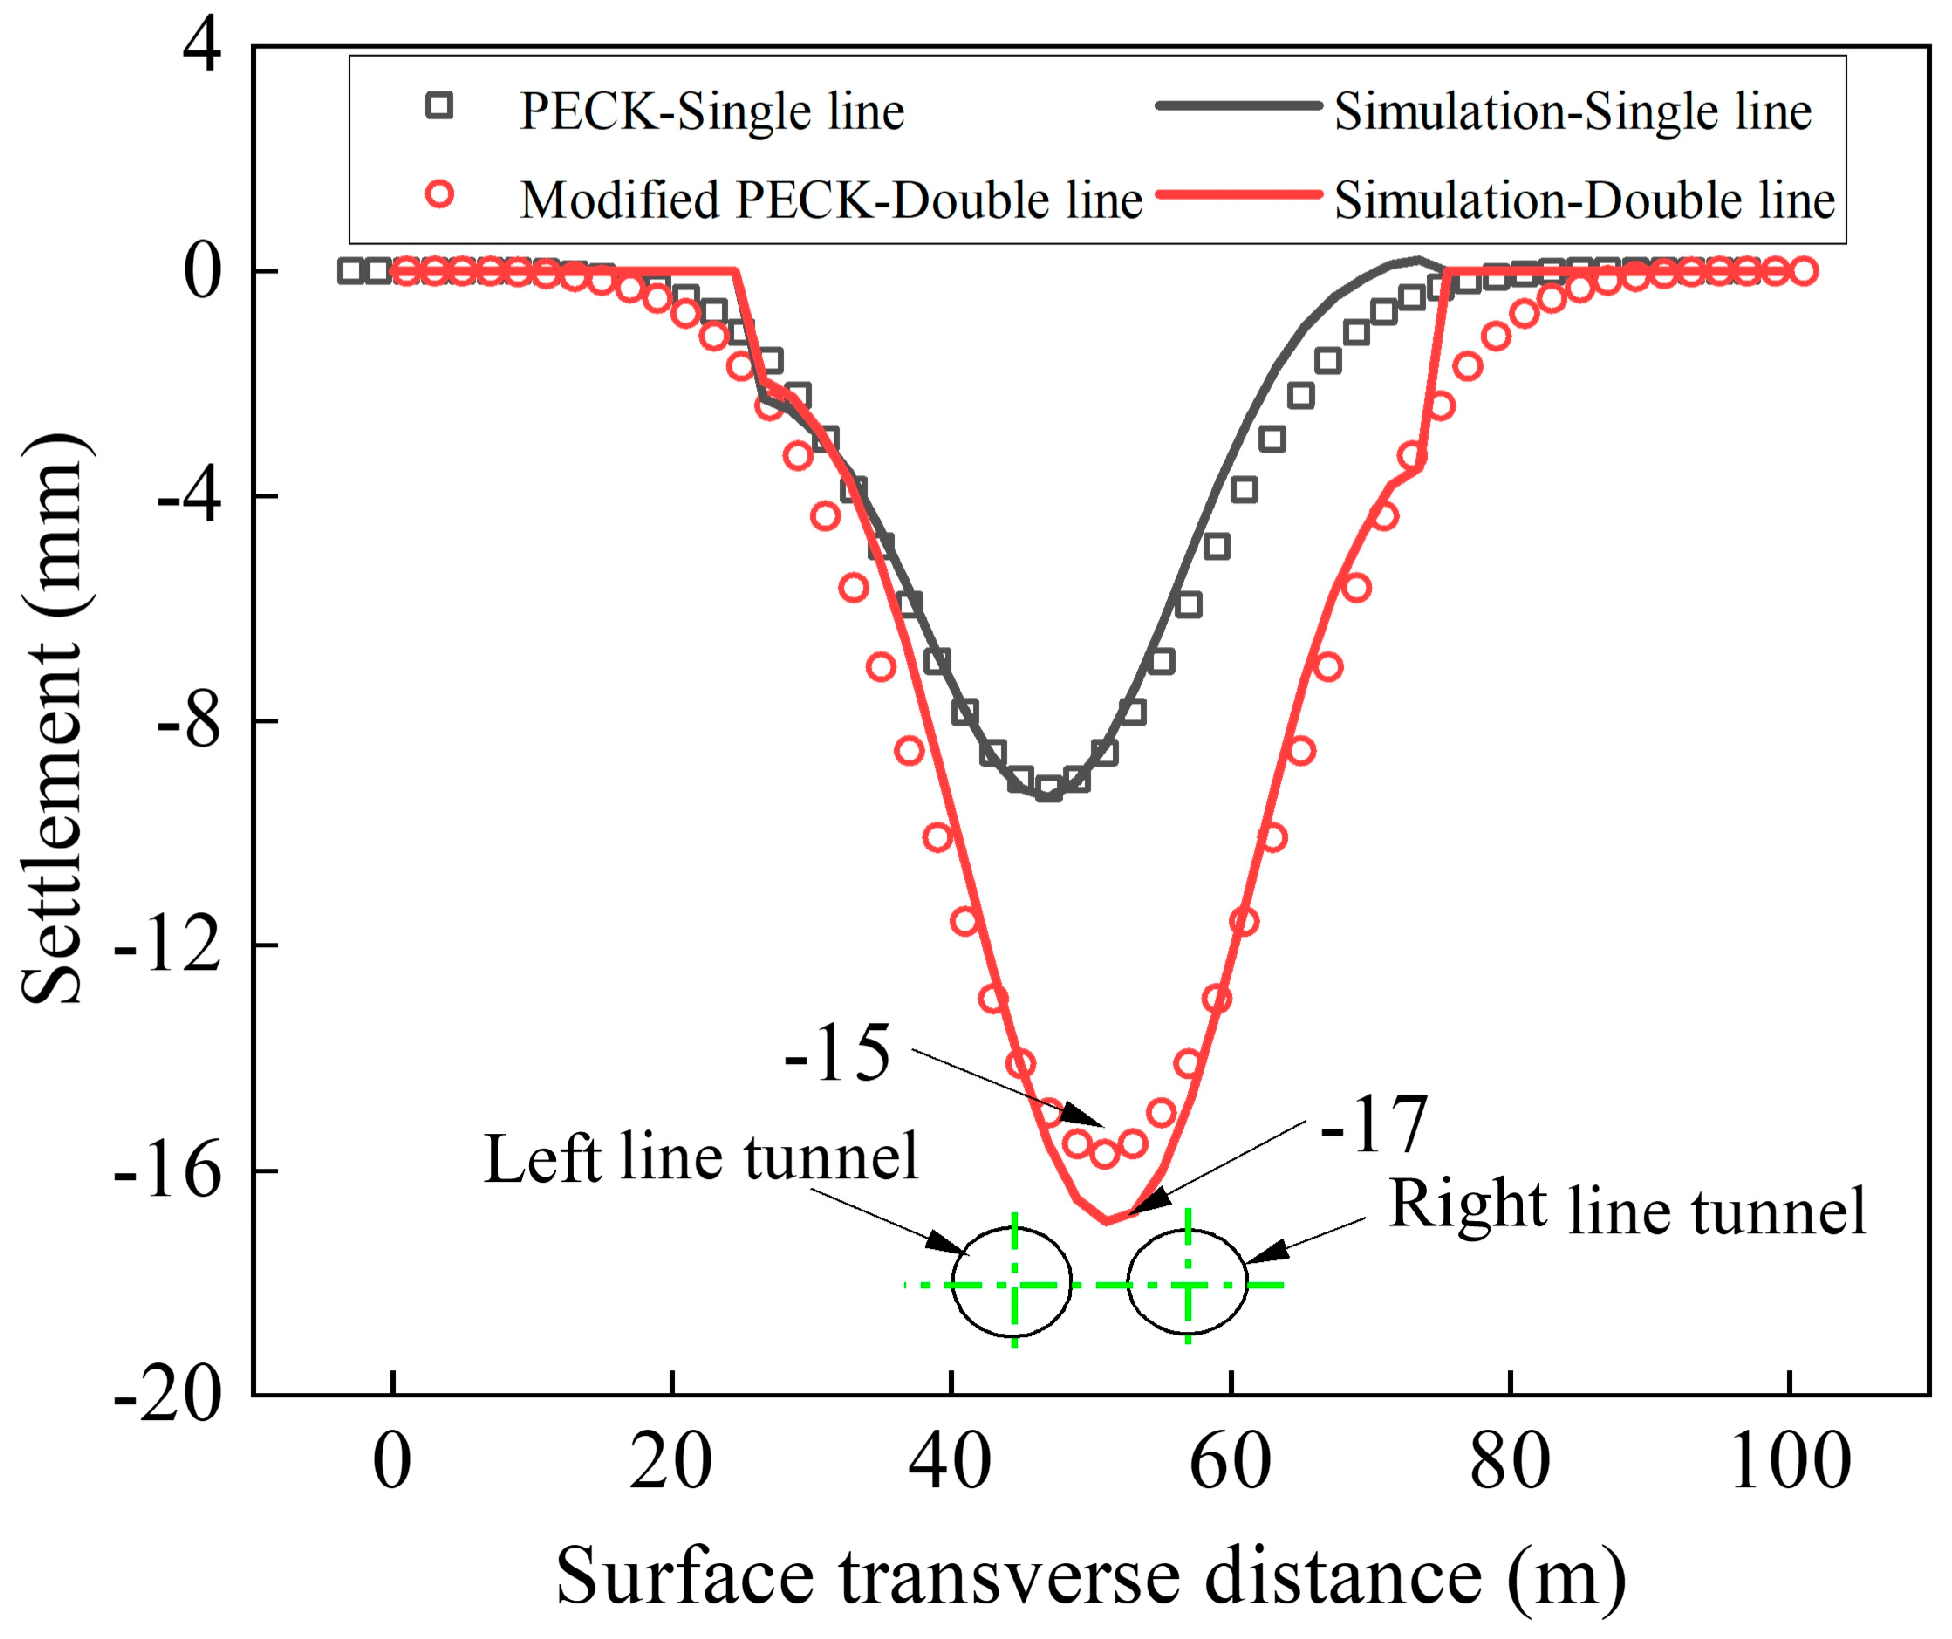
4. Model Verification
5. Results Analysis
5.1. Analysis of Different Foundation Reinforcement Schemes
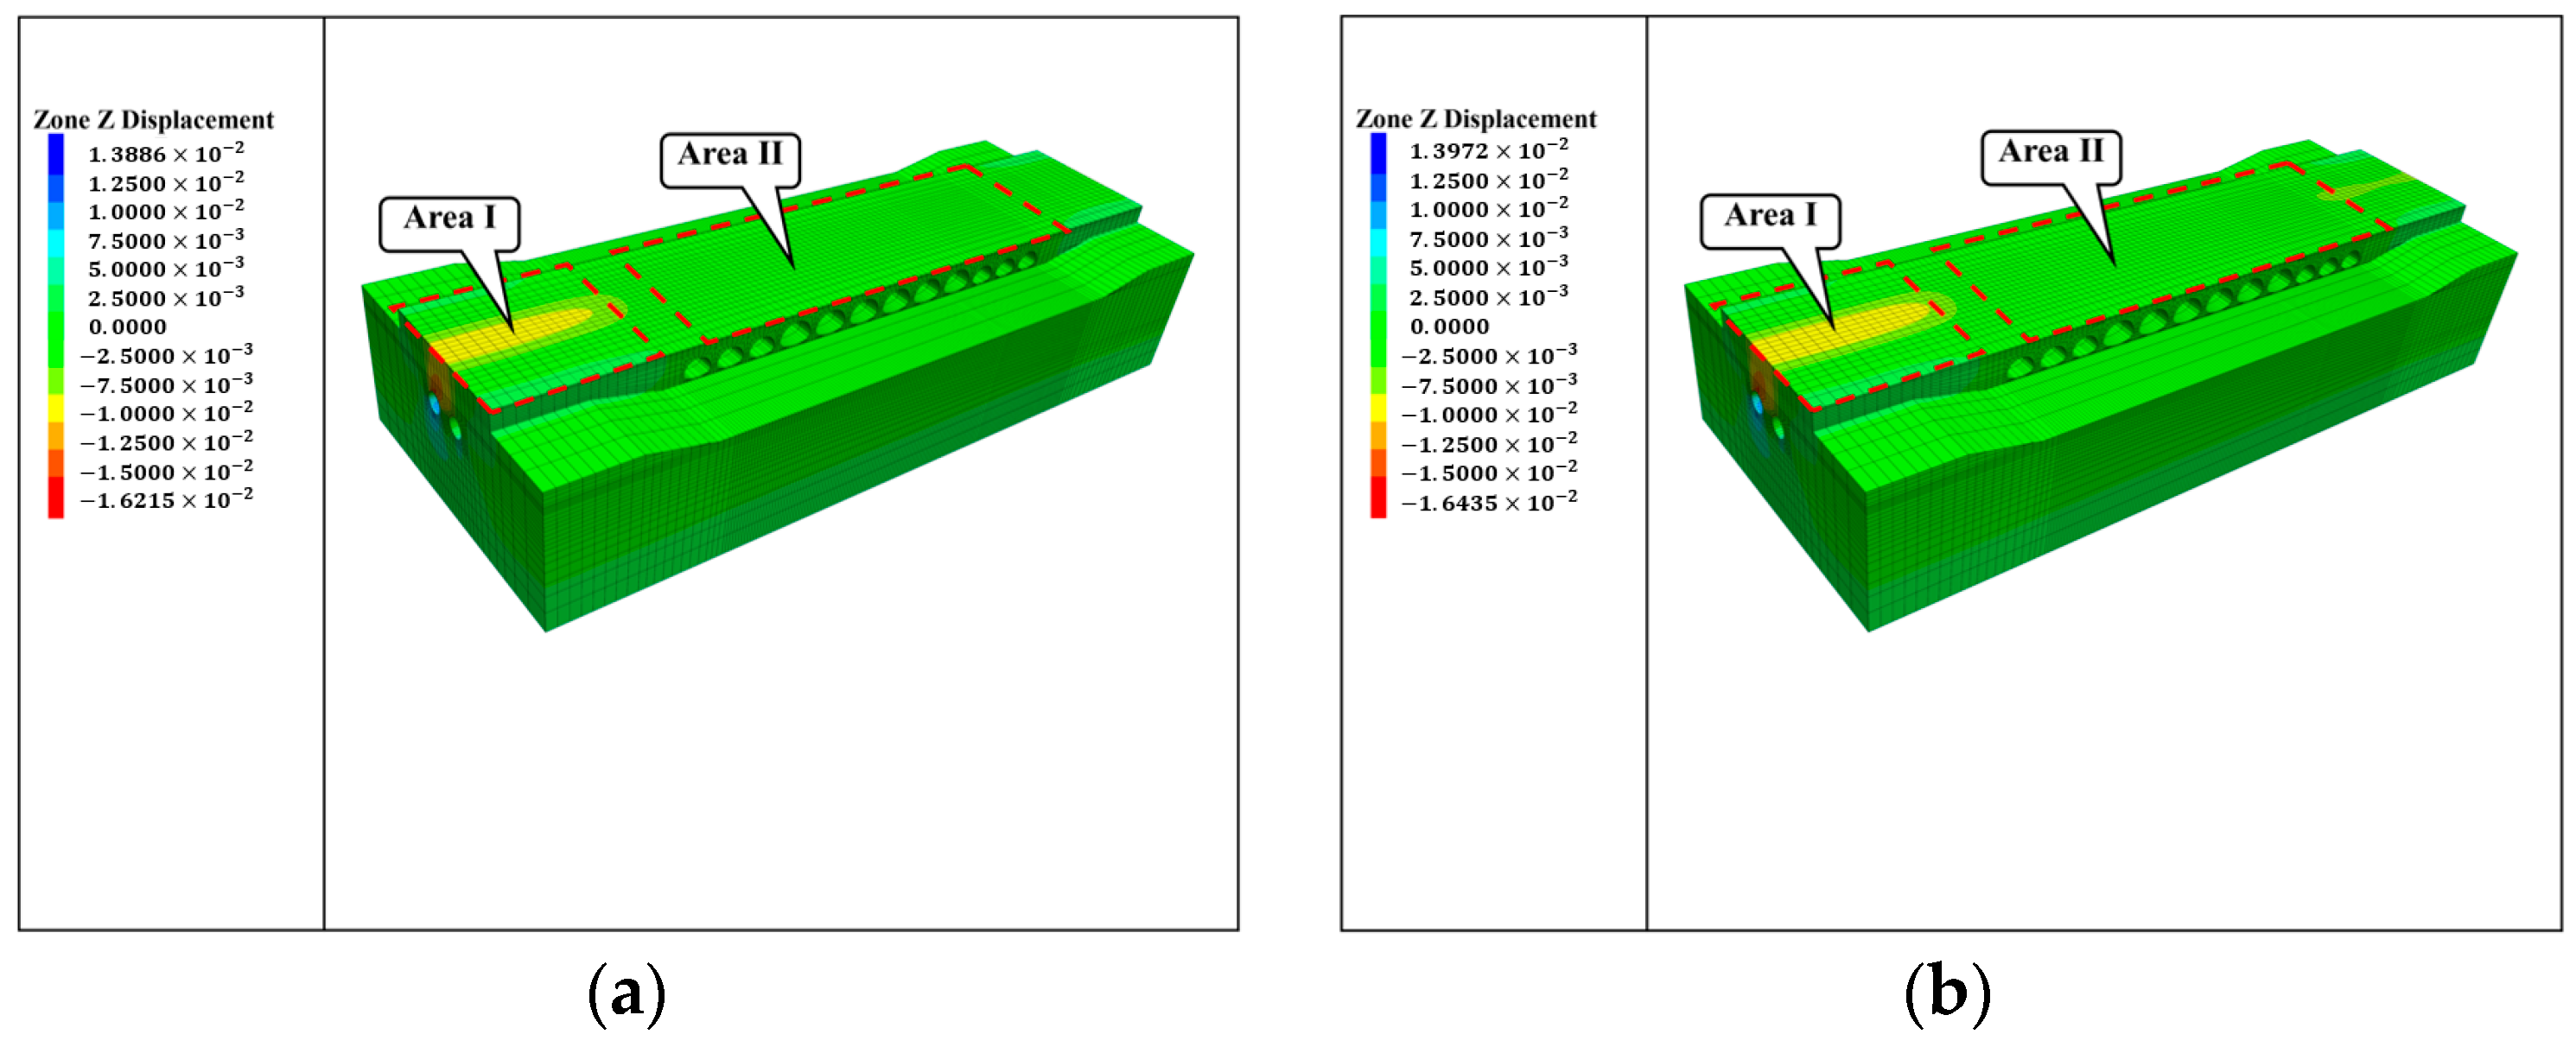
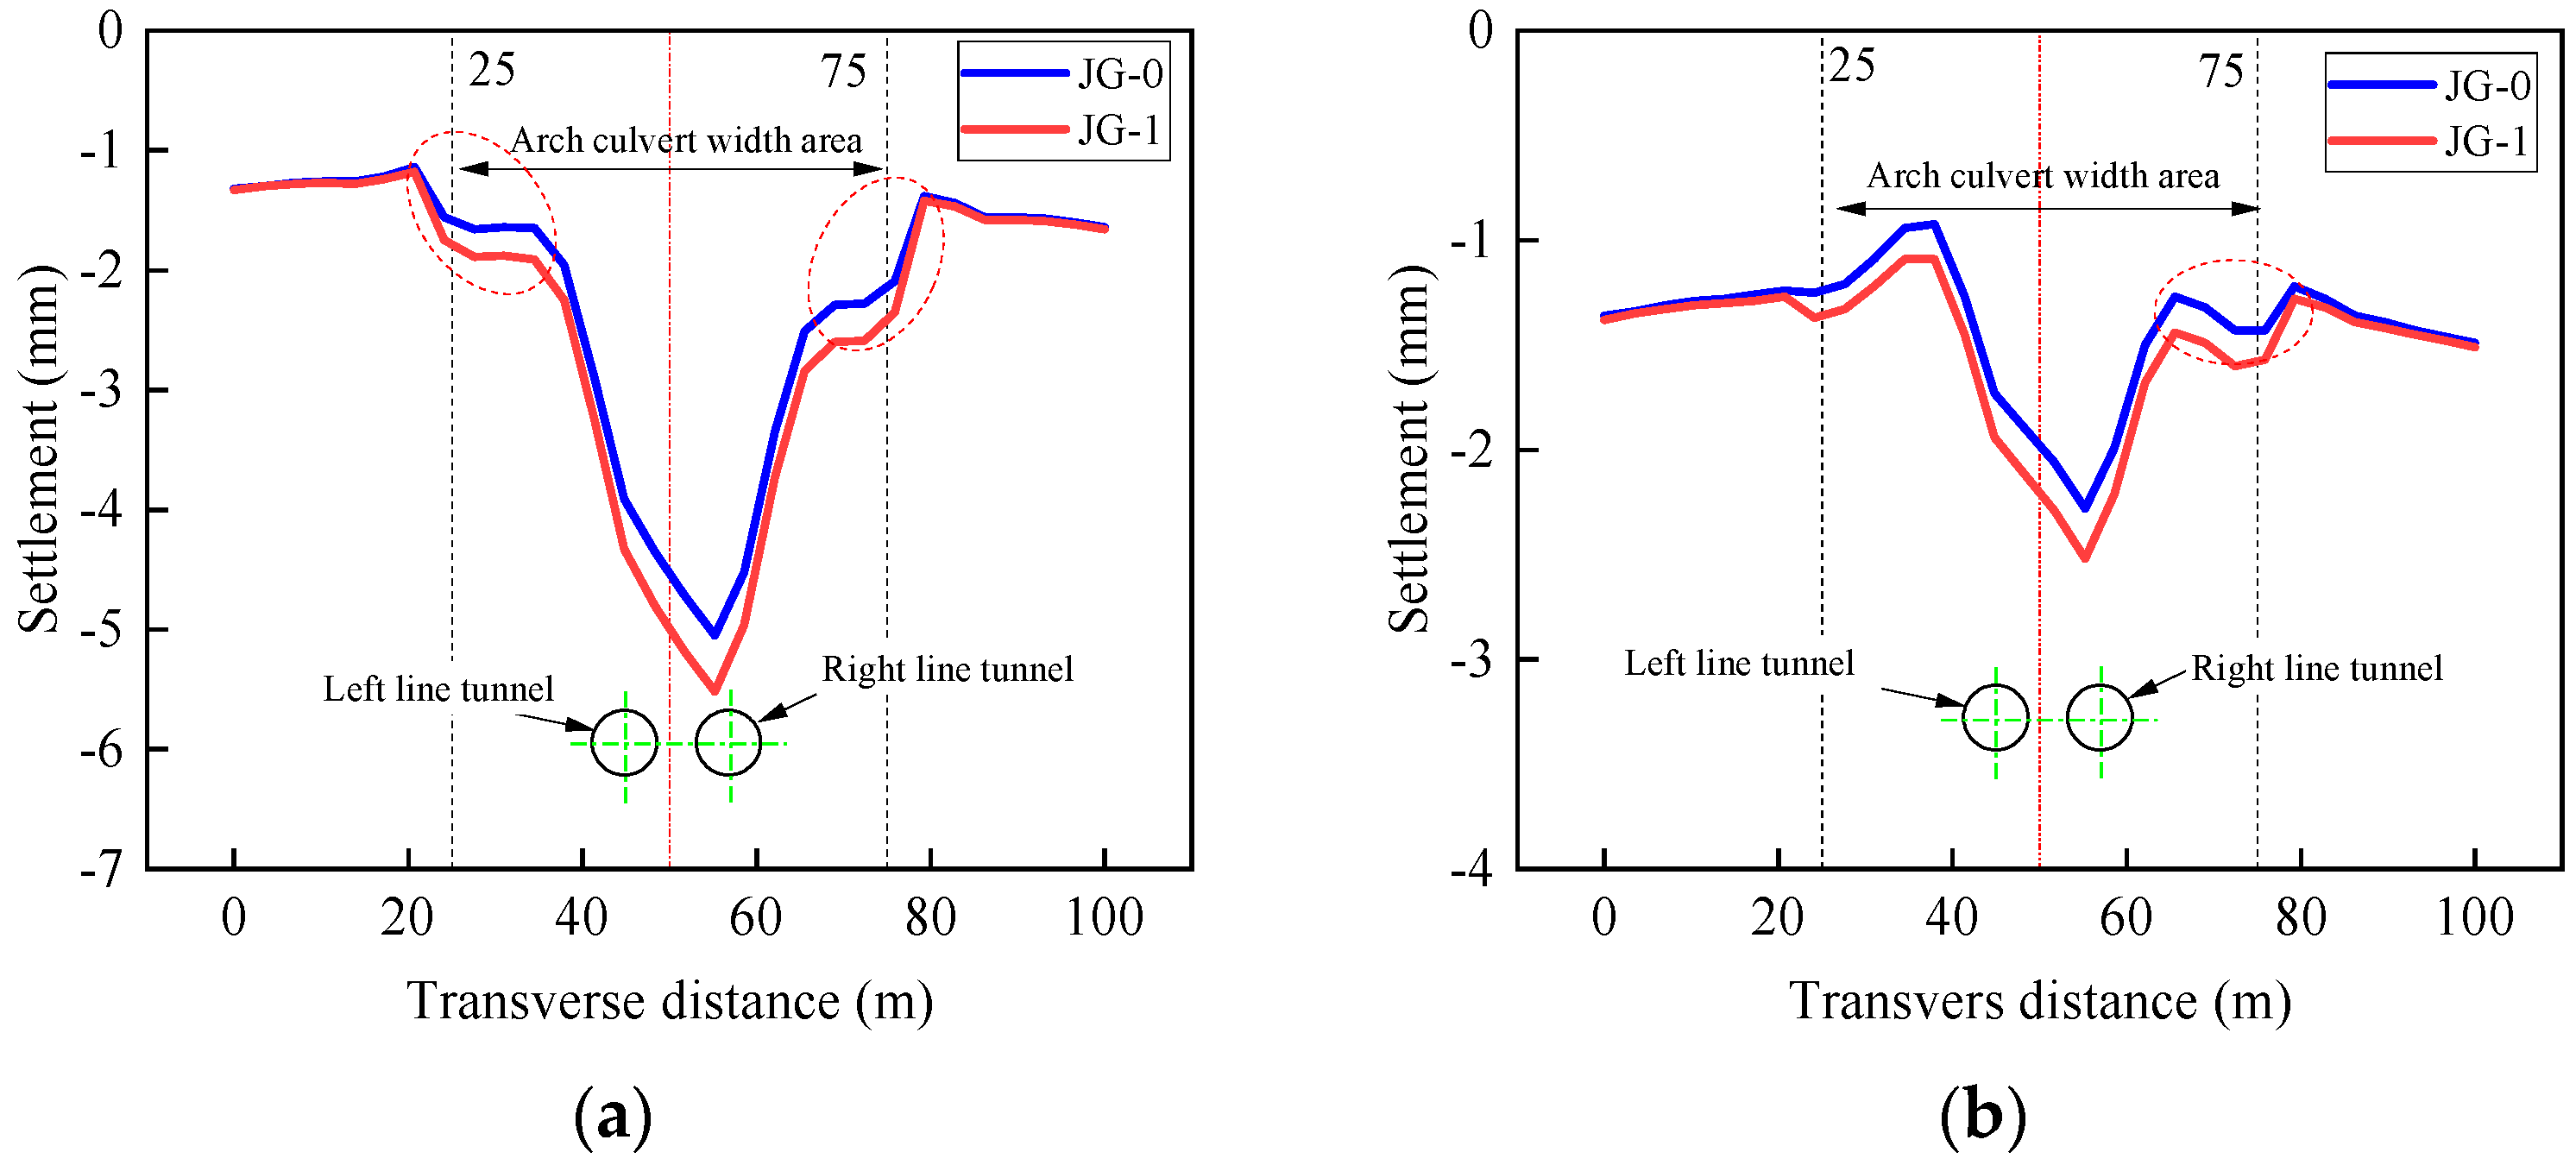
5.1.1. Foundation Settlement
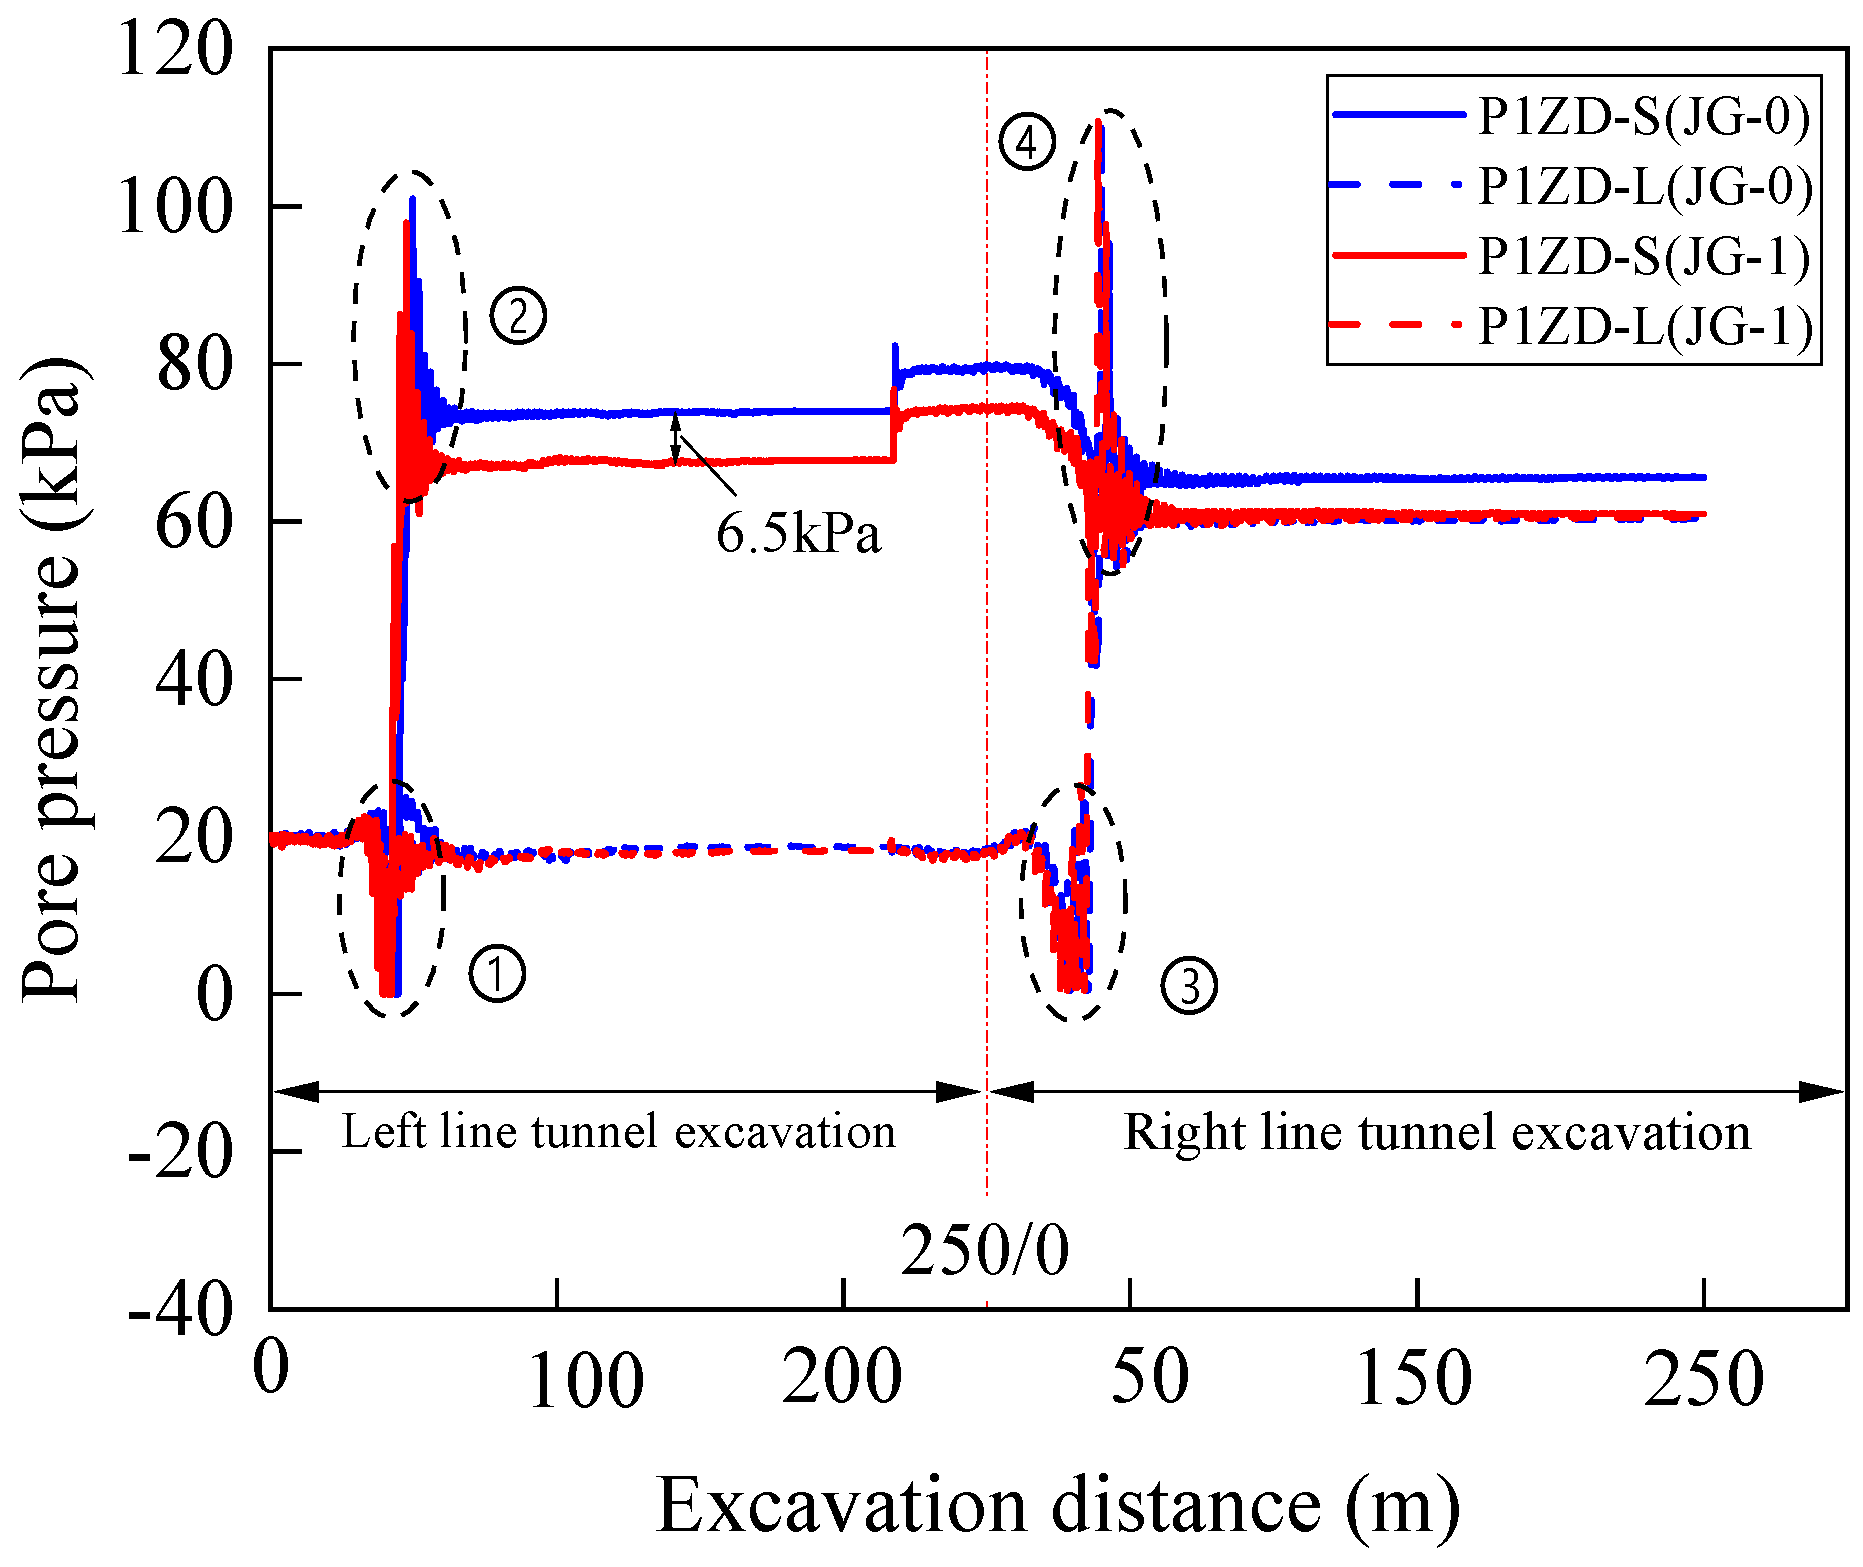
5.1.2. Pore Water Pressure
5.2. Analysis of Supporting and Grouting Pressure
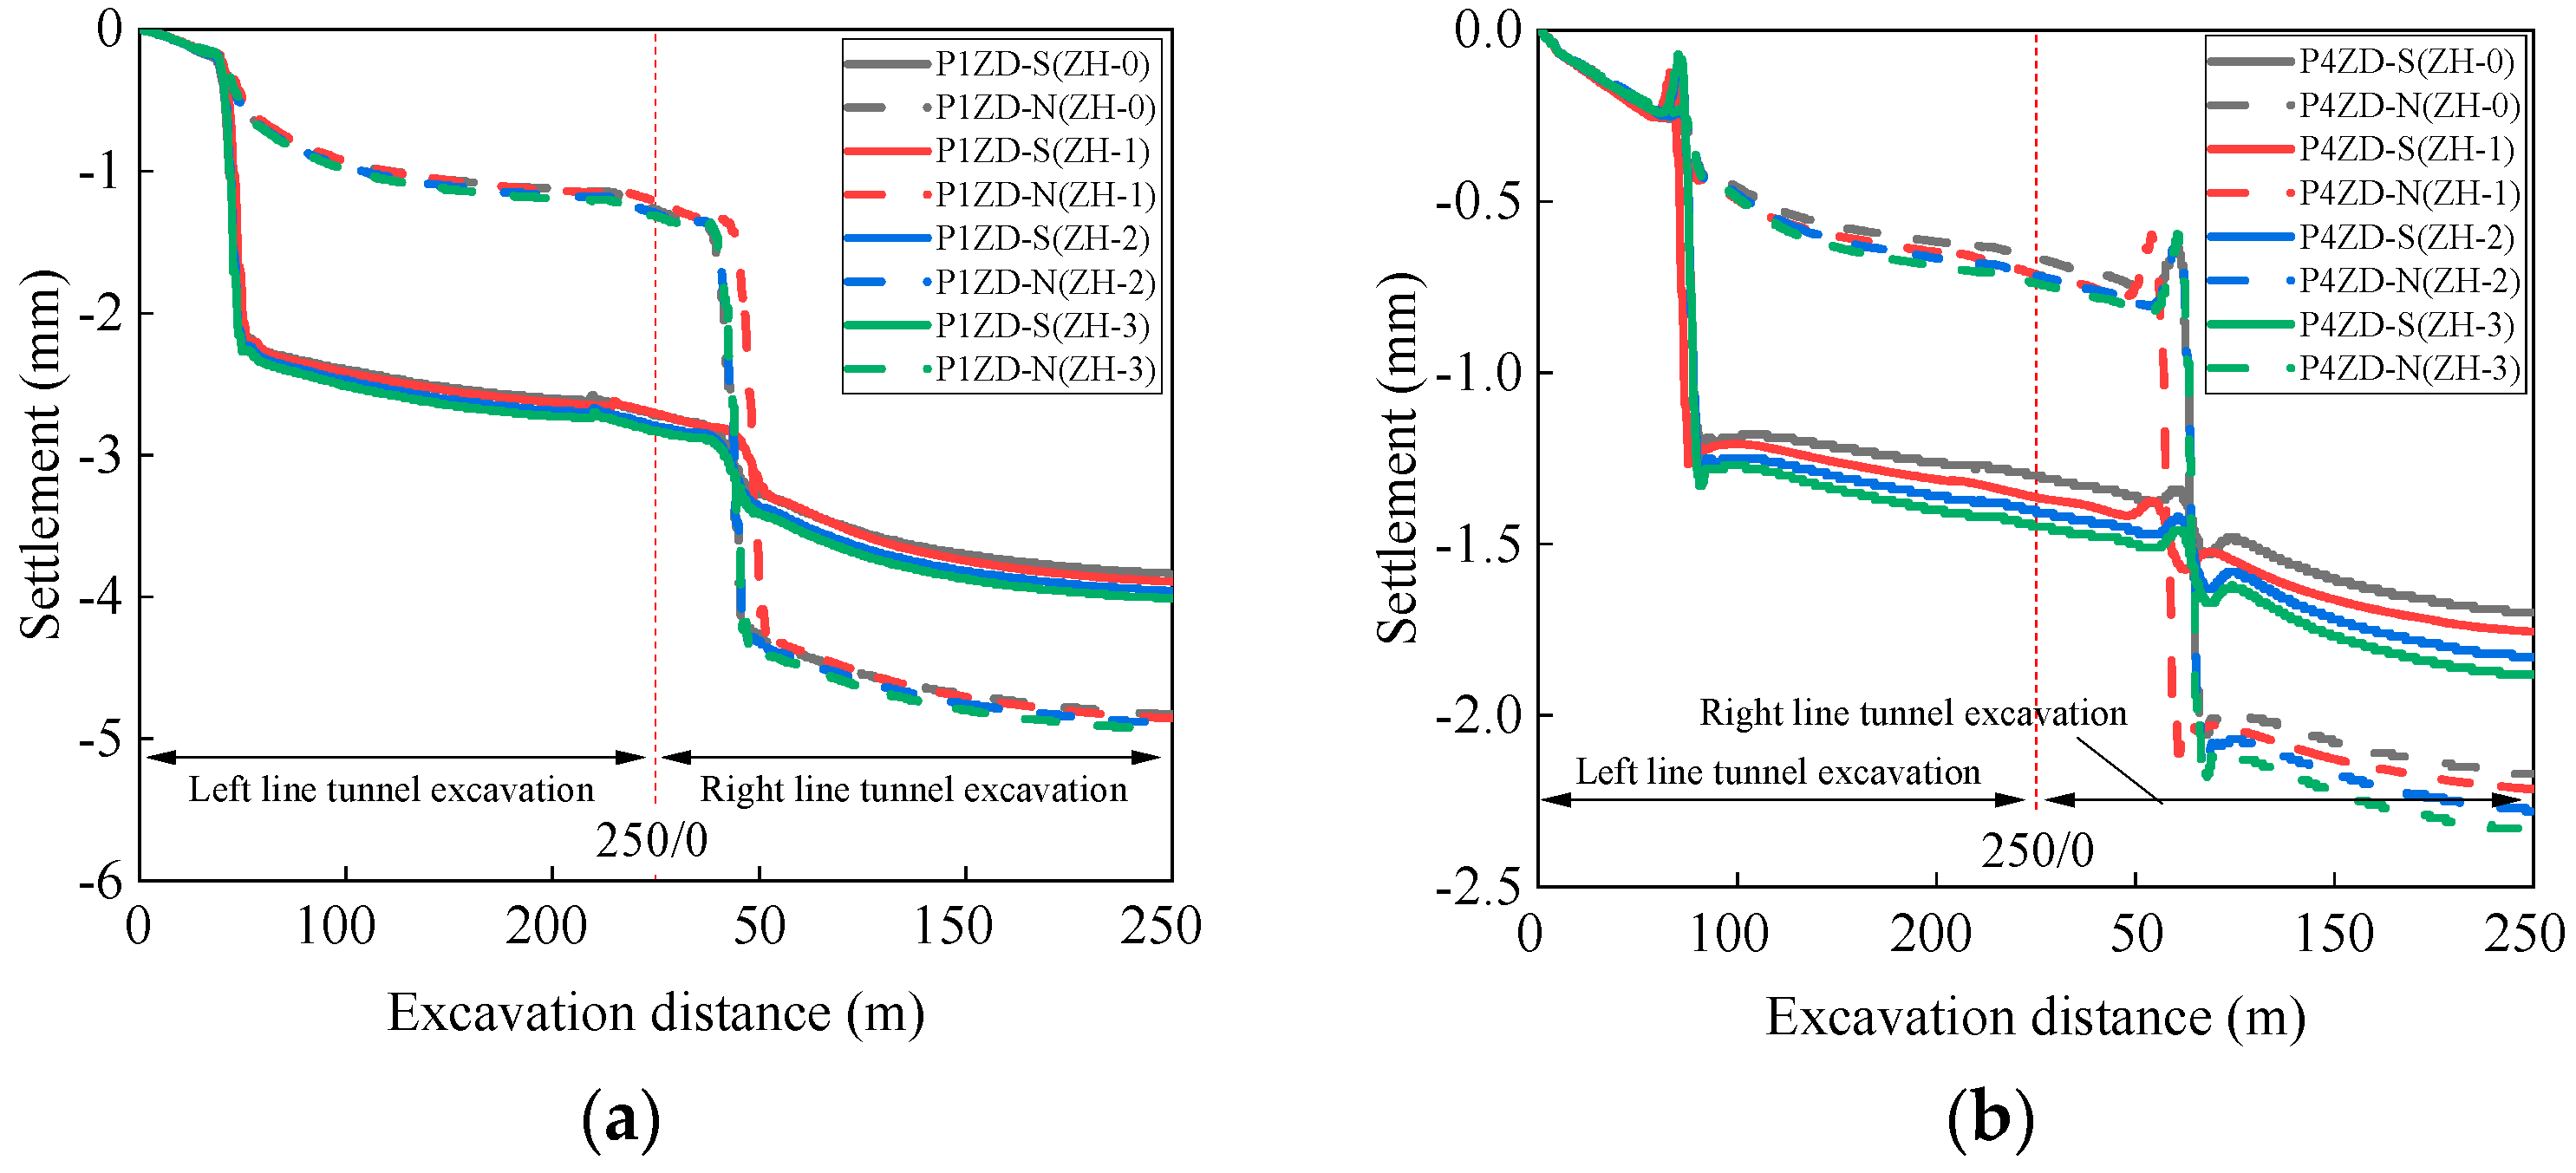
5.2.1. Foundation Settlement under Different Supporting Pressure
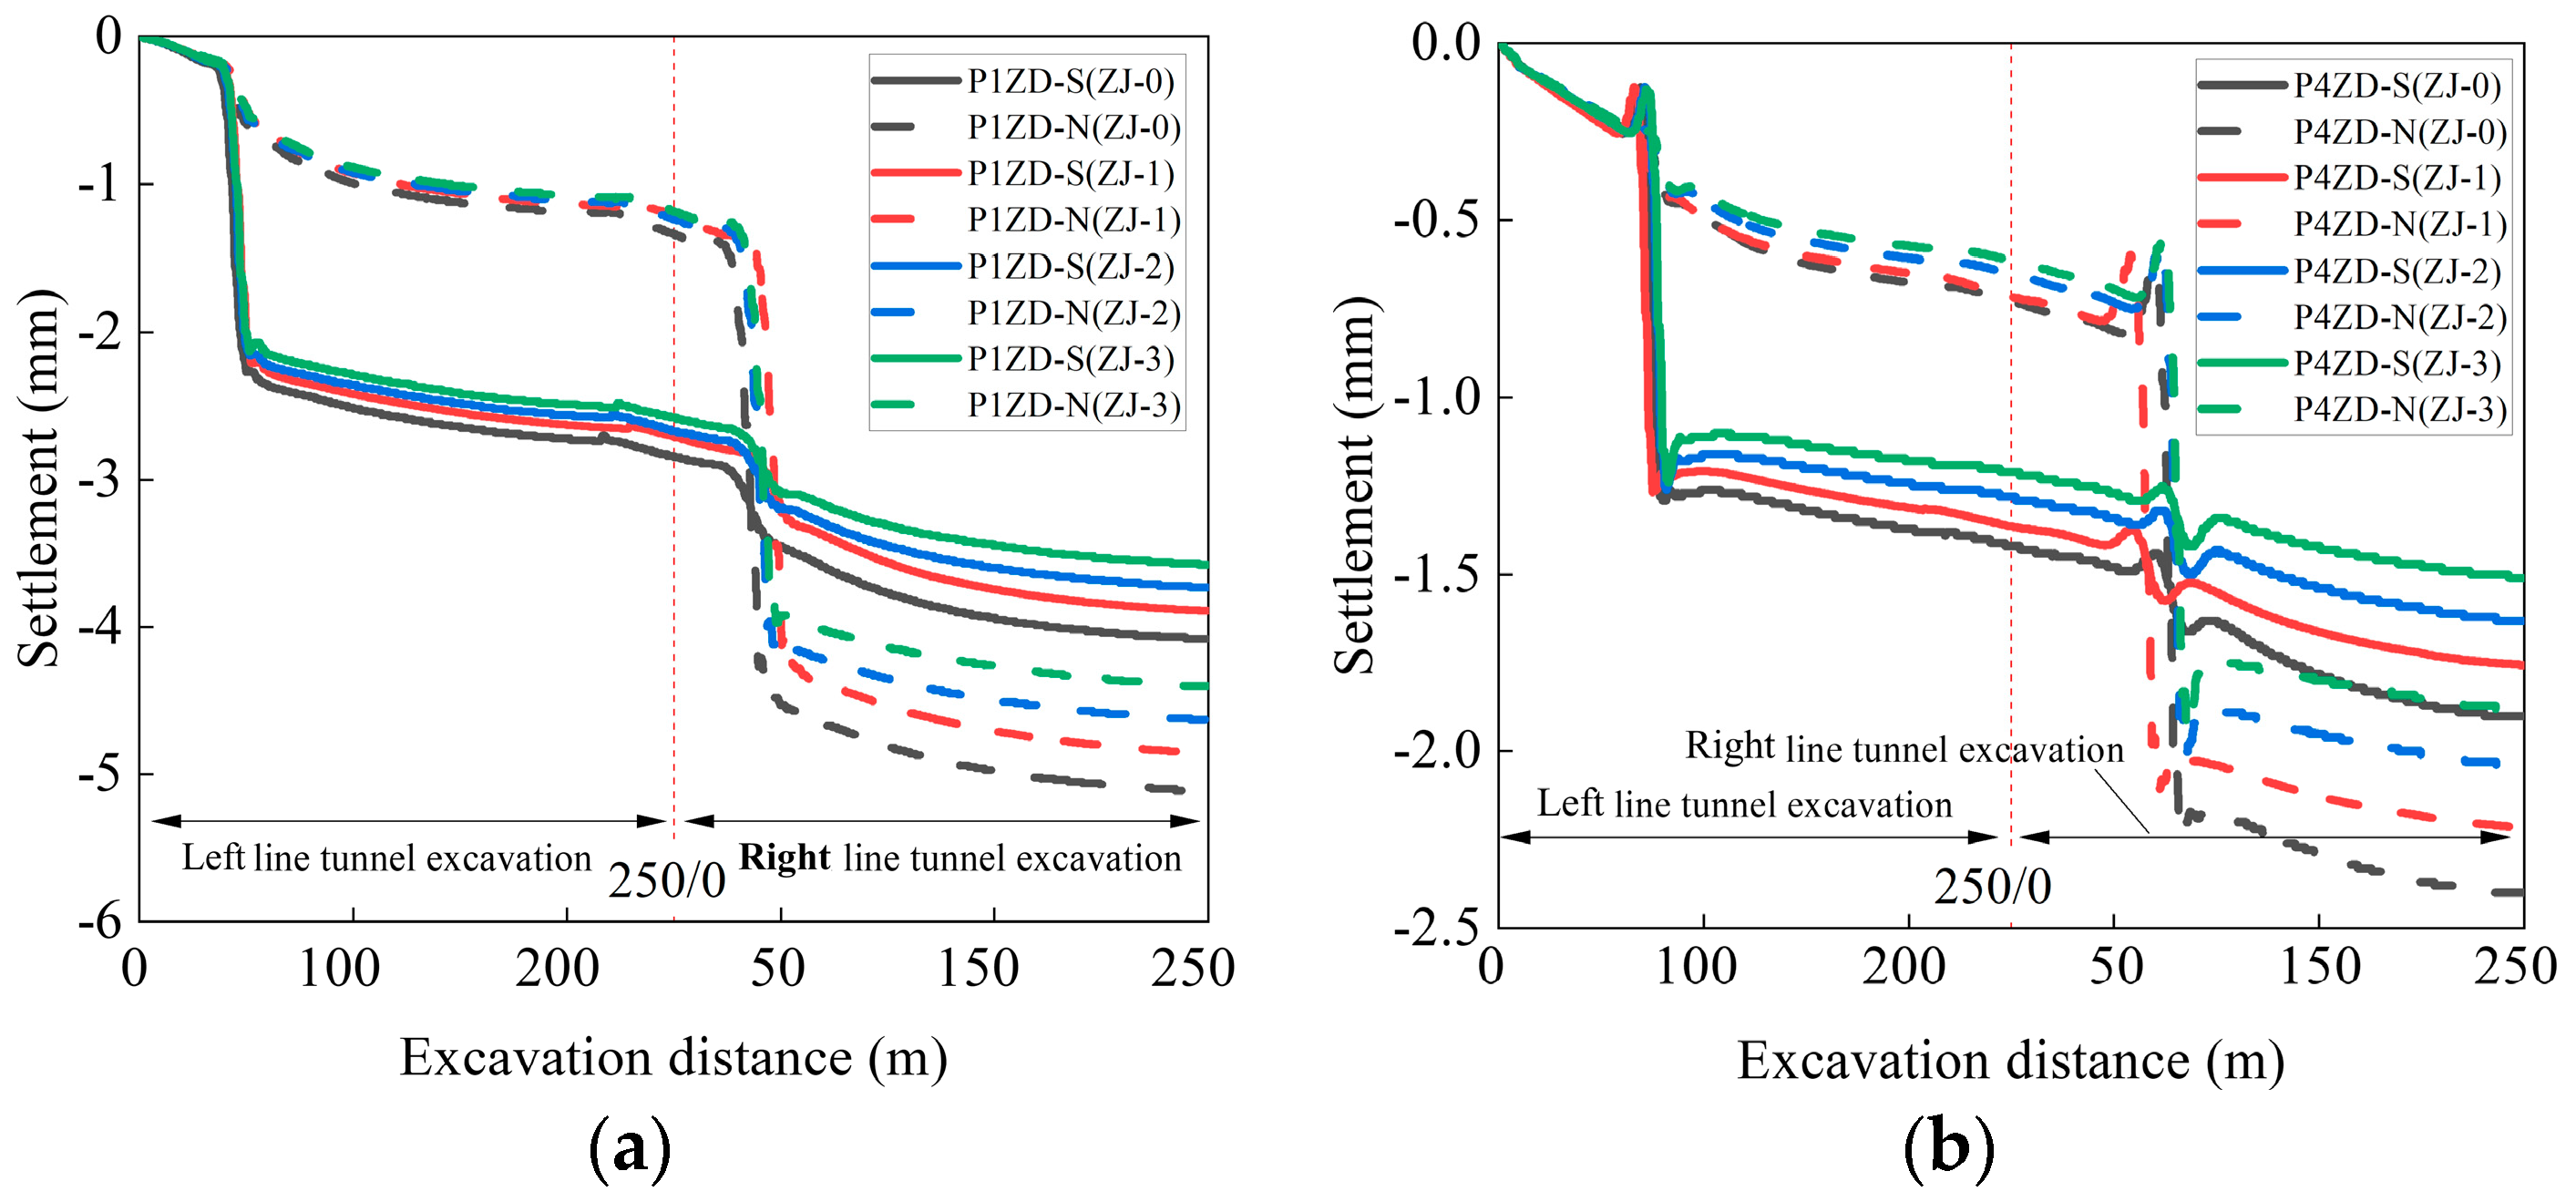
5.2.2. Foundation Settlement under Different Grouting Pressures
6. Conclusions
- (1)
- The lateral surface settlement caused by tunnel excavation follows a Gaussian distribution curve in areas outside the multi-arch culvert bridge, and the settlement is greater compared to the area beneath the arch culvert. The maximum settlement in these areas is approximately 9 mm. The ground improvement scheme employed in the engineering design involves high values of the ground deformation modulus and load-bearing capacity, which results in a relatively high overall stiffness of the multi-arch culvert bridge, making it less susceptible to the effects of tunnel excavation. The reinforcement measures of the foundation can be appropriately reduced to improve the economic benefits while ensuring safety.
- (2)
- Due to the varying deformation modulus of the soil on both sides of the multi-arch culvert bridge, the soil outside the foundation of the multi-arch culvert bridge is more affected by tunnel excavation. The deformation of the 1-hole at the edge of the steel corrugated pipes is more significantly influenced by the tunnel excavation. The transverse ground settlement trough exhibits an asymmetric distribution, with the maximum settlement trough shifting by approximately 5 m to the right tunnel. The later excavation of the right tunnel has a greater impact on the ground settlement compared to the earlier excavation of the left tunnel.
- (3)
- The range of influence of the ground disturbance extended approximately 7 m in front of the excavation face before the tunnel passed through. The range of ground disturbance decreased to 4–6 m in front of the excavation face after the tunnel passed through. Compared to the excavation face support pressure, the influence of grouting pressure on the ground is more significant. A reasonable grouting pressure can effectively control ground settlement. The foundation reinforced design with a high deformation modulus and high bearing capacity in this project resulted in relatively small settlement deformation caused by tunnel excavation, with the settlement of the multi-arch culvert bridge remaining within 2 mm. The chosen foundation reinforcement design appears to be reasonable.
Author Contributions
Funding
Institutional Review Board Statement
Informed Consent Statement
Data Availability Statement
Conflicts of Interest
References
- Ng, C.; Boonyarak, T.; Masín, D. Three-dimensional centrifuge and numerical modeling of the interaction between perpendicularly crossing tunnels. Can. Geotech. J. 2013, 50, 935–946. [Google Scholar] [CrossRef]
- Talmon, A.M.; Bezuijen, A. Calculation of longitudinal bending moment and shear force for Shanghai Yangtze River Tunnel: Application of lessons from Dutch research. Tunn. Undergr. Space Technol. 2013, 35, 161–171. [Google Scholar] [CrossRef]
- Zhang, D.M.; Huang, Z.K.; Yin, Z.Y.; Ran, L.Z.; Huang, H.W. Predicting the grouting effect on leakage-induced tunnels and ground response in saturated soils. Tunn. Undergr. Space Technol. 2017, 65, 76–90. [Google Scholar] [CrossRef]
- Goel, R.K.; Singh, B.; Zhao, J. Underground Infrastructures: Planning, Design, and Construction; Butterworth-Heinemann: Oxford, UK, 2012; pp. 329–335. [Google Scholar] [CrossRef]
- Li, P.; Du, S.; Ma, X.; Yin, Z.; Shen, S. Centrifuge investigation into the effect of new shield tunnelling on an existing underlying large-diameter tunnel. Tunn. Undergr. Space Technol. 2014, 42, 59–66. [Google Scholar] [CrossRef]
- Chen, X.S.; Shen, J.; Bao, X.H.; Wu, X.L.; Tang, W.C.; Cui, H.Z. A review of seismic resilience of shield tunnels. Tunn. Undergr. Space Technol. 2023, 136, 105075. [Google Scholar] [CrossRef]
- Chang, C.-T.; Sun, C.-W.; Richard, W.S.D. Response of a Taipei Rapid Transit System (TRTS) tunnel to adjacent excavation. Tunn. Undergr. Space Technol. 2001, 16, 151–158. [Google Scholar] [CrossRef]
- Chen, R.P.; Meng, F.Y.; Li, Z.C.; Ye, Y.H.; Ye, J.N. Investigation of response of metro tunnels due to adjacent large excavation and protective measures in soft soils. Tunn. Undergr. Space Technol. 2016, 58, 224–235. [Google Scholar] [CrossRef]
- Shi, J.W.; Zhang, X.; Chen, L.; Chen, L. Numerical Investigation of Pipeline Responses to Tunneling-Induced Ground Settlements in Clay. Soil Mech. Found. Eng. 2017, 54, 303–309. [Google Scholar] [CrossRef]
- Meng, F.Y.; Chen, R.P.; Wu, H.N.; Xie, S.W.; Liu, Y. Observed behaviors of a long and deep excavation and collinear underlying tunnels in Shenzhen granite residual soil. Tunn. Undergr. Space Technol. 2020, 103, 103504. [Google Scholar] [CrossRef]
- Zhang, Z.; Huang, M. Geotechnical influence on existing subway tunnels induced by multiline tunneling in Shanghai soft soil. Comput. Geotech. 2014, 56, 121–132. [Google Scholar] [CrossRef]
- Zheng, Y.; Wu, K.; Sun, J.; Chen, R.; Li, Y.M.; Yang, S.F. Study on the Influence of Close Distance Construction of Urban Tunnel on the Existing Station. Geotech. Geol. Eng. 2021, 39, 4765–4780. [Google Scholar] [CrossRef]
- Zhang, H.; He, P.; Qin, D.; Li, L. Influence on Existing Tunnel Crossed Vertically by New Shield Tunnel. China Railw. Sci. 2013, 34, 66–70. [Google Scholar]
- Yu, S.H.; Geng, Y.C. Influence Analysis of Underground Excavation on the Adjacent Buildings and Surrounding Soil Based on Scale Model Test. Adv. Civ. Eng. 2019, 2019, 6527175. [Google Scholar] [CrossRef]
- Peck, R.B. Deep excavations and tunnelling in soft ground. In Proceedings of the 7th ICSMFE, Mexico City, Mexico, August 1969. [Google Scholar]
- Song, Z.P.; Tian, X.X.; Zhang, Y.W. A New Modified Peck Formula for Predicting the Surface Settlement Based on Stochastic Medium Theory. Adv. Civ. Eng. 2019, 2019, 7328190. [Google Scholar] [CrossRef]
- Tang, X.W.; Liang, J.X.; Liu, W.; Ye, Y.H.; Gan, P.L.; Zhao, W.F.; Yu, Y. Modification of Peck Formula to Predict Ground Surface Settlement of Twin Tunnels in Low Permeability Soil. Adv. Civ. Eng. 2021, 2021, 6698673. [Google Scholar] [CrossRef]
- Loganathan, N. Analytical Prediction for Tunneling-Induced Ground Movements in Clays. J. Geotech. Geoenviron. Eng. 1998, 124, 846–856. [Google Scholar] [CrossRef]
- Huang, F.; Zhang, M.; Wang, F.; Ling, T.H.; Yang, X.L. The failure mechanism of surrounding rock around an existing shield tunnel induced by an adjacent excavation. Comput. Geotech. 2020, 117, 103236. [Google Scholar] [CrossRef]
- Zhang, X.; Zhang, M.X.; Javadi, A.A. Influence of a Super-Large Diameter Shield Tunnel Excavation on the Lining Structure of the Metro Lines in Operation. Iran. J. Sci. Technol.-Trans. Civ. Eng. 2023, 47, 3851–3866. [Google Scholar] [CrossRef]
- Liang, R.; Xia, T.; Hong, Y.; Yu, F. Effects of above-crossing tunnelling on the existing shield tunnels. Tunn. Undergr. Space Technol. 2016, 58, 159–176. [Google Scholar] [CrossRef]
- Reza, B.A.; Vojtech, G. 3D numerical parametric study of the influence of open-pit mining sequence on existing tunnels. Int. J. Min. Sci. Technol. 2017, 27, 459–466. [Google Scholar] [CrossRef]
- Zheng, G.; Yang, X.Y.; Zhou, H.Z.; Du, Y.M.; Sun, J.Y.; Yu, X.X. A simplified prediction method for evaluating tunnel displacement induced by laterally adjacent excavations. Comput. Geotech. 2018, 95, 119–128. [Google Scholar] [CrossRef]
- Xue, F.; Zhang, M.X. Excavation Face Stability of Shield Tunneling Closely Under Existing Tunnels: Particle Flow Simulation. Iran. J. Sci. Technol. Trans. Civ. Eng. 2020, 44, 497–506. [Google Scholar] [CrossRef]
- Ye, S.; Zhao, Z.; Wang, D. Deformation analysis and safety assessment of existing metro tunnels affected by excavation of a foundation pit. Undergr. Space 2021, 6, 421–431. [Google Scholar] [CrossRef]
- Yang, T.; Tong, L.Y.; Pan, H.S.; Wang, Z.S.; Chen, X.M.; Li, H.J. Effect of Excavation Sequence on Uplift Deformation of Underlying Existing Metro Tunnel. J. Perform. Constr. Facil. 2021, 35, 2. [Google Scholar] [CrossRef]
- Hu, Z.F.; Yue, Z.Q.; Zhou, J.; Tham, L.G. Design and construction of a deep excavation in soft soils adjacent to the Shanghai Metro tunnels. Can. Geotech. J. 2003, 40, 933–948. [Google Scholar] [CrossRef]
- Qian, W.P.; Qi, T.Y.; Zhao, Y.J.; Le, Y.Z.; Yi, H.Y. Deformation characteristics and safety assessment of a high-speed railway induced by undercutting metro tunnel excavation. J. Rock Mech. Geotech. Eng. 2019, 11, 88–98. [Google Scholar] [CrossRef]
- GB/T 50487-2008; Water Resources and Hydropower Engineering Geological Investigation Specification. Ministry of Water Resources and Electric Power of People’s Republic of China: Beijing, China, 2019.
- Yang, M.; Li, H.R.; Li, N.; Yang, S. Effect of Subway Excavation with Different Support Pressures on Existing Utility Tunnel in Xi’an Loess. Adv. Civ. Eng. 2020, 2020, 8818949. [Google Scholar] [CrossRef]
- Xie, X.Y.; Yang, Y.B.; Ji, M. Analysis of ground surface settlement induced by the construction of a large-diameter shield-driven tunnel in Shanghai, China. Tunn. Undergr. Space Technol. 2016, 51, 120–132. [Google Scholar] [CrossRef]
- Dias, D.; Kastner, R. Movements caused by the excavation of tunnels using face pressurized shields—Analysis of monitoring and numerical modeling results. Eng. Geol. 2013, 152, 17–25. [Google Scholar] [CrossRef]
- Bao, X.; Zhang, Y.; Xu, C.; Fu, Y.; Cui, H.; Xie, X. Factors Affecting the Settlement of Double-Line Shield Tunnel Construction. J. Chongqing Jiaotong Univ. Nat. Sci. 2020, 39, 51–60. [Google Scholar]


| Soil Layer | Natural Weight γ (kN/m3) | Cohesion C (kPa) | Friction φ (°) | Poisson Ratio v | Compression Modulus Es (MPa) | Deformation Modulus E0 (MPa) |
|---|---|---|---|---|---|---|
| Fill ① | 18.8 | 20 | 10 | 0.4 | 3.5 | - |
| Mud ②1 | 16.5 | 6.8 | 3.4 | 0.35 | 2.4 | - |
| Silty clay ②2 | 19.7 | 24.7 | 11.2 | 0.32 | 5.7 | - |
| Medium sand ③ | 19.2 | 0 | 30.0 | 0.25 | 15.0 | 12.0 |
| Strong weathering muddy sand ④ | 21.0 | 40.0 | 25.0 | 0.28 | 12.0 | 80.0 |
| Strong weathering muddy sand ⑤1 | 21.0 | 40.0 | - | - | - | - |
| Strong weathering sand ⑤2 | 21.2 | 20.0 | - | - | - | - |
| Strong weathering tuff rock ⑤3 | 21.0 | 30.0 | - | - | - | - |
| Strata | Dry Density ρd (g/cm3) | Cohesion C (kPa) | Internal Friction Angle φ (°) | Compression Modulus Es (MPa) | Deformation Modulus E0 (MPa) | Poisson Ratio v | Permeability Coefficient K (cm/s) | Porosity n |
|---|---|---|---|---|---|---|---|---|
| Natural strata | ||||||||
| ① | 1.60 | 20.0 | 10.0 | 3.5 | / | 0.40 | 2.0 × 10⁻³ | 0.33 |
| ②1 | 1.10 | 6.8 | 3.40 | 2.4 | / | 0.35 | 1.0 × 10⁻⁷ | 0.50 |
| ②2 | 1.50 | 24.7 | 11.2 | 5.7 | / | 0.32 | 6.0 × 10⁻⁵ | 0.40 |
| ③ | 1.80 | 0.0 | 30.0 | 15.0 | 12.0 | 0.25 | 2.4 × 10⁻² | 0.33 |
| ④⑤ | 1.78 | 40.0 | 25.0 | / | 80.0 | 0.28 | 1.0 × 10⁻³ | 0.30 |
| Composite strata | ||||||||
| ②1 | 1.28 | 209 | 20.0 | / | 287 | 0.35 | 1 × 10⁻⁷ | 0.50 |
| ②2 | 1.68 | 104 | 12.8 | / | 144 | 0.32 | 1 × 10⁻⁷ | 0.50 |
| ③ | 1.83 | 324 | 34.0 | / | 556 | 0.25 | 1 × 10⁻⁷ | 0.50 |
| Material Type | Density ρ (g/cm3) | Cohesion C (kP) | Internal Friction Angle φ (°) | Deformation Modulus E0 (MPa) | Elastic Modulus E (GPa) | Poisson Ratio v |
|---|---|---|---|---|---|---|
| C15 concrete protects masonry | 2400 | / | / | / | 22 | 0.2 |
| C20 concrete foundation | 2400 | / | / | / | 25 | 0.2 |
| Tunnel segment | 2600 | / | / | / | 34.5 | 0.2 |
| Peltate shell | 12,000 | 210 | 0.3 | |||
| Asphalt concrete pavement | 2400 | / | / | / | 1.4 | 0.35 |
| Backfill or stratigraphic gravel soil | 1900 | 0 | 30 | 12 | 3E0 | 0.3 |
| Steel Corrugated Pipe | Material Density ρ (g/cm3) | Equivalent Density ρ1 (g/cm3) | Equivalent Thickness t (mm) | Elastic Modulus E (GP) | Poisson Ratio v |
|---|---|---|---|---|---|
| 4–9 holes | 7.85 | 1.411 | 70 | 206 | 0.3 |
| Other holes | 7.85 | 1.171 | 65 | 206 | 0.3 |
| Reinforcement Conditions | Reinforcement Area | Composite Foundation Area Replacement Rate (%) | Reduced Factor |
|---|---|---|---|
| Design reinforcement scheme (JG-0) | Tunnel influence area | 59 | / |
| Design reinforcement reduction (JG-1) | Tunnel influence area | 59 | 0.9 |
| Types | Conditions | Schemes |
|---|---|---|
| Support pressures Pw (JG-0) | ZH-0 | Equal to 0.9 times the horizontal static water and soil pressure of the tunnel axis |
| ZH-1 | Equal to 1.0 times the horizontal static water and soil pressure of the tunnel axis | |
| ZH-2 | Equal to 1.1 times the horizontal static water and soil pressure of the tunnel axis | |
| ZH-3 | Equal to 1.2 times the horizontal static water and soil pressure of the tunnel axis | |
| Grouting pressures Pg (JG-0) | ZJ-0 | Equal to 0.9 times the vertical stress of the vault stratum |
| ZJ-1 | Equal to 1.0 times the vertical stress of the vault stratum | |
| ZJ-2 | Equal to 1.1 times the vertical stress of the vault stratum | |
| ZJ-3 | Equal to 1.2 times the vertical stress of the vault stratum |
Disclaimer/Publisher’s Note: The statements, opinions and data contained in all publications are solely those of the individual author(s) and contributor(s) and not of MDPI and/or the editor(s). MDPI and/or the editor(s) disclaim responsibility for any injury to people or property resulting from any ideas, methods, instructions or products referred to in the content. |
© 2023 by the authors. Licensee MDPI, Basel, Switzerland. This article is an open access article distributed under the terms and conditions of the Creative Commons Attribution (CC BY) license (https://creativecommons.org/licenses/by/4.0/).
Share and Cite
Bao, X.; Bao, Z.; Shen, J.; Wu, S.; Yang, S.; Chen, X. Study on the Performance of Twin Shield Tunnel Excavation below Existing Multi-Arch Culvert Bridge in Close Vicinity. Appl. Sci. 2023, 13, 12285. https://doi.org/10.3390/app132212285
Bao X, Bao Z, Shen J, Wu S, Yang S, Chen X. Study on the Performance of Twin Shield Tunnel Excavation below Existing Multi-Arch Culvert Bridge in Close Vicinity. Applied Sciences. 2023; 13(22):12285. https://doi.org/10.3390/app132212285
Chicago/Turabian StyleBao, Xiaohua, Zhizao Bao, Jun Shen, Shidong Wu, Shuming Yang, and Xiangsheng Chen. 2023. "Study on the Performance of Twin Shield Tunnel Excavation below Existing Multi-Arch Culvert Bridge in Close Vicinity" Applied Sciences 13, no. 22: 12285. https://doi.org/10.3390/app132212285
APA StyleBao, X., Bao, Z., Shen, J., Wu, S., Yang, S., & Chen, X. (2023). Study on the Performance of Twin Shield Tunnel Excavation below Existing Multi-Arch Culvert Bridge in Close Vicinity. Applied Sciences, 13(22), 12285. https://doi.org/10.3390/app132212285