1. Introduction
Road traffic has always occupied a pivotal position in many modes of transportation. Compared with the United States, Japan, and other developed countries, China’s highway construction was delayed. The completion of the Shanghai Jiaxing Expressway opened the prelude to China’s highway construction. At present, China has gradually formed a highway network that is compatible with its economy. The development of highways brings convenience to people, but at the same time, it also poses a novel challenge: highway maintenance and management [
1,
2]. There are many factors in daily life that cause damage to roadways in various forms, such as cracks, pits, et cetera. That damage brings hidden dangers to people’s traffic safety [
3]. Therefore, timely and effective pavement damage detection has become the most important part of highway maintenance, in which crack detection of expressway asphalt pavement is a key part.
Zhang Tianjie et al. identified asphalt pavement cracks based on residual neural networks [
4]. A set of asphalt pavement images was established, and crack images were cleaned using data-cleaning algorithms. A sample dataset of asphalt pavement crack images was constructed. The image set was divided into training and testing sets in a ratio of 8:2. The residual neural network ResNet50 was used to train the cleaned data, obtain network weights, and then use the trained network to predict the asphalt pavement crack data to complete crack damage detection. However, the image processed by this method still has some noise, which reduces the accuracy of damage detection and is not conducive to subsequent damage detection.
Li Yan proposed a three-dimensional crack detection method for asphalt pavement based on a height intercept product [
5]. First, the image is preprocessed using a bilateral filter to achieve a smooth road texture and maintain crack contour features. Then, taking advantage of the fact that the high–low–high degree of the crack contour is greater than the texture area and has strong symmetry, a height difference product operator is designed. This operator could effectively amplify the difference between the crack and non-crack areas, and the corresponding crack mapping image could be obtained through the processing of this operator. Finally, dynamic threshold segmentation and denoising are performed on the mapped image to obtain the final binary image of cracks and achieve crack damage detection. However, this method does not screen for non-crack areas in the image and cannot accurately extract crack areas, which affects the effectiveness of damage detection.
Hu Chengxue et al. proposed a crack detection method for asphalt pavement based on neighborhood and gradient saliency feature fusion [
6]. The image was denoised using grayscale correction and morphology. This process involves extracting important features in the image’s vicinity based on the significant differences between pixels and their surrounding arias. Significant features in different directions are obtained through directional adjustable filters, and feature fusion salient maps are generated through convolutional operations. Then, the feature fusion salient map threshold is segmented to obtain suspected crack aggregation areas, introducing a clustering analysis method to select crack candidate regions based on the different geometric features of the clustering region. Finally, a region endpoint search and localization method is proposed, which eliminates subsets of non-endpoint aggregation regions and connects endpoints of different regions, ultimately achieving complete crack extraction. However, this method does not enhance the road surface image, resulting in certain errors in image recognition, inconsistent damage detection results with actual results, and reducing the accuracy of damage detection.
In order to solve the issues in the above methods, a method based on digital image processing technology for detecting cracks in expressway asphalt pavement is proposed. The main steps are as follows:
- (1)
Use the nonsubsampled contourlet transform to enhance the image of asphalt pavement on highways, denoise, and select thresholds through principal component analysis;
- (2)
Use the Gaussian Laplace operator to filter non-crack images and obtain intensity images based on the non-negative features of cracks;
- (3)
Enhance regional information and extract crack features through comparative crack features;
- (4)
Use projection features and crack pixel features to classify crack images. The features serve as input vectors for support vector machines, and when combined with classification functions, the detection of crack diseases in highway asphalt pavement is completed;
- (5)
Experiments and discussions show the overall effectiveness of the proposed method through image enhancement, crack extraction, and damage detection tests;
- (6)
Conclusions.
2. Digital Image Processing
2.1. Image Enhancement Processing of Expressway Asphalt Pavement
The detection method of expressway asphalt pavement crack damage based on digital image processing technology uses the non-subsampled contourlet transform (NSCT) to enhance the image of expressway asphalt pavement.
NSCT can be divided into two translation invariant parts: a non-down sampling pyramid and a non-down sampling directional filter bank. The combination of these two parts ensures the multi-directional and multi-scale analysis characteristics of NSCT. Moreover, the filter banks of these two parts avoid sampling, making NSCT translation invariant. This feature ensures that the NSCT transformed image information is preserved and the frequency domain characteristics of different subbands in the image are clear.
In the actual pavement crack damage detection process, the pavement image that needed to be enhanced not only contains weak signal crack information but also contains different noise levels. Therefore, the road image enhancement algorithm must keep the crack edge information as far as possible, suppress noise, and enhance the contrast between the road background image and the crack [
7,
8]. The idea of the NSCT image denoising and enhancement algorithm is first to select an appropriate threshold to distinguish noise from weak edge information. Secondly, a suitable threshold function is selected to enhance the contrast of pavement background and crack information [
9,
10]. Because the frequency domain characteristics of noise are unstable, there is no fixed shape. The frequency distribution of weak edges is relatively stable, and the shape presents a certain geometric structure, so this morphological difference can be used to distinguish the noise and weak edge information in a road image. By incorporating the translation invariance of the NSCT transform, the crack information in the road image can be enhanced and noise minimized.
A pavement image is transformed by NSCT to obtain the subband coefficients of the image. According to these coefficients, the pixels in the image are divided into three categories: strong edge, weak edge, and noise. The classification of strong edges, weak edges, and noise can be determined by the threshold
. This article uses principal component analysis to determine the threshold
. There are many approaches to select the method, and the proposed approach uses the principal component analysis method. In the field of image processing, a standard denoising criterion considers that the information with large changes is the target, the information with small changes is noise, and the size of changes is described by variance. The idea of the PCA method is to project high-dimensional data into a low-dimensional subspace, use new variables with fewer dimensions and mutual independence to reflect most of the information provided by the original variables, and then solve the problem by analyzing the new variables [
11,
12]. PCA has many different calculation methods. The proposed method calculates the data matrix
covariance matrix of
the eigenvalues and eigenvectors of
for solving.
First, the pavement image of order
is represented by a matrix as
, using the
standardization process to obtain
. As shown in Formula (1):
where
,
by
dimensional vector;
is the number of observation indicators of
.
Furthermore, each element in the covariance matrix
of the standardized matrix
can be calculated, as shown in Formula (2):
where
,
standardize matrix
elements.
For the decomposition covariance matrix , by the characteristic value of diagonal matrix is formed; is the covariance matrix; is the eigenvector corresponding to the eigenvalue.
The formula for calculating the variance contribution rate
of the standardized matrix is shown in Formula (3):
When the value of
reaches more than 70%, the main information of
contains a feature vector
. Before taking
characteristic values and
and eigenvectors
as the base coordinate of the subspace, the principal component
in the data matrix can be standardized by
to keep
projection on base coordinates, as shown in Formula (4):
We apply the first
principal components to estimate the reconstruction model of
, as shown in Formula (5):
The proposed method uses the median
of the absolute values of the standardized data matrix as the threshold
for pixel classification in the image. The calculation formula is shown in Formula (6):
where
indicates the median value.
Based on the above steps, the threshold value in the NSCT image enhancement algorithm can be determined. In the process of image enhancement, two factors directly determine the enhancement effect: the selection of threshold and the threshold function. A reasonable threshold can distinguish the noise from the image information and enhance the weak edge information of the image.
The calculation formula for the enhancement function
used in the proposed method is shown in Formula (7):
where
is the pixel value after NSCT decomposition;
is the adjustment coefficient, which can be taken from 0 to 1;
indicates a strong edge;
is a weak edge;
indicates noise. This formula preserves the strong edge of the image, enhances the weak edge, and suppresses the noise.
2.2. Crack Extraction
The crack damage detection method of expressway asphalt pavement based on digital image processing technology mainly extracts cracks through three steps:
- (1)
Non-fracture image filtering;
- (2)
Intensity image acquisition;
- (3)
Regional information enhancement.
First, according to the high-frequency characteristics, the relevant algorithm is used to calculate the target high-frequency signal in the pavement image. The image with a weak target high-frequency signal is a crack-free image, and the processing is skipped. Second, for images with possible cracks, relevant extraction algorithms are designed based on the non-negative features and contrast features of the image crack regions to obtain candidate information on cracks. Then, according to the linear characteristics of the image crack region, relevant algorithms are designed to strengthen the breakpoints and weaken the background noise. Finally, the false information is eliminated, and the cracks in the asphalt pavement image of the expressway are extracted. It should be noted that in order to ensure that the crack information in an image can be accurately captured and analyzed, there are certain requirements for the size or resolution of the image. A larger image size may require more computing resources and storage space, but it can also provide more image information for crack detection. Higher resolution can provide more detailed information, which helps to identify and locate cracks in crack detection more accurately. However, higher resolution also increases the cost of computation and storage. Therefore, it is necessary to ensure that the road surface image resolution used for detection is at least 150 dpi.
2.2.1. Non/Crack Image Filtering
Because in the actual detection, most of the pavement to be treated is damage-free, if the cracks in these pictures are detected directly, it will cause unnecessary errors and affect the speed of batch detection. Therefore, before crack detection, high-frequency features are used to screen damage-free images.
- (1)
Zero intersection detection based on high frequency characteristics of cracks
In the image, cracks belong to grayscale abrupt edges, and their grayscale values show a step-like change, which can be considered high-frequency signals. Therefore, this high-frequency feature can be defined as a characteristic of cracks.
The high-frequency features of cracks can be well expressed by edge detection [
13,
14], and an improved Gaussian Laplacian operator is proposed. The core idea of the Gaussian Laplacian operator [
15,
16] is to combine the Laplacian operator and the Gaussian smoothing filter to detect the edge of the image. For the pavement crack image, the Gaussian smoothing filter can effectively suppress the impact noise and other signals, which plays a good auxiliary role in the expression of low-frequency information of the crack-free image. The main principle is shown in Formula (8):
where
is a convolution operation [
17,
18],
is the image obtained after convolution processing,
is the original image. Setting
,
can be separated into two filters
,
. The above equation can be further improved, as shown in Formula (9):
Because the crack has no fixed direction, a multi-directional convolution template is used to ensure that the edge information in all directions can be effectively detected. The steps are:
takes the convolution templates of horizontal and vertical, inclined at 45 degrees and inclined 135 degrees for operation, and the results of each template operation are summed. As shown in Formula (10):
where
; by finding
, the convolution calculation result can be obtained by the value of
. Taking the template in the horizontal and vertical directions:
,
,
. Taking the 45° and 135° formwork:
,
. By summing the convolution results of the four templates, the high-frequency information of each main direction can be obtained, and then the enhanced convolution map can be obtained. After convolution processing, the high-frequency signals (cracks and other edges) of the image appear as zero intersections.
- (2)
Damage free image judgment
Considering that some zebra crossings and road signs have strong edge characteristics, but their edges have regular shape and direction characteristics, they can be removed according to the length-width ratio of their edge areas. The basic discrimination formula is shown in Formula (11):
Among them, is the aspect ratio of the current connected domain, is the length of connected domain, and is connected domain width. The judgment steps are as follows:
- (1)
Calculate the length and width of each connected domain, such as or (image size is ), and continue to judge;
- (2)
Calculate the value. If satisfied by or , determine that it is a landmark edge, and delete the entire connection;
- (3)
Count the remaining zero crossings , such as or perhaps , then it is judged that the image is mainly a low-frequency signal, which is a damage-free image, and the processing step is skipped.
2.2.2. Strength Image Acquisition Based on Non-Negative Characteristics of Cracks
After filtering out most of the non-crack images, the intensity image is obtained based on the non-negative characteristics of the crack. In the process of road image achievement, due to the illumination angle of the incident light, cracks appear as darker areas on the image, whose pixel gray values are generally lower than the background pixels nearby and generally have a substantial difference. This feature is defined as the non-negative feature of cracks.
In some complex road sections, some crack areas with large widths will be filled or covered by the dust on the road, resulting in a higher gray value of its pixels than the nearby background pixels. At this time, the gray value of the pixel at the edge of the crack is lower than that of the pixel filled with dust in the middle, which also has a significant difference, so the non-negative feature is also applicable in this case. Non-negative features mainly describe the gray value characteristics of a single crack point in the region. As the most basic and main feature of crack pixels, they can be used to extract the most basic crack information. The schematic diagram of non-negative characteristics is shown in
Figure 1:
Figure 1 is a schematic diagram of an image containing a crack area, the size of which is
; the crack area is marked with a circle and a diamond.
is the current point to be processed; other points in the area can be represented as
, where:
,
.
includes both cracked pixels and non-cracked pixels. Based on the non-negative characteristics, design-related algorithms are used to obtain the intensity map of the crack image. Considering that cracks are linearly distributed, the width is small, and the closer the point is to the current point, the greater the influence factor on the determination of crack points is, so a distance weight function is introduced. The calculation formula for strength
is shown in Formula (12):
When
, we count the quantity
,
as the distance influence factor, which is taken according to the size of the selected window
. Calculated in this way, the influence of edge pixels
is weakened, which can highlight the characteristics of the crack area more. Then, we calculate the strength value
of the current point, as shown in Formula (13):
Among them, is the total number of pixels in the region. In actual processing, using a 21 × 21 size window scans the acquired image and calculates the intensity value of each point according to Formulas (12) and (13) as and the quantity influence factor . According to the prior knowledge obtained from a large number of experiments, the best threshold suitable for fracture extraction is , . When the calculated and meet the requirements, the value of can be assigned to the current point . Otherwise, the value is assigned to 0.
Non-negative features mainly calculate and screen the differences shown by single crack pixels and then obtain basic candidate crack information, including background noise, non-crack edge signals, and other interference factors. The image obtained after non-negative feature calculation mainly describes the strength information of the original crack image, which is called the crack strength map for short.
2.2.3. Information Enhancement of Fracture Area Based on Contrast Characteristics
In image processing, contrast represents the intensity difference between adjacent regions in the image [
19,
20]. The contrast of the crack information intensity image is very low, and the spatial correlation of adjacent pixels is high. The target, background, details, and noise in the image exist in a narrow gray range, so it is not meaningful to evaluate the contrast of a crack pixel alone. Candidate crack regions and absolute non-crack regions have been defined in the intensity image. When these regions are mapped to the original image, the crack and background regions have a strong contrast relationship. The contrast relationship between the crack region and the background region is defined as the contrast feature of the crack. Therefore, after obtaining the intensity image, the information on the crack area is enhanced based on the contrast feature.
In image processing, the contrast
between the target area and the background area can be calculated using Formula (14):
where
represents the average gray value of the target area,
represents the average gray value of the background area, and
represents the mean square deviation of the background area. The contrast feature describes the significant difference between the fracture and background areas. Combined with the previous non-negative features, the fracture area and the edge of the landmark can be well distinguished.
According to the relevant mathematical definitions of contrast features, combined with the distribution of gray values in the crack area on the intensity map and the original image, the contrast between the target area and the background area is calculated by calculating the mean gray value and mean square deviation. When calculating the mean grayscale of a region, considering the occurrence of sudden changes in the grayscale values of individual pixels, extreme values are generally removed. The formula for calculating the mean grayscale and mean square deviation of the target region is shown in Formula (15):
The calculation formula for the grayscale mean and mean square deviation of the background area is shown in Formula (16):
where
is the average gray value of the target area Area 1;
is the average gray value of the background Area 2;
is the mean square deviation of the target Area 1;
is the mean square deviation of the background Area 2.
,
and
,
,
,
represent the gray value of each pixel in Area 1 and Area 2, the maximum gray value of the region, and the minimum gray value of the region, respectively;
is the number of pixels in each area. Based on the characteristics of the crack area in the image, the calculation formula for the contrast
between the target area and the background area is defined as Formula (17):
If Area 1 is a crack area, then
is larger. However, if Area 1 is a non-fracture candidate area, then the value of
is smaller. The proposed method sets an intensity factor
to make a judgment. After obtaining the contrast
, we normalize the grayscale value using the following equation, as shown in Formula (18):
In the formula, is a rounding function. In actual processing, a 21 × 21 window is used to scan the intensity image, and the contrast corresponding to the current point to be processed is calculated according to the pixel gray value in the original image. The contrast is smaller when the target area Area 1 in the intensity map corresponds to the non-crack area in the original image. The contrast is larger when the target area Area 1 in the intensity map corresponds to the crack area in the original image. Normalizing , the value is assigned to the current point to be processed, effectively enhancing the crack information on the intensity map.
3. Detection of Cracks on Asphalt Pavement of Expressway
Typical damage to asphalt pavement includes cracks, ruts, deflections, potholes, and looseness. Among them, crack damage is one of the most common and representative types of damage to asphalt pavement. The cracks can be divided into four types: transverse cracks, longitudinal cracks, mesh cracks, and cracking.
- (1)
The network cracks refer to the irregular network cracks on the road surface, in the form of crisscross cracks, forming crack grids of different sizes, with an area between 0.092 m2 and 9.2 m2;
- (2)
The longitudinal cracks are parallel to the middle line of the pavement. The length and width of the cracks depend on the damage to the pavement, and there may be a small number of branch cracks;
- (3)
The transverse cracks are perpendicular to the middle line of the pavement, and there may be a small number of branch cracks;
- (4)
Cracking is one of the most severe crack damages, generally caused by the long-term rolling of heavy vehicles. Cracks cross each other and form many irregular small cracks.
According to the Technical Specifications for Maintenance of Highway Asphalt Pavement issued by the Ministry of Communications of the People’s Republic of China, evaluation standards are provided for various damage types of asphalt pavement, in which the classification and damage classification of asphalt pavement cracks are given, as shown in
Table 1:
There are many methods to describe image features, such as texture description based on a gray histogram, which is an effective method to describe gray images. The image histogram is a normal distribution function, but for the processed binary image, the gray histogram cannot describe the characteristics of the binary image. The proposed method uses three features, the projection feature and the number of crack pixels, to describe the crack image. For a size of
’s crack image
, the statistical level
direction and perpendicular
direction, the number of crack pixels in the direction receives projection vectors in both the
and
directions. The calculation formula is shown in Formula (19):
where
,
.
According to the statistical results, for longitudinal cracks along the
directional projection
, an obvious peak value will appear on the axis. For transverse cracks, along the horizontal
directional projection
, an obvious peak value will appear on the shaft. According to the projection characteristics of the crack image, the maximum difference value of the median value of each projection vector
and
are two characteristics of cracks. The calculation formula is shown in Formula (20):
The proposed method includes
, the third feature. The two eigenvalues can be easily distinguished for transverse and longitudinal cracks,
and
, but they cannot be effectively distinguished between a mesh crack and craze. Mesh cracks and crazes have a higher pixel count compared to transverse and longitudinal cracks. The number of craze crack pixels exceeds that of a mesh crack, so it is necessary to use the number of crack pixels
to distinguish them. The calculation formula is shown in Formula (21):
The proposed method selects the above three features as the input vectors of the support vector machine [
21,
22] to detect the crack damage of expressway asphalt pavement.
Assume that there is a linearly separable set of crack image samples in the feature space
, where
is the first in the space
fracture samples of known categories,
,
the category properties of
. According to the idea of using straight lines to divide categories in two-dimensional space, the straight line for classification in feature space is the classification hyperplane [
23,
24], which can be expressed as
, where
is an
dimensional vector,
is the offset. For
, the sample points of the condition are closer to the ideal plane than other sample points, so the interval between the sample and the hyperplane is
. The classification hyperplane is shown in
Figure 2:
In order to find the ideal plane for classification, the gap between the crack sample and the plane should be maximized, that is
maximum [
25], which can be equivalently expressed as
minimum. Therefore, the solution for the optimal classification hyperplane
can be calculated using Formula (22) as follows:
where
corresponds to the slope term in the straight line, which is the normal vector in high-dimensional space;
is the intercept term of the hyperplane in high-dimensional space.
The above is the problem of calculating extreme values in convex optimization, which can be solved by the Lagrange multiplier method. Using the Lagrange multiplier method, the functional form of the above equation can be calculated using Formula (23):
Among them,
, as a Lagrange multiplier, to further solve the problem, first calculates the partial derivatives
and
and then makes the derivative result equal to 0. Further results can be obtained, as shown in Formula (24):
Based on the above formula, the problem of crack damage detection in the original asphalt pavement of highways can be represented by Formula (25):
After using the Lagrangian method, the above problem can be transformed into the form of Formula (26):
The optimal solution to the optimization problem can be obtained by solving the above equation, with
representing the optimal solution. According to the KKT condition, there are
, only when
satisfies
,
. Correspondingly,
falls on the optimal boundary, which is called the support vector. The weight coefficient
and offset term
of the optimal hyperplane can be calculated using Formula (27):
Among them, and are any two crack samples in the two categories, belonging to the support vector.
Usually, in the sample set, only a few samples
have a non-zero value, but most samples
have a value of zero. Therefore, the best prediction classification plane is determined by
, which is determined by non-zero samples. These samples are support vectors. The calculation formula for the optimal classification function is shown in Formula (28):
The above-extracted fracture features , , as the input vector are input into the above classification function to complete the crack damage detection of expressway asphalt pavement.
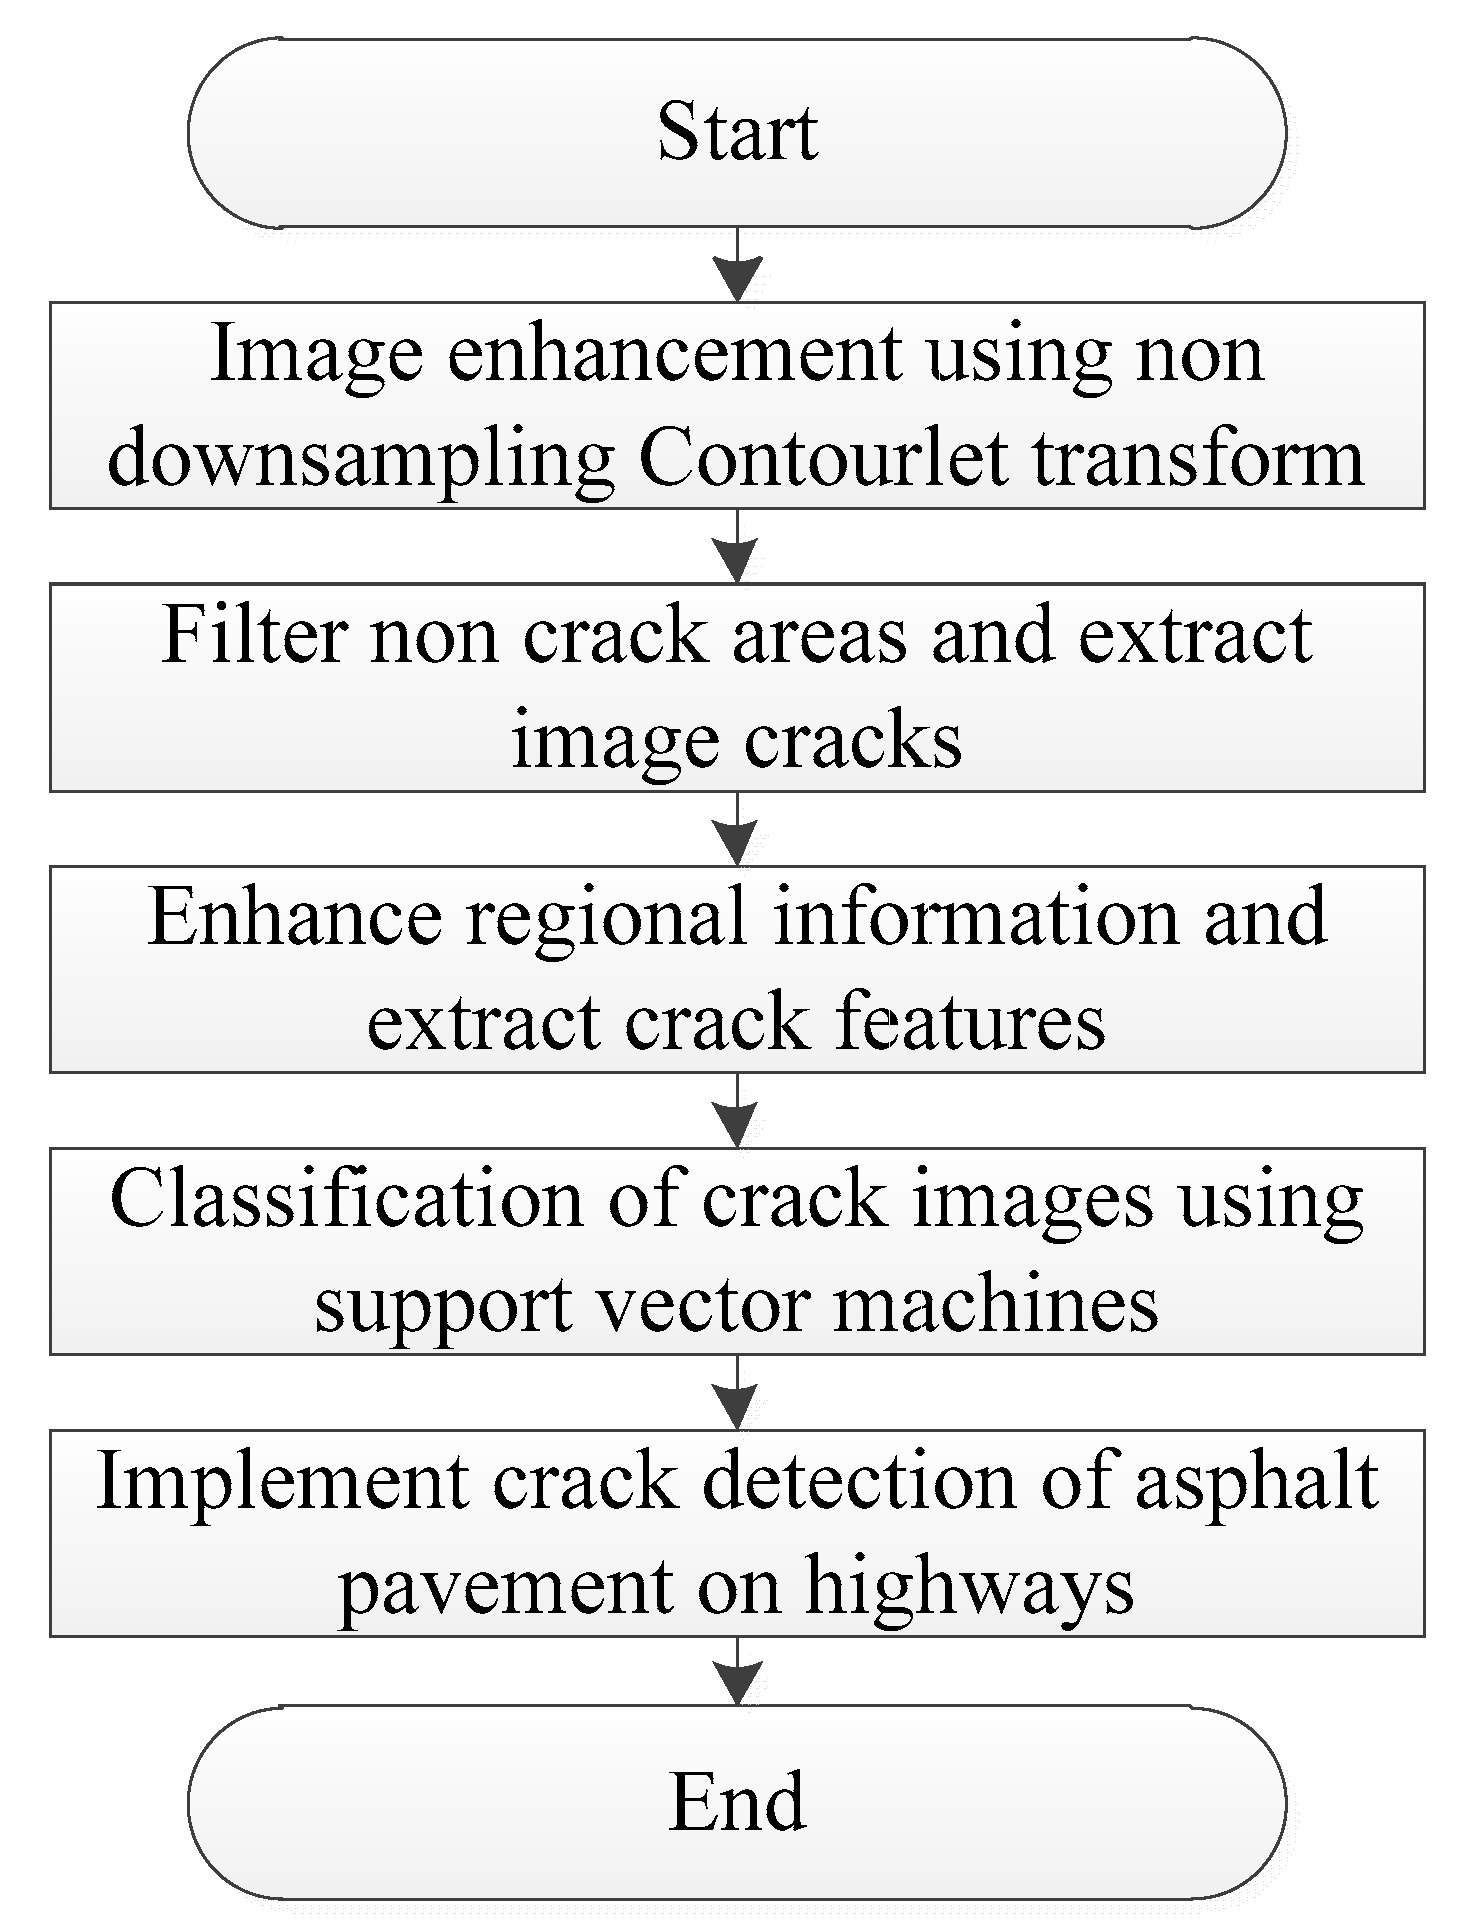
In summary, the flowchart of the crack detection method for asphalt pavement on highways designed in this article is shown in
Figure 3.
4. Experiment and Discussion
In order to verify the overall effectiveness of the digital image processing technology-based crack detection method for expressway asphalt pavement, it is necessary to conduct testing. In this experiment, a Windows 10 system with 32 GB of memory was selected, equipped with an Intel Core i7-14700KF CPU@3.60 GHz. The processor is equipped with an 8-bit 74HC165D model data register, and the simulation software running is Matlab R2019a.
The experimental dataset was created using a randomly collected total of 1000 road surface images, including road crack images (accounting for 75%) and crack-free images (accounting for 25%). Using the Python random sampling algorithm, the dataset is divided into a training set and a testing set, with a ratio of 8:2. The training set is trained to obtain detection results and then compare the detection results with the actual results in the test set to calculate accuracy and recall. Accuracy refers to the proportion of correctly predicted samples to the total number of samples. The calculation method is: accuracy = (true example + true counter-example)/(true example + false positive example + true counter-example + false counter-example). The recall rate refers to the proportion of the number of samples correctly predicted as positive cases (cracks) to the actual number of positive cases (true cases + false negative cases). The calculation method is: recall rate = true example/(true example + false counter-example).
Among them, true positive (TP): the number of samples predicted to be cracks and actually cracked;
True negative (TN): the number of samples predicted to be normal and actually normal;
False positive (FP): the number of samples predicted to be cracks but actually normal;
False negative (FN): the number of samples predicted to be normal but actually cracked.
After obtaining the accuracy and recall rates, we verify the accuracy of different methods for detecting road crack images through the comparative testing F1_score index. The F1_score index is an evaluation indicator that comprehensively considers accuracy and recall. The value range of the F1_score index is between 0 and 1. A higher value approaching 1 indicates a superior performance of the application method, indicating a greater ability to detect road cracks accurately.
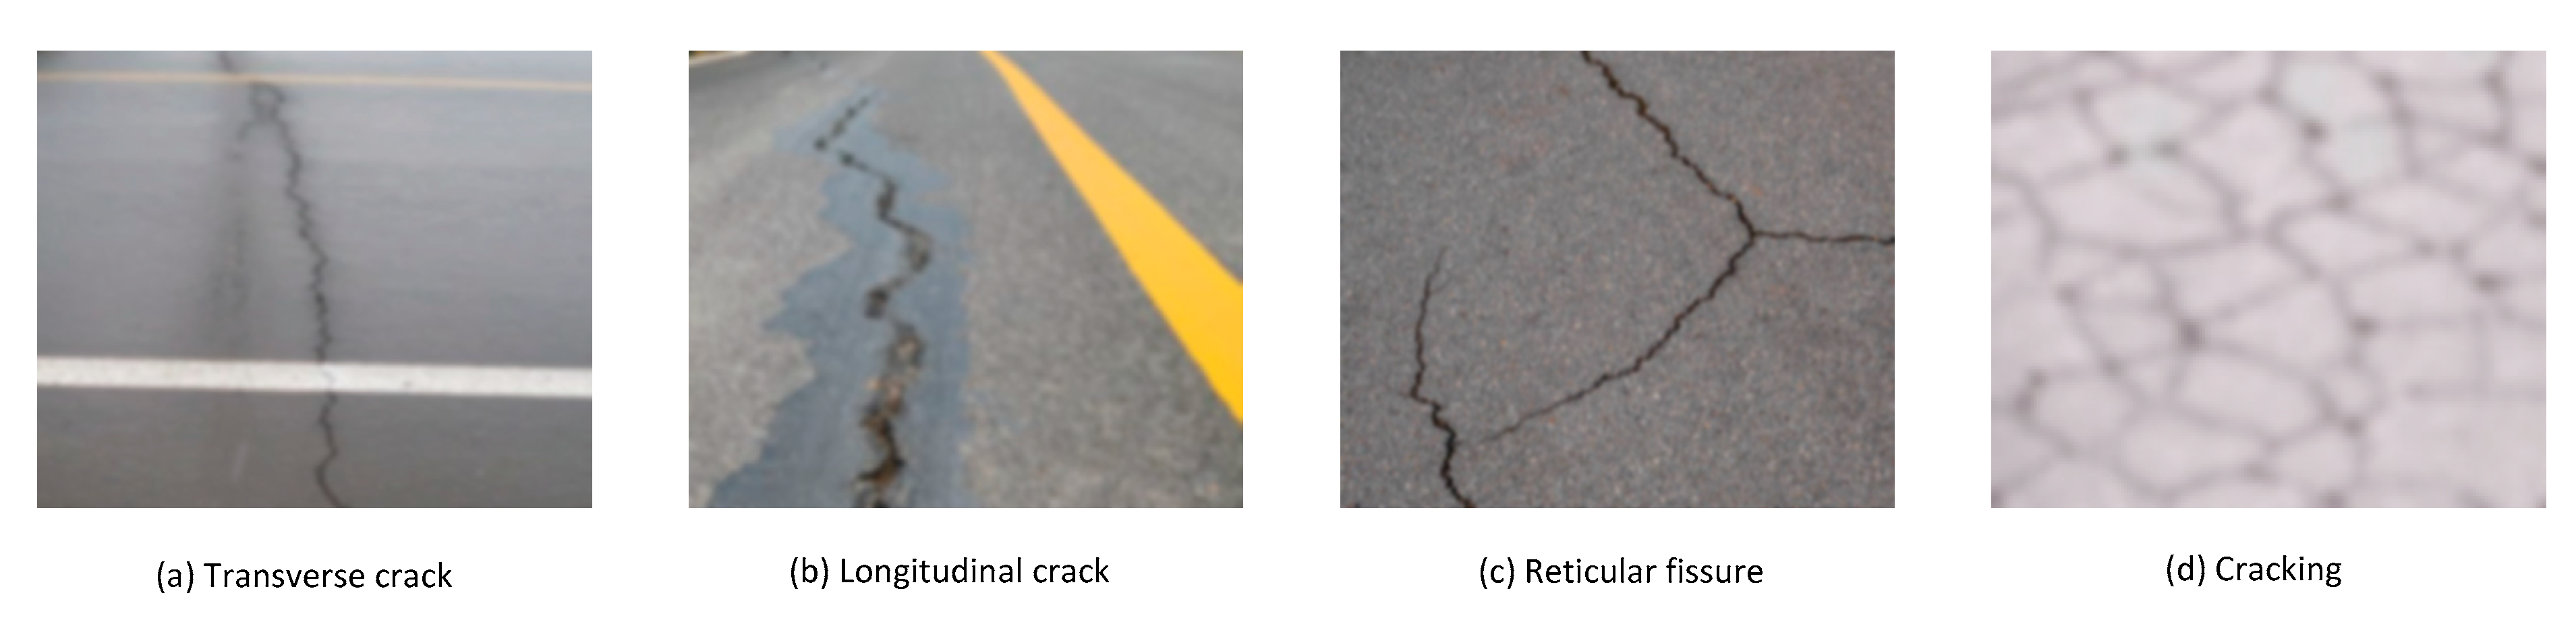
The road crack image set used in this test is shown in
Figure 4.
It can be seen from the analysis of
Figure 4 that the images used for the test include transverse cracks, longitudinal cracks, reticular cracks, and cracking. Due to the influence of acquisition equipment, lighting, and other factors, the image clarity is low. Therefore, the approach to detecting cracks in expressway asphalt pavement is based on digital image processing technology, specifically the literature-based method [
4]. The methods in literature [
5] and literature [
6] expand image enhancement processing, and the results are shown in
Figure 5.
Figure 5 shows that after using the method described in reference [
4], strip noise ripples are added to the image, resulting in a decrease in image clarity. Upon implementing the method in reference [
5], the image shows a slight distortion and serrated noise at the crack edge, which reduces the image quality. After using the method in reference [
6], the image shows local exposure, an increase in highlights, and a lack of some details. After using the proposed method, the clarity of the image is enhanced, noise is reduced, and detailed information about cracks can be accurately obtained. The above tests show that the proposed method has good image effects and can enhance the detailed information in the image.
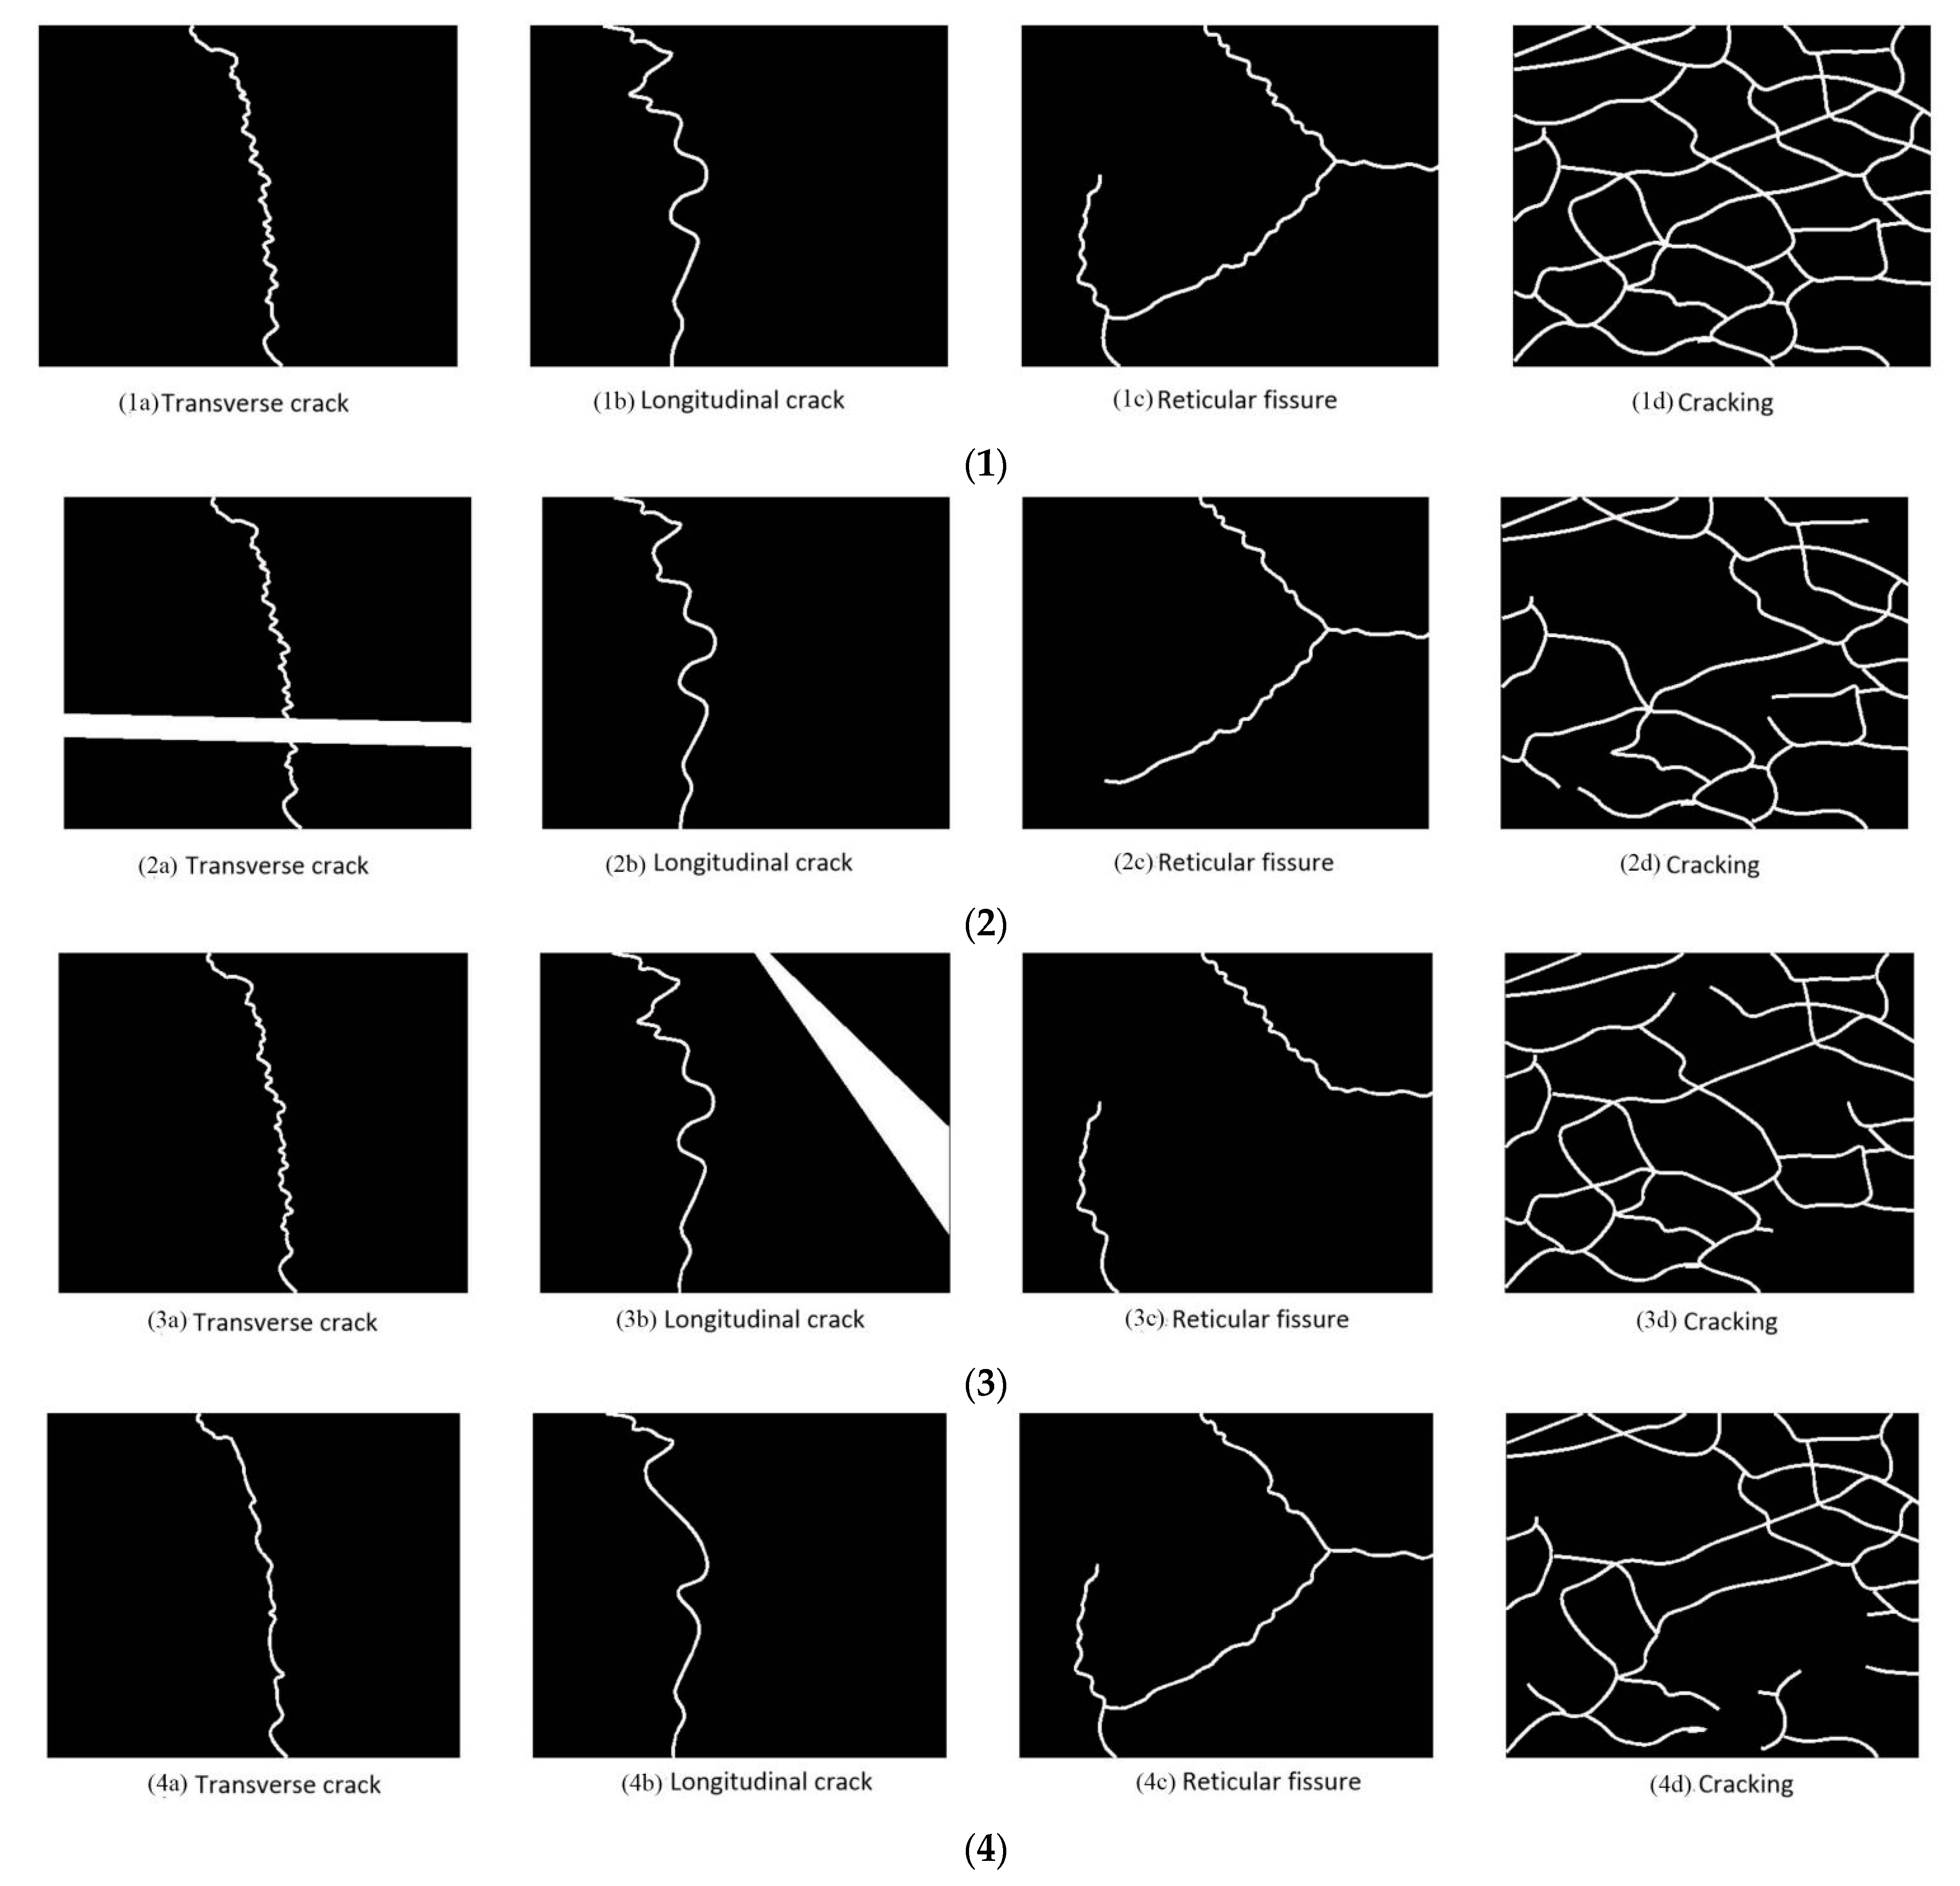
Extracting the crack area of the image is the key technology of crack damage detection. The crack extraction results of the four methods are shown in
Figure 6.
According to
Figure 6, the proposed method can completely extract the cracks in the image without information loss. The literature [
4] and literature [
5] methods have also extracted the non-fracture areas in the road. The literature [
6] method extracts the missing details of cracks. To sum up, the proposed method has a high fracture extraction accuracy.
The proposed method, literature [
4] method, literature [
5] method, and literature [
6] method are used to test the detection of highway asphalt pavement, and four F1 methods are introduced. The detection accuracy of the F1_score index detection method is shown in Formula (29):
where
represents the accuracy rate;
indicates the recall rate.
The detection accuracy of the four methods is shown in
Table 2.
Analysis of the data in
Table 2 shows that the detection accuracy of the four methods decreased with the increase in the number of images. Under the same number of images, the proposed method shows the F1_score consistently above 0.85, indicating that the proposed method is suitable for large-scale crack damage detection.


