Abstract
The Great Wall of China constitutes a significant cultural treasure of the Chinese nation and a valuable piece of heritage of world civilization. Owing to both natural and anthropogenic factors, the Great Wall is undergoing gradual deformation, thereby posing considerable challenges to the overall preservation of the associated sites. This study aims to investigate techniques for monitoring deformation at large-scale linear heritage sites, leveraging the Great Wall as a representative example, and to offer valuable insights for monitoring surface deformations at extensive cultural heritage sites worldwide. Employing SBAS-InSAR technology, this research analyzes and monitors the deformation of the Great Wall. A series of Sentinel-1A images captured between March 2017 and January 2022, consisting of 161 scenes, were subjected to SBAS-InSAR processing to derive the deformation rate field along the wall. To ensure the reliability of the findings, a representative mountainous segment, spanning approximately 896.53 km within the scenic corridor of the Great Wall, was selected for analysis. The outcomes indicate that 75.8% of the scenic corridor in Shanxi Province, representing the Ming Great Wall, exhibits relative stability with deformation rates ranging from −10 to 10 mm/year. Conversely, 24.2% of the scenic corridor demonstrates significant deformation, with a maximum subsidence rate of 33.1 mm/year and a maximum subsidence of 148.6 mm. Therefore, this research highlights the potential application of SBAS-InSAR technology in the monitoring and assessment of surface deformation at massive linear cultural heritage sites and offers a reference point for similar monitoring efforts on a global scale.
1. Introduction
Cultural heritage serves as an important symbol of a country’s and nation’s historical and cultural accomplishments. However, maintaining the sustainability and stability of cultural heritage faces numerous challenges stemming from natural and human factors [1]. Today, various structural issues have been observed in many cultural heritage sites across the world [2,3,4]. Therefore, ensuring the reliable deformation monitoring of heritage structures and their surrounding environments becomes crucial [5,6,7,8]. Traditional methods for detecting cultural heritage typically require a substantial amount of manpower for investigation and verification. However, these methods are not only labor-intensive and time-consuming but are also prone to oversight issues [9]. In recent years, surveying techniques, such as leveling, global satellite navigation systems, laser scanning, and ground-penetrating radar, have been increasingly employed to monitor the sustainability and stability of cultural heritage [10,11,12,13,14].
As one of the Seven Wonders of the World, the Great Wall of China holds historical, scientific, and artistic value, and is characterized by its vast scale, rich heritage value, complex natural and cultural environment, and diverse risk factors. Over an extended period, the Great Wall has been exposed to the influences of natural and human factors, leading to an increasing stability risk. In recent years, the Great Wall in China has experienced destruction, damage, and improper repairs, with occasional incidents of wall collapse. These challenges have significantly impacted the preservation and management of the Great Wall in China [15,16]. The Ming Great Wall in Shanxi Province is an integral part of the Ming dynasty’s Great Wall and faces extremely challenging circumstances due to limitations imposed by the surrounding natural environment when conducting large-scale field observations of the Ming Great Wall.
Synthetic aperture radar (SAR) is a satellite-based technology that enables the collection of extensive ground information without physical contact with the target [17,18,19]. Since the 1980s, researchers have utilized SAR imagery to monitor cultural heritage and have demonstrated its reliability in sustainability and stability studies [20,21,22,23,24]. Among the studies utilizing SAR imagery for cultural heritage monitoring, those using interferometry synthetic aperture radar (InSAR) displayed marked advantages in deformation monitoring, owing to its wide coverage, high precision, high resolution, and all-weather capabilities [25,26]. However, conventional differential InSAR (D-InSAR) techniques provide unsatisfactory results when monitoring the deformation of large-scale linear features due to factors like temporal and spatial decorrelation and atmospheric phase delay. Recent research has concentrated on the study of linear features, with particular attention from scholars both domestically and internationally being given to the small baseline subset InSAR (SBAS-InSAR) and persistent scatterer InSAR (PS-InSAR) techniques, owing to their high accuracy and noise resistance [27,28,29,30,31]. Studies using SBAS-InSAR and PS-InSAR techniques have already been applied to various linear features such as subways [32,33,34], bridges [35,36], and high-speed railways [37,38], producing positive outcomes.
In recent years, scholars both domestically and internationally have utilized InSAR technology to monitor the surface deformation of several significant cultural heritage sites. For example, He et al. applied SBAS-InSAR technology to monitor the surface deformation of the Zhangjiakou section of the Ming Great Wall in Hebei Province [39]. Similarly, Zhu et al. employed D-InSAR techniques to assess the surface deformation caused by the Mado earthquake in Qinghai Province, focusing on the analysis of Zhalang Temple, a cultural heritage site associated with Tibetan Buddhism in Qinghai [40]. Chen et al., on the other hand, conducted the surface deformation monitoring of the ancient pagodas in Bagan, Myanmar, using SBAS-InSAR and PS-InSAR technologies [41]. Additionally, Xu et al. proposed a specialized algorithm suitable for complex terrains in mountainous areas to monitor surface deformation of the Shanhaiguan section of the Ming Great Wall in Hebei Province and produced a stability risk map for this section [42]. Building upon the studies conducted by scholars both domestically and internationally, this research combines Sentinel-1A ascending orbit data with the SBAS-InSAR technique to obtain a deformation velocity field of the Great Wall corridor in Shanxi. Quantitative analysis is performed on the deformation results of the Shanxi section of the Ming Great Wall in China to assess the future development trend of deformation, while qualitative analysis is conducted to create a deformation risk map. The research results demonstrate that SBAS-InSAR technology based on SAR satellite imagery possesses the capability to monitor the surface deformation of linear cultural heritage, particularly in situations where traditional detection methods such as field investigations and measurements present challenges. These results not only provide technical support for monitoring and preserving the Ming Great Wall in Shanxi Province but also establish a theoretical foundation for large-scale cultural heritage deformation monitoring worldwide.
2. Study Area and Data Sources
2.1. Overview of the Study Area
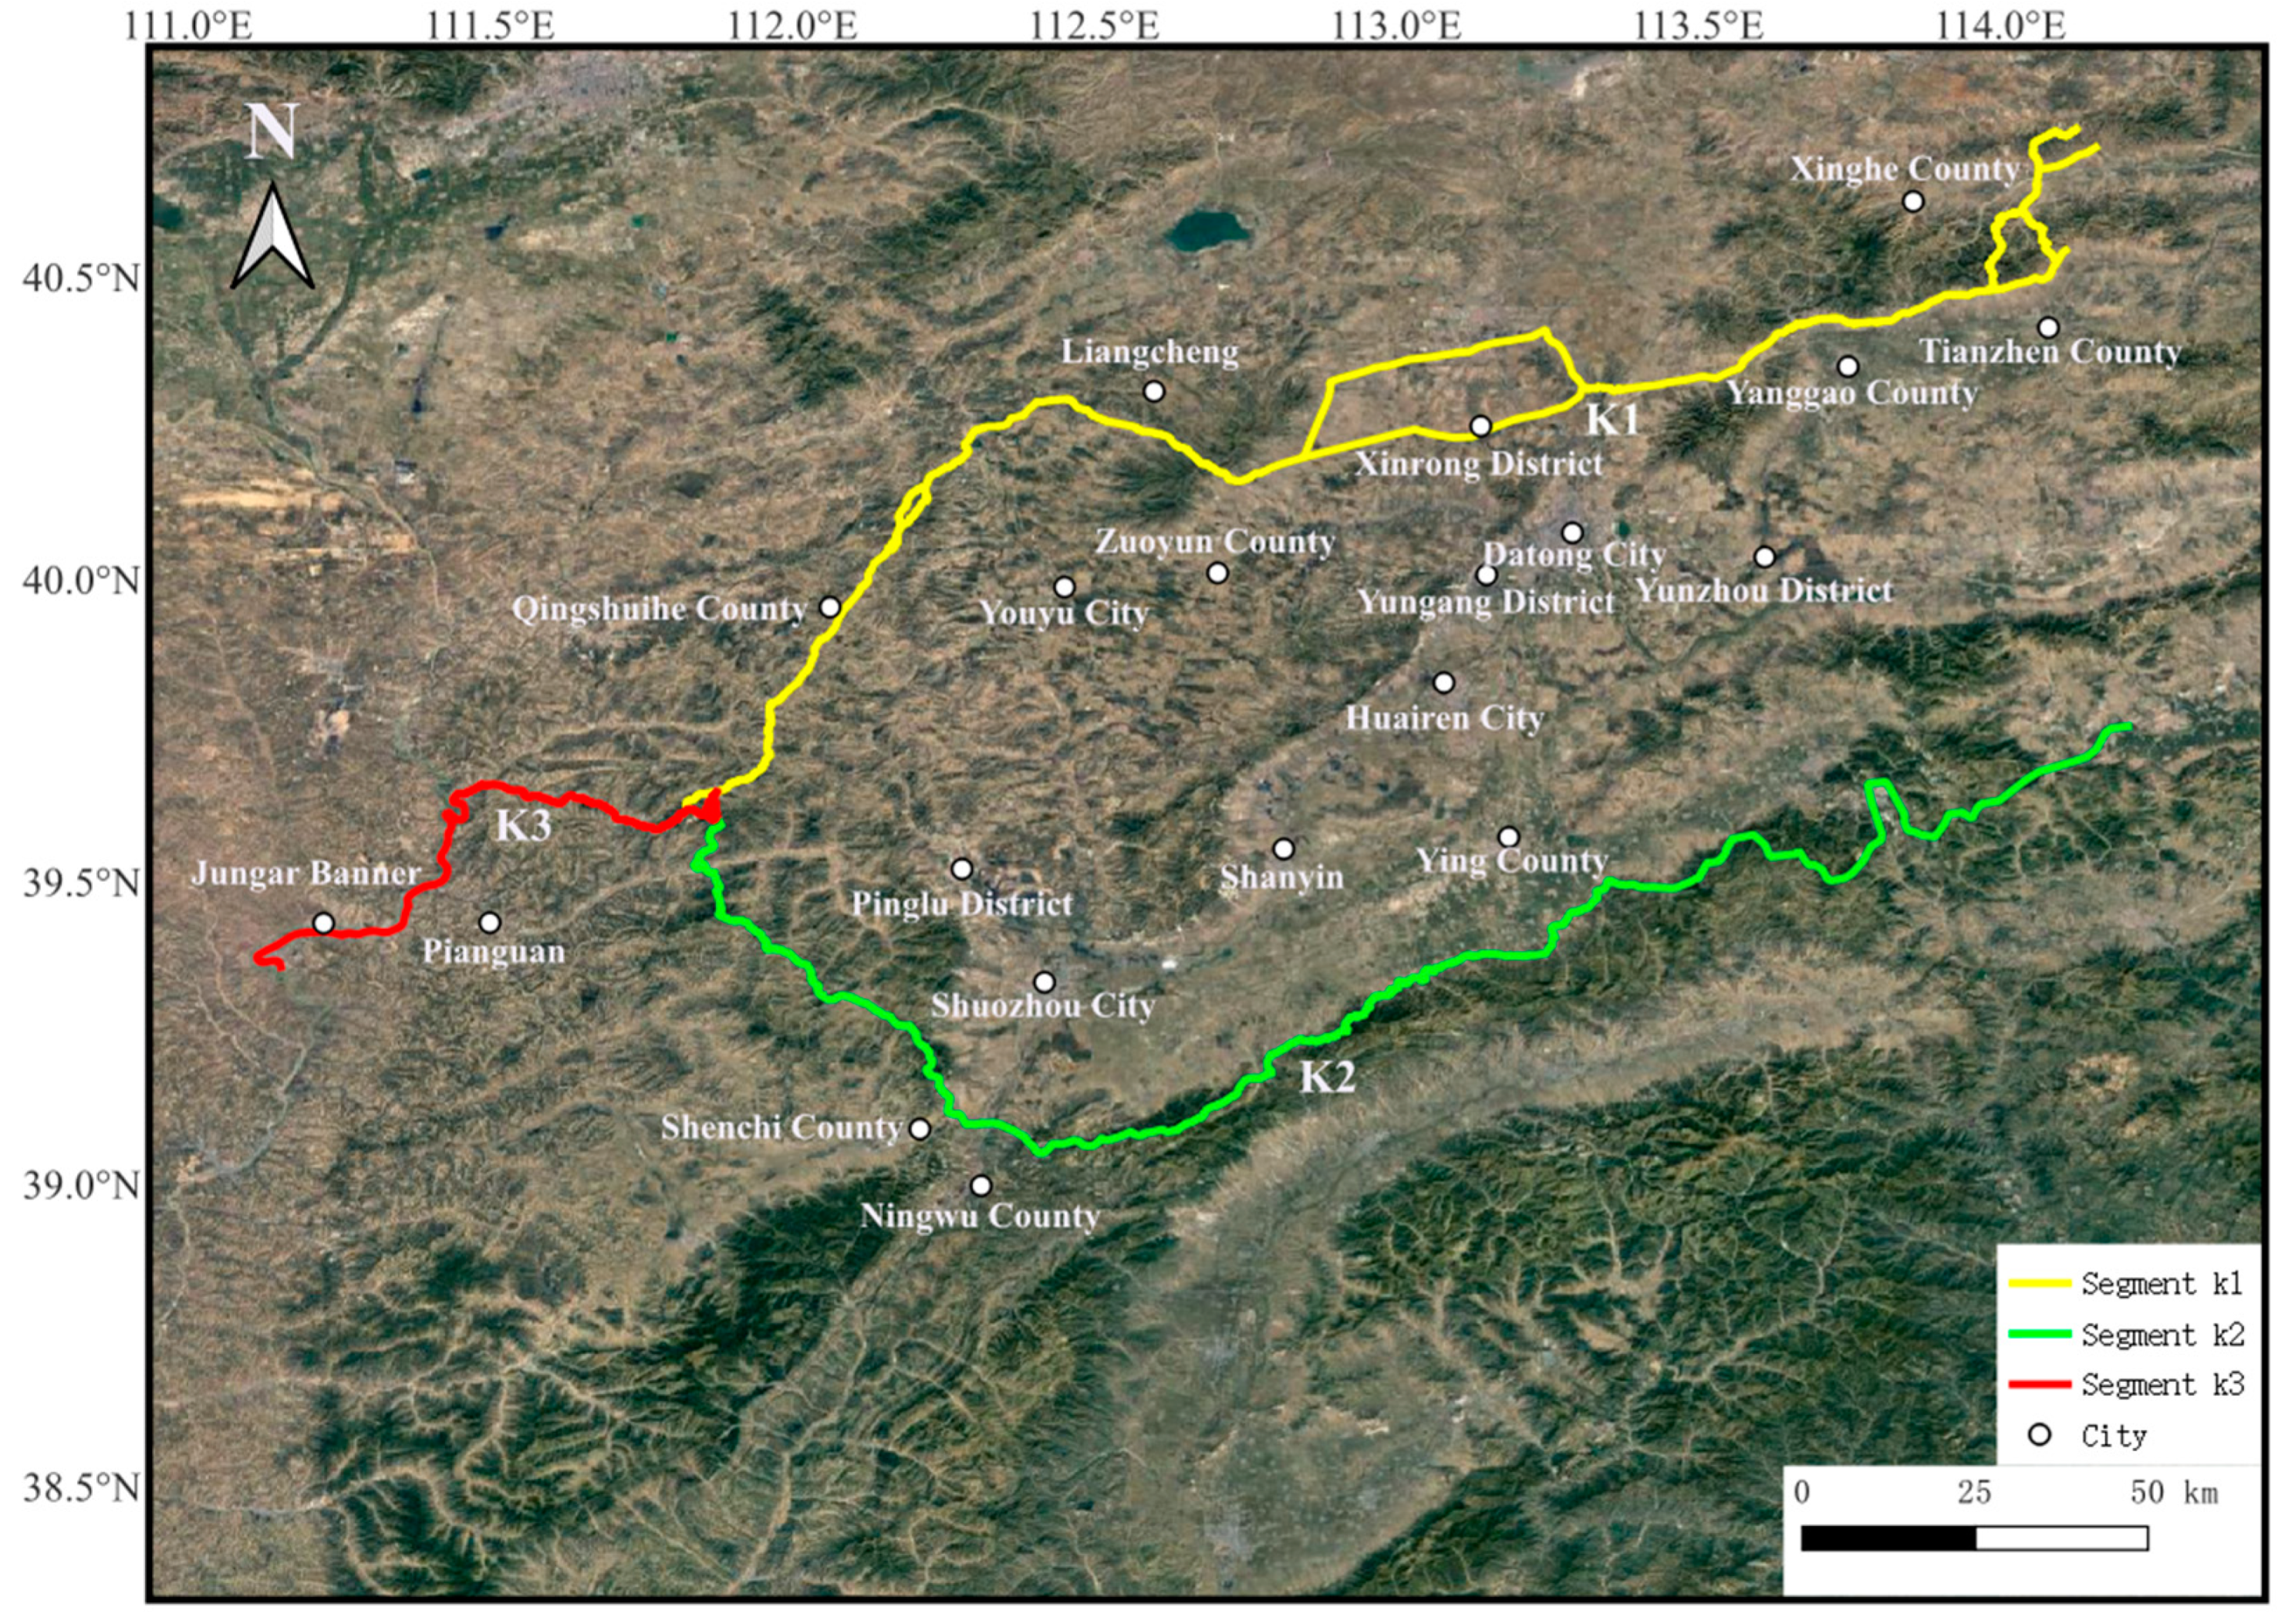
The Ming Great Wall in Shanxi Province extends for a total length of 896.53 km and encompasses 6 cities and 25 counties. It consists of three sections: the Outer Great Wall, Inner Great Wall, and Riverside Great Wall, as shown in Figure 1. The Outer Great Wall (segment k1) originates from Huai’an in Hebei Province and stretches westward to Tianzhen, passing through Yanggao, Xinrong, Zuoyun, and Youyu, before reaching Piankou, spanning approximately 380 km. The Inner Great Wall (segment k2) commences in Pingshan, Hebei Province, and enters Fanzhi in Shanxi Province. It traverses Hunyuan, Ningwu, and Shencheng, before turning towards Piankou, covering a distance of about 400 km. The Riverside Great Wall (segment k3) is constructed along the Yellow River. The westernmost segment, at the junction between Shanxi Province and Shaanxi Province, spans around 70 km from Piankou to Hequ.

Figure 1.
Route map of the Ming Great Wall in Shanxi Province.
Figure 2 illustrates the coverage area of the Sentinel-1A images used in the study. The study area is outlined in yellow, while the red markings indicate the ascending orbit image range of Sentinel-1A.
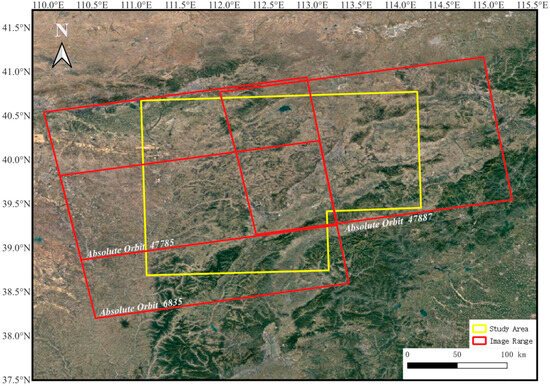
Figure 2.
Illustration of the study area boundary.
2.2. Overview of the Dataset
This study utilized single-look complex imagery data from the C-band of Sentinel-1A, covering a five-year period from January 2017 to January 2022. The imagery had a ground resolution of 5 m by 20 m and consistently employed VV polarization. Precise orbital data and a 30-meter resolution digital elevation model (DEM) sourced from the NASA Space Shuttle Radar Topography Mission (SRTM) were used for satellite orbit refinement and terrain phase removal. The relevant parameters of the imagery data are presented in Table 1.

Table 1.
Parameters of Sentinel-1A image data.
3. Research Methodology
3.1. Principle of Small Baseline Subset Time Series Analysis Technique
Acquire a set of SAR images covering the same area, record the acquisition times , register the images to a common coordinate system, and generate a series of spatiotemporal differential interferograms with values below a specified threshold. The following conditions should be met:
The phase value of the pixel in the -th interferogram is:
In Equation (2), represents the line-of-sight cumulative deformation relative to the initial time , and is the radar wavelength.
After correcting for terrain-induced phase errors, atmospheric delay phase, and noise phase in the obtained cumulative deformation variables, the transformed results yield the deformation rate for high-coherence points in the study area:
In Equation (3), represents the coefficient matrix of , and is a matrix composed of phase values. The deformation rate , therefore, can be expressed as:
When the coefficient matrix is of full rank, the deformation rate can be determined using the least squares method. If the matrix is not of full rank, the singular value decomposition (SVD) method is employed to compute the deformation rate .
After obtaining the deformation rate, a temporal integration is conducted to derive the deformation phase values over the specified time period. Multiplying the deformation phase values by the phase-to-deformation conversion coefficient yields the deformation time series on the ground’s line of sight (LOS) direction, as seen by the radar.
Finally, the deformation component along the radar LOS direction is transformed into the vertical deformation component on the Earth’s surface, as follows:
In Equation (5), represents the satellite incidence angle and signifies the line of sight (LOS) deformation component.
3.2. Data Processing Procedure
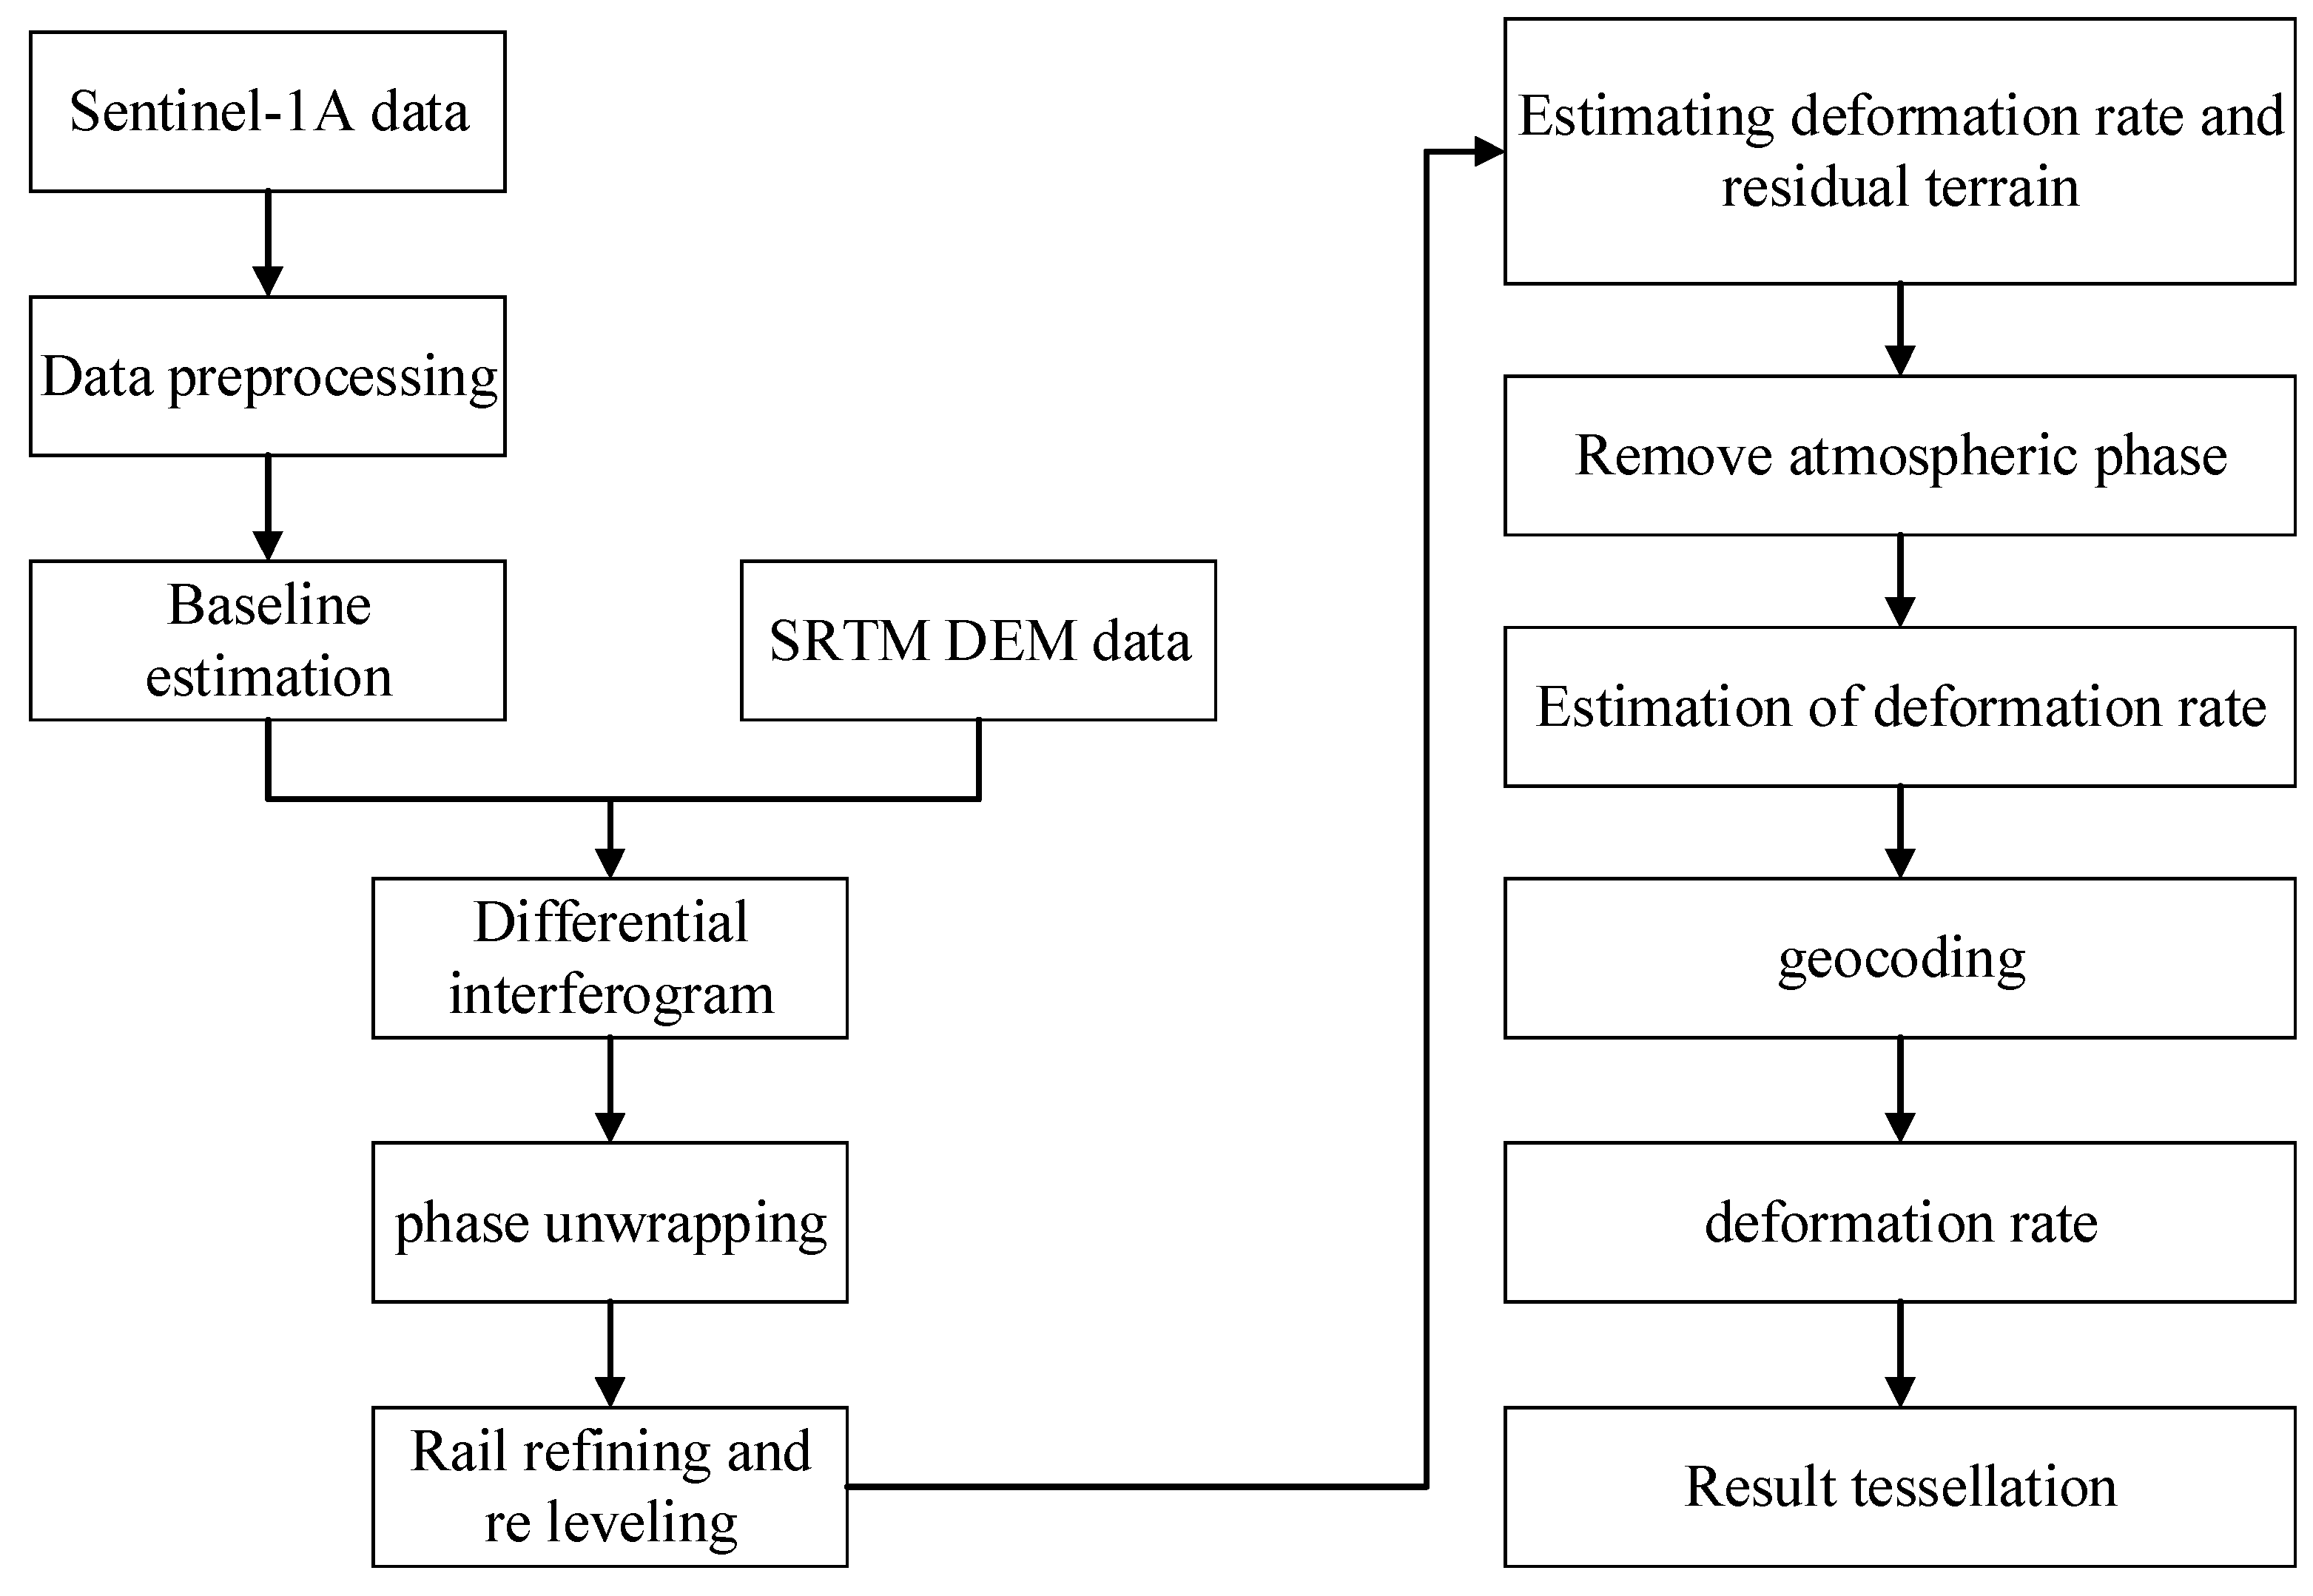
Figure 3 depicts the processing flow of the SBAS-InSAR method, which includes four main steps: data preprocessing, baseline estimation, differential interferometry, and phase unwrapping. The prioritization of interferometric pairs ensures adherence to spatiotemporal baseline conditions. This study used a spatial baseline threshold of 2% and a temporal baseline threshold of 40 days as standards. Interferometric processing was carried out on images obtained from three orbits, resulting in 126, 118, and 134 interferometric pairs. Coherence images with high quality were selected and, in conjunction with SRTM4 DEM and ground control points (GCPs), two inversion procedures were performed to estimate deformation rates and residual deformations. To geographically reference the study area’s SRTM4 DEM data, annual average subsidence rate maps for the Ming City Wall area in Shanxi Province were obtained for the period from 2017 to 2022. Since the three deformation fields shared the same GCPs, seamless mosaic and analysis were conducted using ENVI, resulting in a comprehensive deformation field. In order to reduce computational load and suppress noise, a multi-view approach of two views in range and ten views in azimuth was applied to the interferograms. Furthermore, Goldstein filtering was employed to further eliminate noise from the multi-view differential interferograms, and the minimum cost flow method was used for phase unwrapping.
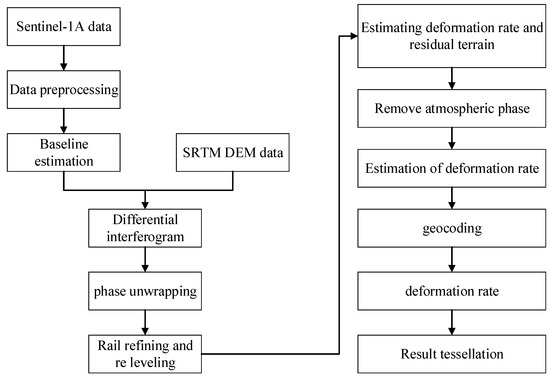
Figure 3.
Flowchart of SBAS-InSAR technique.
4. Analysis of Results
4.1. Analysis of Subsidence Monitoring along the Great Wall Area
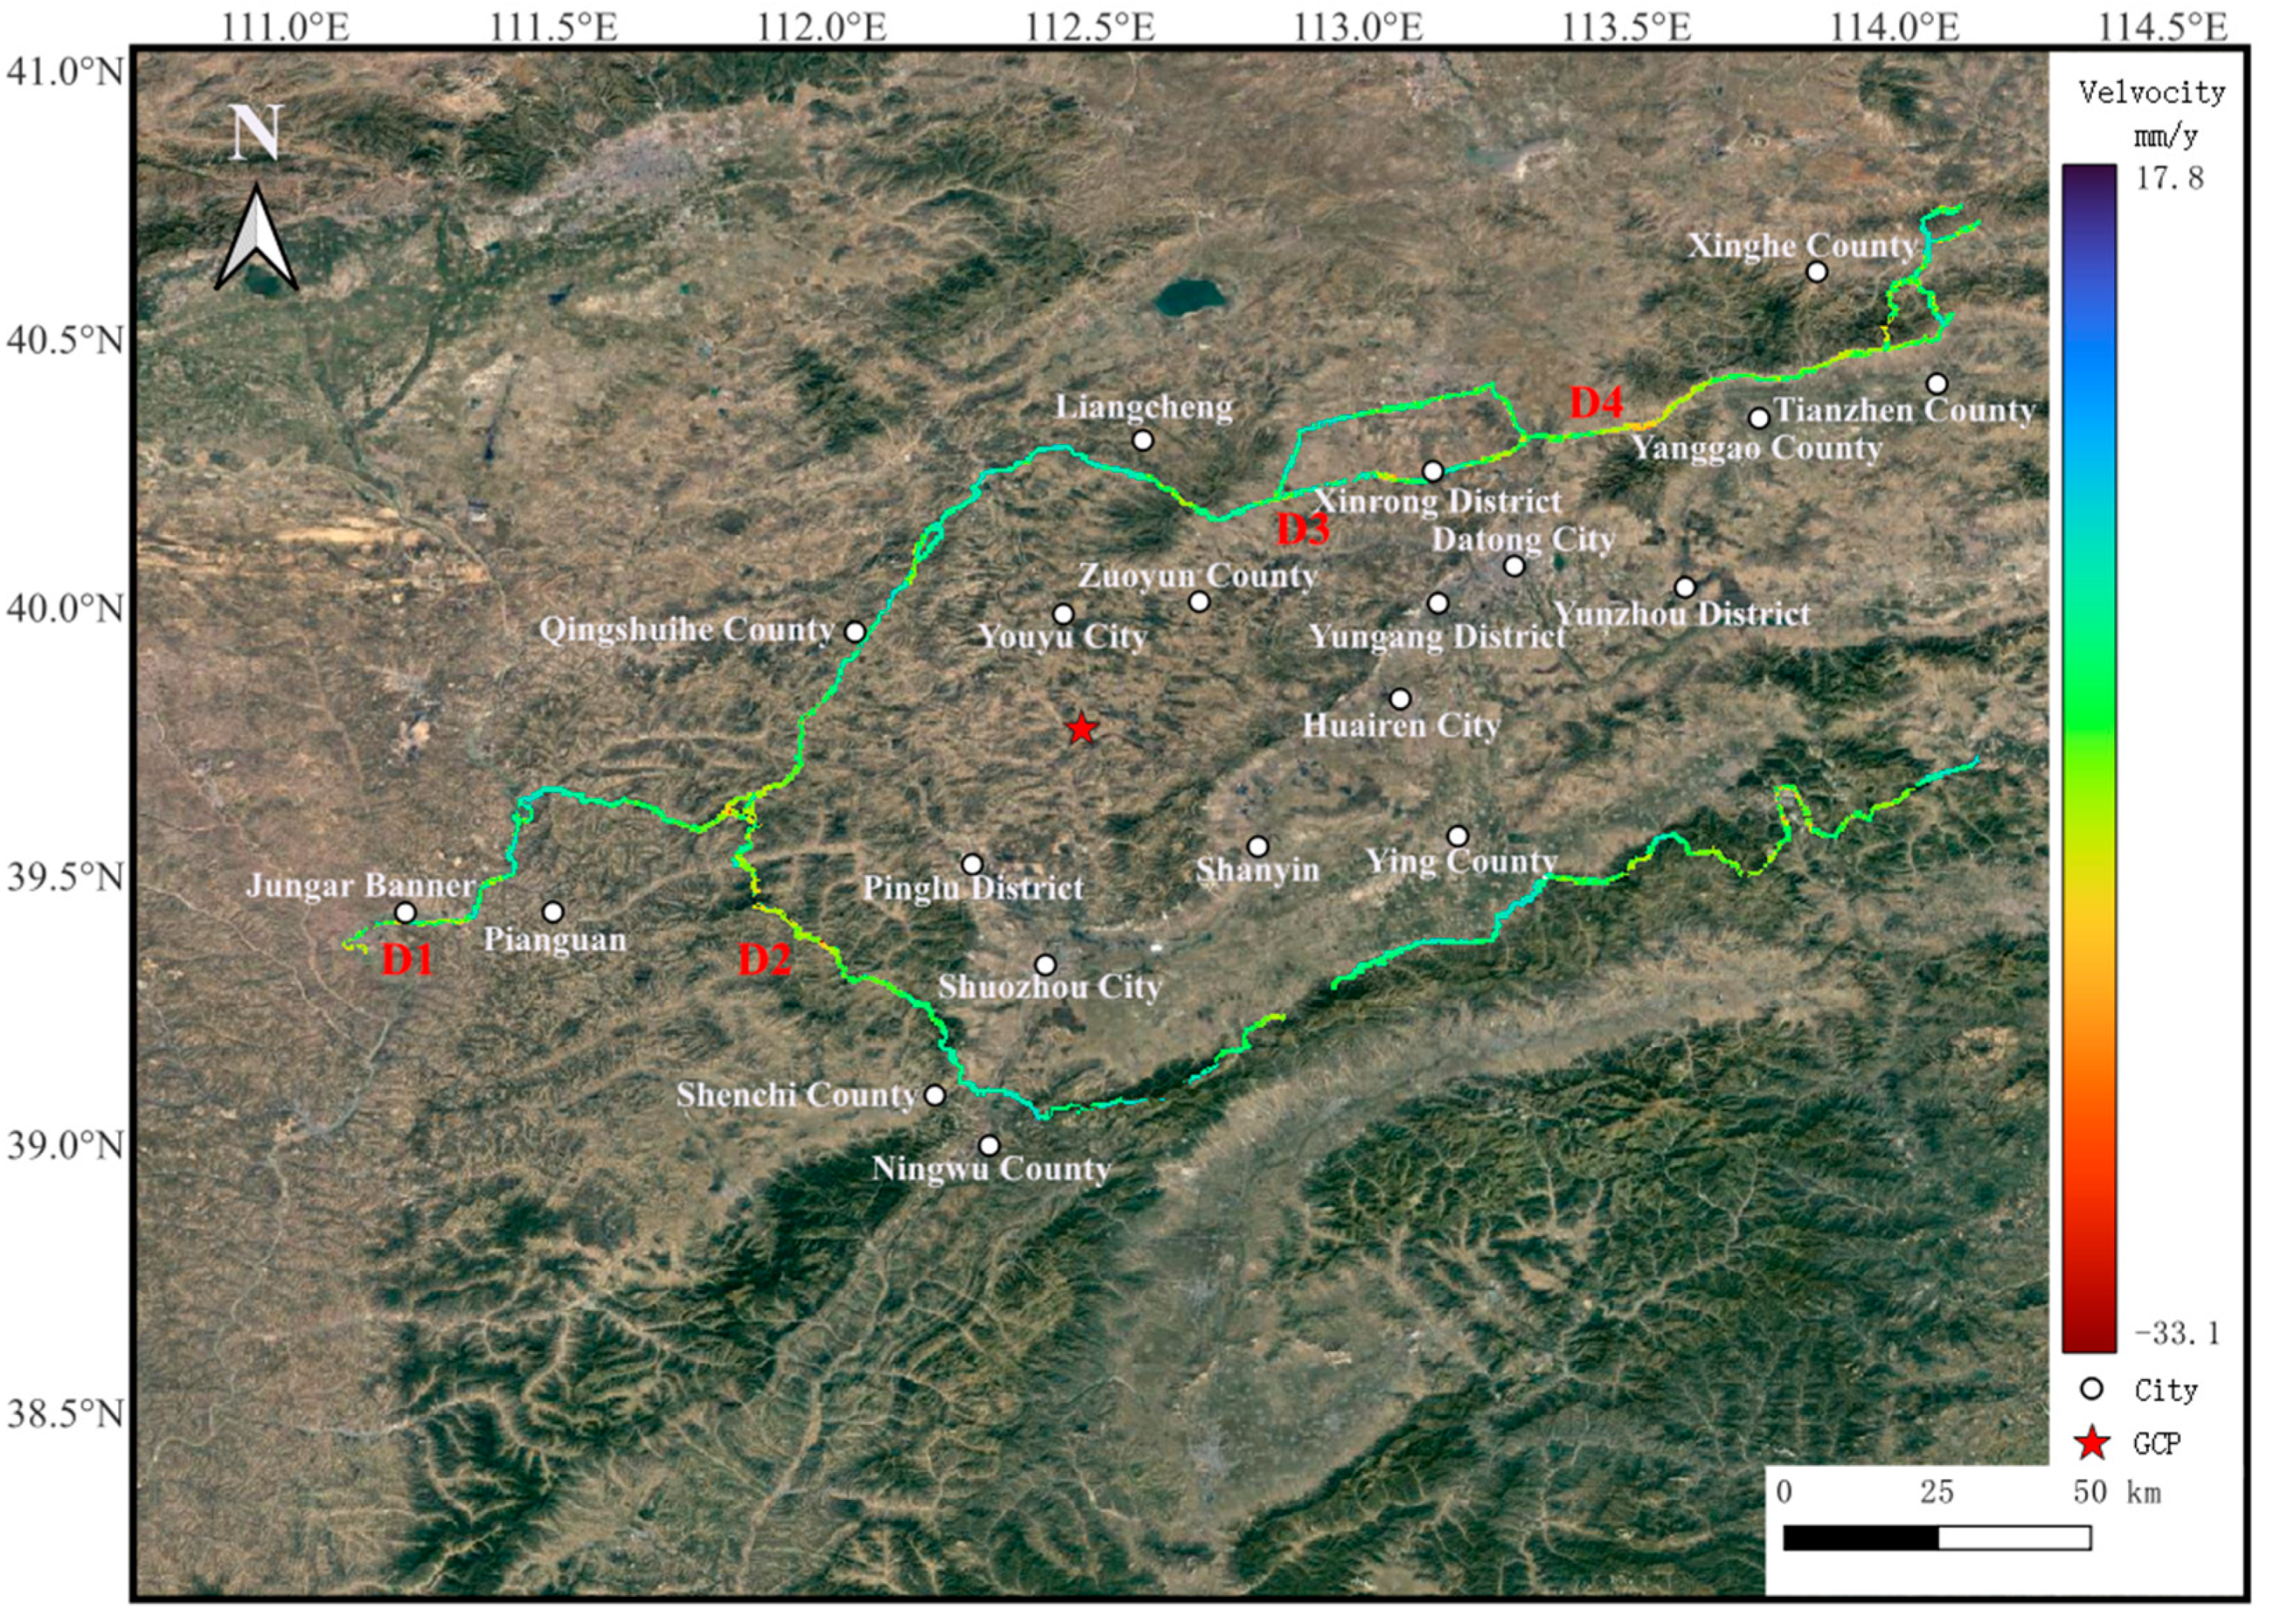
The primary focus of this study was the 250 m buffer zone along the Ming Great Wall in Shanxi Province, with a reference point coordinates of (112.5° E, 39.8° N). The average annual rates of vertical ground deformation along this buffer zone were obtained and presented in Figure 4, while Figure 5 illustrates the corresponding components of vertical ground deformation. The analysis reveals that the majority of deformation rates for the Great Wall range from −10 mm/year to 10 mm/year, with deformation components concentrated between −60 mm and 40 mm. Notably, significant subsidence is observed in several segments, namely the Yulong Bay section (D1), the Shuocheng section (D2), the Youyu section (D3), and the Lierkou section (D4). Among these four key subsidence segments, the maximum rate of subsidence reaches −30.11 mm/year, with the maximum subsidence measured at −148.63 mm.

Figure 4.
Vertical ground deformation rates.
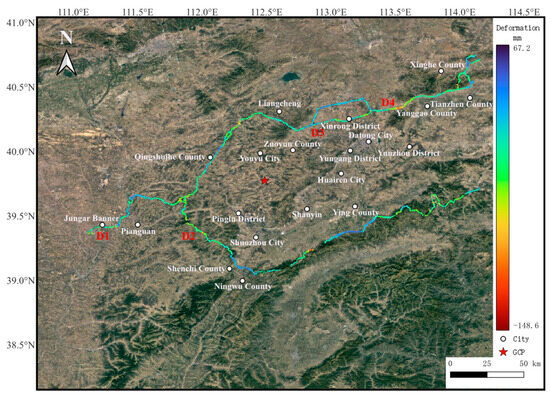
Figure 5.
Vertical ground deformation segments.
4.2. Analysis of Subsidence Monitoring in the Area along the Great Wall
An analysis of Figure 4 and Figure 5 uncovers four noteworthy areas of subsidence. This study examines the risk factors for the Great Wall in these subsidence areas, using the classification of damage, causes of damage, and existing diseases of the Great Wall specified in the “Handbook for Great Wall Resource Survey” released by the National Cultural Heritage Administration in April 2007 [43].
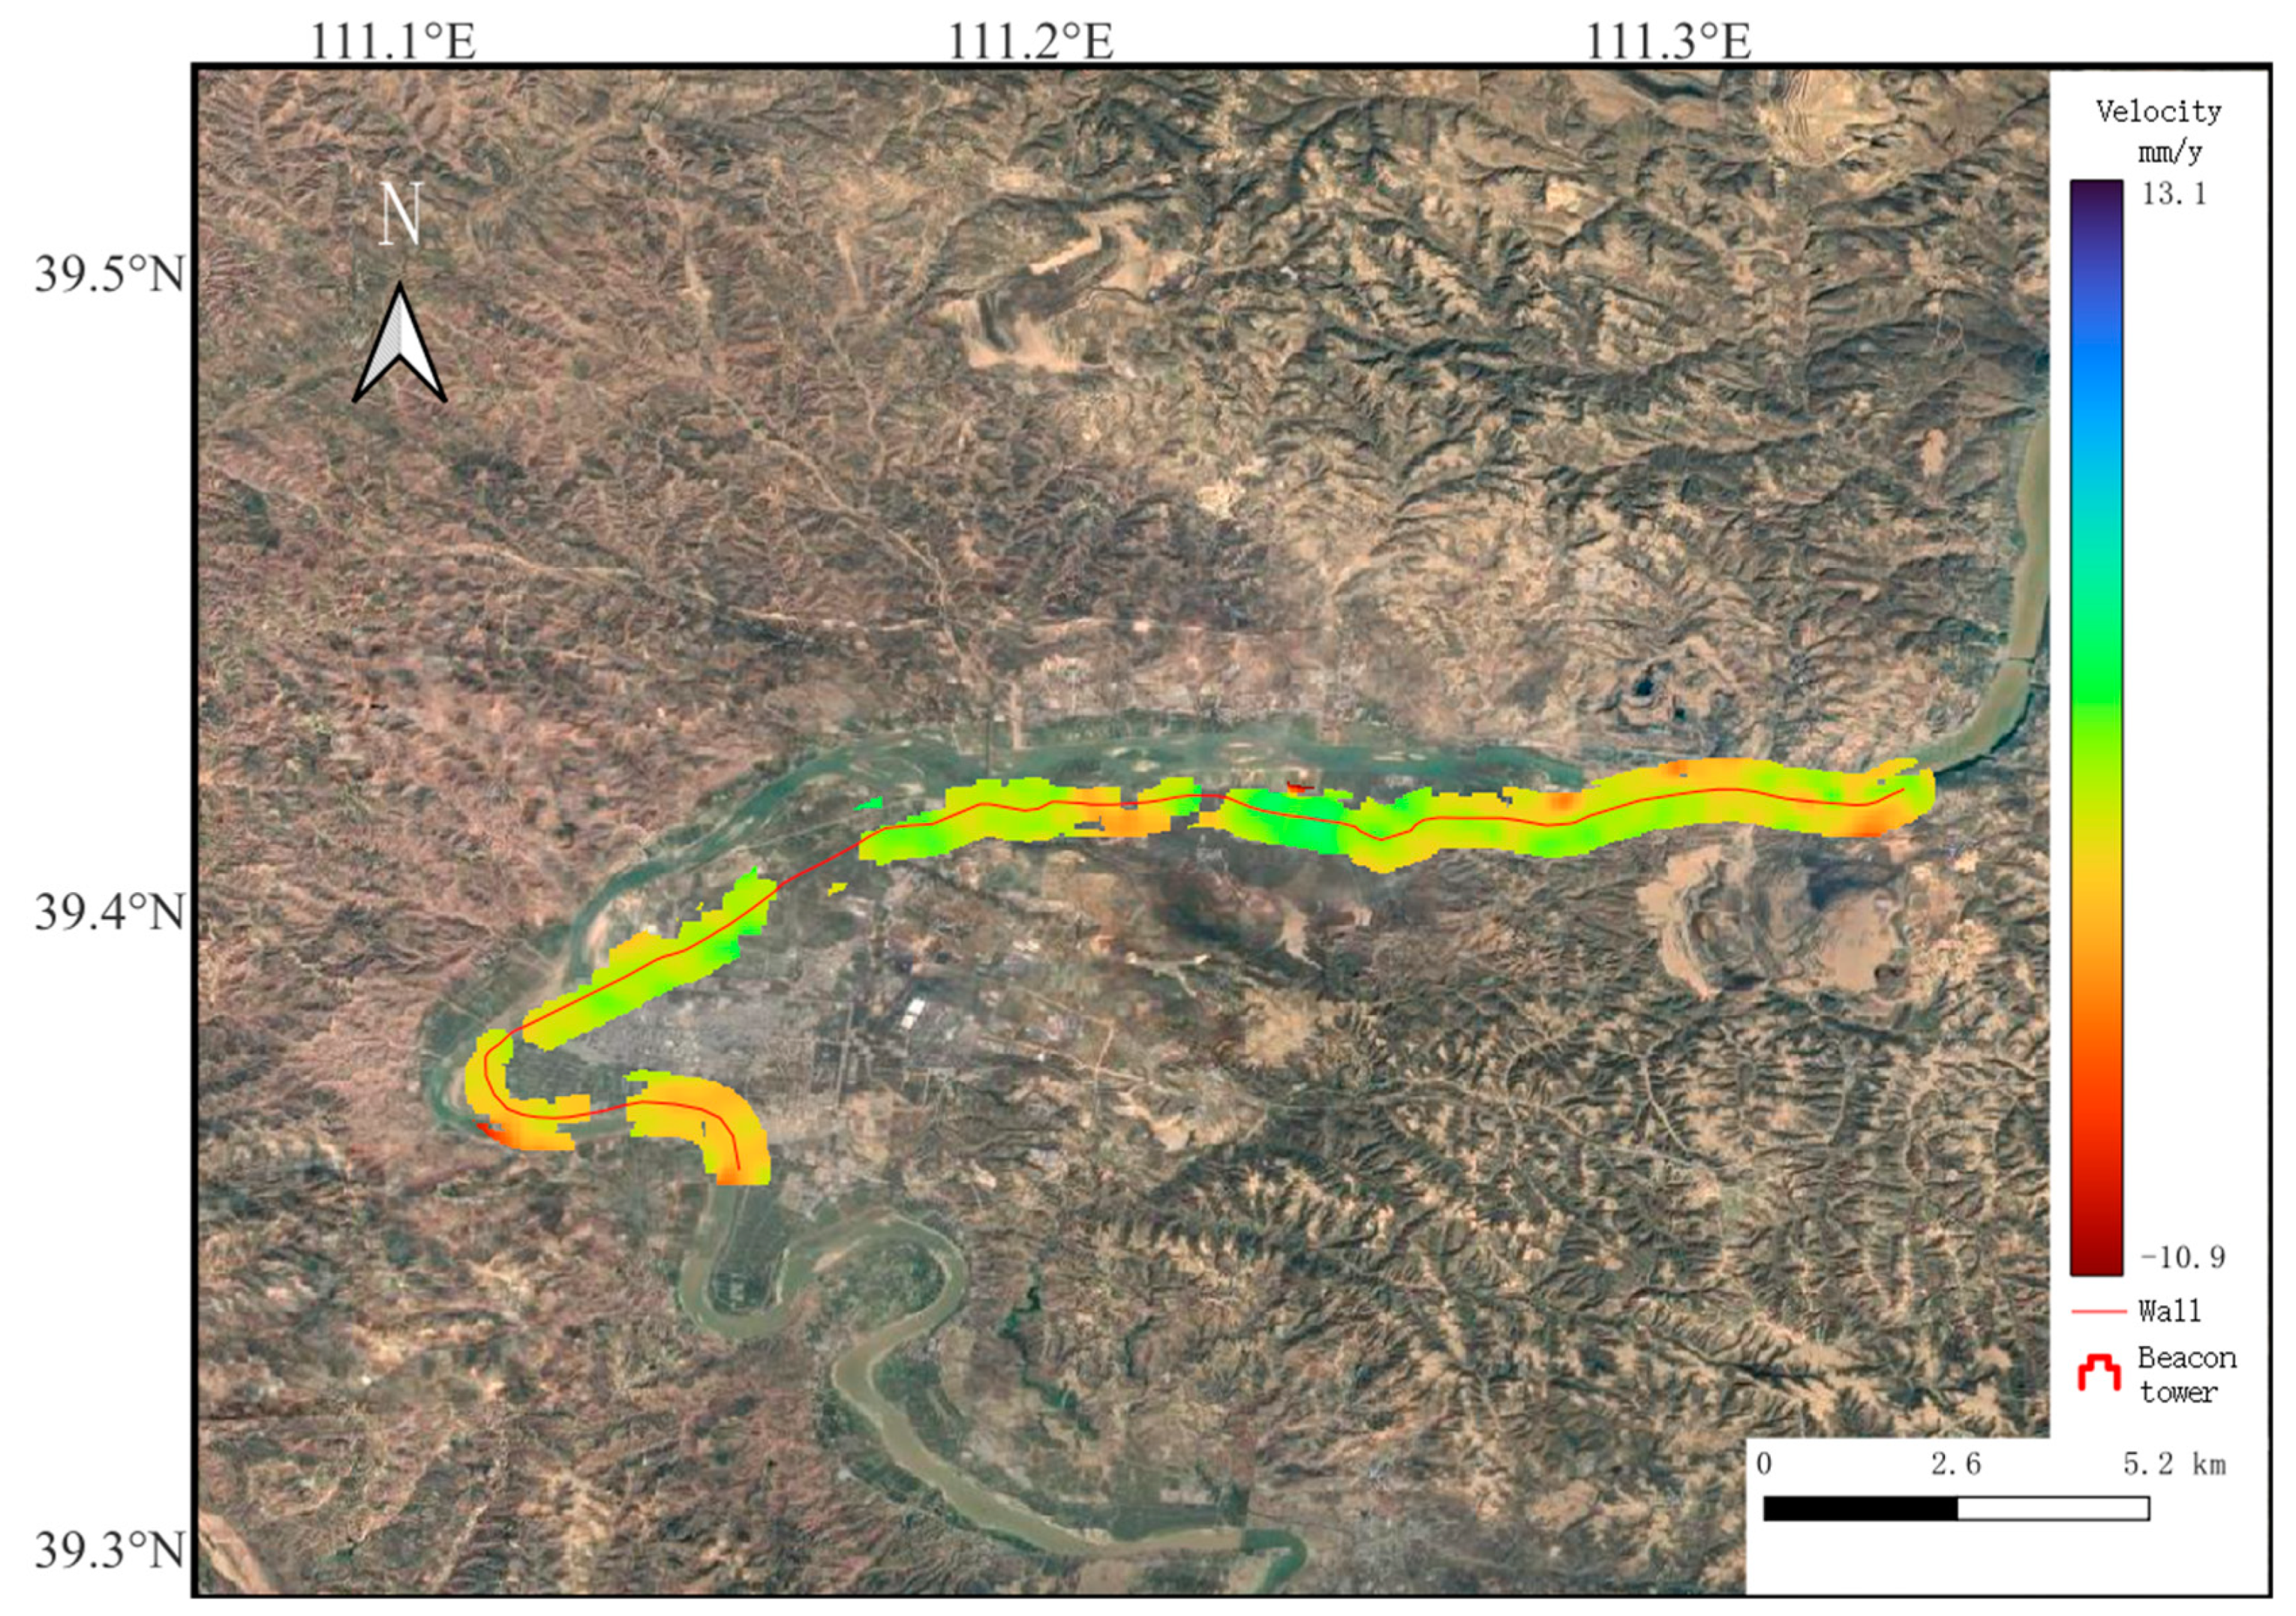
Segment D1 is located along the Yulong Bay shoreline in Hequ County, featuring a wall constructed from brick and stone. The topography of this area is defined by loess hills and gullies. Figure 6 illustrates the deformation rates of the D1 wall. Shanxi Province experiences significant annual variations in precipitation, characterized by uneven temporal distribution and frequent episodes of heavy, short-duration rainfall. These heavy rainfall events have the potential to cause damage to the structure of the Great Wall [44,45].
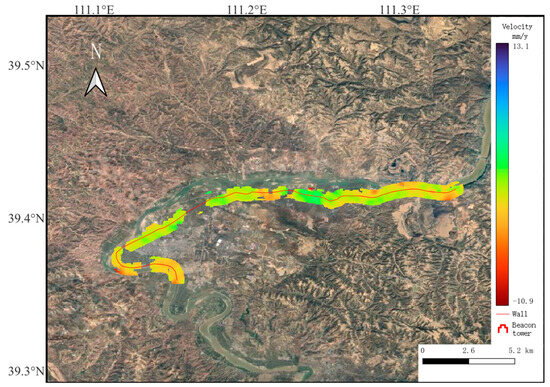
Figure 6.
Deformation rate map of Great Wall Segment D1.
The temporal deformation characteristics are analyzed by focusing on the well-preserved No. 1 Watchtower of Luoquebao in Hequ County, Xinzhou City. Figure 7 presents the surface deformation at Shichengkou and the corresponding precipitation levels during different time intervals, combining historical precipitation data from meteorological bureau statistics. There is a strong consistency between the deformation patterns at Shichengkou and the monthly variations in local precipitation. During the flood season, which lasted from June to September in the years 2017 to 2022, Shanxi Province experiences increased precipitation. Consequently, the Luoquebao No. 1 Watchtower exhibits conspicuous subsidence, with a maximum subsidence rate approaching 10 mm/month. This suggests that erosion induced by intense, short-duration rainfall serves as the primary factor driving the subsidence and deformation of the Great Wall in Segment D1.
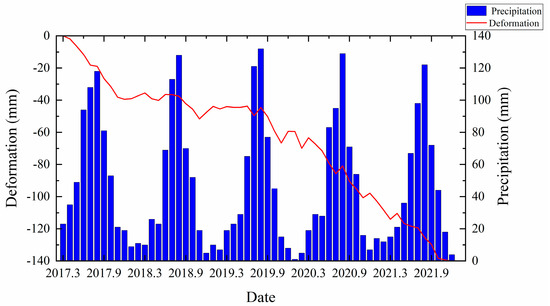
Figure 7.
Time series ground deformation and precipitation at Luoquebao Beacon tower.
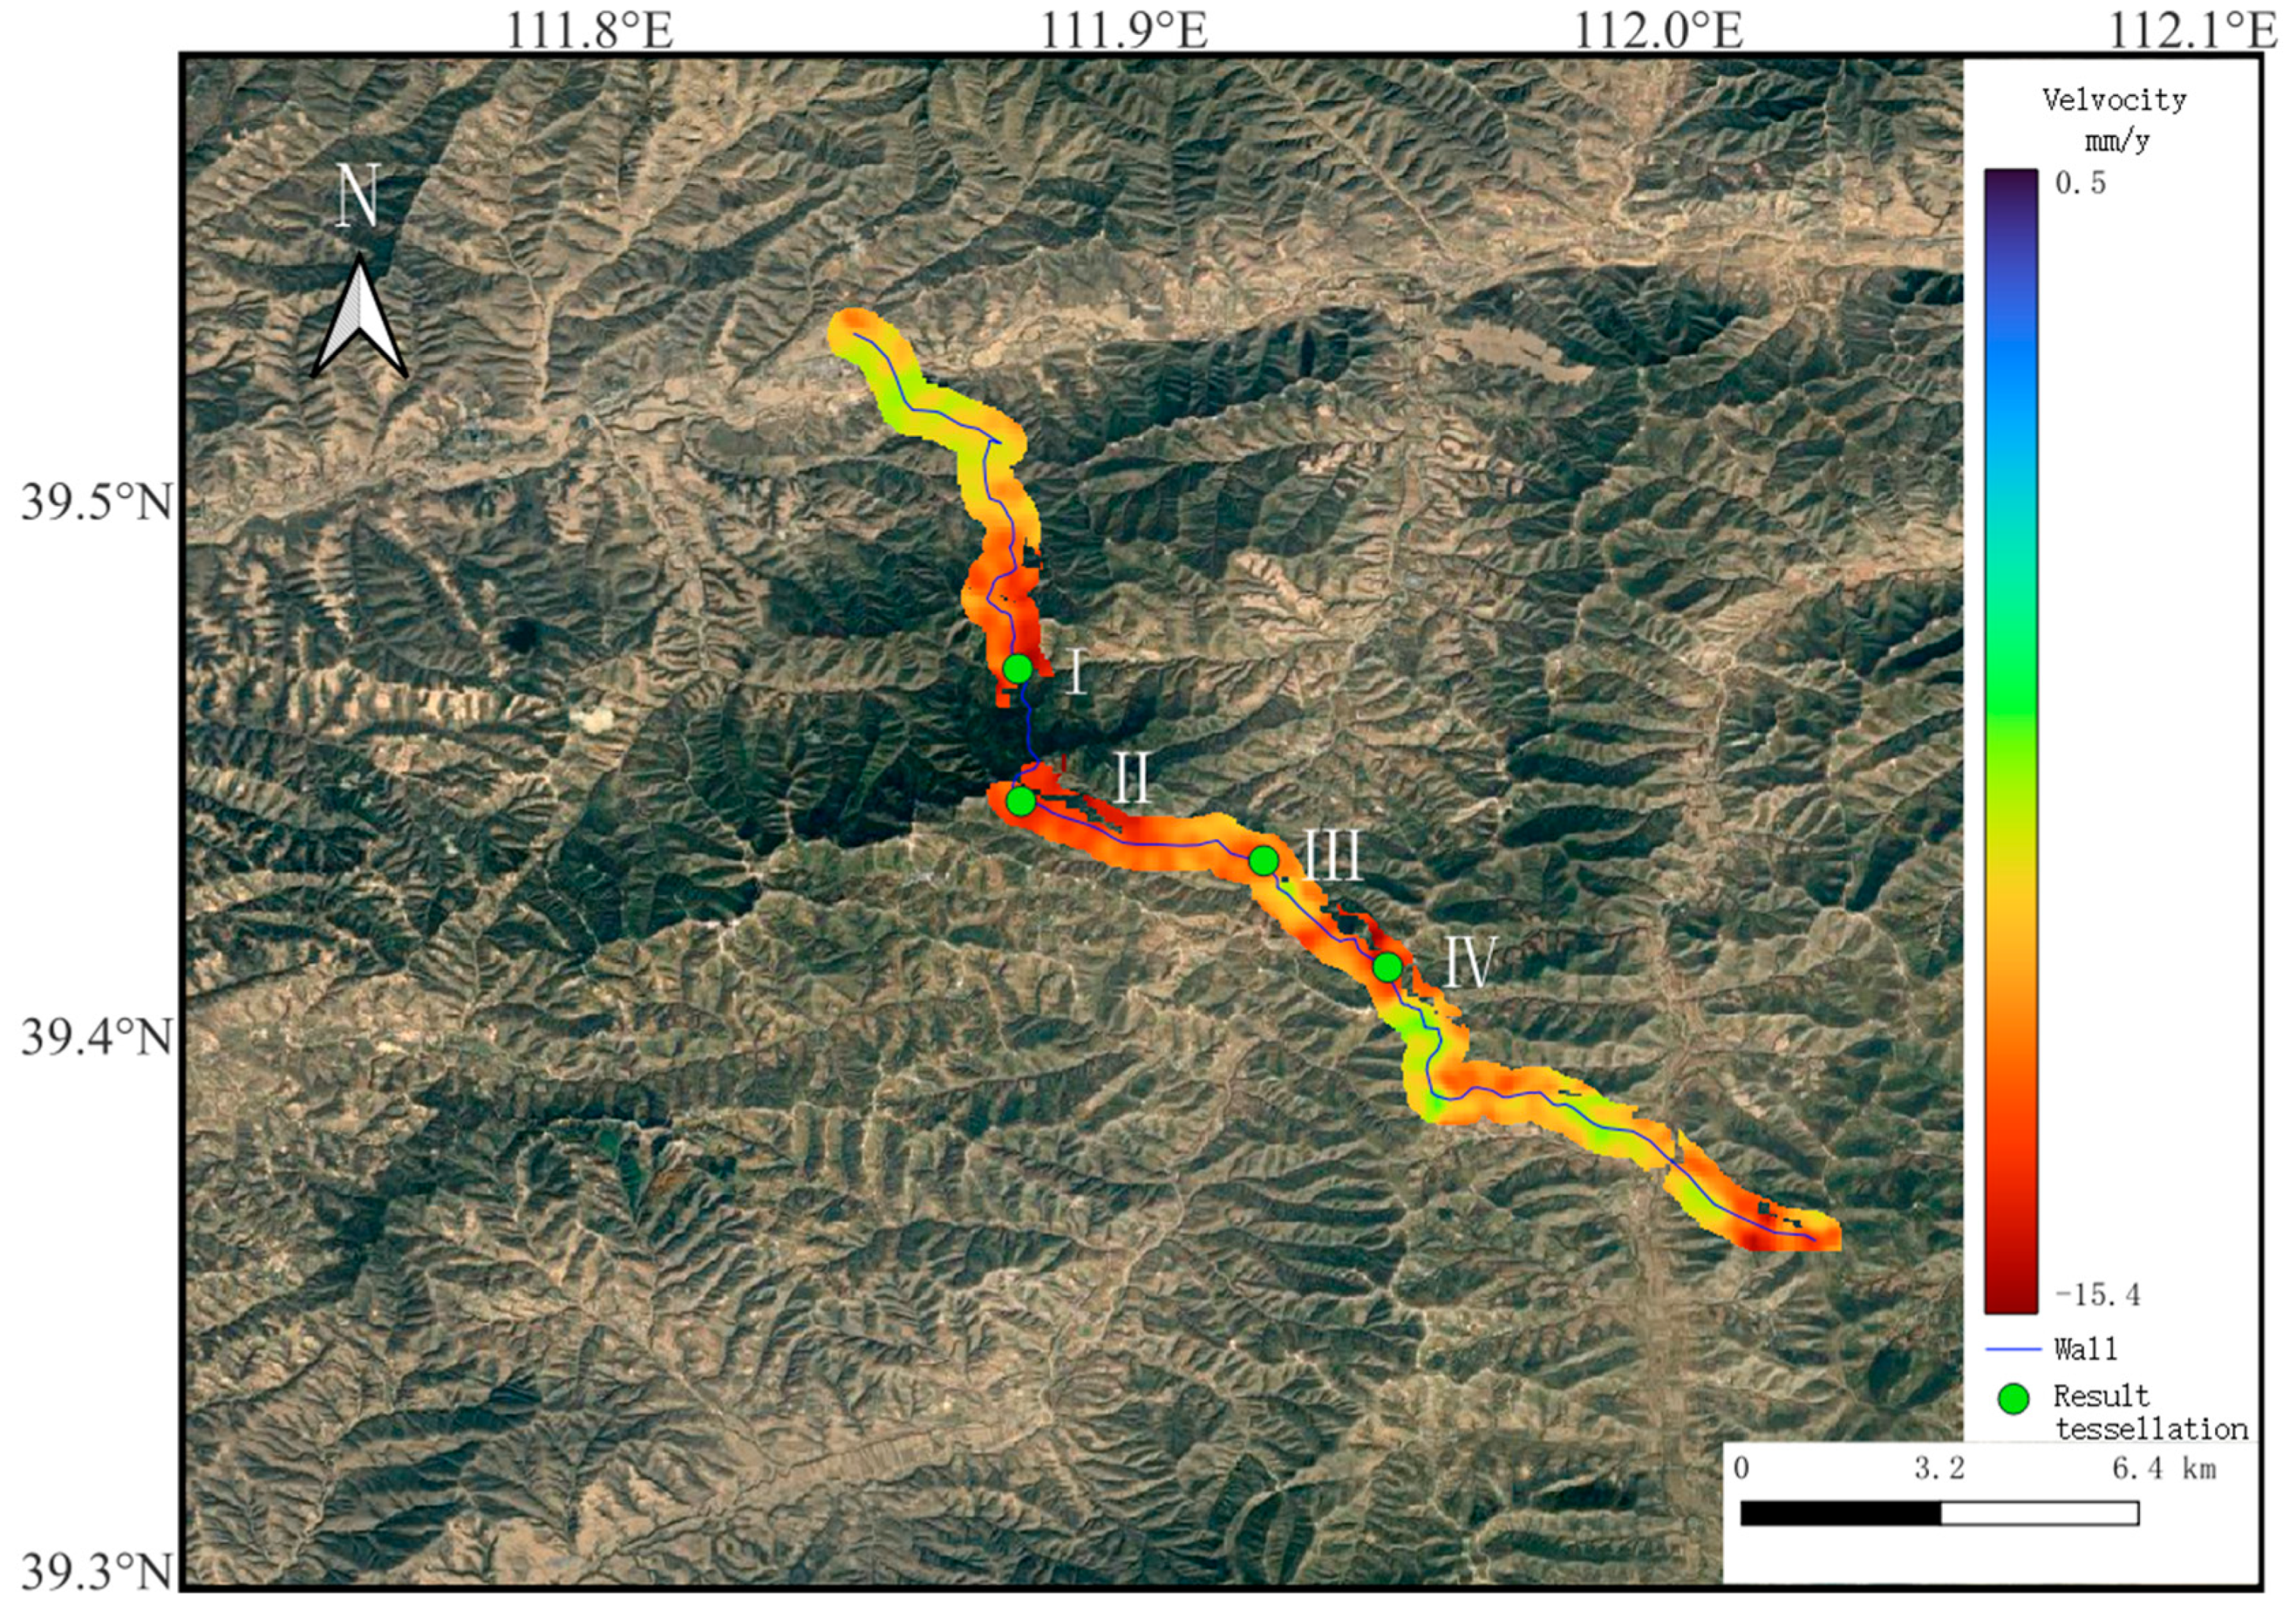
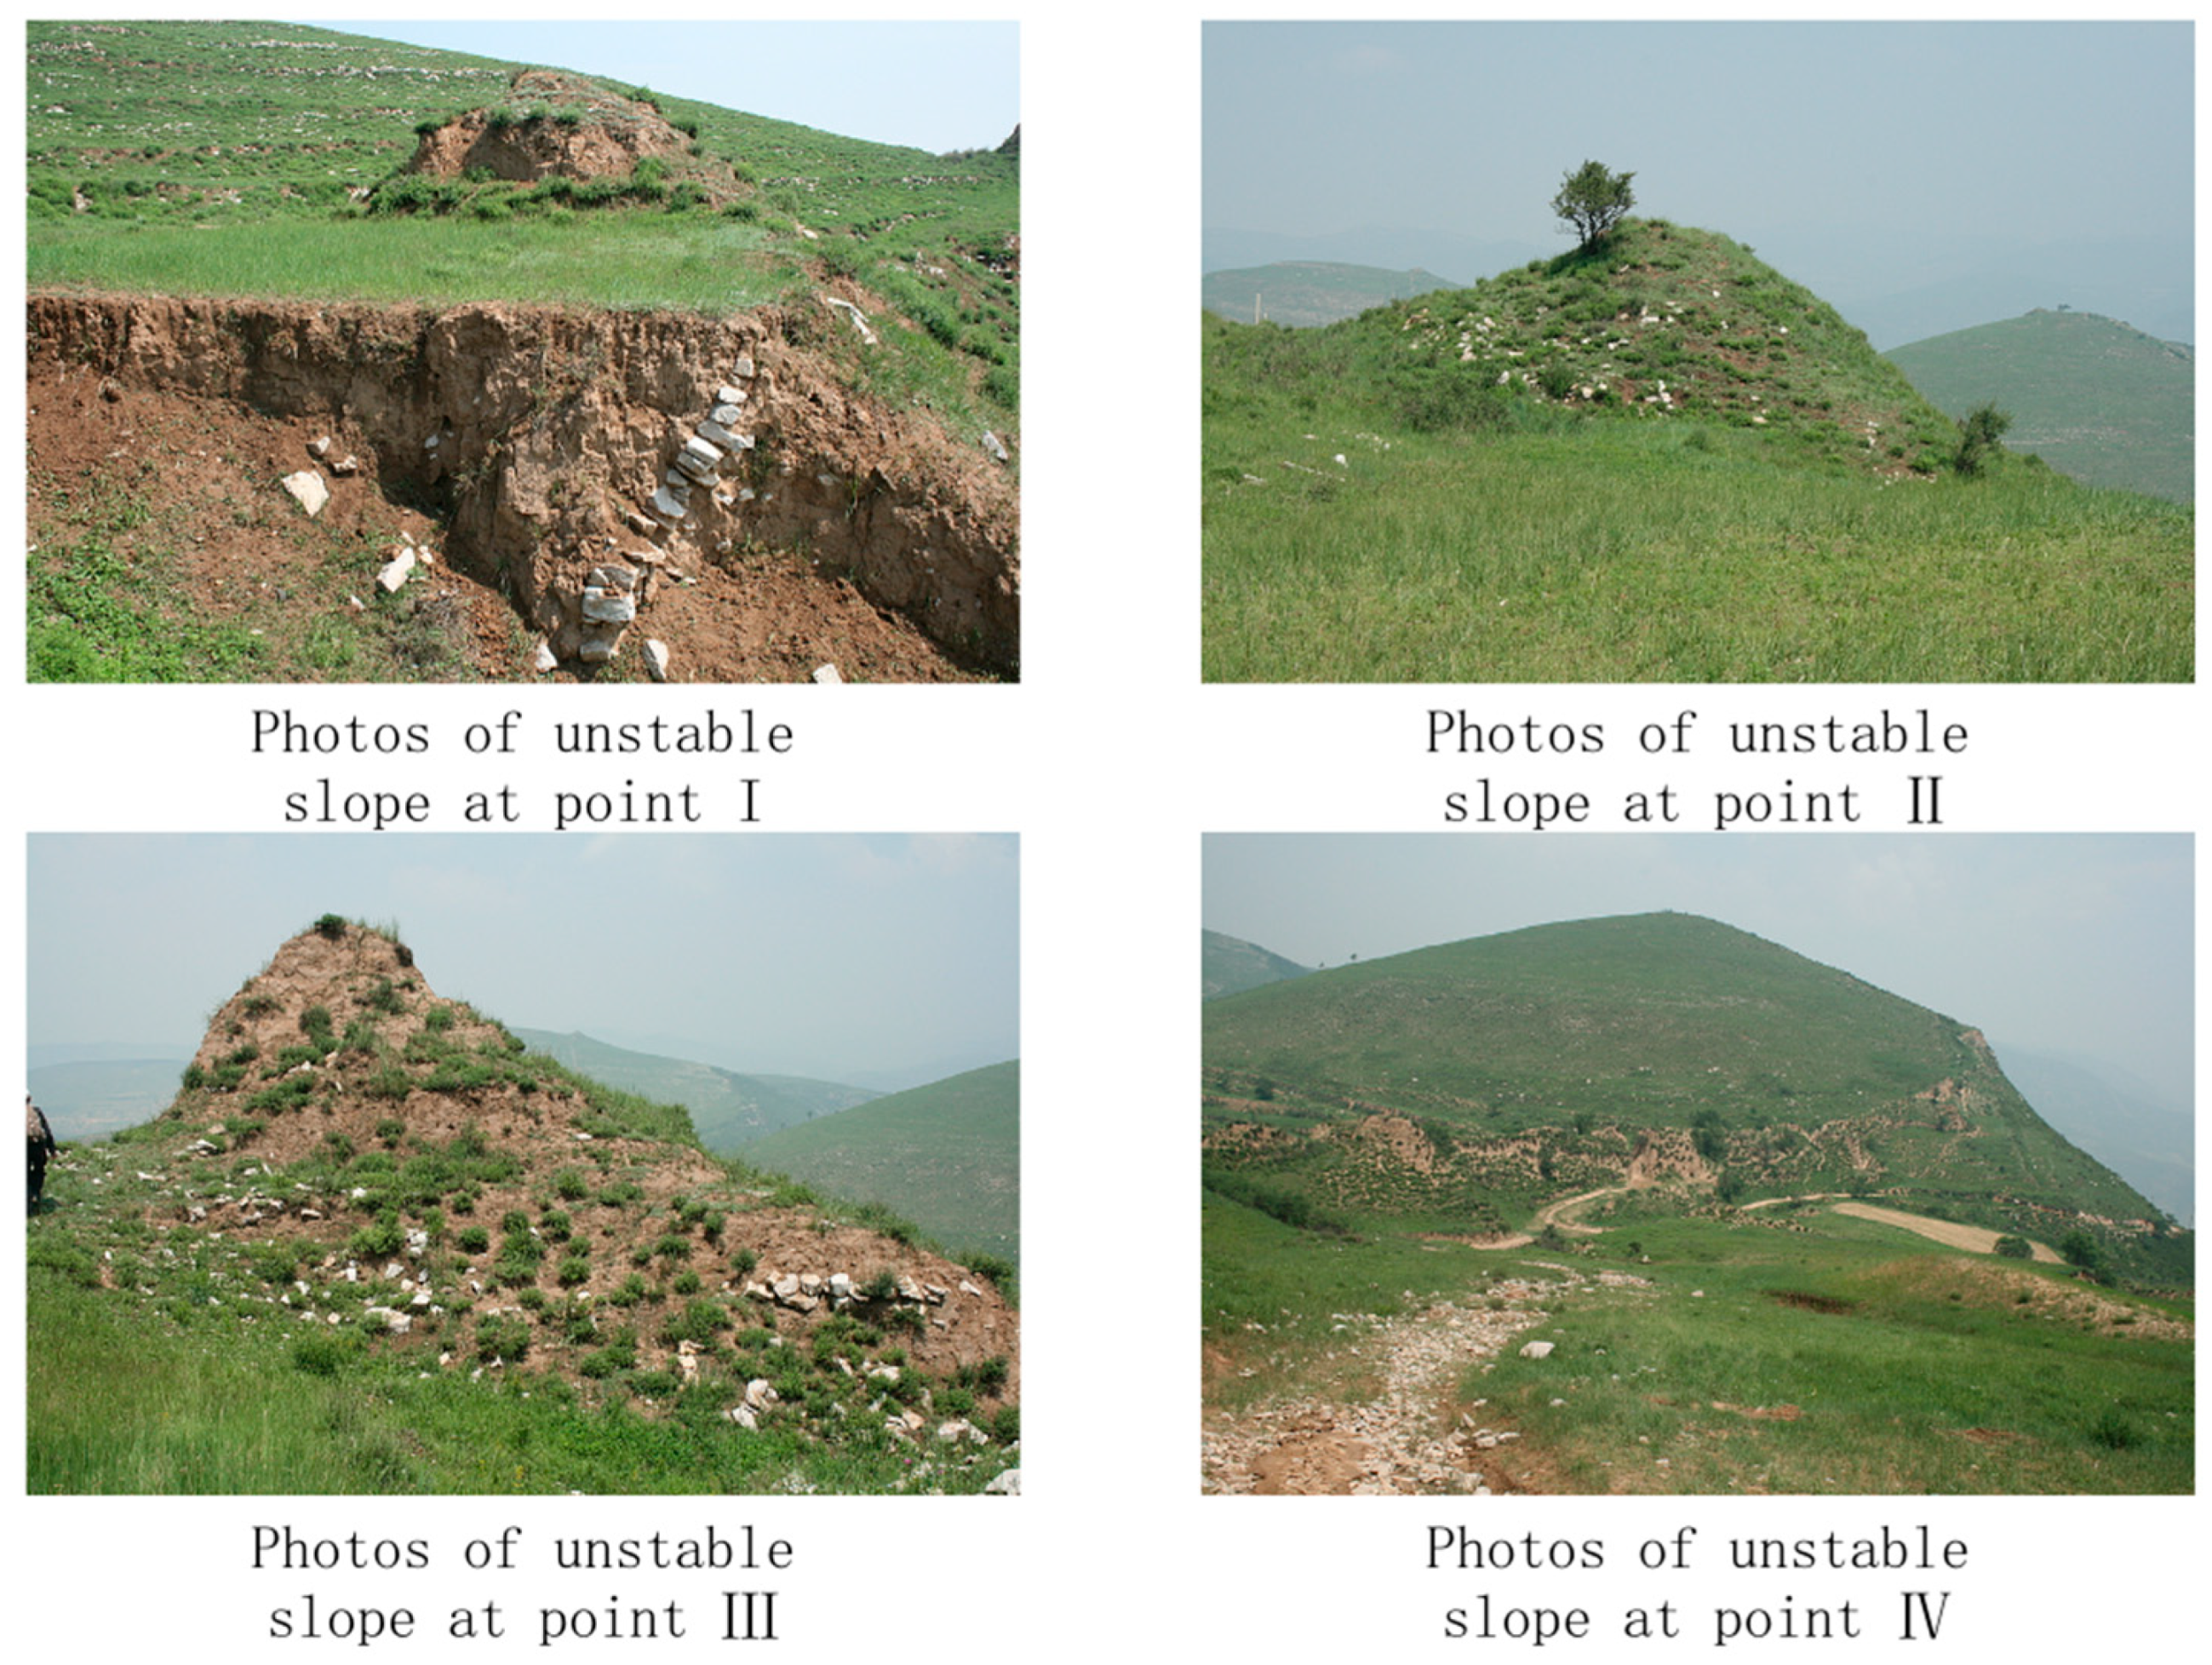
Segment D2 is located in Shuocheng District, Shuozhou City, where the wall is predominantly constructed with sturdy brick and stone materials. The topography of the Great Wall’s location is characterized by mountains and hills, with significant undulations and intense geological activities. The deformation rates of the D2 wall are illustrated in Figure 8. During the construction of Segment D2 of the Great Wall, advantageous topography was utilized along the western side of Shuocheng District, particularly the Daliang Mountains and other ranges, where the wall extended along the ridge lines. Consequently, factors such as unstable slope landslides and earthquakes have emerged as significant causes of deformation in Segment D2. This study investigates areas with significant subsidence rates in Segment D2, based on the distribution of subsidence rates. Figure 9 displays photographs of four locations in Segment D2 with severe deformation, captured by the Shanxi Provincial Cultural Heritage Bureau in 2018. It is evident that all four locations exhibit unstable slope bodies, indicating that deformation and subsidence in Segment D2 are primarily induced by unstable slope landslides and seismic events resulting from crustal movement.

Figure 8.
Deformation rate map of Great Wall Segment D2.
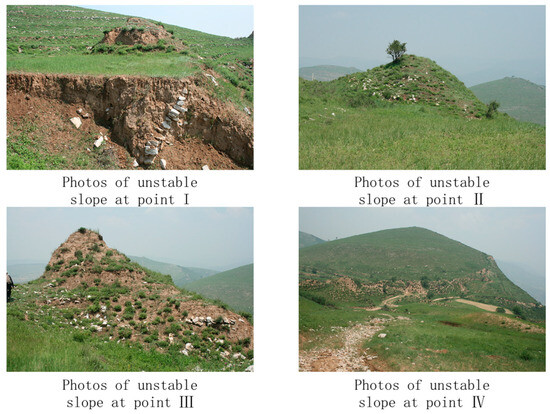
Figure 9.
Photographs of unstable slope sections of Segment D2 of the Great Wall.
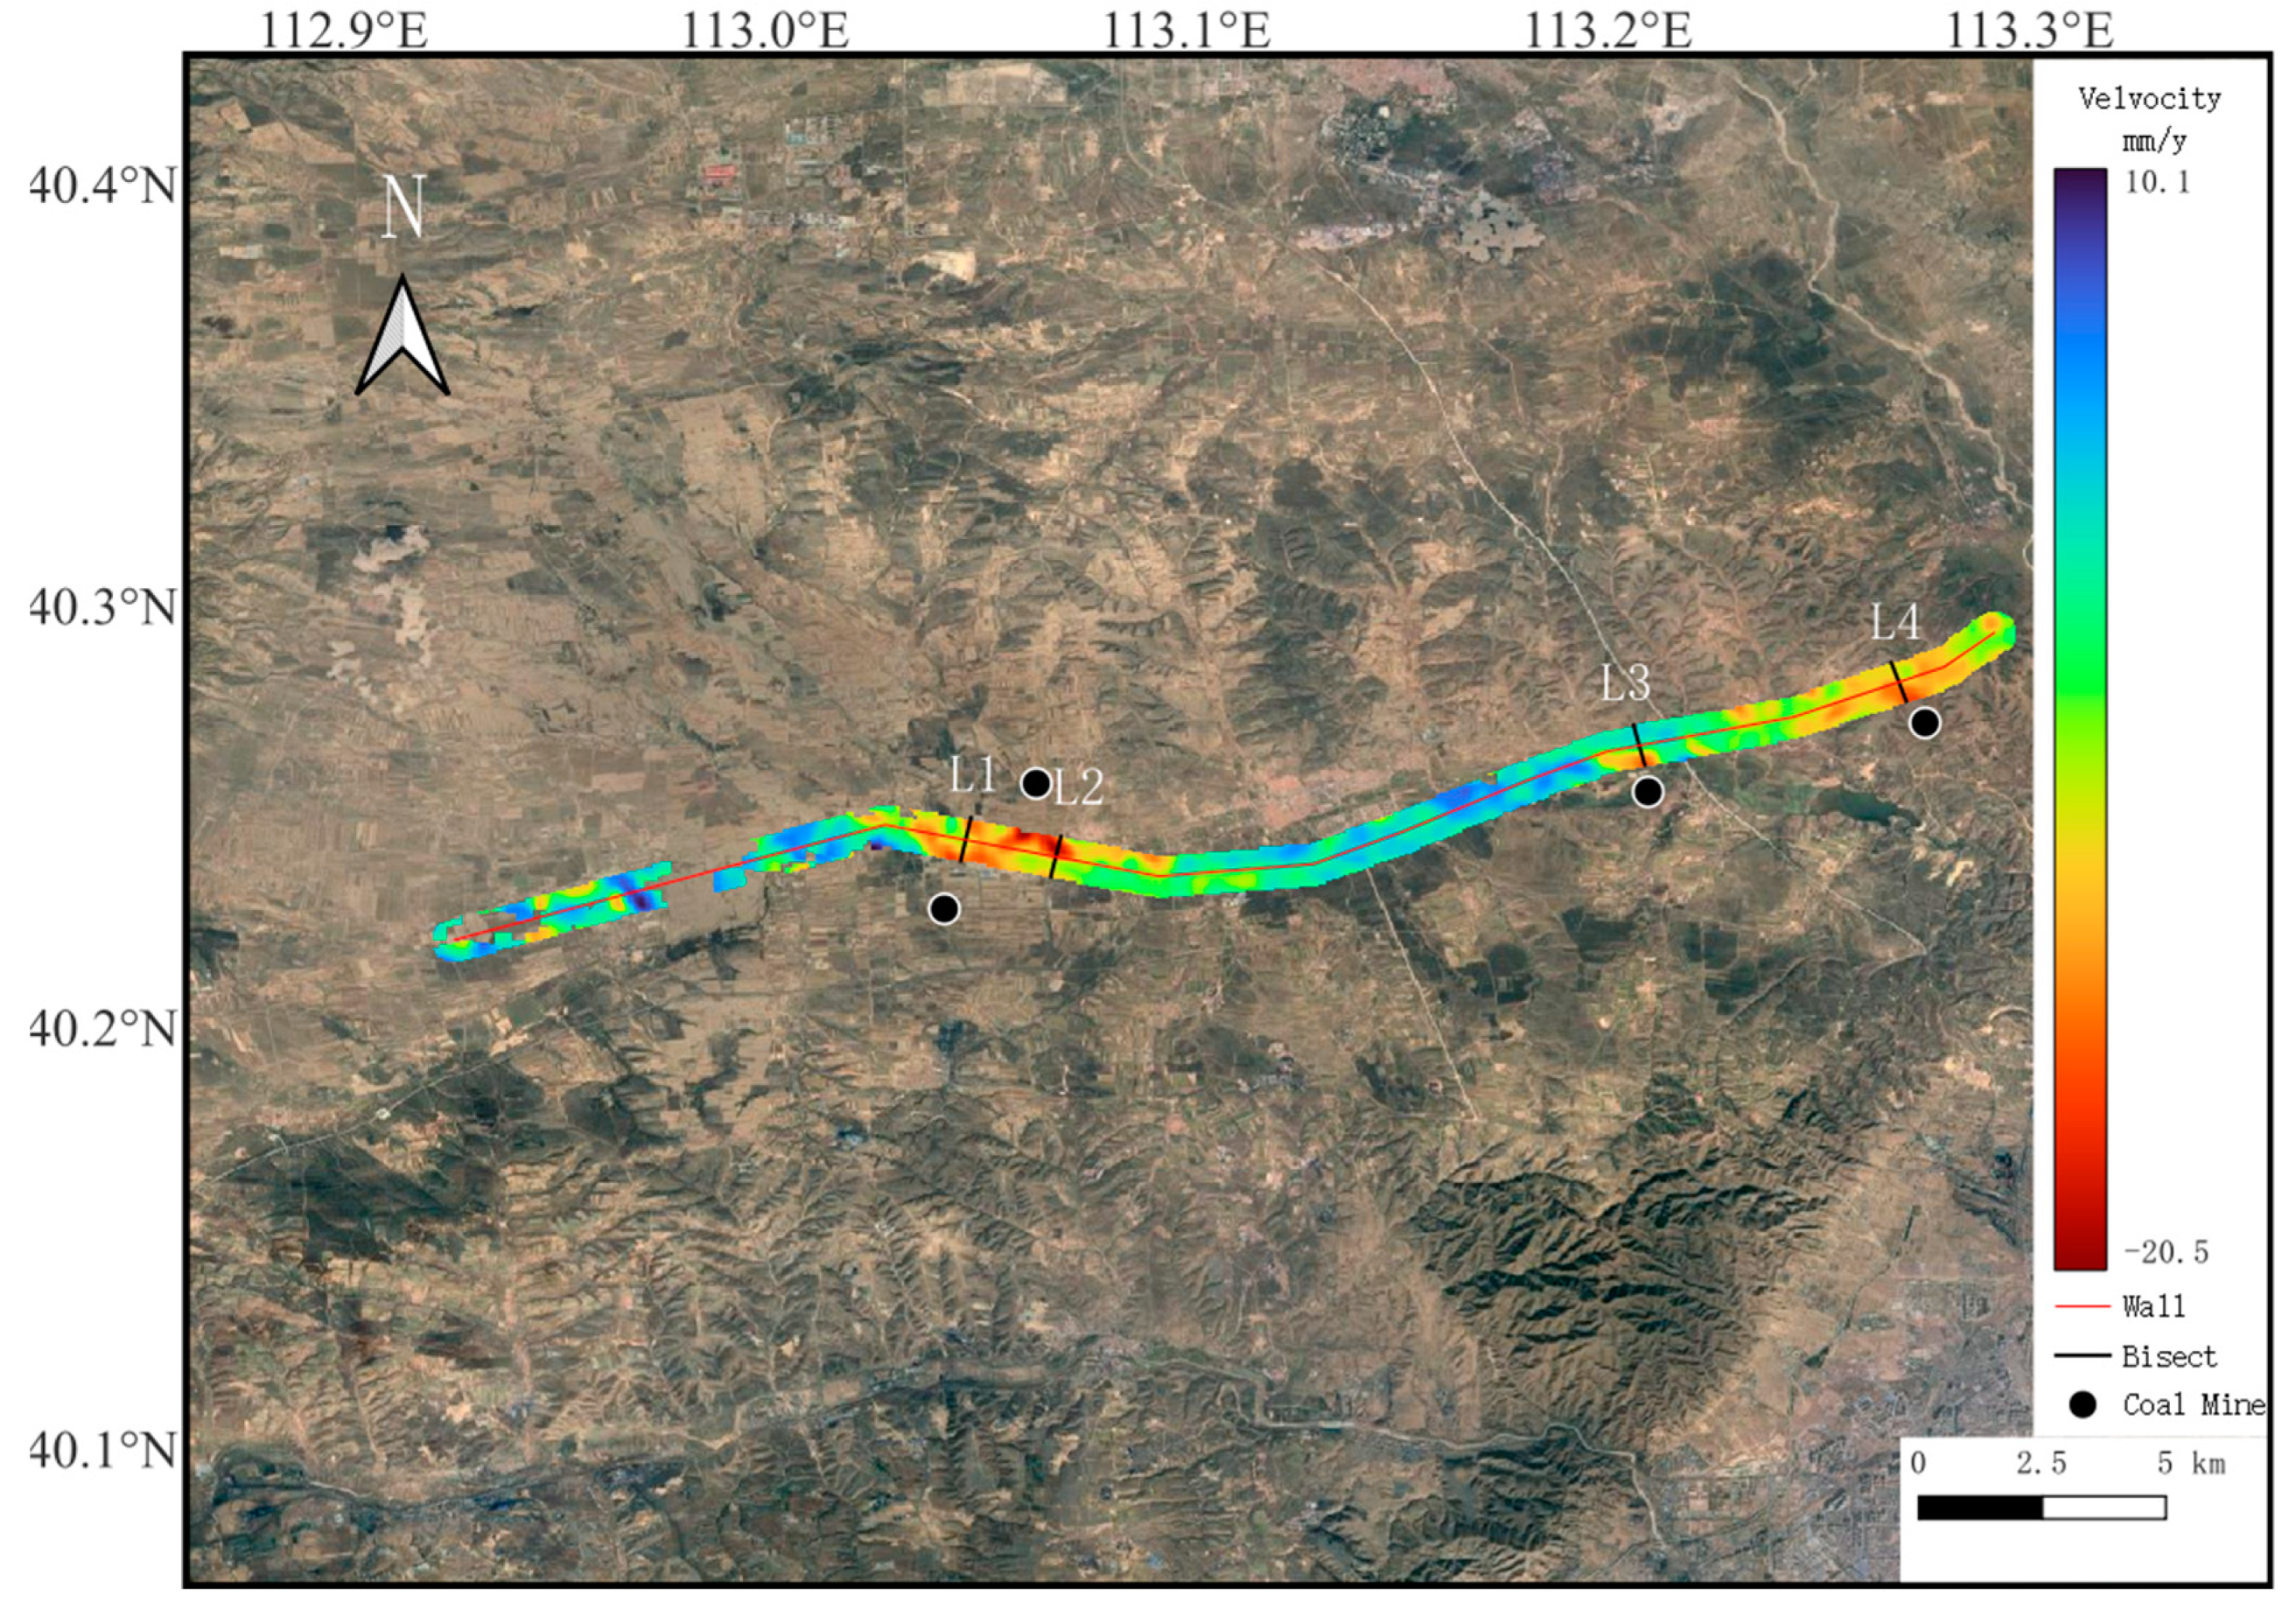
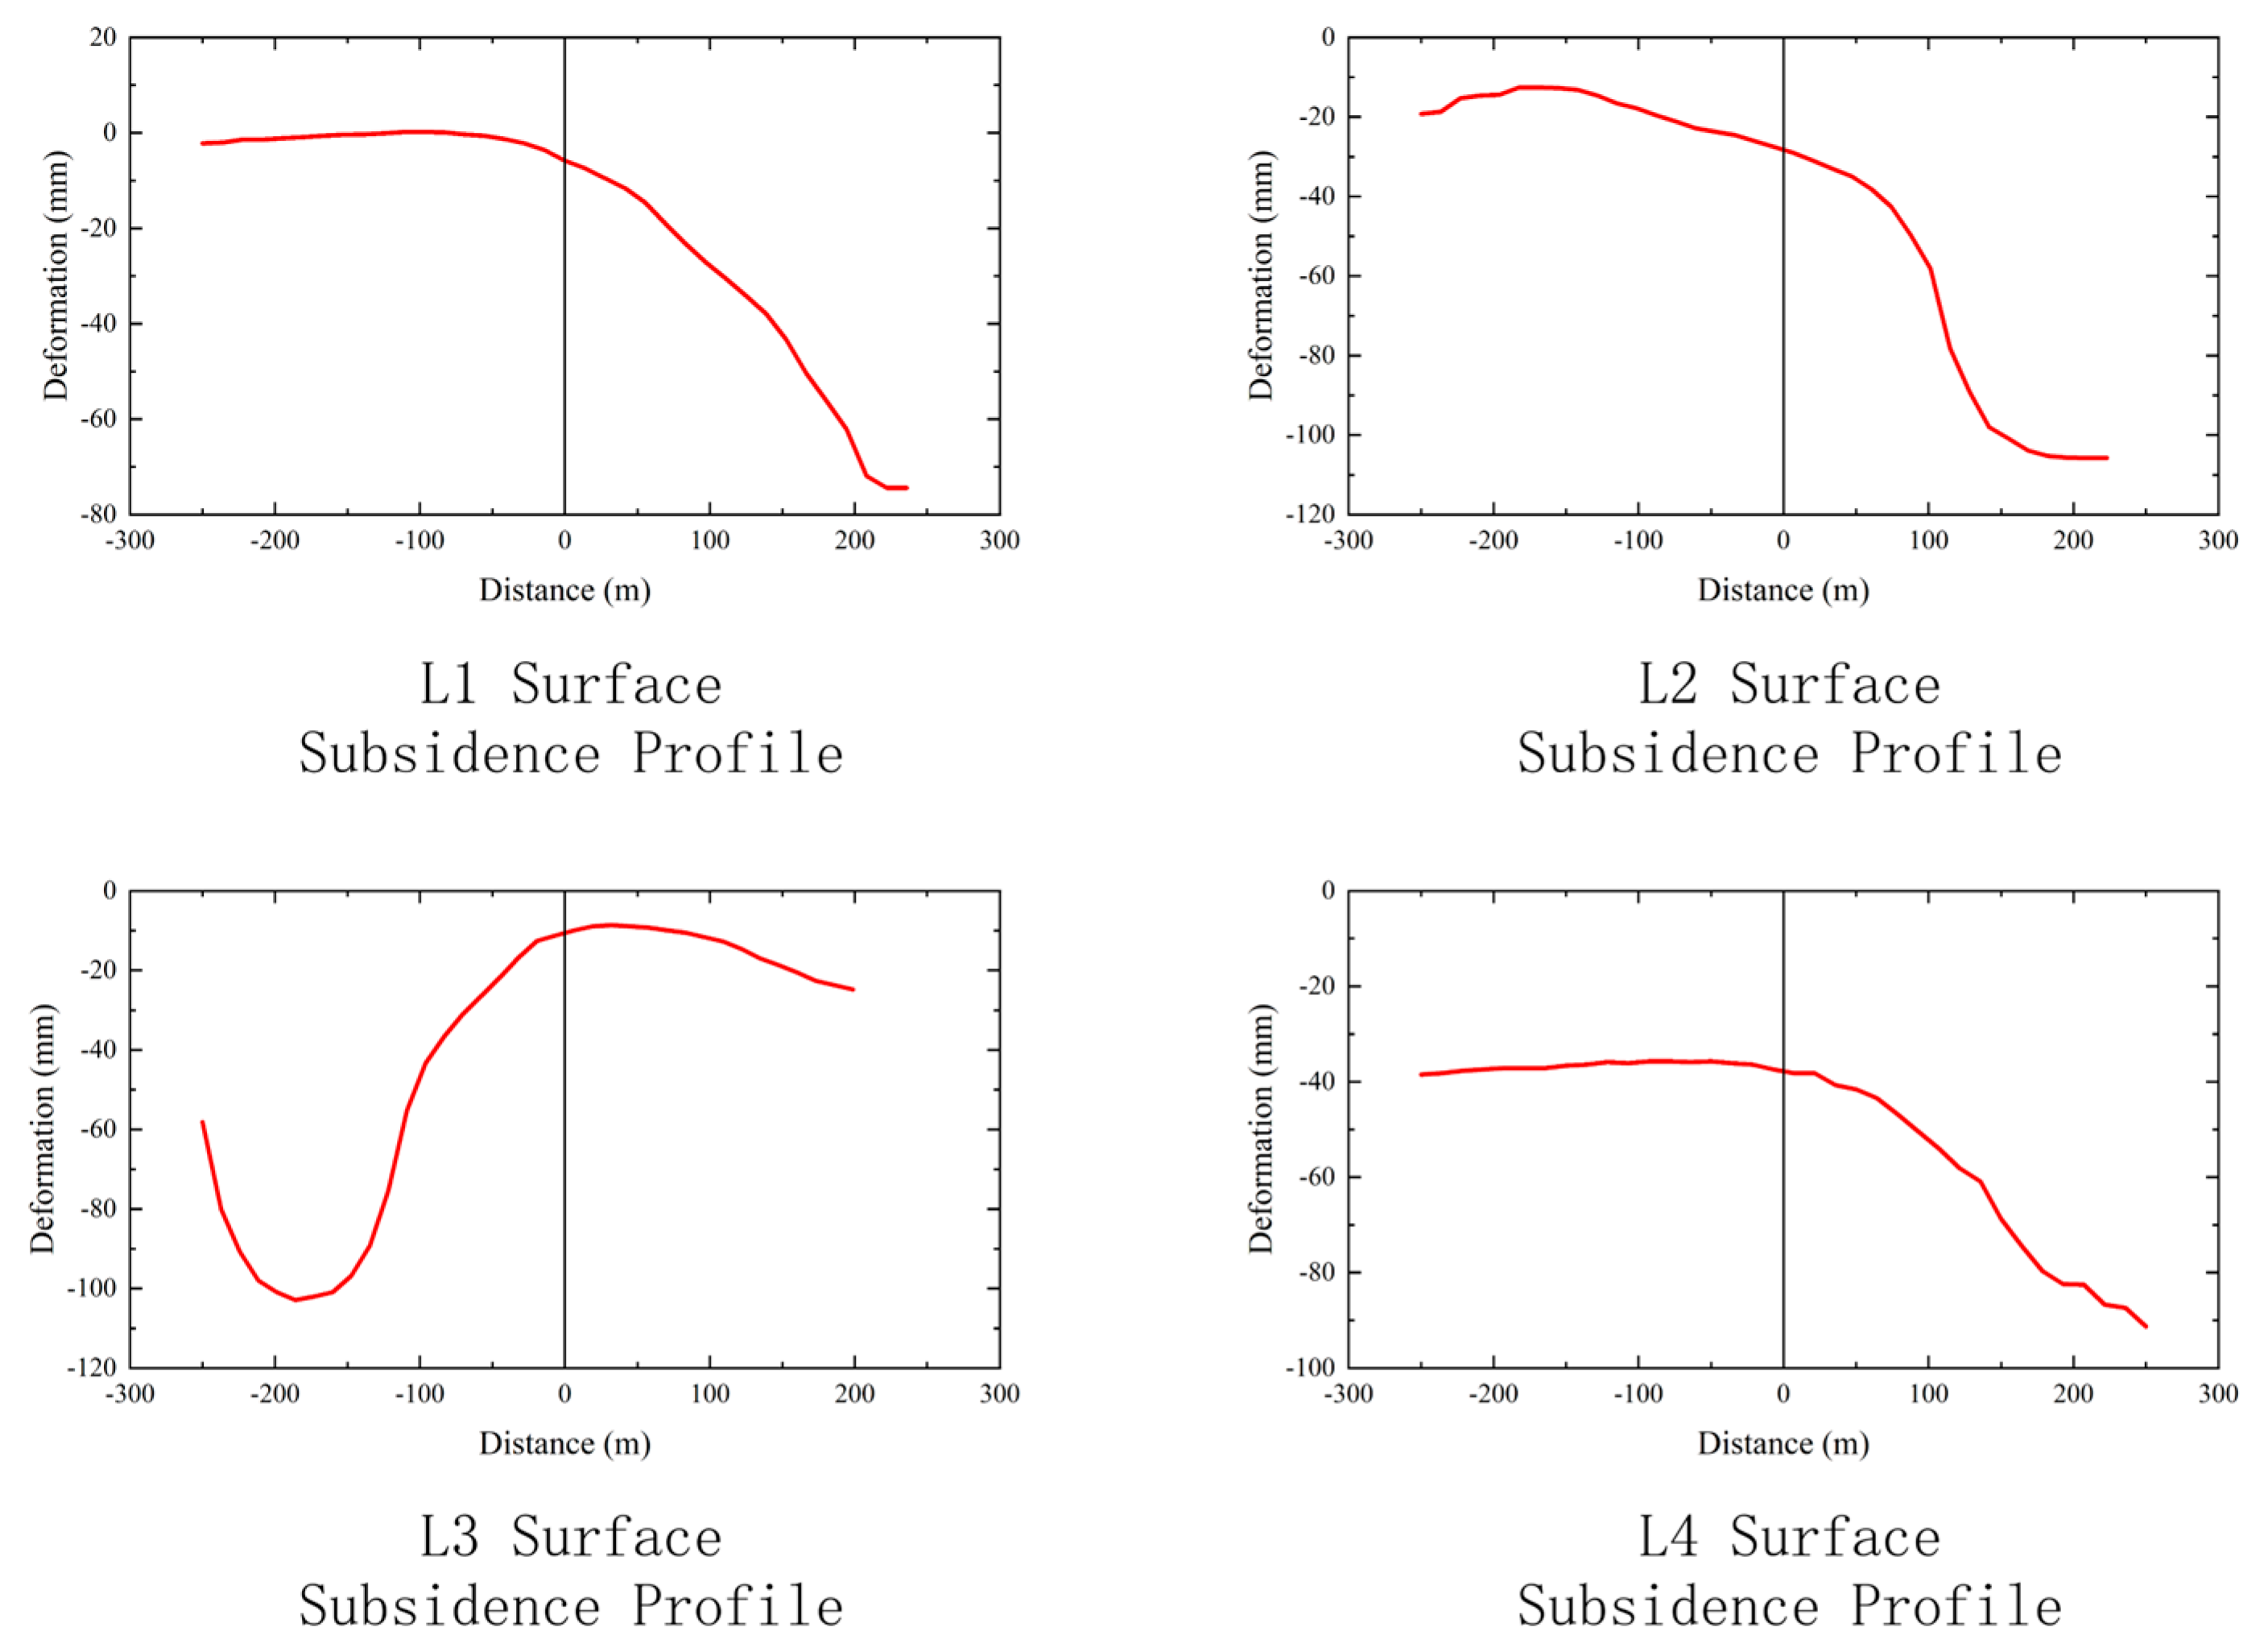
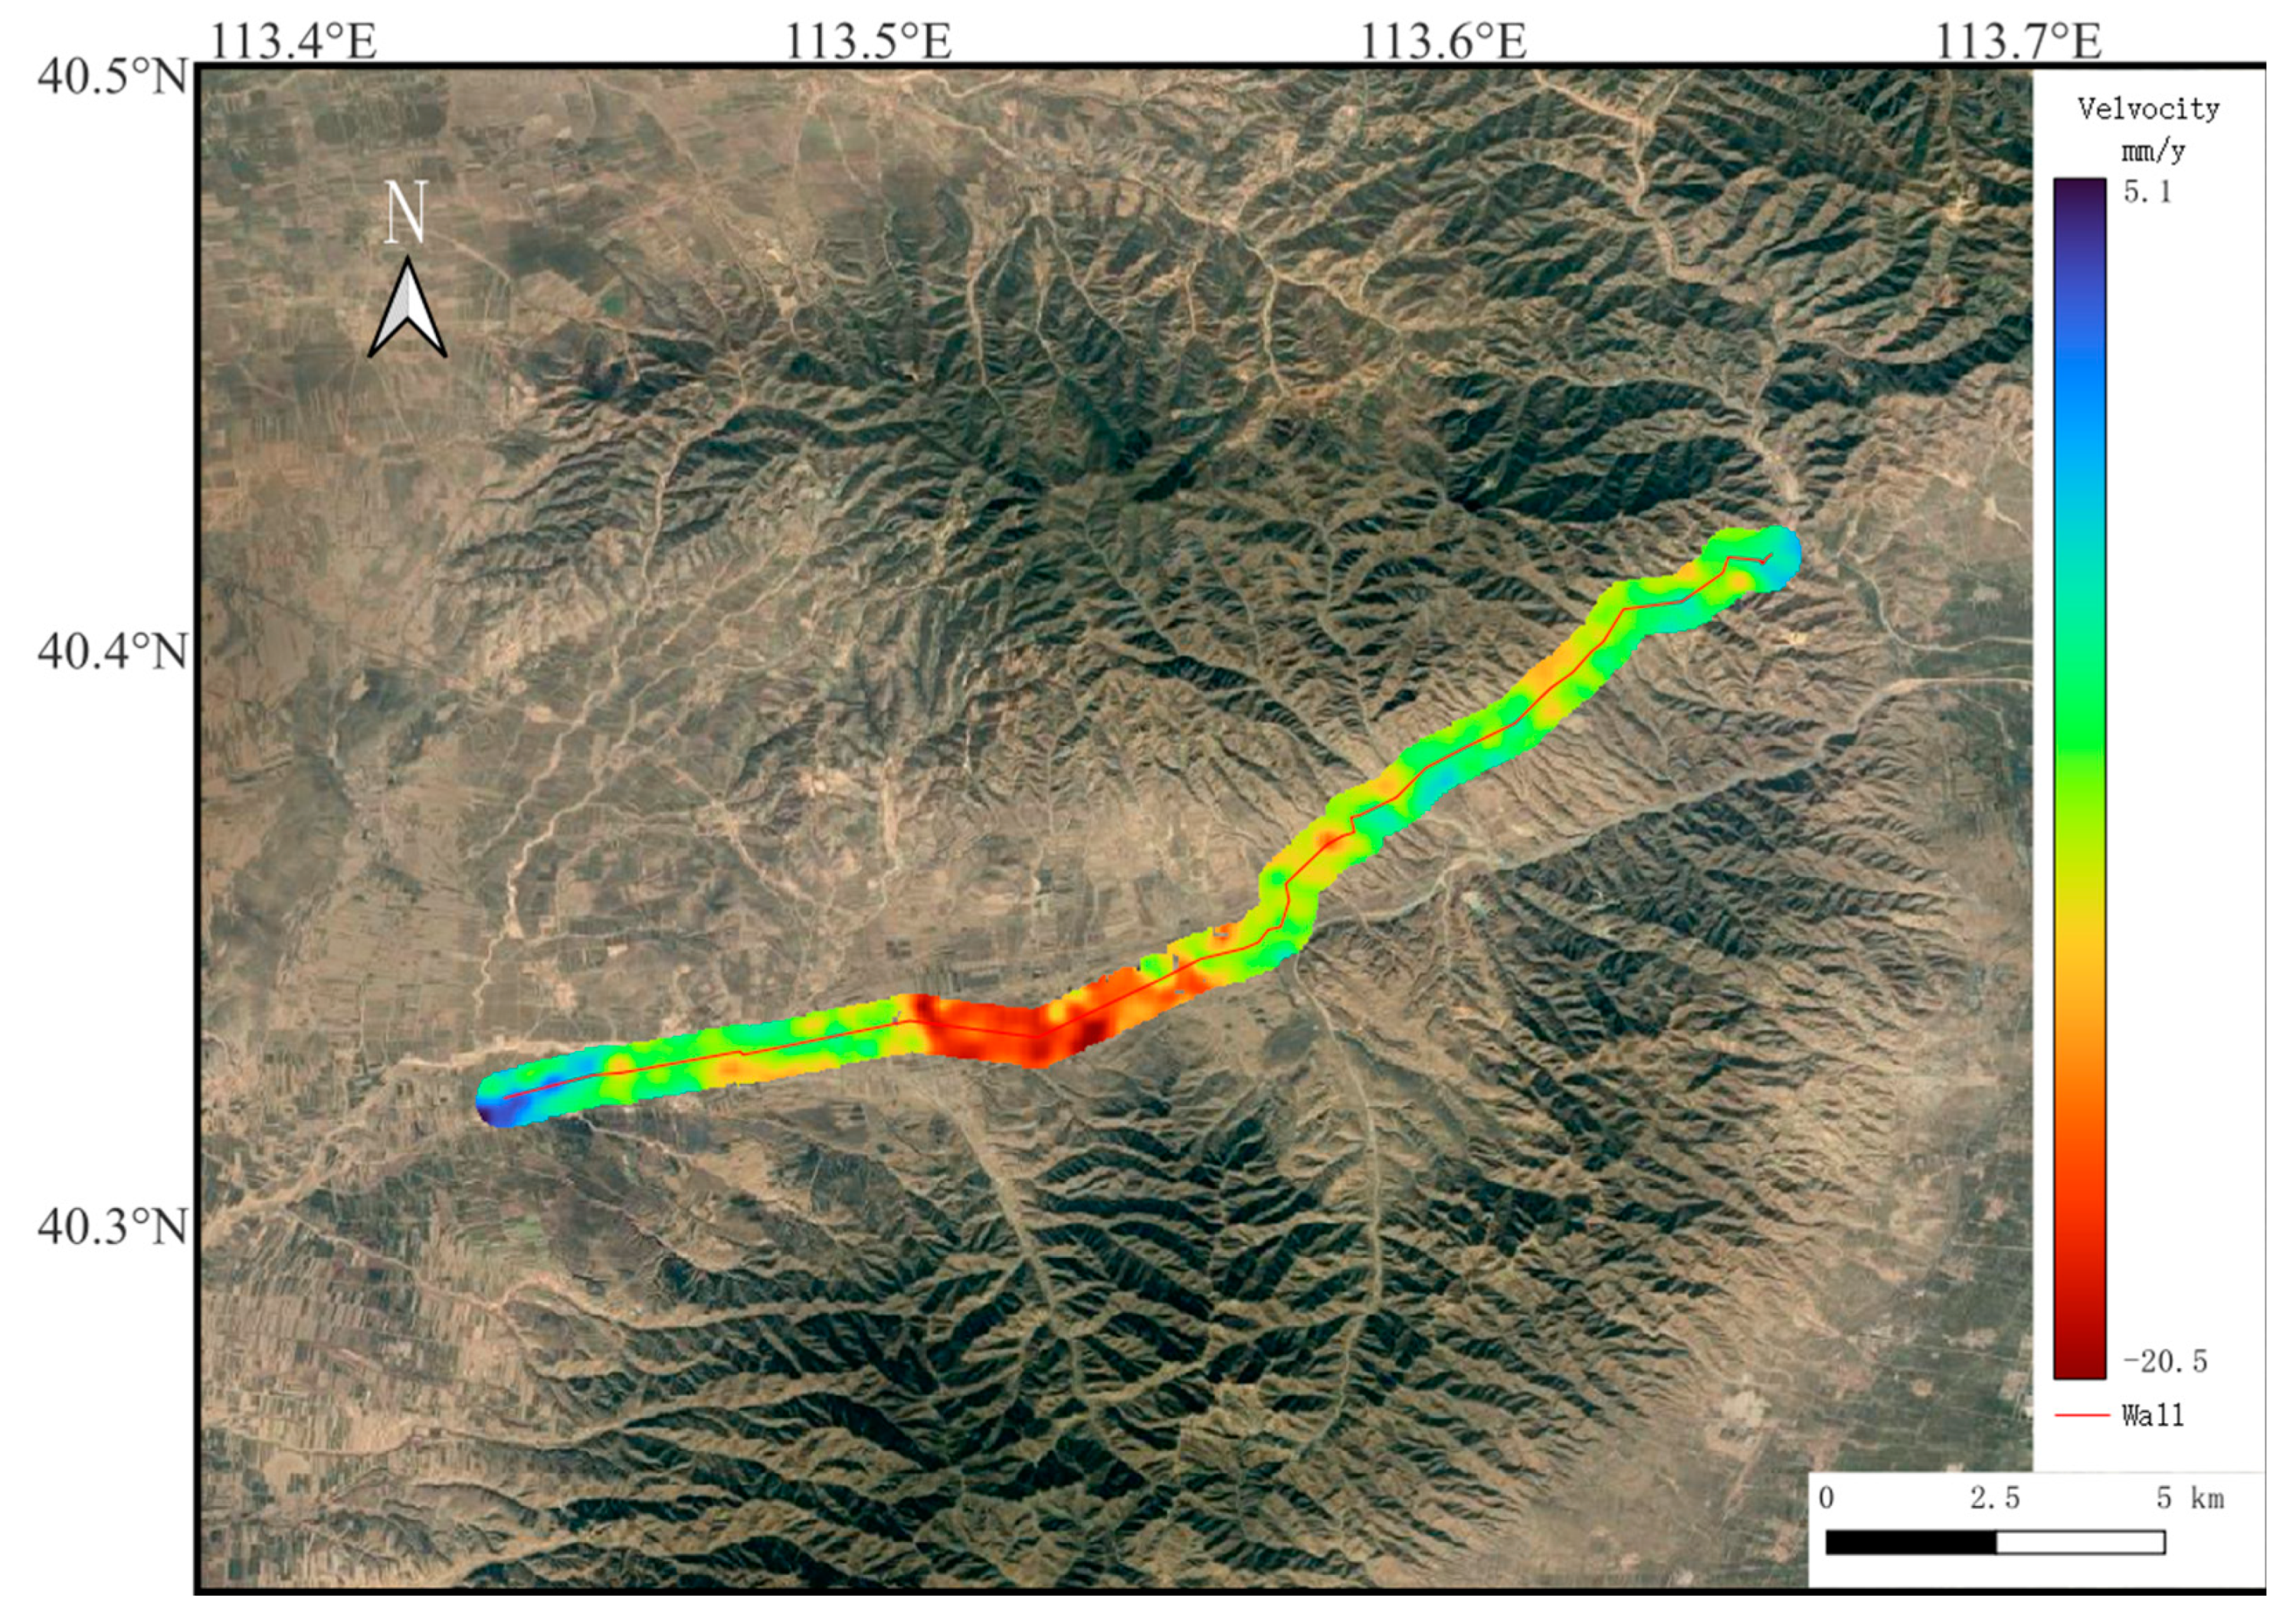
Segment D3 is situated in the northern part of Datong City, covering the counties of Huairen and Youyu. The wall primarily comprises yellow clay, which contains a significant amount of sand, gravel, and crushed stone. The topography of the area is characterized by plains and hills. The deformation rates of the D3 wall are depicted in Figure 10. Shanxi Province boasts abundant coal resources, with over fifty coal mines located in Datong City alone as of December 2022. A profile analysis was conducted on the D3 segment, extracting surface subsidence data from four profiles, namley L1, L2, L3, and L4, as shown in Figure 11. It is evident from Figure 11 that significant subsidence is observed in the southern portions of L1, L2, and L4, as well as in the northern part of L3. By comparing historical satellite images with this subsidence data, it is apparent that all four subsidence locations coincide with active coal mining areas. Based on this observation, it can be inferred that surface deformation resulting from coal mining activities is the primary cause of subsidence and deformation in Segment D3 of the Great Wall.

Figure 10.
Deformation rate map of Great Wall Segment D3.
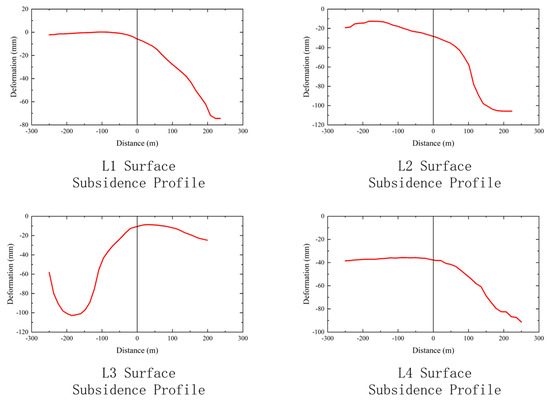
Figure 11.
Cross-sectional profile of surface subsidence for Segment D3 of the Great Wall.
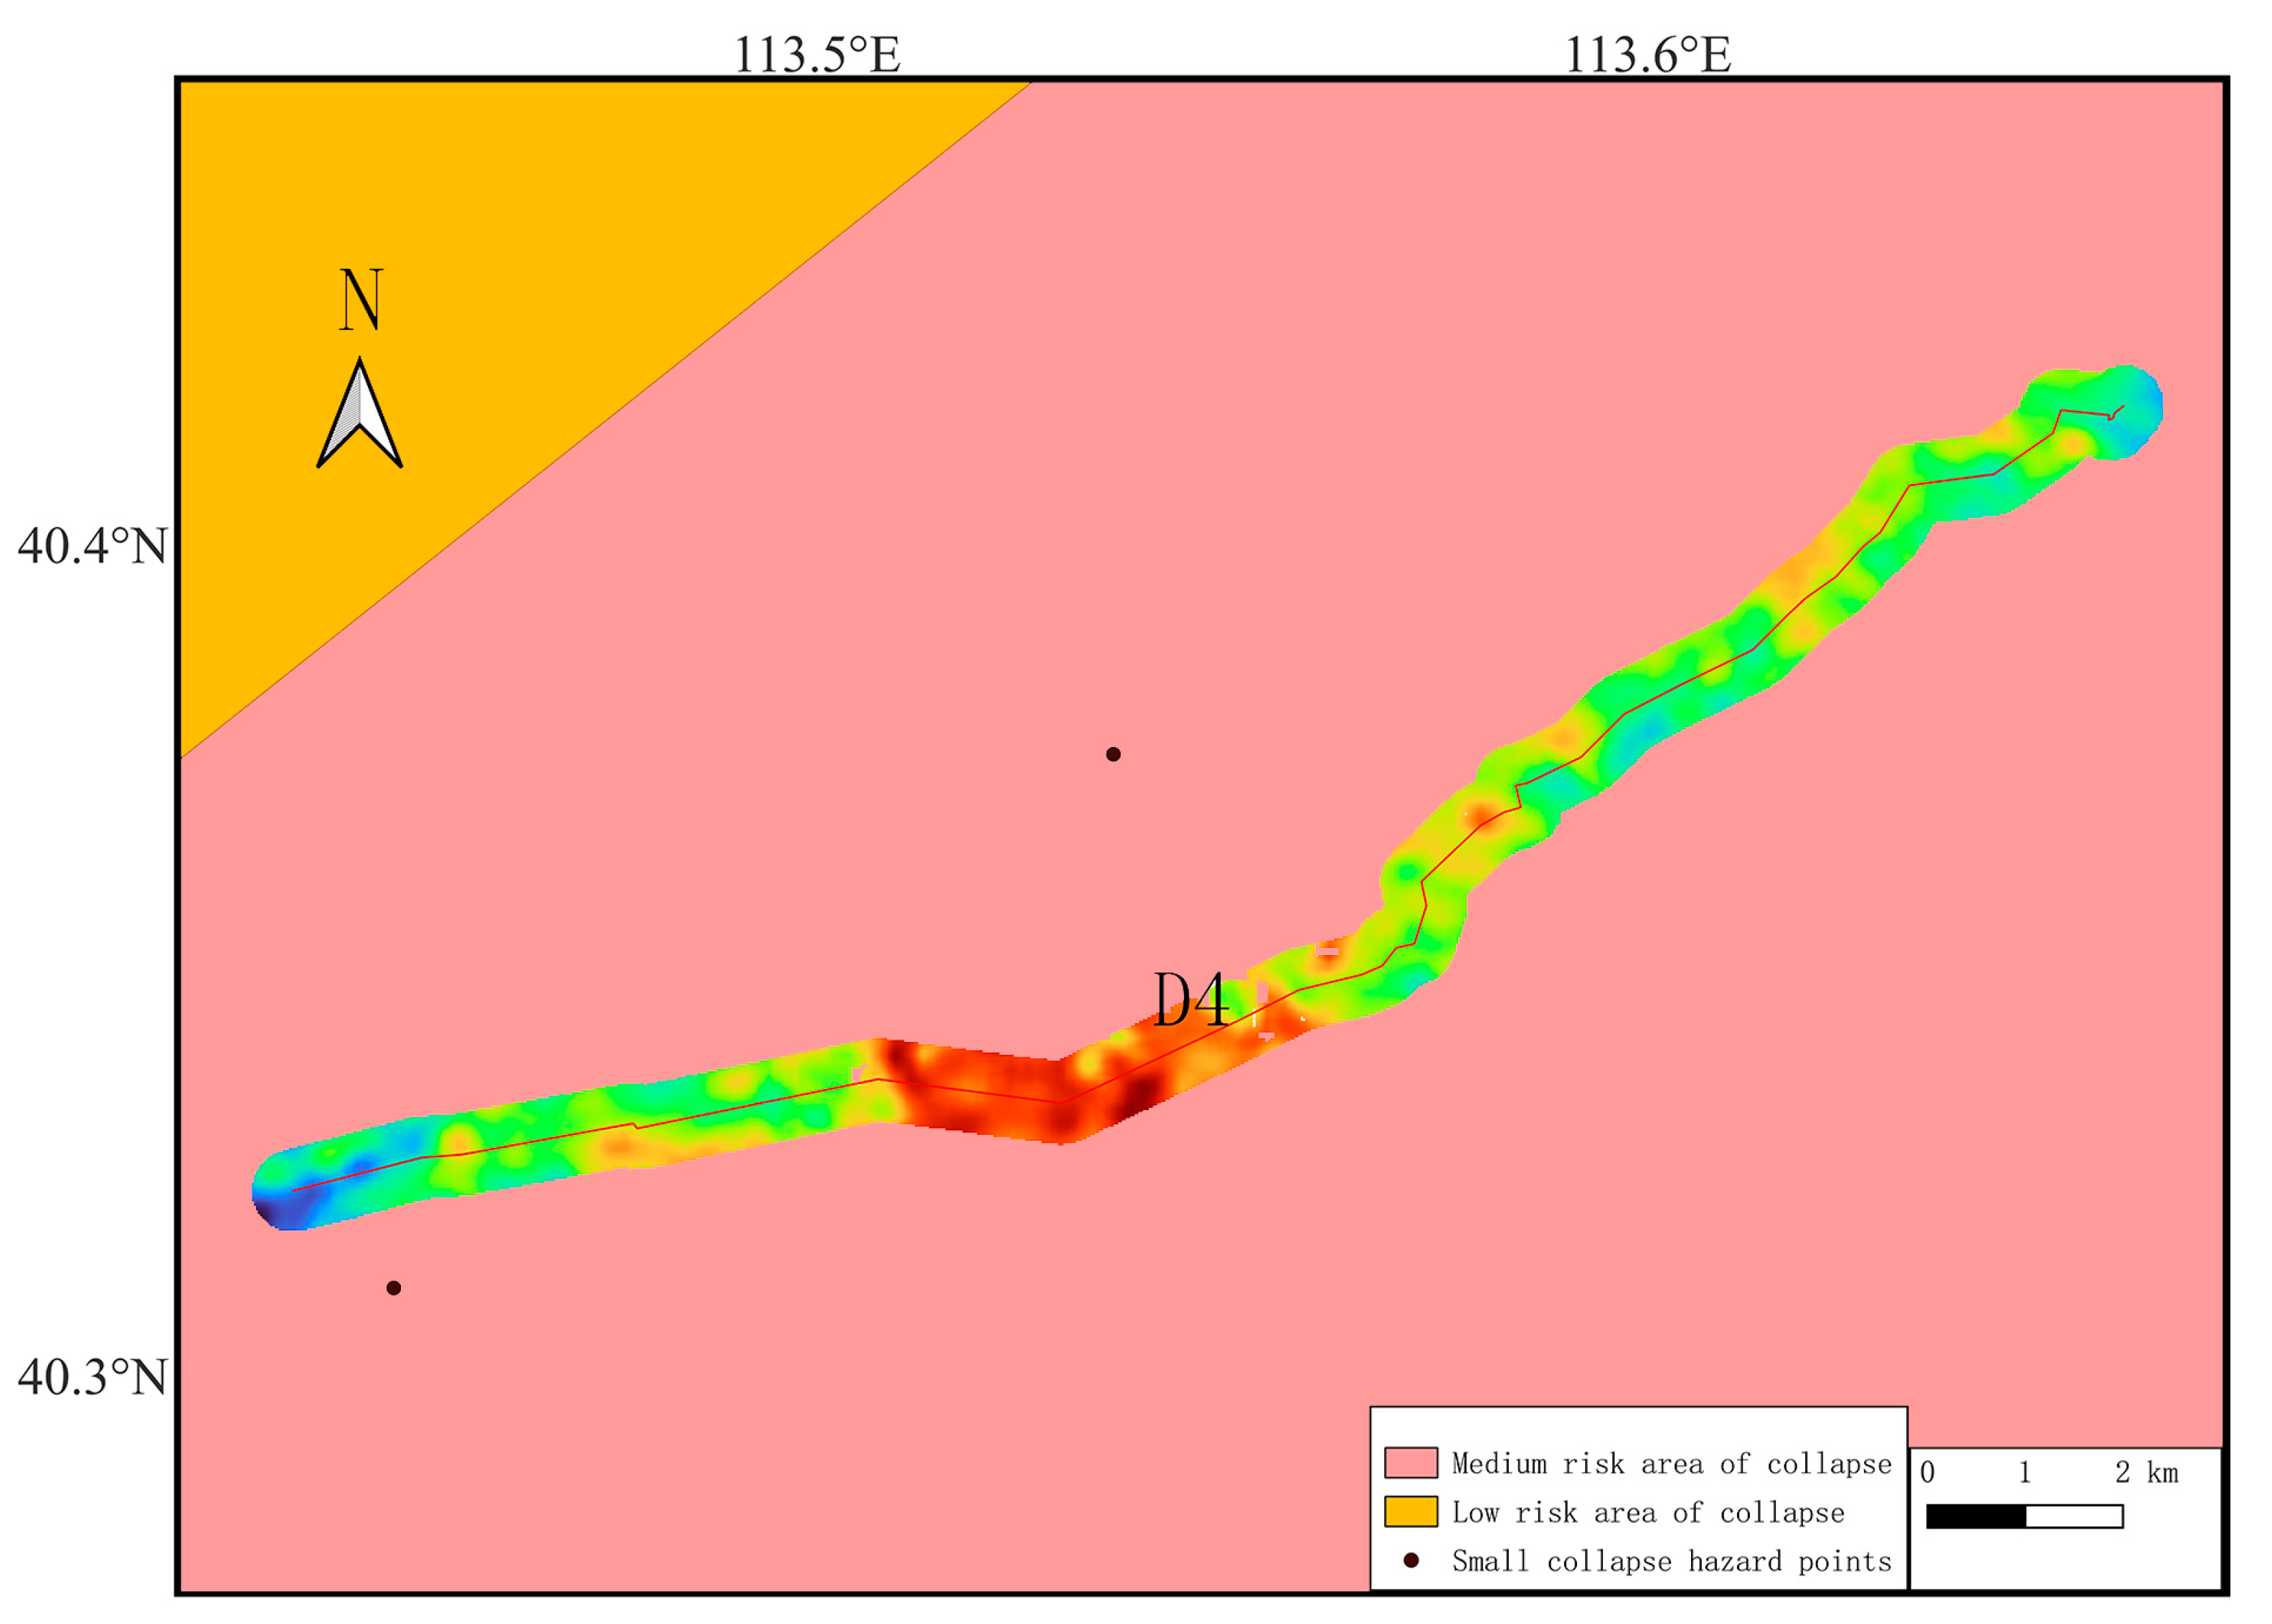
Segment D4 is located in Yanggao County, Datong City. The wall mainly consists of highly pure yellow clay, and the terrain is characterized by alluvial plains and hills. The deformation rates of the D4 wall are shown in Figure 12. The exposed surface rocks in this area are fragmented, and adverse geological phenomena like interlocking and landslides provide ample solid material sources for debris flows [44,45]. Reports from the Yanggao County Land and Resources Survey Bureau indicate that the county frequently experiences natural disasters such as debris flows and earthquakes due to its unique geological and geomorphic conditions. Combining this information with the “Assessment Map of Landslide Risk in China” published by the China Geological Environment Monitoring Institute, it can be inferred that Yanggao County falls into the category of a low-risk landslide disaster and moderate landslide hazard zone, as shown in Figure 13. This suggests that geological hazards resulting from the region’s special geological conditions are the primary factors contributing to the subsidence of Segment D4 of the Great Wall. Additionally, the opening of the Yanggao section of the Great Wall for tourism has introduced human-induced effects on the subsidence and deformation of Segment D4 due to tourism activities and potential anthropogenic damage.

Figure 12.
Deformation rate map of Great Wall Segment D4.
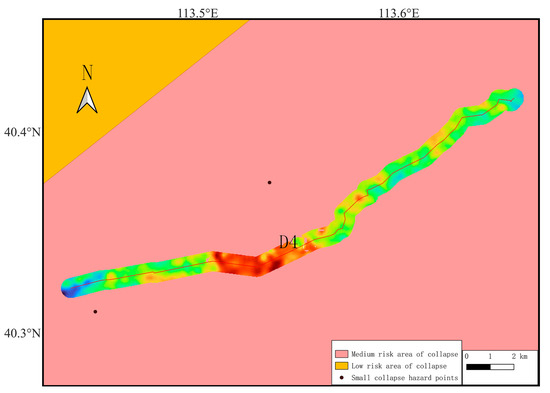
Figure 13.
Geological hazard assessment map of Segment Yanggao of the Great Wall.
4.3. Risk Mapping Analysis along the Great Wall Corridor
A thematic classification was performed using a threshold of 10 mm/year to differentiate between relatively stable and significantly changing surface deformations. Figure 14 presents the resulting thematic classification map of deformation stability along the Great Wall corridor in Shanxi Province. The analysis shows that approximately 210 km of deformation segments with absolute values exceeding the 10 mm/year threshold, accounting for 24.2% of the total observed segment length, are influenced by a combination of factors such as geological hazards, unstable slopes, mining activities, and soil erosion. In contrast, 75.8% of the Great Wall segments exhibit lower subsidence rates, indicating relative surface stability. The thematic classification map of deformation stability along the Great Wall corridor in Shanxi Province provides guidance and data support for identifying potential damage to the corridor landscapes and wall remnants of the Great Wall. This information is valuable for the comprehensive planning and the conservation of large-scale linear heritage sites similar to the Great Wall.
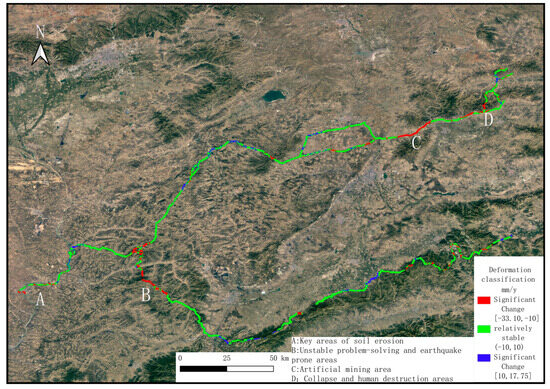
Figure 14.
Thematic classification map of deformation stability along the Great Wall Corridor in Shanxi Province.
5. Conclusions
This study conducted exploratory research on monitoring the surface deformation of the Great Wall corridor in Shanxi Province, China, from March 2017 to January 2022. The study employed 161 scenes of ascending orbit images from the Sentinel-1A satellite and utilized the SBAS-InSAR technique. GACOS atmospheric phase correction and Goldstein filtering were also applied to derive the annual deformation velocity field of the 896.53 km Great Wall corridor in Shanxi Province. The findings of this research indicate that over the five-year period from 2017 to 2022, various sections of the Great Wall in Shanxi Province experienced significant deformation attributed to both natural and anthropogenic factors. The analysis of the stability classification map of the Great Wall corridor in Shanxi Province revealed that 75.8% of the corridor exhibited relative stability, while 24.2% showed notable deformation (with an absolute annual deformation rate exceeding 10 mm/y). These findings provide quantitative monitoring data and present a novel monitoring approach for identifying deformation hazards, locating target areas, and implementing corrective repairs to preserve the architectural heritage of the Great Wall in Shanxi Province. Furthermore, the research results demonstrate the effectiveness of the SBAS-InSAR technique based on coherent points for monitoring the surface deformation of large-scale linear cultural heritage. This approach can be extended to the macro-monitoring and dynamic assessment of other large-scale linear cultural heritage sites worldwide, such as the Roman Wall, city walls, and canal embankments.
Author Contributions
Conceptualization, Q.L. and K.C.; methodology, Q.L. and X.W.; software, Q.L., X.W. and K.C.; validation, Q.L., X.W., K.C., J.Z. and Z.Y.; formal analysis, Q.L., X.W. and K.C.; investigation, Q.L., X.W. and K.C.; resources, Q.L.; data curation, Q.L.; writing—original draft preparation, Q.L., X.W. and K.C.; writing—review and editing, Q.L., X.W. and K.C.; visualization, X.W.; supervision, Q.L., X.W. and K.C.; project administration, Q.L.; funding acquisition, K.C. All authors have read and agreed to the published version of the manuscript.
Funding
This research was funded by Natural Science Foundation of Shandong Province, grant numbers ZR2021MD096 and ZR2021MD082.
Institutional Review Board Statement
Not applicable.
Informed Consent Statement
Not applicable.
Data Availability Statement
The data used to support the findings of this study are available from the corresponding author upon request.
Conflicts of Interest
The authors declare no conflict of interest.
References
- Lombardo, L.; Tanyas, H.; Nicu, I.C. Spatial modeling of multi-hazard threat to cultural heritage sites. Eng. Geol. 2020, 277, 105776. [Google Scholar] [CrossRef]
- Xu, H.; Chen, F.; Zhou, W. A comparative case study of MTInSAR approaches for deformation monitoring of the cultural landscape of the Shanhaiguan section of the Great Wall. Herit. Sci. 2021, 9, 71. [Google Scholar] [CrossRef]
- Bosiljkov, V.; Uranjek, M.; Arni, R.; Bokan-Bosiljkov, V. An integrated diagnostic approach for the assessment of historic masonry structures. J. Cult. Herit. 2010, 11, 239–249. [Google Scholar] [CrossRef]
- Pasek, J.; Gaya, H.P. Numerical simulations of the influence of temperature changes on structural integrity of stone temples in Angkor, Cambodia. Appl. Math. Comput. 2015, 267, 409–418. [Google Scholar] [CrossRef]
- Chen, F.; Xu, H.; Zhou, W.; Deng, W.; Parcharidis, I. Three-dimensional deformation monitoring and simulations for the preventive conservation of architectural heritage: A case study of the Angkor Wat Temple, Cambodia. GISci. Remote Sens. 2021, 58, 217–234. [Google Scholar] [CrossRef]
- Nuttens, T.; Wulf, A.D.; Deruyter, G.; Stal, C. Deformation monitoring with terrestrial laser scanning: Measurement and processing optimization through experience. In Proceedings of the Presented at the 12th International Multidisciplinary Scientific GeoConference SGEM 2012, Sofia, Bulgaria, 17–23 June 2012; pp. 707–714. [Google Scholar]
- Tapete, D.; Cigna, F. Site-specific analysis of deformation patterns on archaeological heritage by satellite radar interferometry. MRS Online Proc. Libr. (OPL) 2012, 1374, 283–295. [Google Scholar] [CrossRef]
- Suziedelyte-Visockiene, J.; Bagdziunaite, R.; Malys, N.; Maliene, V. Close-range photogrammetry enables documentation of environment-induced deformation of architectural heritage. Environ. Eng. Manag. J. 2015, 14, 1371–1381. [Google Scholar]
- Sesana, E.; Gagnon, A.S.; Ciantelli, C.; Cassar, J.; Hughes, J.J. Climate change impacts on cultural heritage: A literature review. Wiley Interdiscip. Rev. Clim. Chang. 2021, 12, e710. [Google Scholar] [CrossRef]
- Garziera, R.; Amabili, M.; Collini, L. Structural health monitoring techniques for historical buildings. In Proceedings of the IV Pan American Conference for Non Destructive Testing, Buenos Aires, Argentina, 22–26 October 2007; pp. 1–12. [Google Scholar]
- Sigurdardottir, D.H.; Glisic, B. On-site validation of fiber-optic methods for structural health monitoring: Streicker Bridge. J. Civil Struct. Health Monit. 2015, 5, 529–549. [Google Scholar] [CrossRef]
- De Smet, T.S.; Everett, M.E.; Warden, R.R.; Komas, T.; Hagin, J.N.; Gavette, P.; Martini, J.A.; Barker, L. The fate of the historic fortifications at Alcatraz island based on terrestrial laser scans and ground-penetrating radar interpretations from the recreation yard. Near Surf. Geophys. 2019, 17, 151–168. [Google Scholar] [CrossRef]
- Everett, M.E.; DeSmet, T.S.; Warden, R.R.; Ruiz-Guzman, H.A.; Gavette, P.; Hagin, J. The Fortress Beneath: Ground Penetrating Radar Imaging of the Citadel at Alcatraz: 1. A Guide for Interpretation. Heritage 2021, 4, 1328–1347. [Google Scholar] [CrossRef]
- Li, X. Monitoring of the Ming Great Wall Sites in Zhenbeita and its Surrounding Areas. Doctoral Dissertation, Harbin Institute of Technology, Harbin, China, 2016. [Google Scholar]
- Yu, B. Comprehensive Conservation and Management of the Great Wall in China: Challenges and Explorations. China Cult. Herit. 2018, 31–40. [Google Scholar]
- Chen, Y.; Zhang, X.; Liu, J.; Hou, L.; Niu, H.; Gao, S. Research on monitoring and early warning of rammed earth Great Wall on the Silk Road in China—Taking Jiayuguan Pass as an example. J. Shandong Univ. Technol. (Nat. Sci. Ed.) 2018, 32, 56–60. [Google Scholar] [CrossRef]
- Tapete, D.; Cigna, F. Trends and perspectives of space-borne SAR remote sensing for archaeological landscape and cultural heritage applications. J. Archaeol. Sci. Rep. 2017, 14, 716–726. [Google Scholar] [CrossRef]
- Copernicus for Cultural Heritage: Satellites to Preserve the Legacy from Our Past. Copernicus. Available online: https://www.copernicus.eu/en/copernicus-cultural-heritage-satellites-preserve-legacy-our-past (accessed on 26 April 2019).
- EURISY Space4Culture: Satellite Services for Historical and Creative Cities. Proceedings and Main Messages of the Conference. Available online: https://drive.google.com/file/d/1NKao-0HK2NPmVpwVRq2vbdHjrJ2AL6wY/view (accessed on 26 April 2019).
- Adams, R.E.; Brown, W.E.; Culbert, T.P. Radar mapping, archeology, and ancient Maya land use. Science 1981, 213, 1457–1468. [Google Scholar] [CrossRef] [PubMed]
- Tapete, D.; Cigna, F. COSMO-SkyMed SAR for Detection and Monitoring of Archaeological and Cultural Heritage Sites. Remote Sens. 2019, 11, 1326. [Google Scholar] [CrossRef]
- Elachi, C.; Roth, L.E.; Schaber, G.G. Spaceborne Radar Subsurface Imaging in Hyperarid Regions. IEEE Trans. Geosci. Remote Sens. 1984, 22, 383–388. [Google Scholar] [CrossRef]
- Moore, E.; Freeman, T.; Hensley, S. Spaceborne and Airborne Radar at Angkor: Introducing New Technology to the Ancient Site. In Remote Sensing in Archaeology; Springer: New York, NY, USA, 2006; pp. 185–216. [Google Scholar]
- Wiseman, J.; El-Baz, F. (Eds.) Interdisciplinary Contributions to Archaeology. In Remote Sensing in Archaeology; Springer: New York, NY, USA, 2007; p. 334. [Google Scholar]
- Zhu, J.; Li, Z.; Hu, J. InSAR Deformation Monitoring Methods and Research Progress. Acta Geod. Cartogr. Sin. 2017, 46, 1717–1733. [Google Scholar]
- Liu, G. Basic Principles of InSAR. Sichuan Surv. Mapp. 2004, 187–190. [Google Scholar]
- Colesanti, C.; Ferretti, A.; Novali, F.; Prati, C.; Rocca, F. SAR monitoring of progressive and seasonal ground deformation using the permanent scatterers technique. IEEE Trans. Geosci. Remote Sens. 2003, 41, 1685–1701. [Google Scholar] [CrossRef]
- Kampes, B.M.; Hanssen, R.F. Ambiguity resolution for permanent scatterer interferometry. IEEE Trans. Geosci. Remote Sens. 2004, 42, 2446–2453. [Google Scholar] [CrossRef]
- Ferretti, A.; Prati, C.; Rocca, F. Permanent scatterers in SAR interferometry. IEEE Trans. Geosci. Remote Sens. 2001, 39, 8–20. [Google Scholar] [CrossRef]
- Ferretti, A.; Prati, C.; Rocca, F. Nonlinear subsidence rate estimation using permanent scatterers in differential SAR interferometry. IEEE Trans. Geosci. Remote Sens. 2000, 38, 2202–2212. [Google Scholar] [CrossRef]
- Berardino, P.; Fornaro, G.; Lanari, R.; Sansosti, E. A new algorithm for surface deformation monitoring based on small baseline differential SAR interferograms. IEEE Trans. Geosci. Remote Sens. 2002, 40, 2375–2383. [Google Scholar] [CrossRef]
- Zhou, L.; Li, J.; Wang, C.; Li, S.; Zhu, Z.; Lu, J. Monitoring and Analysis of Subway Settlement along the Metro Lines in Shanghai from 2018 to 2020 Based on Time-Series InSAR. J. Geod. Geodyn. 2021, 41, 1177–1182. [Google Scholar]
- Liu, K.; Gong, H.; Chen, B. Ground Subsidence Monitoring and Analysis of Beijing Metro Line 6 Based on InSAR Data. J. Geo-Inf. Sci. 2018, 20, 128–137. [Google Scholar]
- Liu, Q.; Yue, G.; Ding, X.; Yang, K.; Feng, G.; Xiong, Z. Spatiotemporal Deformation Analysis of Foshan Metro Line Based on Time-Series InSAR. J. Wuhan Univ. (Inf. Sci. Ed.) 2019, 44, 1099–1106. [Google Scholar]
- Guo, Z. Monitoring Bridge Deformation and Surrounding Ground Subsidence Using Time-Series InSAR Technology. Doctoral Dissertation, China University of Mining and Technology, Xuzhou, China, 2021. [Google Scholar]
- Zhang, D.; Tang, X.; Li, Y. Deformation Information Extraction and Analysis of Steel Truss Girder Bridge Based on SBAS-InSAR Technology. J. Shandong Univ. Sci. Technol. (Nat. Sci. Ed.) 2023, 42, 10–17. [Google Scholar]
- Gao, E. Study on Deformation Monitoring along High-Speed Railway Based on High-Resolution SAR Images. Doctoral Dissertation, Southwest Jiaotong University, Chengdu, China, 2017. [Google Scholar]
- Zhu, W.; Wang, B.; Song, H.; Guo, L.; Yang, H. Investigation and monitoring of ground subsidence in Zhengzhou section of Beijing-Guangzhou high-speed railway based on InSAR. Geomat. Spat. Inf. 2019, 42, 61–63. [Google Scholar]
- He, H.; Chen, C.; Chen, F.; Tang, P. Demonstration study on Sentinel-1 SBAS deformation monitoring of the Ming Great Wall scenic corridor in Zhangjiakou. Remote Sens. Land Resour. 2021, 33, 205–213. [Google Scholar]
- Zhu, M.; Chen, F.; Fu, B.; Chen, W.; Qiao, Y.; Shi, P.; Zhou, W.; Lin, H.; Gao, S. Earthquake-induced risk assessment of cultural heritage based on InSAR and seismic intensity: A case study of Zhalang temple affected by the 2021 Mw 7.4 Maduo (China) earthquake. Int. J. Disaster Risk Reduct. 2023, 84, 103482. [Google Scholar] [CrossRef]
- Chen, F.; Zhou, W.; Tang, Y.; Li, R.; Lin, H.; Balz, T.; Luo, J.; Shi, P.; Zhu, M.; Fang, C. Remote sensing-based deformation monitoring of pagodas at the Bagan cultural heritage site, Myanmar. Int. J. Digit. Earth 2022, 15, 770–788. [Google Scholar] [CrossRef]
- Xu, H.; Chen, F.; Zhou, W.; Wang, C. Reducing the Residual Topography Phase for the Robust Landscape Deformation Monitoring of Architectural Heritage Sites in Mountain Areas: The Pseudo-Combination SBAS Method. Remote Sens. 2022, 14, 1178. [Google Scholar] [CrossRef]
- Liu, W. Research on the monitoring system of the Great Wall from the perspective of heritage characteristics analysis. Chin. Cult. Herit. 2018, 85–91. [Google Scholar]
- Li, Z.; Cao, W.; Liu, B.; Luo, Z. Current status and dynamic changes of soil erosion in China. Soil Water Conserv. China 2008, 321, 7–10+72. [Google Scholar]
- Li, M. Study on the characteristics and spatial-temporal distribution of geological hazards in Shanxi Province. Energy Environ. Prot. 2018, 40, 89–93. [Google Scholar]


Disclaimer/Publisher’s Note: The statements, opinions and data contained in all publications are solely those of the individual author(s) and contributor(s) and not of MDPI and/or the editor(s). MDPI and/or the editor(s) disclaim responsibility for any injury to people or property resulting from any ideas, methods, instructions or products referred to in the content. |
© 2023 by the authors. Licensee MDPI, Basel, Switzerland. This article is an open access article distributed under the terms and conditions of the Creative Commons Attribution (CC BY) license (https://creativecommons.org/licenses/by/4.0/).