1. Introduction
Object detection holds a central position in the realm of computer vision, forming the bedrock for tasks such as image segmentation and object tracking. With the relentless progression of computer hardware capabilities, object detection has pervaded numerous domains, encompassing security, healthcare, and autonomous driving. It has notably catalyzed urban development by curtailing expenses and elevating societal efficacy. In everyday life, applications like facial recognition-based transactions, access control, and text recognition have seamlessly integrated into our routines. In the medical arena, object detection technology lends critical support to physicians, aiding in diagnoses and accurately pinpointing potential anomaly regions. Within industrial production, object detection methods discern product defects, facilitating automated oversight and serving as a pivotal component in assembly lines. In the military domain, these techniques offer reconnaissance potential by surveilling adversary targets through remote sensing imagery. In agriculture, object detection assumes the role of pest infestation monitoring and constitutes a cornerstone in automated harvest equipment. The ongoing evolution of object detection methodologies has instigated transformative revolutions across multifarious sectors, yielding enhancements in efficiency, precision, and automation.
The objective of object detection encompasses the identification of object categories within input images and the precise delineation of their positions and boundaries using rectangular bounding boxes, coupled with associated confidence scores. While the human eye may find recognizing object categories and positions intuitive, for computers, an image translates to a set of data points. Deriving object category insights and accurately localizing objects from these data points constitutes a formidable computational task. Variables like object dimensions, orientations, illumination, and background disturbances all contribute to the intricacies of object detection performance. Hence, object detection confronts a multitude of challenges, demanding precise object localization and classification. Attaining these objectives with a harmonious interplay of accuracy and speed underscores the core of successful object detection. Furthermore, objects manifest in diverse scales, driving the pursuit of equilibrium in performance across these scales as a pressing research endeavor. The incorporation of adept attention mechanisms further augments object detection efficiency, requiring the construction of streamlined attention mechanisms that adeptly balance efficacy and computational efficiency.
Conventional approaches to image object detection employ sliding window methodologies to systematically navigate through entire images. These methods are complemented by manually engineered features that possess the ability to remain invariant to factors like lighting conditions, rotation, translation, and scaling. These intricately designed features are tailored to accommodate common fluctuations in lighting and shapes. The subsequent phase involves training classifiers on these features. Viola and Jones [
1] pioneered the Viola–Jones (VJ) detector, which extracts Haar features from images to automate facial detection through a sliding window mechanism. Dalal and Triggs [
2] introduced the concept of histogram of oriented gradient (HOG) features, effectively balancing between the invariance to translation and scaling. Felzenszwalb et al. [
3] innovated the deformable part model (DPM), which dissects object detection into various constituent detection tasks. Prominent classifiers employed include support vector machines (SVMs) and Bayesian classifiers.
Conventional methodologies for image object detection are fraught with several challenges. These include the substantial computational load of sliding window mechanisms and the intricate development of handcrafted features. Deep-learning-driven object detection algorithms present remarkable advantages over their traditional counterparts, excelling in terms of precision and efficiency, thereby positioning themselves as the leading approach in the field of object detection. The integration of deep learning into object detection has led to effective resolutions for many of these challenges. In 2012, Hinton et al. [
4] introduced the groundbreaking AlexNet model, achieving a substantial breakthrough in the ImageNet image recognition competition. Following this milestone, convolutional neural networks (CNNs) have gradually gained prominence in the realm of object detection, forming the cornerstone of computer vision models. With each passing year, numerous researchers have contributed to the development of diverse network models that exhibit enhanced performance in both accuracy and speed for image recognition tasks. Deep-learning-based object detection algorithms predominantly fall into two distinct categories: one-stage algorithms and two-stage algorithms. Among these, the two-stage algorithms initially extract features from the input image, subsequently conducting object classification and bounding box regression on selected candidate regions.
The inception of the two-stage algorithm era was marked by the introduction of the R-CNN (regions with CNN feature), pioneered by Girshick et al. [
5], which marked a pioneering breakthrough in the realm of object detection. The R-CNN approach ushered in the integration of convolutional neural networks (CNNs) into object detection, reshaping the landscape of this domain. The R-CNN method incorporated the Selective Search algorithm to generate a set of candidate regions. Subsequently, these regions were resized to a standardized dimension and fed into a neural network for feature extraction. This network was fine-tuned based on a pretrained ImageNet model tailored to the specific object detection task. Despite achieving commendable outcomes when compared to traditional methodologies of that time, the R-CNN approach faced certain limitations. Notably, the presence of fully connected layers hindered its accuracy when confronted with deformations, and its adaptability to varying image sizes remained constrained.
The challenges were addressed by He et al. [
6] through the introduction of the SPPNet (Spatial Pyramid Pooling Network), a pioneering approach that brought about the concept of spatial pyramid pooling. This innovation facilitated the model’s ability to seamlessly adapt to images of varying sizes. Subsequently, Girshick [
7] presented the Fast R-CNN framework, leveraging the VGG network as the foundational architecture to enhance both the computational speed and precision of object detection. Further building upon the Fast R-CNN foundation, Faster R-CNN, as introduced by Ren et al. [
8], incorporated the Region Proposal Network (RPN) for the generation of candidate bounding boxes. This innovation significantly improved both the accuracy and speed of the approach by replacing the resource-intensive selective search step with a more efficient candidate box generation mechanism. The Faster R-CNN methodology employed a shared feature map to simultaneously handle the tasks of classification and regression, integrating it seamlessly into the RPN for the generation of candidate bounding boxes.
Cai and Vasconcelos [
9] introduced the Cascade R-CNN, a novel approach that involved training with varying thresholds to enhance the accuracy of object detection. It is important to note that while two-stage algorithms typically offer superior accuracy by initially predicting potential object locations based on input features and subsequently conducting object classification and bounding box regression for more precise classification and positioning, they often exhibit slower processing speeds. Recognizing this challenge, one-stage algorithms such as YOLO (You Only Look Once), proposed by Redmon et al. [
10], execute both classification and regression tasks in a single step, thus boosting detection speed, albeit at the cost of a slight reduction in accuracy compared to Faster R-CNN.
Liu et al. [
11] introduced the single-shot multibox detector (SSD), which leverages features from various layers to enhance feature extraction and achieve greater accuracy than YOLO. YOLOv3, presented by Redmon and Farhadi [
12], incorporated the feature pyramid network (FPN) [
13] with multi-scale features to enhance accuracy in detecting small objects. Bochkovskiy et al. [
14] proposed YOLOv4, which employed the CSPDarkNet as the backbone, boasting increased parameters and utilizing the spatial pooling layer (SPP) to expand the receptive field of the backbone network, ultimately leading to superior performance. Dai et al. [
15] adopted the Transformer architecture for object detection, eliminating the requirement for anchor boxes and introducing a direct set-based prediction approach. This work demonstrated the potential of Transformers in computer vision tasks beyond their traditional application in natural language processing.
This study addresses the imperative need for enhancing the performance of current object detection methodologies and introduces improvements in the accuracy of image object detection tasks through the utilization of computer vision techniques such as feature pyramids. The proposed approach introduces an object detection methodology founded upon an augmented feature pyramid network. This approach specifically targets two principal limitations encountered in prevailing image object detection techniques. Firstly, it addresses the challenge of inadequate object detection across various scales by incorporating an augmented feature pyramid network to extract multi-scale features. This ameliorates the issue of significant information loss in top-level features during the fusion of multi-scale features in conventional methods, resulting in superior-quality multi-scale information. Secondly, the method tackles the limitation of commonly employed focal classification loss functions in object detection models, which tend to overly emphasize the classification features of intricate samples, leading to delayed model convergence. This is mitigated by refining the classification loss function to align more effectively with the attributes of the classification task, rendering it more proficient in accurate classification based on real-world conditions. The final experimental section encompasses diverse assessments, including ablation experiments conducted on the COCO2017 dataset and performance comparisons with 14 existing object detection algorithms on four widely recognized publicly accessible object detection datasets. The consistently observed outcomes of these experiments underscore the effectiveness of the proposed approach, showcasing higher detection accuracy in comparison to established baseline image object detection methods across these extensively utilized object detection datasets.
In today’s data-driven world, the role of images and videos as intuitive vehicles for transmitting information has taken on unprecedented significance. With the dawn of the AI era, computer vision techniques, particularly those grounded in deep learning, have enabled the autonomous and precise identification of objects within visual media. This technological advancement has propelled image and video analysis to the forefront of contemporary research, ushering in transformative possibilities across various domains. Our empirical findings not only substantiate the effectiveness of our approach but also establish it as a promising solution for discerning multi-scale objects within images and videos. Importantly, our research aligns with the quest for safer and more reliable autonomous driving systems, as it contributes to the evolving landscape of computer vision and object detection, directly impacting the future of mobility and security.
2. Problem Description
Object detection constitutes a ubiquitous domain within the realm of computer vision. Throughout its evolutionary trajectory, a central hurdle has involved crafting more potent feature extraction modules rooted in deep learning. In the nascent phases of object detection networks, comparatively straightforward convolutional neural networks were integrated as feature extraction modules within the bedrock network architecture. As a result, the foundational network architecture was constrained to extracting features solely at a singular scale. While these features showcased robust information representation capacities at a macroscopic level, the escalating requisites for heightened object detection performance accentuated the inadequacy of these features operating at a solitary scale. In the course of convolutional pooling, information pertaining to diminutive objects experienced a gradual erosion within the confines of the one-scale feature maps.
Subsequently, the significance of multi-scale feature extraction networks gained prominence, exemplified by models such as UNet [
16] and FPN [
17]. At present, the extensively employed FPN architecture has exhibited enhanced performance in object detection, as demonstrated in the case of Sparse R-CNN [
18]. Through the fusion of multi-scale feature maps, FPN facilitates the reciprocal exploitation of both high-level and low-level features. High-level features augment the semantic representation of low-level features, while low-level features amplify intricate details grounded in high-level features. Nevertheless, considering FPN’s multi-scale fusion principle, directly amalgamating features from distinct levels featuring pronounced semantic disparities may not yield optimal results. Moreover, during the utilization of FPN, direct fusion of features spanning the highest and lowest levels could potentially engender information loss.
The proposed enhancements in this study are predicated on the Sparse R-CNN object detection algorithm, which represents a distinctive approach. Sparse R-CNN, functioning as a two-stage object detection technique, deviates from the conventional paradigm of such algorithms. Notably, its Region Proposal Network (RPN) engenders a fixed ensemble of 100 candidate boxes. Subsequently, these designated boxes traverse a Dynamic Instance Interactive Head (DIIHead) module. For every individual candidate box, the RoIAlign algorithm orchestrates the extraction of region-specific features, subsequently facilitating the execution of tasks pertaining to target classification and positional regression. The processed boxes subsequently undergo a succession of six iterations through the DIIHead module, progressively refining the initial 100 candidate boxes and culminating in the derivation of the ultimate output.
Of notable significance, the Sparse R-CNN method circumvents the necessity for a post-processing step such as nonmaximum suppression (NMS). This sets it apart from conventional two-stage object detection techniques like Faster R-CNN, which generate a voluminous array of candidate boxes exceeding hundreds of thousands during the Region Proposal Network (RPN) phase. In stark contrast, Sparse R-CNN judiciously employs a sparse collection of 100 candidate boxes within the output feature map, each imbued with learnable attributes. This limited set of 100 candidates places a higher reliance on the extraction of high-level features. Notably, the feature pyramid network (FPN) encounters a diminution of high-level features as a consequence of fusion. Consequently, the direct adoption of FPN as the multi-scale feature extraction module for Sparse R-CNN remains poised for enhancements.
Within Sparse R-CNN, the ultimate goal is to derive conclusive outcomes from the sparse set of 100 learnable candidate boxes. To ensure a closer alignment between the ascertained classes and the actual target classes, an improved classification loss function becomes imperative. Such a function would yield a more accurate assessment of the proximity between identified and genuine target classes. In its classification loss, Sparse R-CNN employs focal loss. The introduction of focal loss was primarily aimed at mitigating the challenge of imbalanced hard and easy samples. Given the abundance of candidate boxes generated in detection, coupled with the paucity of positive samples, a class imbalance dilemma emerges. Nonetheless, incorporating focal loss in Sparse R-CNN gives rise to certain issues. Notably, focal loss tends to excessively concentrate on intricately classifiable samples. This predicament becomes pronounced when the model attains advanced training stages, resulting in a decline in performance.
To tackle the abovementioned challenges, this paper presents an image object detection methodology grounded in a feature pyramid framework. This approach rectifies the deficiencies in the multi-scale feature extraction network employed by Sparse R-CNN, consequently elevating the expressive capacity of multi-scale features within Sparse R-CNN. Furthermore, the classification loss incorporated in this methodology leverages a gradient density loss function. This function is adept at providing a more accurate assessment of classification loss concerning detection boxes.
In this work, we make the following key contributions and introduce novel aspects:
- •
Enhanced feature pyramid network: We propose an advanced feature pyramid network that significantly enhances multi-scale feature extraction and fusion capabilities. This innovation reduces information loss during feature fusion, leading to improved feature representations.
- •
Gradient density loss function: Our introduction of the gradient density loss function, as a replacement for the traditional focal loss, offers a more precise assessment of object detection classification losses, particularly for challenging samples.
- •
Comprehensive evaluation: We rigorously evaluate our method on four well-established public object detection datasets, including MS COCO 2017, MS COCO 2014, Pascal VOC 2007, and Pascal VOC 2012. Substantial improvements in average precision are achieved compared to existing methods.
- •
Enhanced small-scale target detection: The application of the enhanced feature pyramid network results in superior detection capabilities for small-scale objects, while maintaining high accuracy for larger and medium-sized targets.
- •
Visual comparisons: We present visual comparisons to demonstrate the practical effectiveness of our enhancements.
3. Method
Multi-scale feature extraction networks play a crucial role in object detection tasks. In widely employed datasets, small objects account for a smaller fraction of the entire image, while other objects necessitate the preservation of high-level large-scale features. Furthermore, the utilized loss function for assessing classification performance might not comprehensively cater to real-world scenarios. With these considerations in mind, this paper introduces an object detection approach founded on a feature pyramid network. The overarching structure of this methodology encompasses two primary constituents: an enhanced feature pyramid network module and a loss function tailored for object detection classification.
3.1. Enhanced Feature Pyramid Network
In preparation for feature fusion within the FPN, a convolutional layer is employed. This step serves to transform the channel dimensions, facilitating the subsequent aggregation of feature maps from different scales. The outcome is a fused feature map endowed with enriched information. However, a commonly employed fusion strategy involves channel dimension reduction in higher-level features via convolutional layers, enabling their summation with lower-level feature maps. This process, unfortunately, introduces information loss within feature maps originating from varying scales. Additionally, the semantic gap between feature maps generated at different scales is substantial. If the model neglects these notable semantic disparities and directly applies convolutions followed by addition for multi-scale information fusion, there remains room for improvement within this fusion strategy. It is essential to acknowledge that the fundamental design principle of the FPN involves fusing high-level features with their low-level counterparts, thereby empowering high-level features to enhance low-level feature representation by leveraging semantic insights from larger scales. Nevertheless, the feature map located at the highest level lacks a corresponding higher-level, larger-scale feature map for fusion. Consequently, the original network architecture generates a feature map at the highest level, corresponding to the largest scale, devoid of input from features at other scales. Instead, this map is directly subjected to channel dimension reduction before being merged with feature maps from lower scales. This approach seems inequitable to the highest-scale feature map, especially considering that lower-scale feature maps have already undergone fusion with features from more elevated scales.
The approach proposed in this paper effectively tackles the limitations of the FPN utilized in the Sparse R-CNN network to extract multi-scale features. It incorporates mechanisms for enhancing both top-level and bottom-level features, thereby facilitating the extraction of multi-scale image features that encompass both fine-grained and coarse-grained details. This approach better satisfies the demands of object detection. Given an input image, the process of multi-scale feature extraction benefits from the top-level and progressive feature enhancement mechanisms, resulting in the extraction of more finely fused and higher-quality multi-scale feature maps with minimized information loss. Subsequently, the detection network processes these multi-scale features to generate object classification scores and bounding box coordinates, which collectively constitute the foundation for the final object detection outcomes.
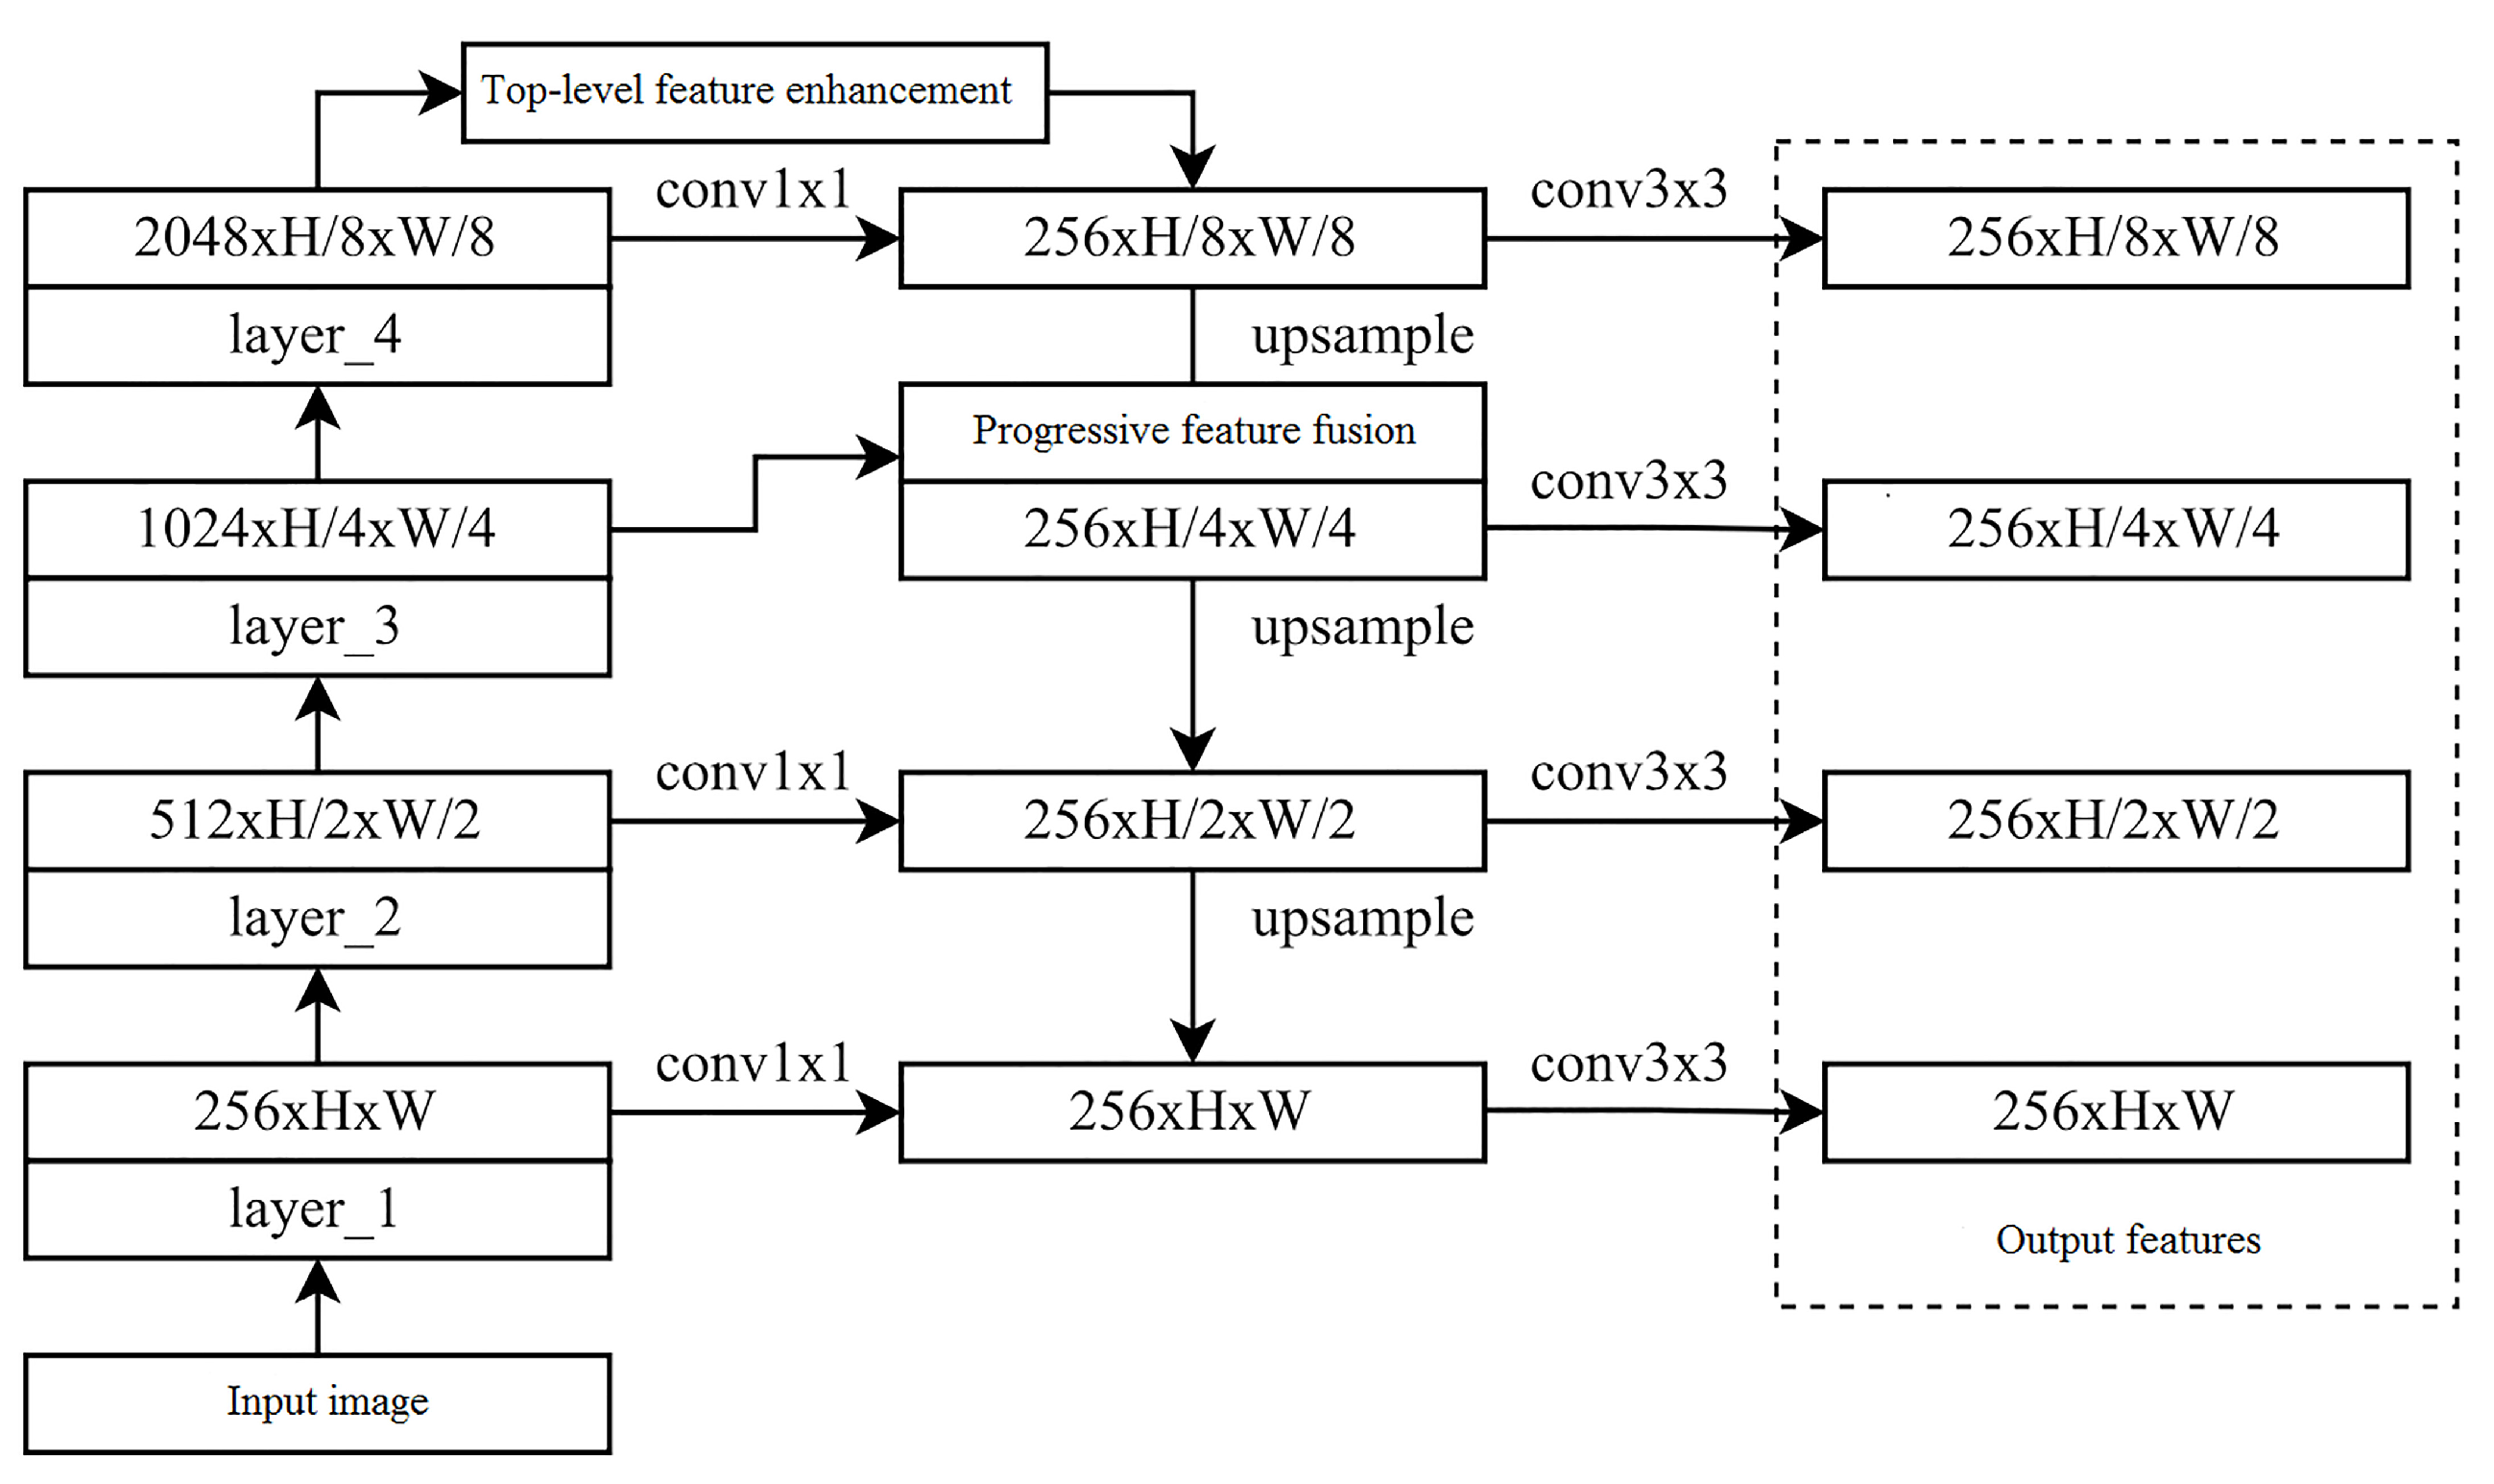
The architecture of the feature extraction network is depicted in
Figure 1. It encompasses two principal stages: top-level feature enhancement and progressive feature fusion across multiple scales. During the first stage, top-level feature enhancement leverages the multi-scale features obtained from the backbone network. These features are integrated into the ultimate output network features. By employing a reduction in channel dimensionality, the extent of information loss in top-level features is ameliorated. The subsequent stage involves progressive feature fusion across multiple scales during the multi-scale feature fusion phase. This approach effectively diminishes the semantic gap existing between feature maps of varying resolutions within the feature pyramid’s multi-scale feature fusion process. Consequently, this strategy contributes to more refined multi-scale feature fusion. The combination of these two stages culminates in the creation of well-integrated multi-scale feature maps.
During the stage of multi-scale feature extraction, the initial input image undergoes processing through the backbone network, which is constructed based on the ResNet-50 architecture. Convolutional operations are executed across four residual convolutional modules (referred to as layer_1 to layer_4), generating feature maps at corresponding scales: , , , and . This design allows the feature extraction network to progressively gather insights from both diminutive-scale and substantial-scale features spanning diverse scales. Notably, subsequent to each residual convolutional module, the feature map is proportionally downsampled by factors of 0.5, 0.25, and 0.125, respectively. Within the FPN network of Sparse R-CNN, subsequent to the extraction of feature maps at the four distinct scales, a process of reversed feature fusion is initiated. To facilitate this fusion, a convolutional operation is applied to the feature map of each layer. This operation ensures uniformity in output channel dimensions across layers, thus simplifying the ensuing feature fusion process. Typically, fusion is executed through element-wise addition.
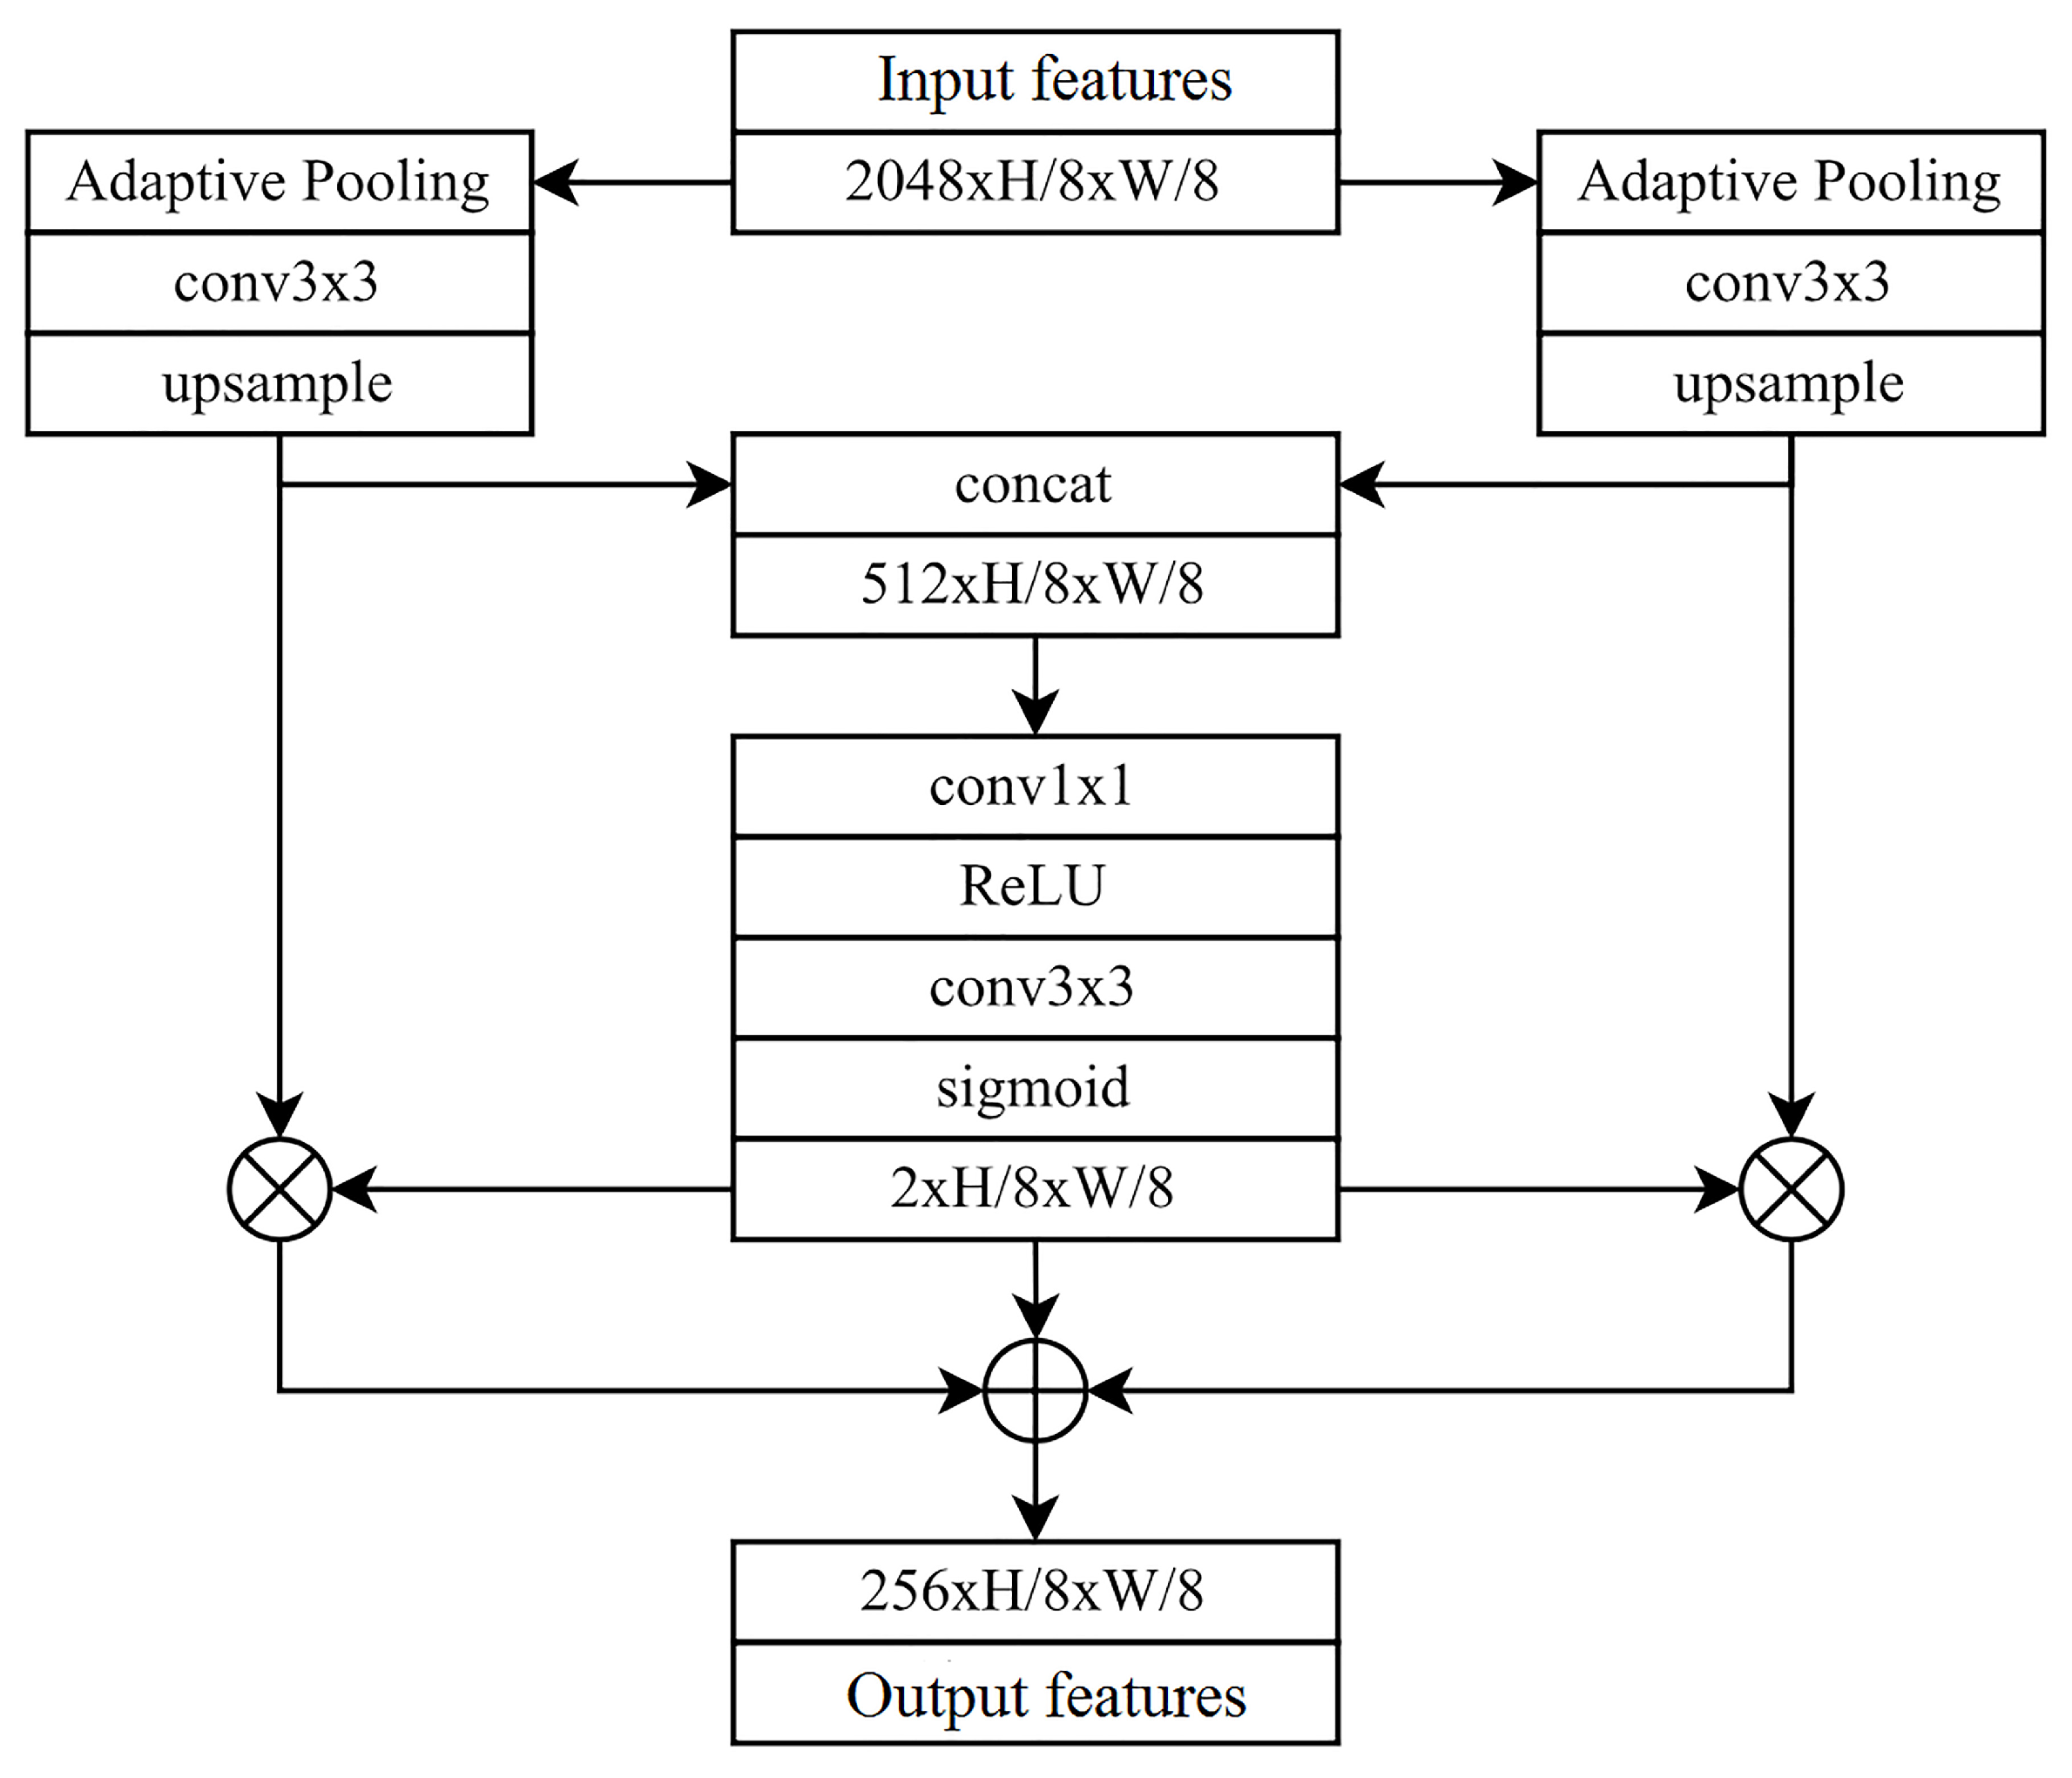
In the ultimate top-level feature map at the 0.125× scale (depicted in
Figure 2), a module for top-level feature enhancement is incorporated. The module’s output undergoes fusion with the original top-level features, thereby generating enhanced top-level features. This augmentation effectively counteracts the loss of top-level feature data that can arise during the ensuing process of reversed multi-scale feature fusion. Consequently, this addresses the constraint attributed to the absence of higher-level features available for fusion with the top-level counterparts.
To be more precise, the top-level feature enhancement module incorporates an adaptive pooling mechanism. In this process, the aspect ratio of the feature map remains constant, while the pooling ratio can be altered. This permits the execution of adaptive pooling using multiple pooling ratios. Consequently, the model operates at diverse scales, generating target features of varying scales based on the original top-level input features. This approach enables progressive feature fusion across distinct channels, and the resultant feature scale
after extraction can be expressed as shown in Equation (
1).
where
S represents the initial feature scale, corresponding to the scale of the top-level feature. The symbols
, where
, signify the designated pooling ratios. Following this, a
convolutional kernel is applied to condense the multi-channel features to 256. Subsequently, an upsampling procedure is engaged to restore the dimensions to the original scale
S in preparation for subsequent fusion. The technique of bilinear interpolation is harnessed in the upsampling phase to compute new pixel values. For given coordinates of four points,
, and
, the interpolation formula employed to ascertain the value at a novel coordinate
is as follows:
where
,
,
,
.
In this process, following the upsampling step, the feature maps that underwent pooling with varying ratios in the preceding stage have their scales equalized. These feature maps are subsequently concatenated. Recognizing the semantic disparity among these feature maps with distinct original ratios, each of them undergoes a sequence consisting of a convolutional layer, an ReLU layer, and a convolutional layer. This series of operations generates weight maps for each multi-scale feature map after the concatenation. Finally, these weight maps are element-wise multiplied with their corresponding feature maps from before the concatenation on each channel, followed by summation. This sequence constitutes the output of the top-level feature enhancement module.
The rationale behind the capability of the top-level enhancement module to improve the representation of the highest-level features lies in its utilization of adaptive pooling at the highest scale. This process effectively extracts features one level higher on the top-level feature map, which contains richer semantic content. Subsequently, this enhanced feature map is integrated with the original top-level feature map. Moreover, the paper introduces two adaptive pooling branches with distinct scaling ratios to combine high-level semantic features with even higher-level, diverse semantic information. These adaptive pooling branches can be extended to encompass multiple ratios, further enhancing the feature representation potential of the highest-level features.
Following the operations of the two adaptive pooling branches, bilinear interpolation is employed to upsample the feature maps. These upsampled maps are then concatenated, forming a cascaded representation of multi-scale enhanced features based on the top-level features. Subsequent to a convolutional layer that reduces the number of channels, the result is multiplied with the original feature map that has not been concatenated. This procedure yields the final enhanced top-level features.
In the reverse progressive feature fusion process of the pyramid network, the prevalent approach involves upsampling each layer’s feature map, resulting in uniform dimensions and channel numbers for the feature maps at every level. This facilitates direct merging during the fusion with lower-level features. While nearest neighbor interpolation is frequently used for upsampling in FPN implementation, this method lacks consideration for semantic differences among features of different scales. Hence, the use of bilinear interpolation during upsampling generates smoother multi-scale feature maps, thereby minimizing the semantic gap between distinct feature maps. Moreover, when enhancing top-level features and conducting multi-scale feature fusion, direct application of nearest neighbor interpolation during upsampling might lead to information loss during feature fusion at the top level. The enhanced progressive feature fusion module effectively mitigates the decline in quality of multi-scale features caused by significant semantic gaps across different levels.
3.2. Gradient Density Loss Function
In conventional classification tasks, the cross-entropy loss function is widely utilized. The equation for the binary cross-entropy loss function is expressed as follows:
where
signifies the true class label of the sample, and the corresponding probability is denoted as
.
Next, let us denote “
” as the output of the model. In this scenario, we have
. Now, by differentiating the aforementioned cross-entropy loss function with respect to the model’s output, we arrive at
At this juncture, the magnitude of the gradient is defined as “
”, which can be represented as
where the value of “
” indicates the level of difficulty posed by a sample and its impact on the overall gradient. To address the challenge stemming from uneven gradient distribution due to varying sample quantities, the concept of the “gradient density loss function” is introduced. This strategy involves partitioning the gradient into distinct ranges, counting the number of samples within each range, and evaluating the distribution within these ranges. Subsequently, using the sample count in each range and the length of the range, the “
”
is defined. This metric reflects the number of samples per unit magnitude.
where
represents the magnitude within the range. Therefore, the gradient density
can be expressed as the number of samples within a certain interval
. Subsequently, the gradient density parameter is defined as follows:
In the equation,
N represents the total number of samples. This parameter is used to weigh the cross-entropy loss classification function, resulting in a new gradient density loss function. This function is designed to reduce the weight of larger gradient density intervals, thereby diminishing the impact of challenging samples on the model. This adjustment helps mitigate the influence of difficult outliers on the final accuracy. For better comprehension, let us express the above equation in an alternative form:
As can be discerned, signifies the proportion of sample gradients within the gradient partitioning interval concerning the total sample count. If the sample count within the gradient interval is uniformly distributed, then for every interval, implying that the gradient density parameter in that interval would hold no sway over the result. Conversely, for demanding samples characterized by higher gradient densities and larger counts, this value would diminish. This characteristic serves to counterbalance the impact of a multitude of challenging samples on the model’s precision.
Hence, the substitution of the classification loss function focal loss [
19] with the gradient density loss function in Sparse R-CNN can be mathematically expressed as follows:
In this equation, represents the actual classification label, represents the predicted label, and represents the count of samples falling within the ith interval after dividing the gradient magnitudes into N intervals using the parameter N. The term denotes the cross-entropy classification loss function.
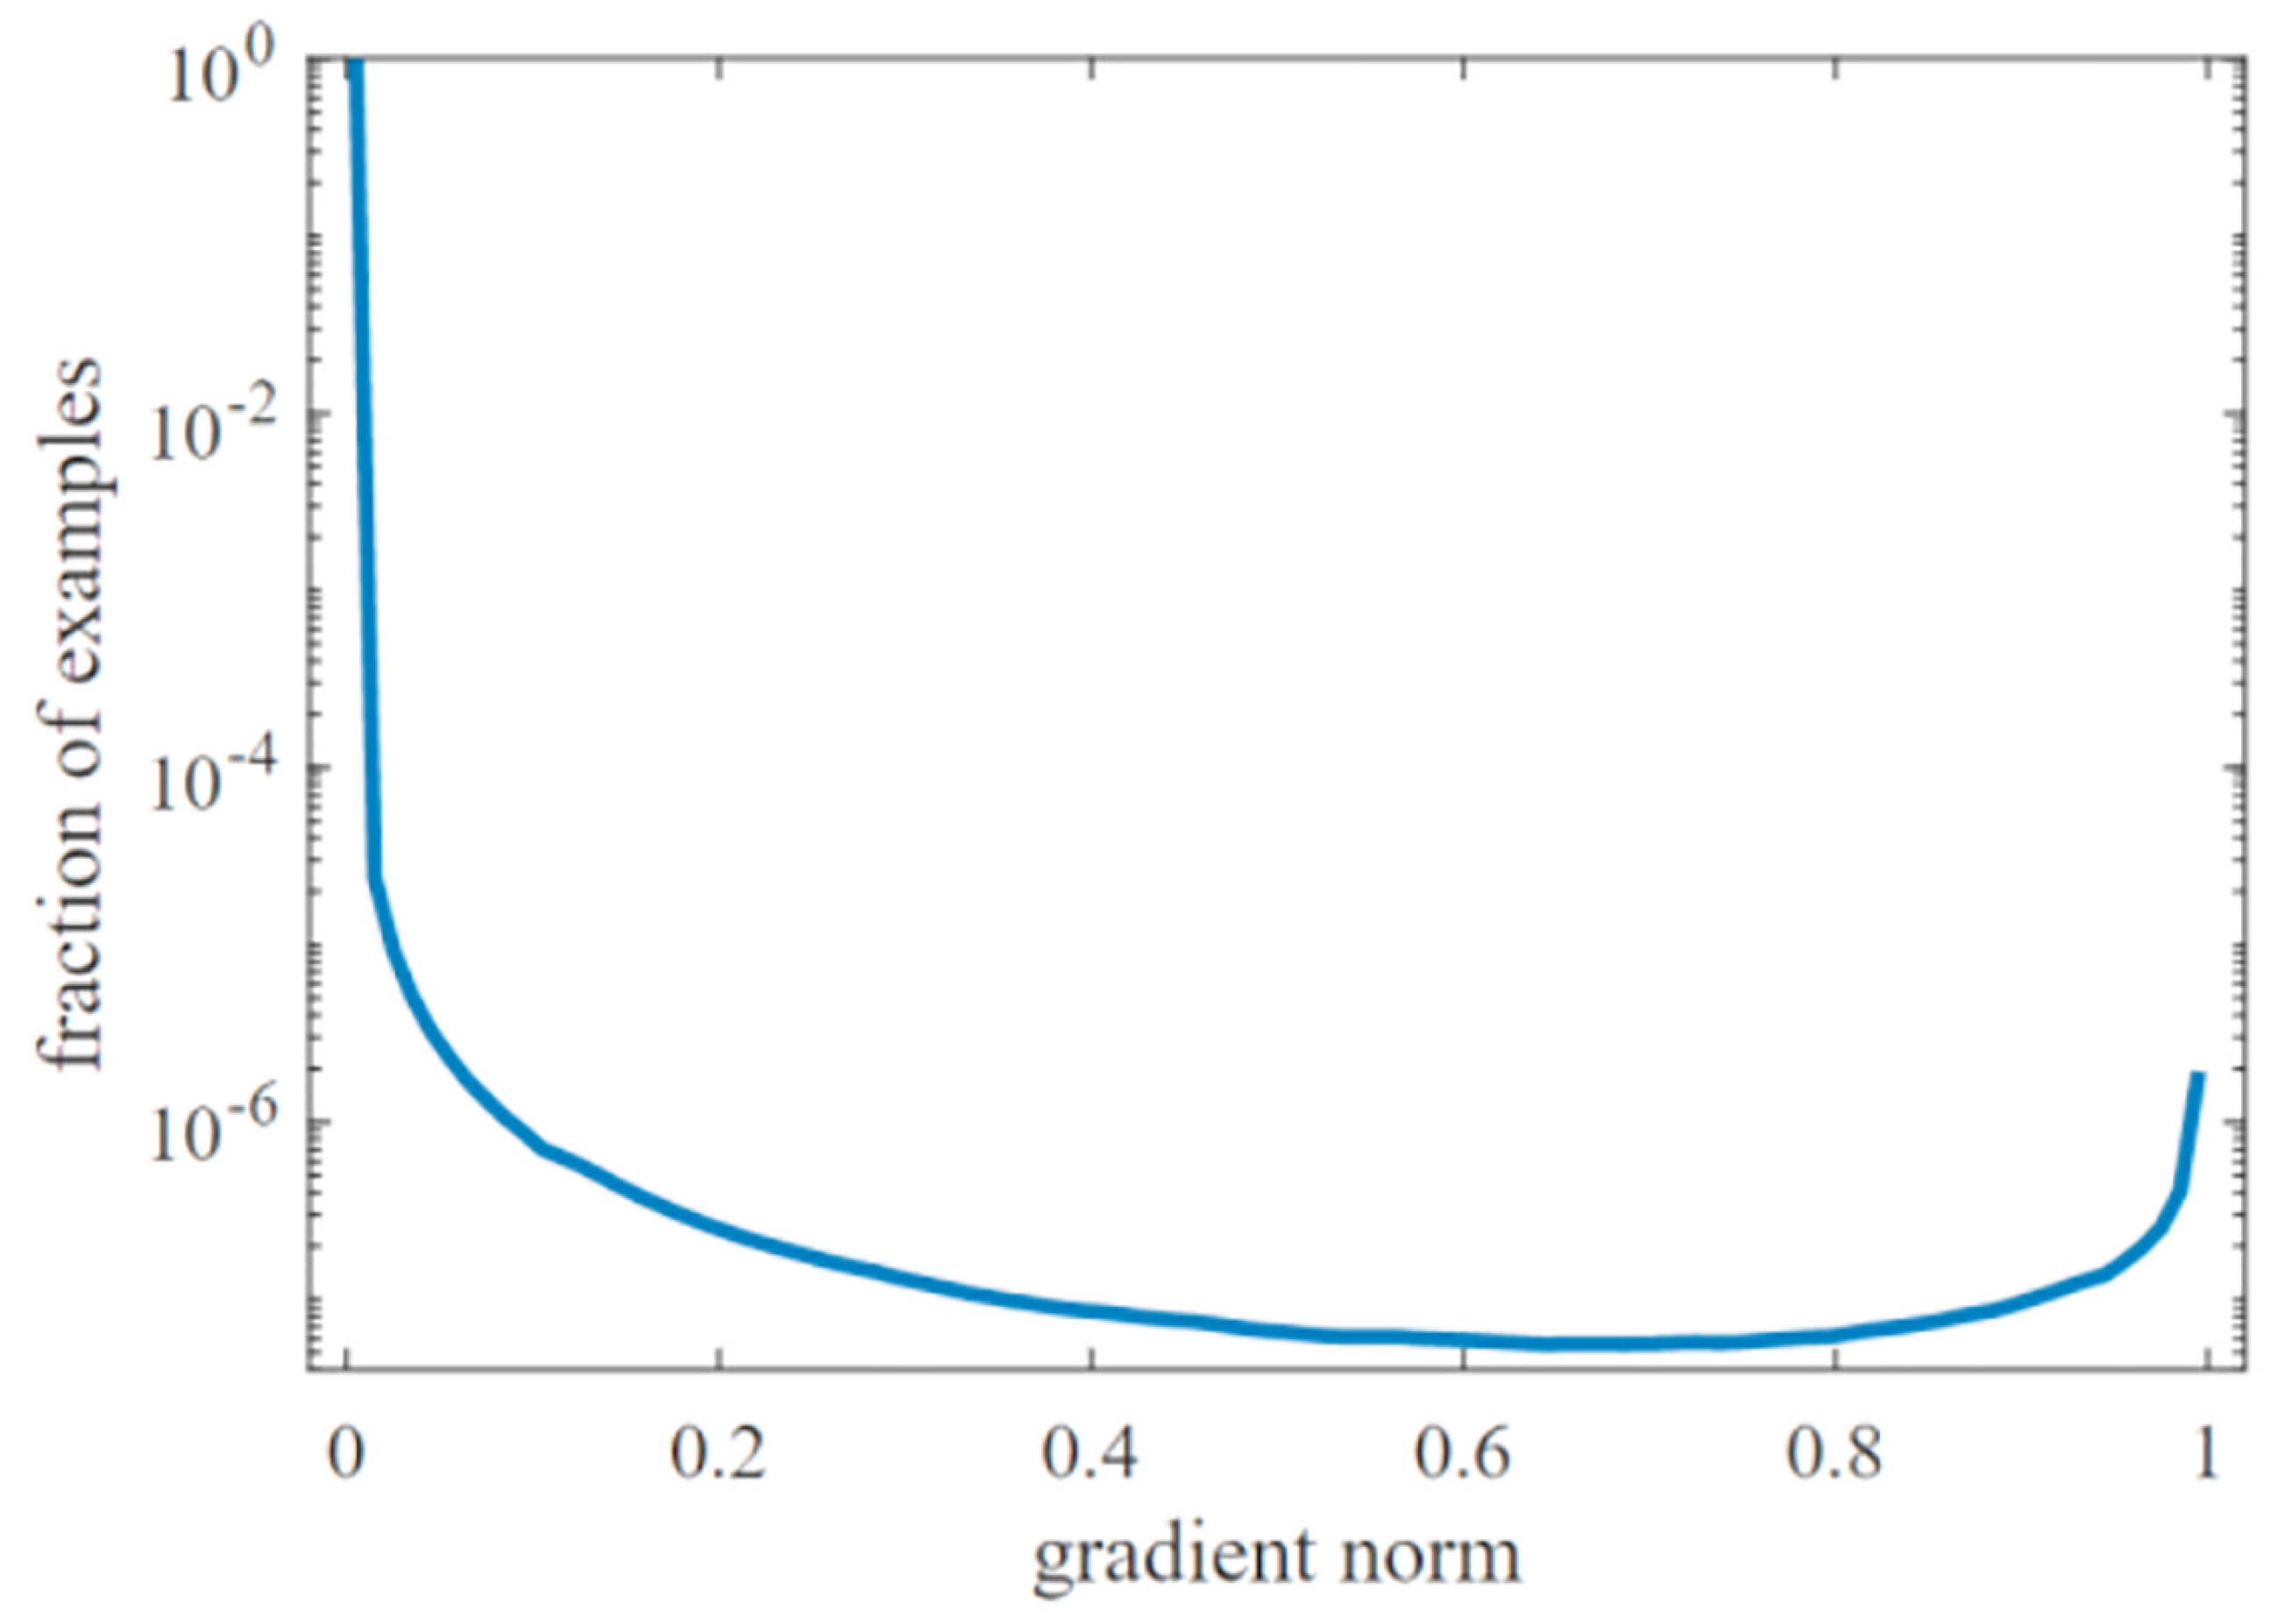
Figure 3 displays the gradient magnitude distribution of a converged model. Along the horizontal axis, the gradient magnitude is depicted, with the right side representing more challenging samples and the left side representing simpler ones. The vertical axis, on a logarithmic scale, illustrates the corresponding number of samples at each gradient magnitude. The logarithmic scale is chosen due to the substantial variance in quantities between simple and moderately difficult samples in practical scenarios. The graph highlights that the largest number of samples falls into the simple category, while moderately difficult samples are fewer in number. Remarkably, the count of extremely challenging samples increases notably, surpassing even the quantity of moderately difficult ones by a substantial margin. As a consequence, these highly challenging samples can potentially lead to a reduction in model accuracy. This is due to the fact that these challenging samples, acting as outliers, often possess gradient directions significantly distinct from those of other simple and moderately difficult samples. Forcing a nearly converged model to learn from these exceedingly challenging exceptional samples can result in inaccurate classification for a considerable number of other samples.
After applying the gradient density loss function to weight the cross-entropy loss function, the relationship between the gradient magnitudes of samples and their corresponding quantities is illustrated in
Figure 4.
In
Figure 4, the horizontal axis represents the initial gradient magnitudes, while the vertical axis illustrates the gradient magnitudes after employing distinct loss functions. The observation reveals that within the region associated with simple and moderately difficult samples, situated on the left side of
Figure 3, the tendencies of the gradient density loss and focal loss align. This correspondence implies that these two loss functions demonstrate coherent behavior in discriminating between simple and moderately difficult samples. Conversely, for challenging samples situated on the right side of the graph, the gradient density loss effectively diminishes the gradient magnitudes. This adjustment serves to stabilize the model when confronted with difficult and exceptional samples, thereby amplifying training efficiency.
After integrating the enhanced loss function, the comprehensive loss function for the image object detection method is formulated as
where
,
, and
denote the coefficients allocated to the classification loss, bounding box regression loss, and intersection over union (IoU) loss, correspondingly.
The FL is a well-known loss function introduced to address the class imbalance problem in object detection. It assigns higher weights to hard-to-classify examples, reducing the contribution of easily classifiable examples to the loss. While FL effectively handles class imbalance, it does not explicitly consider the density of object instances within an image, potentially leading to suboptimal performance in scenarios where objects are densely packed.
Class-agnostic focal loss (CF) extends FL by making it class-agnostic, thus focusing on the overall detection quality without distinguishing between different object classes. This modification enhances the detection of objects irrespective of their classes, which is particularly useful when dealing with diverse or unknown objects. However, CF may not effectively address the issue of object density when objects of varying classes are densely distributed.
GHM-C introduces gradient harmonization to address the imbalance between easy and hard examples during training. It effectively balances the learning process between different examples based on the gradient distribution, enhancing the network’s ability to focus on challenging examples. However, similar to FL, GHM-C does not explicitly consider object density.
In contrast, our proposed gradient density loss is specifically designed to address the challenge of object detection in scenarios with varying object densities. It combines the benefits of FL and GHM-C by incorporating density-based weighting into the loss calculation. Gradient density loss assigns higher weights to challenging examples, both in terms of classification difficulty and object density. By integrating these aspects, it aims to enhance the detection of objects in densely populated scenes, contributing to improved overall detection performance.
In summary, the proposed gradient density loss introduces an innovative approach that combines the strengths of FL, CF, and GHM-C while explicitly considering object density. This approach aims to offer a more comprehensive solution for object detection, particularly in challenging scenarios. Our comparative analysis shows that gradient density loss provides a valuable addition to the field of object detection, especially in cases where object density varies significantly across images.
3.3. The Overall Framework
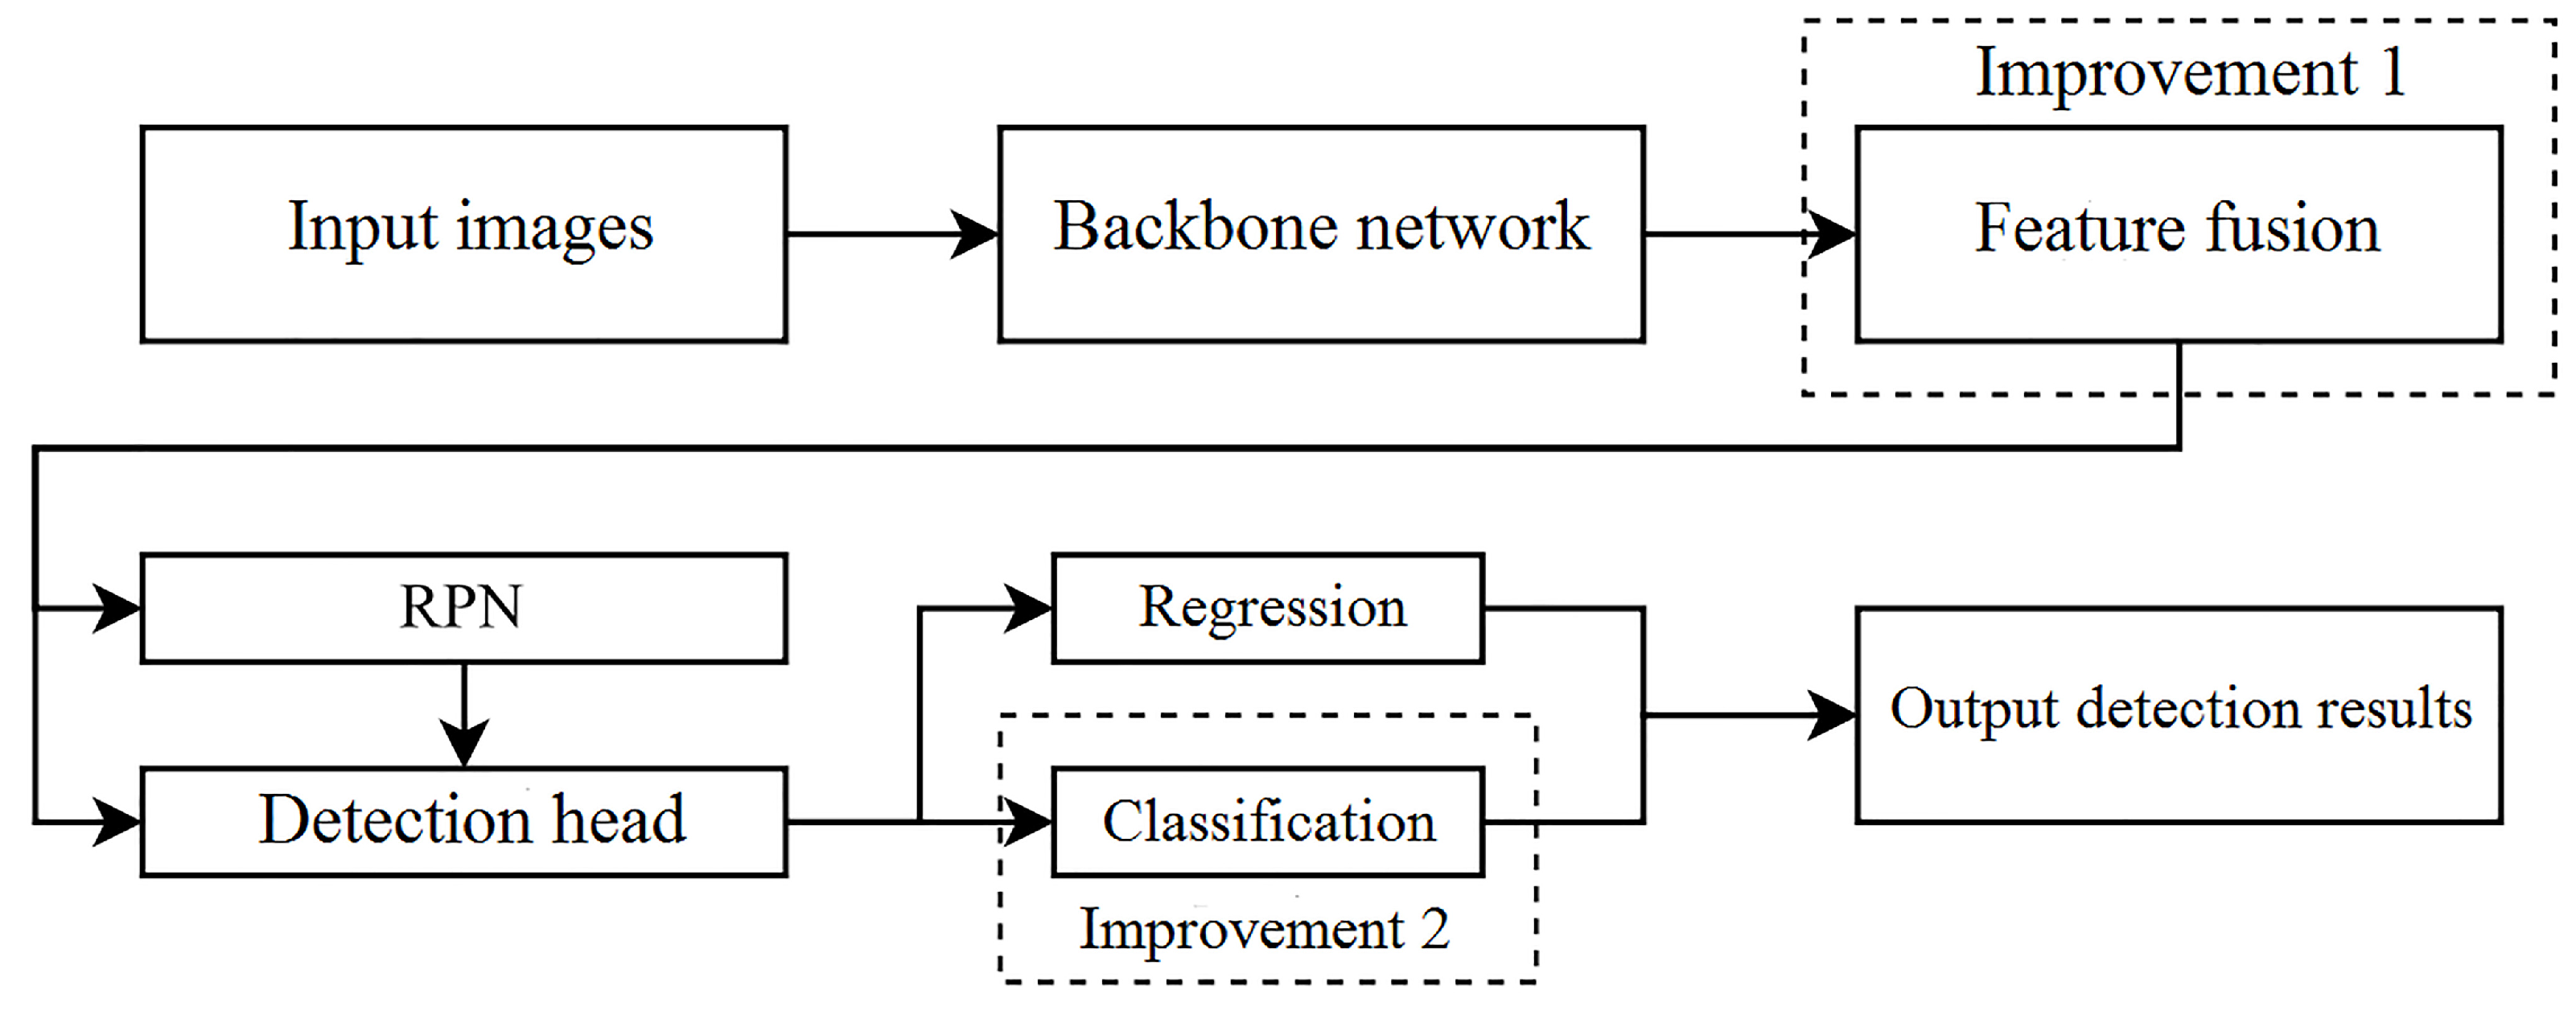
The model proposed in this paper follows the overall architecture of Sparse R-CNN while introducing improvements on top of it, which is depicted in
Figure 5.
In the section pertaining to the backbone network, the model employs a ResNet-50 network that has been pretrained on the ImageNet dataset. Subsequent enhancements are applied to the feature pyramid network (FPN) module of the Sparse R-CNN network using the proposed enhanced feature pyramid network (FPN) for multi-layer feature fusion. Given that the input and output scales, as well as the channel numbers, of the enhanced FPN remain consistent with those of the Sparse R-CNN network, which utilizes feature vectors from the four stages of the ResNet-50 backbone network (Stage 1–4), these improvements do not affect other components of the network.
Within the enhanced FPN’s module for multi-scale fusion, the top-level features receive initial enhancement. A dedicated top-level feature enhancement module is constructed based on the output of the Stage 4 residual layer of ResNet-50. The convolutional layers within the top-level feature enhancement module utilize Xavier initialization. After producing higher-level feature vectors through this module, subsequent stages involve the utilization of bilinear interpolation for both upsampling and fusion. This stands in contrast to the nearest-neighbor interpolation employed in the fusion stage of the original Sparse R-CNN algorithm. This refined approach mitigates top-level feature degradation, a concern in the original Sparse R-CNN algorithm’s multi-scale features. Moreover, due to the smoother feature fusion between different scales, the semantic gap between these features is reduced, leading to superior quality features and ultimately augmenting the algorithm’s accuracy.
Post feature extraction, the process proceeds by employing the Region Proposal Network (RPN) to generate an embedding matrix for each of the fixed 100 detection boxes. These matrices encapsulate the coordinates and classification features of the detection boxes and possess dimensions of and , respectively. The initial coordinates of the detection boxes are assigned using a random distribution. Subsequently, RoIAlign is utilized to extract features from the corresponding positions of the input feature maps for each detection box. Employing the multi-scale feature maps from the four layers, each layer maps the embedding matrices of the detection boxes to the extracted multi-scale feature maps. Consequently, feature vectors linked to each detection box are retrieved.
In relation to the label assigner within the detection head, a threshold of 0.5 is defined as the criterion for categorizing positive and negative samples. Classification and regression tasks are accomplished via fully connected layers. The regression loss employs the L1 loss from the original Sparse R-CNN. The GIoU loss is employed for IoU loss. Additionally, an enhancement is introduced via the proposed gradient density classification loss to modify the original Sparse R-CNN’s focal loss. The classification loss weight is set to 2.0, the regression loss weight to 2.0, and the IoU loss weight to 5.0. Upon completion of the Sparse R-CNN detection process, the customary nonmaximum suppression (NMS) post-processing step is eschewed. Instead, the model directly outputs the 100 detection boxes. During visualization, confidence thresholding can be applied to display pertinent detection boxes.
4. Experiments and Analysis
4.1. Datasets and Evaluation Metrics
This section outlines the datasets employed in the experiments and the evaluation criteria utilized.
MS COCO 2017: The Microsoft Common Objects in Context (MS COCO) dataset [
21] stands as a cornerstone in computer vision tasks, including object detection and semantic segmentation. It gained prominence following the discontinuation of the ImageNet competition in 2017. COCO has attracted contributions from global tech giants like Google, Microsoft, Facebook, and esteemed research institutions. It boasts a comprehensive object detection dataset drawn from intricate everyday scenes, featuring over 200,000 images and 80 categories. The training set of COCO 2017 comprises 118,287 images, and the validation set contains 5000 images.
MS COCO 2014: Introduced in 2014 [
21], the COCO dataset of 2014 diverges in content from its 2017 counterpart. It incorporates a training set of 82,783 images, a validation set of 40,504 images, and a test set encompassing 40,775 images.
Pascal VOC 2007 [
22]: Pascal VOC (Pattern Analysis, Statistical Modeling, and Computational Learning Visual Object Classes) serves as a benchmark dataset for object detection, encompassing image classification, object detection, and semantic segmentation tasks. The 2007 edition comprises 20 categories and a total of 9963 annotated images. The dataset is partitioned into a training set of 5011 images and a test set of 4952 images.
Pascal VOC 2012: Representing the concluding year of this esteemed computer vision challenge, Pascal VOC 2012 features image classification, object detection, object segmentation, and action recognition as its principal tasks. It encompasses 11,530 images with 27,450 object annotations and 6929 segmentation annotations.
Evaluation Criteria: For object detection evaluation, the COCO dataset’s evaluation metrics are employed due to the conversion of Pascal VOC datasets into COCO format for experimentation. The primary evaluation metric for object detection in the COCO dataset is the mean average precision (mAP), a measure of average accuracy. Given that object detection involves generating detection boxes, calculating the average precision entails a series of steps. The average AP values are determined for detecting diverse classes of objects prior to assessing classification accuracy.
Throughout COCO evaluation, multiple intersection over union (IoU) thresholds are set, often spanning from 0.5 to 0.95 with increments of 0.05. For each IoU threshold, the average precision is computed for each object class. Ultimately, the obtained AP values across various IoU thresholds are averaged to yield the comprehensive mAP score.
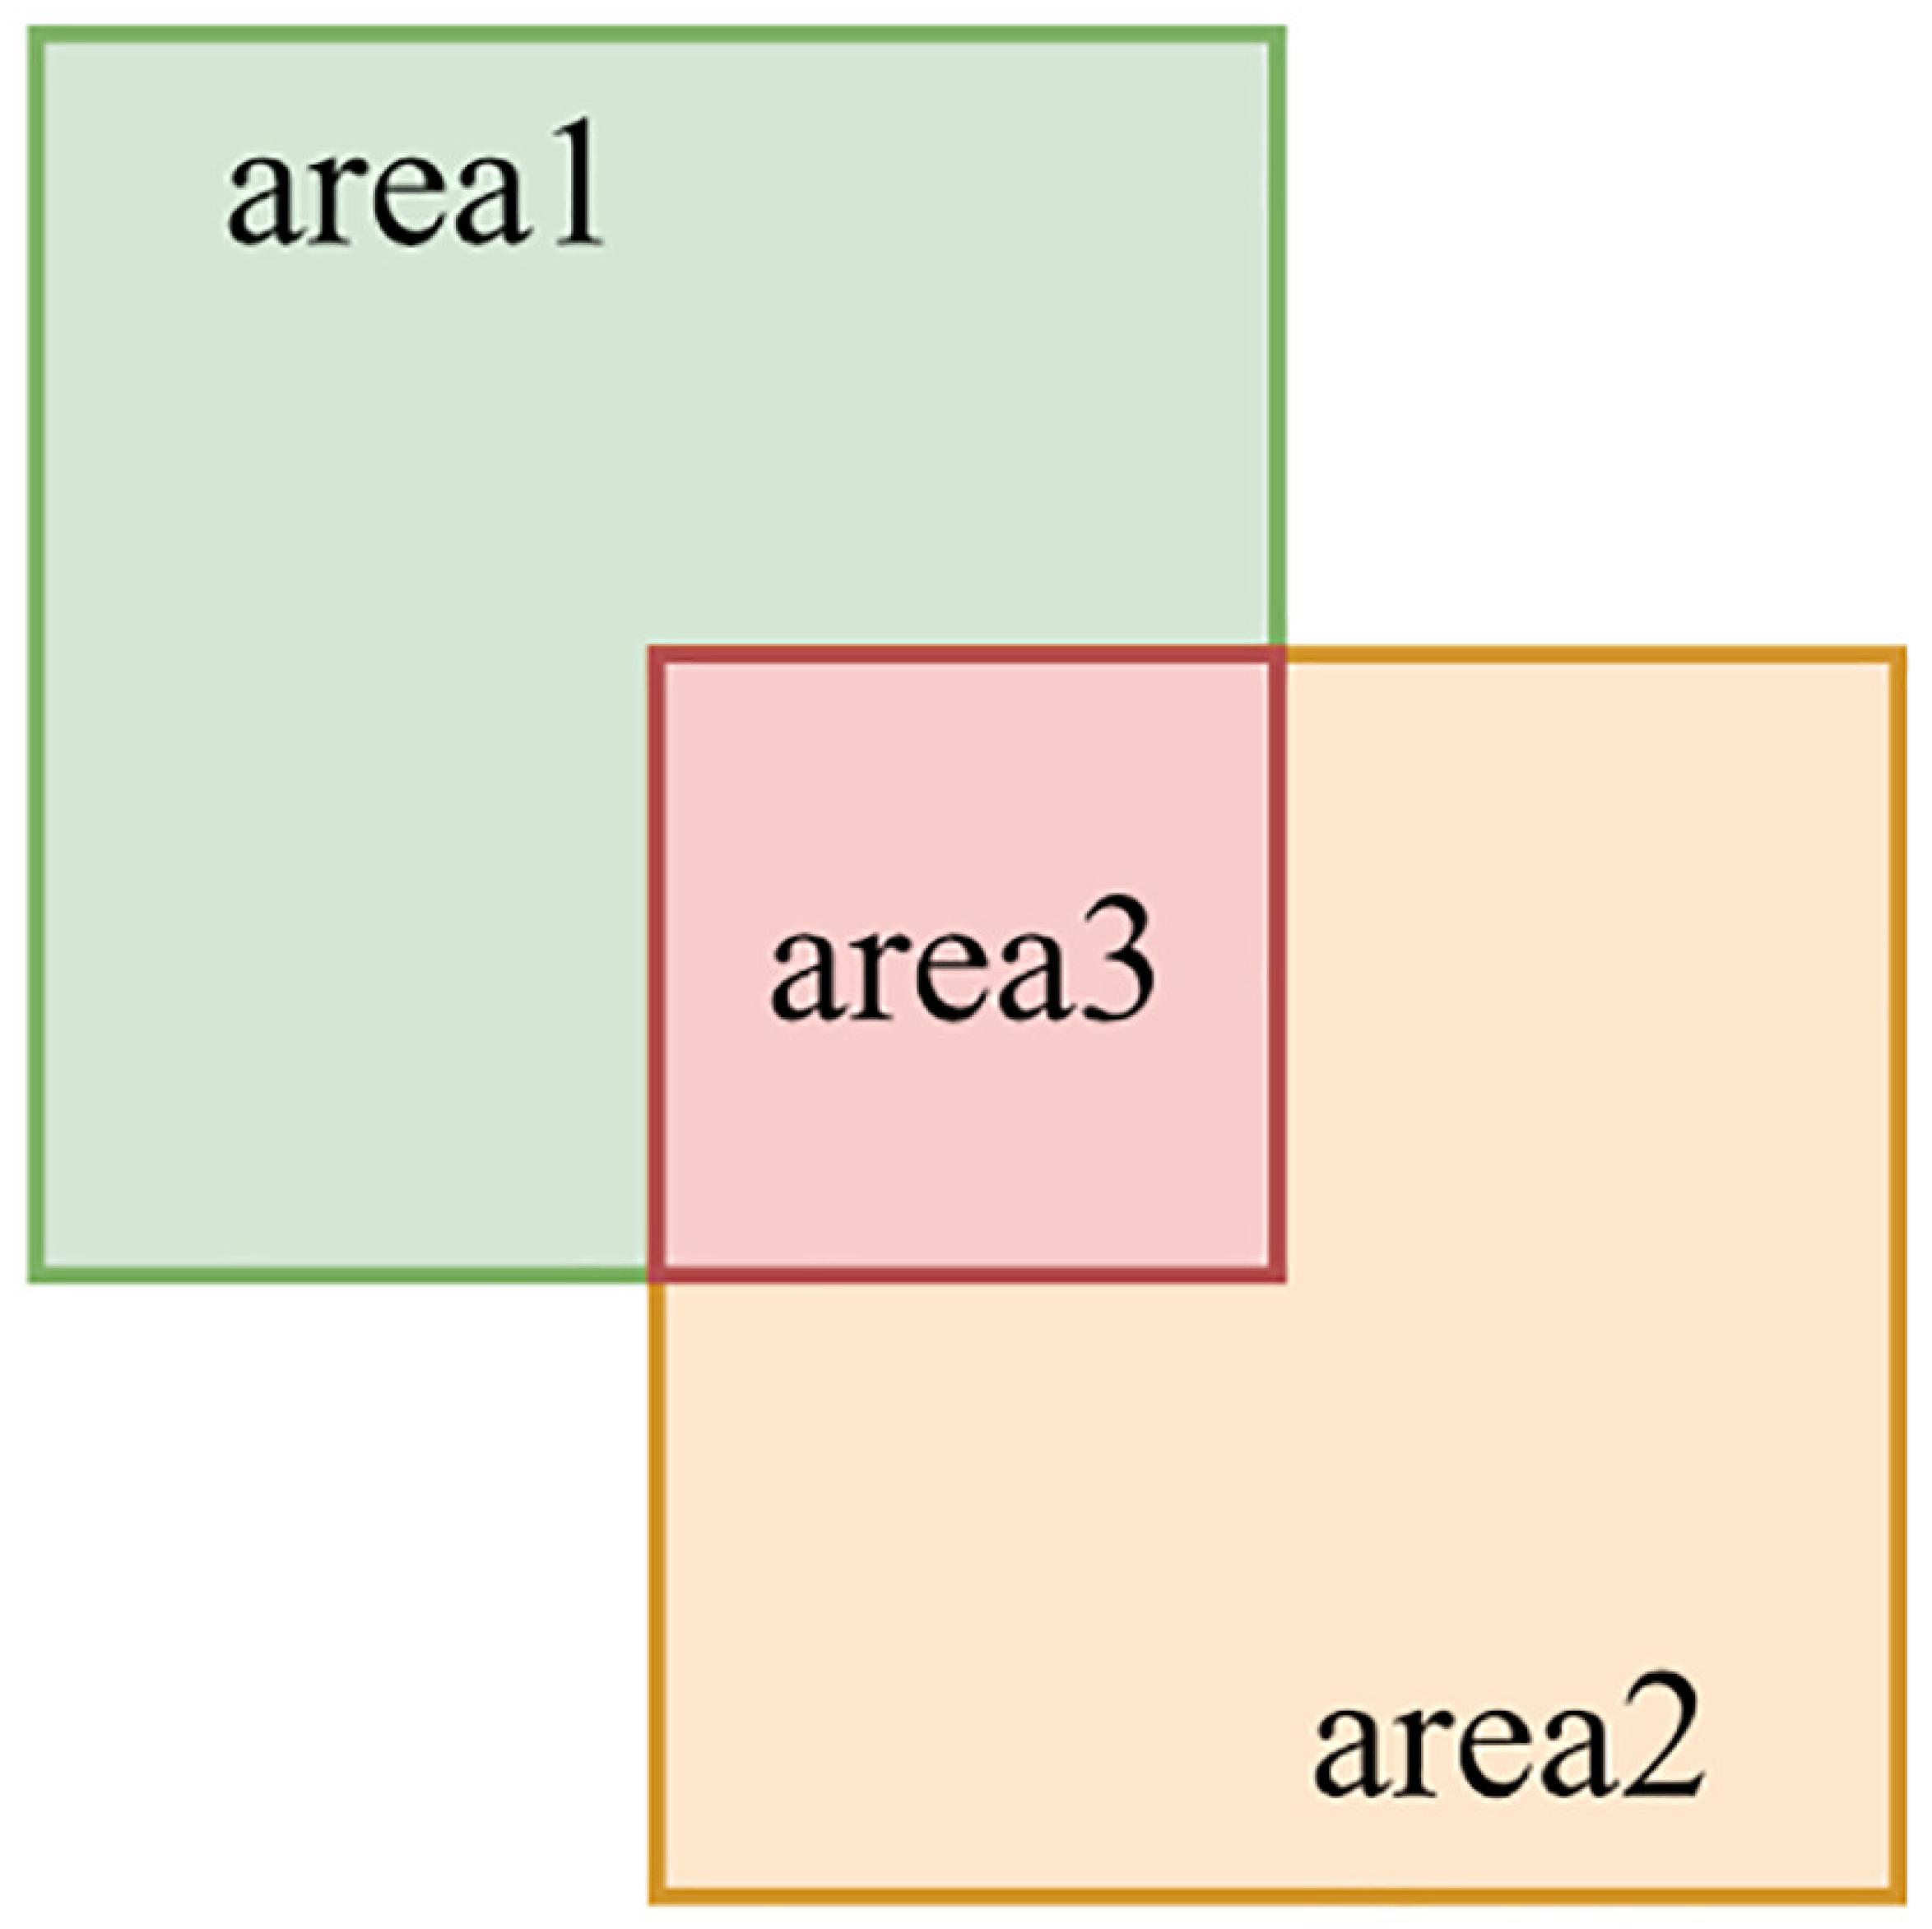
When computing the mean mAP, a crucial metric at play is intersection over union (IoU), employed to gauge the intersection extent between a detected bounding box and its corresponding ground truth bounding box. While assessing the COCO dataset, IoU thresholds, frequently set at levels like 0.5 and 0.75, come into play. If the intersection over union value between the network’s output detection box and the actual ground truth bounding box exceeds the threshold, COCO deems the detection as accurate. A comprehensive illustration of the IoU calculation process is depicted in
Figure 6.
IoU stands as a pivotal metric in evaluating the efficacy of object detection, as it gauges the alignment between the predicted detection box and the true ground truth box, thereby indicating the accuracy of the detection. This assessment is based on the comparison of the predicted detection box, denoted as
, and the actual annotated boundary box for the target, referred to as
, with their intersection represented as
. Mathematically, IoU is computed as follows:
In tandem with IoU calculation, the evaluation process also incorporates classification attributes, encompassing the counts of true positives (TPs), false positives (FPs), false negatives (FNs), and true negatives (TNs). These metrics capture the four potential scenarios that arise between the classification outcome and the actual ground truth object: (1) TPs: Detection boxes with an IoU greater than the threshold accurately represent detected objects. (2) FPs: Detection boxes lacking corresponding ground truth annotations are deemed false positives. (3) FNs: Ground truth annotations without corresponding detection boxes are classified as false negatives. (4) TNs: Instances where neither ground truth annotations nor detection boxes are present.
Drawing from these scenarios, the evaluation of precision and recall becomes feasible. Precision, also referred to as the positive predictive value, assesses the proportion of correctly identified positive instances out of all instances predicted as positive. On the other hand, recall, also known as sensitivity, measures the proportion of correctly identified positive instances out of all actual positive instances. The formulas for precision and recall computation are as follows:
Accuracy signifies the proportion of correct outcomes among all the targets predicted by the network, whereas recall indicates the proportion of correctly predicted detection boxes output by the network in comparison to all the true target annotations. In the COCO dataset, each annotated detection box is accompanied by a class confidence score. By varying the confidence score thresholds, different detection results can be generated, yielding varying accuracy and recall values, which are graphically represented in the precision–recall (P–R) curve. The preeminent metric, mean average precision (mAP), is calculated through a series of IoU thresholds spanning from 0.5 to 0.95, with increments of 0.05. The determination of mAP entails computing the precision of detection at each IoU threshold, culminating in the final mAP value.
Within the ambit of COCO’s evaluation metrics, there exists an element that computes precision based on target size. The COCO dataset classifies targets into three size categories: large, medium, and small, contingent on the area of their authentic annotation boxes. Targets featuring an annotation pixel area exceeding are designated as large, while those below are denoted as small, and those encompassed between and are categorized as medium. In the ultimate assessment, the COCO dataset computes precision separately for these three target sizes, denoted as , , and .
4.2. Experimental Environment
The method presented in this paper is implemented using the PyTorch deep learning framework, and all experiments are carried out on an NVIDIA RTX 1080Ti GPU with 11 GB of memory. The initial learning rate for training is configured at 0.000025, and the training process employs the SGD optimizer with a momentum value of 0.9. The learning rate is subjected to an equal interval reduction strategy. The model undergoes training for a cumulative 150 epochs across the complete dataset, employing a batch size of 2 for training images.
4.3. Ablation Experiments
In contrast to existing methodologies, this paper introduces two novel modules: the enhanced feature pyramid network and the gradient density object detection classification loss function. To meticulously assess the actual efficacy of these modules in enhancing the performance of the baseline method in real-world scenarios, this study undertakes ablation experiments. The comparative reference point for these evaluations is the baseline method derived from the official implementation of Sparse R-CNN.
The results in
Table 1 highlight the enhancements achieved by incorporating the enhanced feature pyramid network and gradient density object detection classification loss function modules into the initial baseline method, Sparse R-CNN. The integration of the enhanced feature pyramid network module contributes to a 0.4% increase in average precision compared to the original Sparse R-CNN baseline. This improvement is consistent across various object scales, encompassing large, medium, and small objects. By replacing focal loss with the gradient density loss function in the baseline approach, no substantial changes are observed in the overall metrics, yet the average precision experiences a slight elevation of 0.1%. Notably, when both the enhanced feature pyramid network module and gradient density loss function are simultaneously applied to the baseline, the average precision advances by 1.1%. This translates to a 2.4% boost in precision for small-scale objects, and 0.9% and 0.3% enhancements for medium and large objects, respectively.
The adoption of the enhanced feature pyramid network module brings about a marked improvement in feature quality, positively impacting detection performance across various object scales. Furthermore, the incorporation of the gradient density loss function during training effectively reduces the model’s susceptibility to challenging small objects, resulting in enhanced detection accuracy for such objects, without compromising the performance for medium and large objects. In terms of computational efficiency, both Improvement 1 and Improvement 2 had a minor effect on the training and inference speeds of the model. Specifically, the model’s inference rate slightly decreased by 1.1 images per second, and the training time per iteration saw a marginal increase of 0.0159 s.
4.4. Comparative Experiments with Existing Methods
To validate the practical effectiveness of the proposed enhancements, a series of comparative experiments were conducted by incorporating the proposed modules into the baseline method. Subsequently, these enhanced methods were systematically compared against several state-of-the-art object detection approaches, all evaluated on the four widely used benchmark datasets. The obtained validation results unequivocally demonstrate that the proposed method surpassed the performance of these existing advanced methods.
Table 2 presents the performance comparison on the COCO 2017 dataset, where the enhancements proposed in this study were rigorously assessed against prominent 2021 methods, including YOLOX, YOLOF, and Deformable DETR. The observed improvements in average precision were substantial, with increments of 0.3%, 0.1%, and 0.4% for the aforementioned methods, respectively. Furthermore,
Table 3 reveals the outcome of the enhancements on the COCO 2014 dataset. The proposed improvements exhibited remarkable average precision boosts of 0.7% and 0.6% when juxtaposed with the YOLOX and YOLOF methods proposed in 2021. Additionally, a 0.1% enhancement was achieved when compared to Deformable DETR. These comparisons illustrate the potency of the introduced enhancements in enhancing object detection accuracy.
The superiority of the proposed method is evident from the results displayed in
Table 4 on the Pascal VOC 2007 dataset. Against Deformable DETR, YOLOF, and YOLOX, the method introduced in this paper exhibited remarkable average precision enhancements of 0.4%, 0.6%, and 0.7%, respectively. Notably, in terms of accuracy for detecting large objects, the proposed method outperformed YOLOX by a substantial margin of 1.9%. Moreover, when benchmarked against Dynamic R-CNN, DETR, and CentriPetalNet, the enhancements showcased their prowess by delivering substantial average precision improvements of 2.4%, 2.3%, and an impressive 4.0%, respectively. This compelling comparison demonstrates the considerable advancements introduced by the proposed method across multiple evaluation metrics.
Table 5 reveals the compelling performance of the proposed method on the Pascal VOC 2012 dataset. Compared to YOLOX, YOLOF, and Deformable DETR, the method introduced in this paper excelled, with average precision improvements of 0.2%, 0.7%, and 0.1%, respectively. When placed against Dynamic R-CNN, DETR, and CentriPetalNet, the proposed method boasted impressive enhancements of 1.9%, 2.4%, and a notable 3.7% in terms of average precision. The results illustrate that the proposed method not only exhibited slight yet consistent improvements in average detection precision and detection recall metrics for various object sizes when compared to advanced methods like Deformable DETR and YOLOX, but it also outperformed Dynamic R-CNN, DETR, and CentriPetalNet, reaffirming its superiority across diverse evaluation metrics.
In summary, our characterization of “superior performance” is based on improvements over the baseline model’s results within the specific domain of image object detection.
- (1)
Benchmark and context: When referring to our results as “superior performance”, we take into account the benchmark and context in which our evaluation is conducted. Our research aims to enhance image object detection methods, and our proposed techniques achieve significant improvements over existing approaches. While the absolute value of 51% AP may not seem extraordinarily high in a broader context, it represents a noteworthy advancement within the specific domain of image object detection, which typically involves numerous challenges, including diverse object sizes, scales, and varying degrees of complexity.
- (2)
Superiority over baseline: We compare our approach with a baseline model, which is often a standard practice in the field of computer vision. By demonstrating an improvement from the baseline model’s performance, we highlight the effectiveness of our proposed methodologies. Our experiments are carried out in the same training/testing data setting, ensuring a fair evaluation.
- (3)
Impact of data variability: Data variability can indeed affect model performance. To address this concern, our experimentation is designed to include a diverse range of object classes, sizes, and complexities, which often reflect real-world scenarios. We understand that by changing the dataset, the performance might vary, and it could be an interesting direction for future research.
4.5. Visualization Results
This subsection presents the visualization results obtained from the COCO 2017, COCO 2014, Pascal VOC 2007, and Pascal VOC 2012 datasets. Among them,
Figure 7 provides a visual representation of the outcomes achieved by this work on the COCO 2017 dataset. In the first row of visual comparison results, the baseline method succeeds in detecting human targets and three bird targets, albeit missing the handbag. However, with the improved model, the detection of the handbag is accomplished without any adverse impact on the detection of other objects. Moving to the second row of visual comparison results, the baseline method can spot train cars and traffic lights, yet it overlooks the small distant bird target. Interestingly, the improved model successfully captures this overlooked target. In the third row of visual comparison results, the baseline method incorrectly identifies the camera in the bottom left corner as a water bottle and also mistakes the charger for a cellphone. However, upon evaluation with the improved model, these misclassifications are effectively rectified.
Figure 8 illustrates the visualization results of this work on the MS COCO 2014 dataset.
In the first row of results, the baseline method successfully detects the occluded teddy bear target and the sliced banana target, yet it falls short in detecting another occluded banana target. The improved method’s detection results, on the other hand, manage to successfully identify the occluded banana target. However, there are a few instances of misclassifications, such as pies being incorrectly labeled as a bowl and banana targets. Moving to the second row of results, the baseline method effectively detects the bus target and the fire hydrant target, but struggles with misclassifying several pillars behind the bus as humans. The improved method’s results rectify this misclassification. In the third row, a scenario involving extremely small targets is presented, showcasing multiple car targets. Here, the baseline method misses a substantial number of car targets, while the improved method detects more car targets when compared to the baseline. Moreover, the improved method also manages to detect the clock target that the baseline’s results display, albeit both methods exhibiting some misclassifications of bus targets. This clearly demonstrates that the incorporation of the enhanced feature pyramid module enhances the detection capability for small-scale targets while maintaining accuracy for larger and medium-sized targets.
Figure 9 provides a visual comparison of results on the VOC 2007 dataset. In the first row of results, the baseline method successfully detects the car target and the person driving the car. However, it misclassifies the billboard located next to the race track as a train target. Upon implementing the improved model, this misclassification is rectified. Shifting to the second row of results, the baseline method produces inaccurate detections, which are corrected when the improved model is utilized. Nevertheless, some misclassifications still persist, such as the incorrect labeling of a gift-wrapped target as a handbag target. Finally, in the third row of results, the baseline method encounters a notable misclassification scenario where a substantial number of fruit and biscuit targets are erroneously labeled as cake targets.
Figure 10 provides a visual comparison of results on the VOC 2012 dataset. In the first row of examples, the baseline method successfully detects the dining table, person, and chair targets. However, the car detection result in the top right corner is incorrect. The improved model corrects this misclassification and identifies additional targets, such as mobile phones, blankets, bowls, and more chairs, showcasing superior performance compared to the baseline method. Transitioning to the second row of results, the baseline method misclassifies a distant car as a bus and erroneously labels a prominent piece of clothing as a person. These misclassifications are rectified in the output of the improved model. Moving on to the third row of results, in scenarios featuring smaller distant person targets, the improved model demonstrates improved detection performance compared to the baseline method, successfully capturing more of the smaller targets.
Here, we present a comprehensive analysis of the performance variations observed when applying our proposed method to different datasets. These variations are crucial for understanding the adaptability and limitations of our approach and shedding light on the intricate interplay of dataset characteristics, specific challenges, data distribution, model adaptability, and generalization capabilities.
- (1)
Dataset characteristics: The COCO 2017 dataset and the COCO 2014 dataset differ in terms of the number of images, object categories, and scene complexity. COCO 2017 is more extensive, while COCO 2014 is a slightly smaller dataset. These differences in dataset characteristics can influence the performance due to variations in object diversity, object sizes, and scene complexities. The Pascal VOC datasets (2007 and 2012) are relatively smaller and contain fewer object categories. The smaller dataset size can make it more challenging for models to generalize, potentially affecting performance.
- (2)
Data distribution: The distribution of object sizes and object densities within images can vary significantly between datasets. COCO datasets are known for their diverse object sizes and complex scenes, while Pascal VOC datasets may have different size and density characteristics. Our method, which takes into account object density using the gradient density loss, may show variations in performance based on these distributions. Class imbalance, where some classes have more instances than others, can also impact performance. Some datasets may exhibit more pronounced class imbalances than others, leading to variations in detection performance across object categories.
- (3)
Specific challenges: Each dataset may come with its unique challenges. For example, COCO datasets may involve instances of small objects or objects with heavy occlusions, while Pascal VOC datasets may have specific challenges related to class distribution and object appearance. These dataset-specific challenges can affect detection performance.
- (4)
Adaptability of model: Our proposed approach, including the enhanced feature pyramid network and gradient density loss, is designed to improve object detection under varying conditions. However, its adaptability to different datasets depends on the specific characteristics of those datasets. The adaptability of our approach may also be influenced by the selection of hyperparameters. Fine-tuning hyperparameters for specific datasets can further enhance performance.
- (5)
Model generalization: The ability of our model to generalize across datasets is a crucial factor. Generalization depends on the diversity of the training data, the robustness of the network architecture, and the effectiveness of the proposed loss function.
The proposed image object detection approach brings several novel elements to the field:
- (1)
Enhanced feature pyramid network: The introduction of an enhanced feature pyramid network stands as a key innovation. This enhancement improves the baseline’s multi-scale feature extraction and fusion capabilities, which is crucial for accurate object detection. The reduction in information loss during feature fusion enhances the network’s ability to represent features effectively.
- (2)
Gradient density loss function: The replacement of the conventional focal loss function with the gradient density loss function is a novel contribution. This novel loss function provides a more accurate assessment of object detection classification loss, mitigating the influence of challenging samples and leading to improved detection performance.
The contributions of this work can be summarized as follows:
- (1)
Enhanced detection accuracy: The integration of the enhanced feature pyramid network and the gradient density loss function leads to a significant improvement in detection accuracy across a range of object scales and complexities. This contributes to the advancement of object detection methodologies.
- (2)
Improved multi-scale features: The proposed network architecture enhances the extraction and fusion of multi-scale features, which results in higher-quality features and overall improved detection performance. This contribution addresses a crucial aspect of object detection tasks.
- (3)
Novel loss function: The introduction of the gradient density loss function provides a novel approach to handling classification loss in object detection. By accounting for the influence of challenging samples, this loss function enhances the model’s capability to accurately classify objects.
While the proposed approach shows promising results, there are certain limitations to be considered:
- (1)
Computational overhead: Although the introduced enhancements have a minor impact on training and inference speeds, there might still be computational overhead associated with the proposed method. Further optimization might be necessary for real-time applications.
- (2)
Generalization to diverse datasets: While the proposed approach performs well on the tested benchmark datasets, its generalization to more diverse and challenging datasets remains to be validated. Different datasets may present unique challenges that could affect the method’s performance.
In the pursuit of further advancement, several avenues for future research open up:
- (1)
Domain adaptation: Exploring the adaptability of the proposed approach to domain-specific challenges, such as specific object categories or environmental conditions, could enhance its practical applicability.
- (2)
Efficiency optimization: Continued efforts to optimize the computational efficiency of the method will be valuable for real-time applications and large-scale deployments.
- (3)
Robustness testing: Evaluating the proposed approach’s robustness against occlusions, lighting variations, and other real-world challenges could provide insights into its practical viability.
- (4)
Exploration of loss functions: Further investigation into alternative loss functions or modifications to the existing ones could contribute to even more accurate and stable training processes.
- (5)
Interpretability: Exploring methods to enhance the interpretability of the model’s decisions could improve the transparency and trustworthiness of the proposed approach.


