
Characterization of Cardiac Fat in Atrial Fibrillation Patients Prior to Ablation Treatment


Abstract
:Featured Application
Abstract
1. Introduction
2. Materials and Methods
2.1. Study Population
2.2. Cardiac Magnetic Resonace Imaging Acquisition
2.3. Standard Cardiac Magnetic Resonace Imaging Assessment
2.4. Epicardial and Pericardial Fat Assessment
2.5. Statistical Analysis
3. Results
3.1. Demographics
3.2. Factors Influencing Different Cardiac Fat Parameters
3.3. Functional Parameters and Cardiac Fat
3.4. Obesity and AF Reccurrence
4. Discussion
5. Conclusions
Author Contributions
Funding
Institutional Review Board Statement
Informed Consent Statement
Data Availability Statement
Conflicts of Interest
References
- Magnussen, C.; Niiranen, T.J.; Ojeda, F.M.; Gianfagna, F.; Blankenberg, S.; Njølstad, I.; Vartiainen, E.; Sans, S.; Pasterkamp, G.; Hughes, M.; et al. Sex Differences and Similarities in Atrial Fibrillation Epidemiology, Risk Factors, and Mortality in Community Cohorts: Results From the BiomarCaRE Consortium (Biomarker for Cardiovascular Risk Assessment in Europe). Circulation 2017, 136, 1588–1597. [Google Scholar] [CrossRef] [PubMed]
- Staerk, L.; Sherer, J.A.; Ko, D.; Benjamin, E.J.; Helm, R.H. Atrial Fibrillation Epidemiology, Pathophysiology, and Clinical Outcomes. Circ. Res. 2017, 120, 1501–1517. [Google Scholar] [CrossRef]
- Vyas, V.; Lambiase, P. Obesity and Atrial Fibrillation: Epidemiology, Pathophysiology and Novel Therapeutic Opportunities. Arrhythmia Electrophysiol. Rev. 2019, 8, 28. [Google Scholar] [CrossRef] [PubMed]
- Matsumoto, C.; Ogawa, H.; Saito, Y.; Okada, S.; Soejima, H.; Sakuma, M.; Masuda, I.; Nakayama, M.; Doi, N.; Jinnouchi, H.; et al. Incidence of atrial fibrillation in elderly patients with type 2 diabetes mellitus. BMJ Open Diabetes Res. Care 2022, 10, e002745. [Google Scholar] [CrossRef]
- Lindsay, B.D.; Nalliah, C.J.; Sanders, P.; Kalman, J.M. Clinical Review Obstructive Sleep Apnea Treatment and Atrial Fibrillation: A Need for Definitive Evidence. J. Cardiovasc. Electrophysiol. 2016, 27, 1001–1010. [Google Scholar]
- Larsson, S.C.; Drca, N.; Wolk, A. Alcohol consumption and risk of atrial fibrillation: A prospective study and dose-response meta-analysis. J. Am. Coll. Cardiol. 2014, 64, 281–289. [Google Scholar] [CrossRef]
- Neefs, J.; Boekholdt, S.M.; Khaw, K.T.; Luben, R.; Pfister, R.; Wareham, N.J.; Meulendijks, E.R.; Sanders, P.; de Groot, J.R. Body Mass Index and Body Fat Distribution and New-Onset Atrial Fibrillation. Sub study of The European Prospective Investigation Into Cancer and Nutrition in Norfolk (EPIC-Norfolk) Study. Nutr. Metab. Cardiovasc. Dis. 2019, 29, 692. [Google Scholar] [CrossRef] [PubMed]
- Greif, M.; von Ziegler, F.; Wakili, R.; Tittus, J.; Becker, C.; Helbig, S.; Laubender, R.P.; Schwarz, W.; D’anastasi, M.; Schenzle, J.; et al. Increased pericardial adipose tissue is correlated with atrial fibrillation and left atrial dilatation. Clin. Res. Cardiol. 2013, 102, 555–562. [Google Scholar] [CrossRef] [PubMed]
- Verhagen, S.N.; Vink, A.; van der Graaf, Y.; Visseren, F.L.J. Coronary perivascular adipose tissue characteristics are related to atherosclerotic plaque size and composition. A post-mortem study. Atherosclerosis 2012, 225, 99–104. [Google Scholar] [CrossRef]
- Sequeira, D.I.; Ebert, L.C.; Flach, P.M.; Ruder, T.D.; Thali, M.J.; Ampanozi, G. The correlation of epicardial adipose tissue on postmortem CT with coronary artery stenosis as determined by autopsy. Forensic Sci. Med. Pathol. 2015, 11, 186–192. [Google Scholar] [CrossRef] [PubMed]
- Farias-Itao, D.S.; Pasqualucci, C.A.; Nishizawa, A.; da Silva, L.F.F.; Campos, F.M.; Bittencourt, M.S.; da Silva, K.C.S.; Leite, R.E.P.; Grinberg, L.T.; Ferretti-Rebustini, R.E.d.L.; et al. B Lymphocytes and Macrophages in the Perivascular Adipose Tissue Are Associated with Coronary Atherosclerosis: An Autopsy Study. J. Am. Heart Assoc. 2019, 8, e013793. [Google Scholar] [CrossRef] [PubMed]
- Willar, B.; Van Tran, K.; Fitzgibbons, T.P. Epicardial adipocytes in the pathogenesis of atrial fibrillation: An update on basic and translational studies. Front. Endocrinol. 2023, 14, 1154824. [Google Scholar] [CrossRef]
- Bornachea, O.; Vea, A.; Llorente-Cortes, V. Interplay between epicardial adipose tissue, metabolic and cardiovascular diseases. Clin. Investig. Arterioscler. 2018, 30, 230–239. [Google Scholar] [PubMed]
- Nakanishi, K.; Fukuda, S.; Tanaka, A.; Otsuka, K.; Taguchi, H.; Shimada, K. Relationships between Periventricular Epicardial Adipose Tissue Accumulation, Coronary Microcirculation, and Left Ventricular Diastolic Dysfunction. Can. J. Cardiol. 2017, 33, 1489–1497. [Google Scholar] [CrossRef]
- Hogea, T.; Noemi, N.; Suciu, B.A.; Brinzaniuc, K.; Chinezu, L.; Arbănași, E.M.; Kaller, R.; Carașca, C.; Arbănași, E.M.; Vunvulea, V.; et al. Increased Epicardial Adipose Tissue and Heart Characteristics Are Correlated with BMI and Predict Silent Myocardial Infarction in Sudden Cardiac Death Subjects: An Autopsy Study. Diagnostics 2023, 13, 2157. [Google Scholar] [CrossRef] [PubMed]
- Hogea, T.; Suciu, B.A.; Ivănescu, A.D.; Carașca, C.; Chinezu, L.; Arbănași, E.M.; Eliza, R.; Kaller, R.; Arbănași, E.M.; Muresan, A.V.; et al. Increased Epicardial Adipose Tissue (EAT), Left Coronary Artery Plaque Morphology, and Valvular Atherosclerosis as Risks Factors for Sudden Cardiac Death from a Forensic Perspective. Diagnostics 2023, 13, 142. [Google Scholar] [CrossRef]
- Shah, R.V.; Anderson, A.; Ding, J.; Budoff, M.; Rider, O.; Petersen, S.E.; Jensen, M.K.; Koch, M.; Allison, M.; Kawel-Boehm, N.; et al. Pericardial, But Not Hepatic, Fat by CT Is Associated with CV Outcomes and Structure: The Multi-Ethnic Study of Atherosclerosis. JACC Cardiovasc. Imaging 2017, 10, 1016–1027. [Google Scholar] [CrossRef]
- Al-Rawahi, M.; Proietti, R.; Thanassoulis, G. Pericardial fat and atrial fibrillation: Epidemiology, mechanisms and interventions. Int. J. Cardiol. 2015, 195, 98–103. [Google Scholar] [CrossRef]
- Daudé, P.; Ancel, P.; Gouny, S.C.; Jacquier, A.; Kober, F.; Dutour, A.; Bernard, M.; Gaborit, B.; Rapacchi, S. Deep-Learning Segmentation of Epicardial Adipose Tissue Using Four-Chamber Cardiac Magnetic Resonance Imaging. Diagnostics 2022, 12, 126. [Google Scholar] [CrossRef]
- Kramer, C.M.; Barkhausen, J.; Bucciarelli-Ducci, C.; Flamm, S.D.; Kim, R.J.; Nagel, E. Standardized cardiovascular magnetic resonance imaging (CMR) protocols: 2020 update. J. Cardiovasc. Magn. Reason. 2020, 22, 17. [Google Scholar] [CrossRef]
- Batal, O.; Schoenhagen, P.; Shao, M.; Ayyad, A.E.; Van Wagoner, D.R.; Halliburton, S.S.; Tchou, P.J.; Chung, M.K. Left atrial epicardial adiposity and atrial fibrillation. Circ. Arrhythm. Electrophysiol. 2010, 3, 230–236. [Google Scholar] [CrossRef] [PubMed]
- Wu, Y.; Zhang, A.; Hamilton, D.J.; Deng, T. Epicardial Fat in the Maintenance of Cardiovascular Health. Methodist Debakey Cardiovasc. J. 2017, 13, 20. [Google Scholar] [CrossRef]
- Mazurek, T.; Kiliszek, M.; Kobylecka, M.; Skubisz-Głuchowska, J.; Kochman, J.; Filipiak, K.; Królicki, L.; Opolski, G. Relation of Proinflammatory Activity of Epicardial Adipose Tissue to the Occurrence of Atrial Fibrillation. Am. J. Cardiol. 2014, 113, 1505–1508. [Google Scholar] [CrossRef] [PubMed]
- Couselo-Seijas, M.; Rodríguez-Mañero, M.; González-Juanatey, J.R.; Eiras, S. Updates on epicardial adipose tissue mechanisms on atrial fibrillation. Obes. Rev. 2021, 22, e13277. [Google Scholar] [CrossRef]
- Singhal, R.; Lo, L.-W.; Lin, Y.-J.L.; Chang, S.-L.; Hu, Y.-F.; Chao, T.-F.; Chung, F.-P.; Chiou, C.-W.; Tsao, H.-M.; Chen, S.-A. Intrinsic Cardiac Autonomic Ganglionated Plexi within Epicardial Fats Modulate the Atrial Substrate Remodeling: Experiences with Atrial Fibrillation Patients Receiving Catheter Ablation. Acta Cardiol. Sin. 2016, 32, 174–184. Available online: http://www.ncbi.nlm.nih.gov/pubmed/4816916 (accessed on 30 October 2023).
- Avazzadeh, S.; McBride, S.; O’brien, B.; Coffey, K.; Elahi, A.; O’halloran, M.; Soo, A.; Quinlan, L. Ganglionated Plexi Ablation for the Treatment of Atrial Fibrillation. J. Clin. Med. 2020, 9, 3081. [Google Scholar] [CrossRef] [PubMed]
- Wong, C.X.; Abed, H.S.; Molaee, P.; Nelson, A.J.; Brooks, A.G.; Sharma, G.; Leong, D.P.; Lau, D.H.; Middeldorp, M.E.; Roberts-Thomson, K.C.; et al. Pericardial Fat Is Associated with Atrial Fibrillation Severity and Ablation Outcome. J. Am. Coll. Cardiol. 2011, 57, 1745–1751. [Google Scholar] [CrossRef]
- Camhi, S.M.; Bray, G.A.; Bouchard, C.; Greenway, F.L.; Johnson, W.D.; Newton, R.L.; Ravussin, E.; Ryan, D.H.; Smith, S.R.; Katzmarzyk, P.T. The Relationship of Waist Circumference and BMI to Visceral, Subcutaneous, and Total Body Fat: Sex and Race Differences. Obesity 2011, 19, 402. [Google Scholar] [CrossRef]
- Gill, C.M.; Azevedo, D.C.; Oliveira, A.L.; Martinez-Salazar, E.L.; Torriani, M.; Bredella, M.A. Sex differences in pericardial adipose tissue assessed by PET/CT and association with cardiometabolic risk. Acta Radiol. 2018, 59, 1203–1209. [Google Scholar] [CrossRef]
- Zhu, J.; Zhuo, K.; Zhang, B.; Xie, Z.; Li, W. Sex Differences in Epicardial Adipose Tissue: Association with Atrial Fibrillation Ablation Outcomes. Front. Cardiovasc. Med. 2022, 9, 905351. [Google Scholar] [CrossRef]
- Conte, M.; Petraglia, L.; Poggio, P.; Valerio, V.; Cabaro, S.; Campana, P.; Comentale, G.; Attena, E.; Russo, V.; Pilato, E.; et al. Inflammation and Cardiovascular Diseases in the Elderly: The Role of Epicardial Adipose Tissue. Front. Med. 2022, 9, 844266. [Google Scholar] [CrossRef]
- Nerlekar, N.; Muthalaly, R.G.; Wong, N.; Thakur, U.; Wong, D.T.L.; Brown, A.J.; Marwick, T.H. Association of volumetric epicardial adipose tissue quantification and cardiac structure and function. J. Am. Heart Assoc. 2018, 7, e009975. [Google Scholar] [CrossRef]
- Fox, C.S.; Gona, P.; Hoffmann, U.; Porter, S.A.; Salton, C.J.; Massaro, J.M.; Levy, D.; Larson, M.G.; D’Agostino, R.B.; O’Donnell, C.J.; et al. Pericardial Fat, Intrathoracic Fat, and Measures of Left Ventricular Structure and Function. Circulation 2009, 119, 1586–1591. [Google Scholar] [CrossRef]
- Patel, N.; Durland, J.; Makaryus, A.N. Physiology, Cardiac Index; StatPearls: St. Petersburg, FL, USA, 2022. [Google Scholar]
- Iacobellis, G. Epicardial adipose tissue in contemporary cardiology. Nat. Rev. Cardiol. 2022, 19, 593–606. [Google Scholar] [CrossRef] [PubMed]
- Conte, M.; Petraglia, L.; Cabaro, S.; Valerio, V.; Poggio, P.; Pilato, E.; Attena, E.; Russo, V.; Ferro, A.; Formisano, P.; et al. Epicardial Adipose Tissue and Cardiac Arrhythmias: Focus on Atrial Fibrillation. Front. Cardiovasc. Med. 2022, 9, 932262. [Google Scholar] [CrossRef] [PubMed]
- Bakkum, M.J.; Danad, I.; Romijn, M.A.J.; Stuijfzand, W.J.A.; Leonora, R.M.; Tulevski, I.I.; Somsen, G.A.; Lammertsma, A.A.; van Kuijk, C.; van Rossum, A.C.; et al. The impact of obesity on the relationship between epicardial adipose tissue, left ventricular mass and coronary microvascular function. Eur. J. Nucl. Med. Mol. Imaging 2015, 42, 1562. [Google Scholar] [CrossRef] [PubMed]

| BMI | Normal (n = 45) | Overweight (n = 79) | Obese (n = 74) | p-Value |
|---|---|---|---|---|
| Demographics | ||||
| Age (years) | 56.1 (±12.1) | 60.0 (±9.5) | 57.4 (±10.4) | 0.071 |
| Sex n (% men) | 31 (15.5%) | 56 (28.0%) | 57 (28.5%) | 0.187 |
| Sex n (% women) | 14 (7.0%) | 23 (11.5%) | 17 (8.5%) | |
| Height (cm) | 178.6 (±8.5) | 177.3 (±10.2) | 177.4 (±9.8) | 0.265 |
| Weight (Kg) | 73.4 (±8.1) † | 85.9 (±10.7) ‡ | 107.1 (±15.3) # | <0.001 ** |
| Body Mass Index, BMI (kg/m2) | 23.0 (±1.4) † | 27.2 (±1.5) ‡ | 34.0 (±3.2) # | <0.001 ** |
| Body Surface Area, BSA (m2) a | 1.9 (±0.1) † | 2.1 (±0.2) ‡ | 2.3 (±0.2) # | <0.001 ** |
| Smoke b | 1 (±1) | 1 (±1) | 2 (±1) | 0.327 |
| Caffeine c | 3 (±1) | 4 (±1) | 4 (±1) | 0.111 |
| Alcohol d | 3 (±1) | 3 (±1) | 3 (±1) | 0.069 |
| Comorbidities | ||||
| Diabetes | 0 | 3 (75%) | 1 (25%) | 0.333 |
| Hypertension e | 3 (5.5% | 19 (34.6%) | 27 (49.1%) | 0.086 |
| Hypercholesteremia | 1 (3.9%) † | 11 (42.3%) | 13 (50%) # | 0.001 * |
| Stroke Risk Score | ||||
| CHA2DS2-VASc Score | 1.4 (±0.9) | 1.7 (±1.0) | 1.8 (±1.01) | 0.059 |
| Score 0 (n) | 6 | 6 | 6 | |
| Score 1 (n) | 20 | 29 | 29 | |
| Score 2 (n) | 14 | 27 | 22 | |
| Score 3 (n) | 4 | 12 | 11 | |
| Score 4 (n) | 1 | 4 | 5 | |
| Score 5 (n) | 0 | 1 | 1 | |
| Medications | ||||
| Anti-arrhythmic | 15 (7.5%) † | 47 (23.5%) | 43 (21.5%) # | 0.004 * |
| Anti-coagulant | 37 (18.5%) | 69 (34.5%) | 60 (30%) | 0.182 |
| Beta-blocker | 26 (13%) | 47 (23.5%) | 45 (22.5%) | 0.316 |
| ACE inhibitor or ARB | 7 (3.5%) | 20 (10%) | 29 (14.5%) # | 0.005 * |
| Statins | 8 (4%) | 22 (11%) | 19 (9.5%) | 0.149 |
| Non-dihydropyridine calcium channel blocker | 5 (2.5%) | 20 (10%) ‡ | 7 (3.5%) | 0.006 * |
| Lab results | ||||
| Total cholesterol (mmol/L) | 4.5 (±0.9) | 4.7 (±1.3) | 4.6 (±1.1) | 0.314 |
| Low-density lipoprotein, LDL (mmol/L) | 2.4 (±0.6) | 2.7 (±1.0) | 2.7 (±0.9) | 0.233 |
| High-density lipoprotein, HDL (mmol/L) | 1.5 (±0.4) | 1.3 (±0.5) | 1.2 (±0.3) # | 0.038 * |
| Triglycerides, TG (mmol/L) | 1.3 (±0.6) | 1.7 (±0.8) | 1.6 (±0.7) | 0.129 |
| Normal (n = 45) | Overweight (n = 79) | Obese (n = 74) | p-Value | |
|---|---|---|---|---|
| Epicardial Adipose Tissue (EAT) | ||||
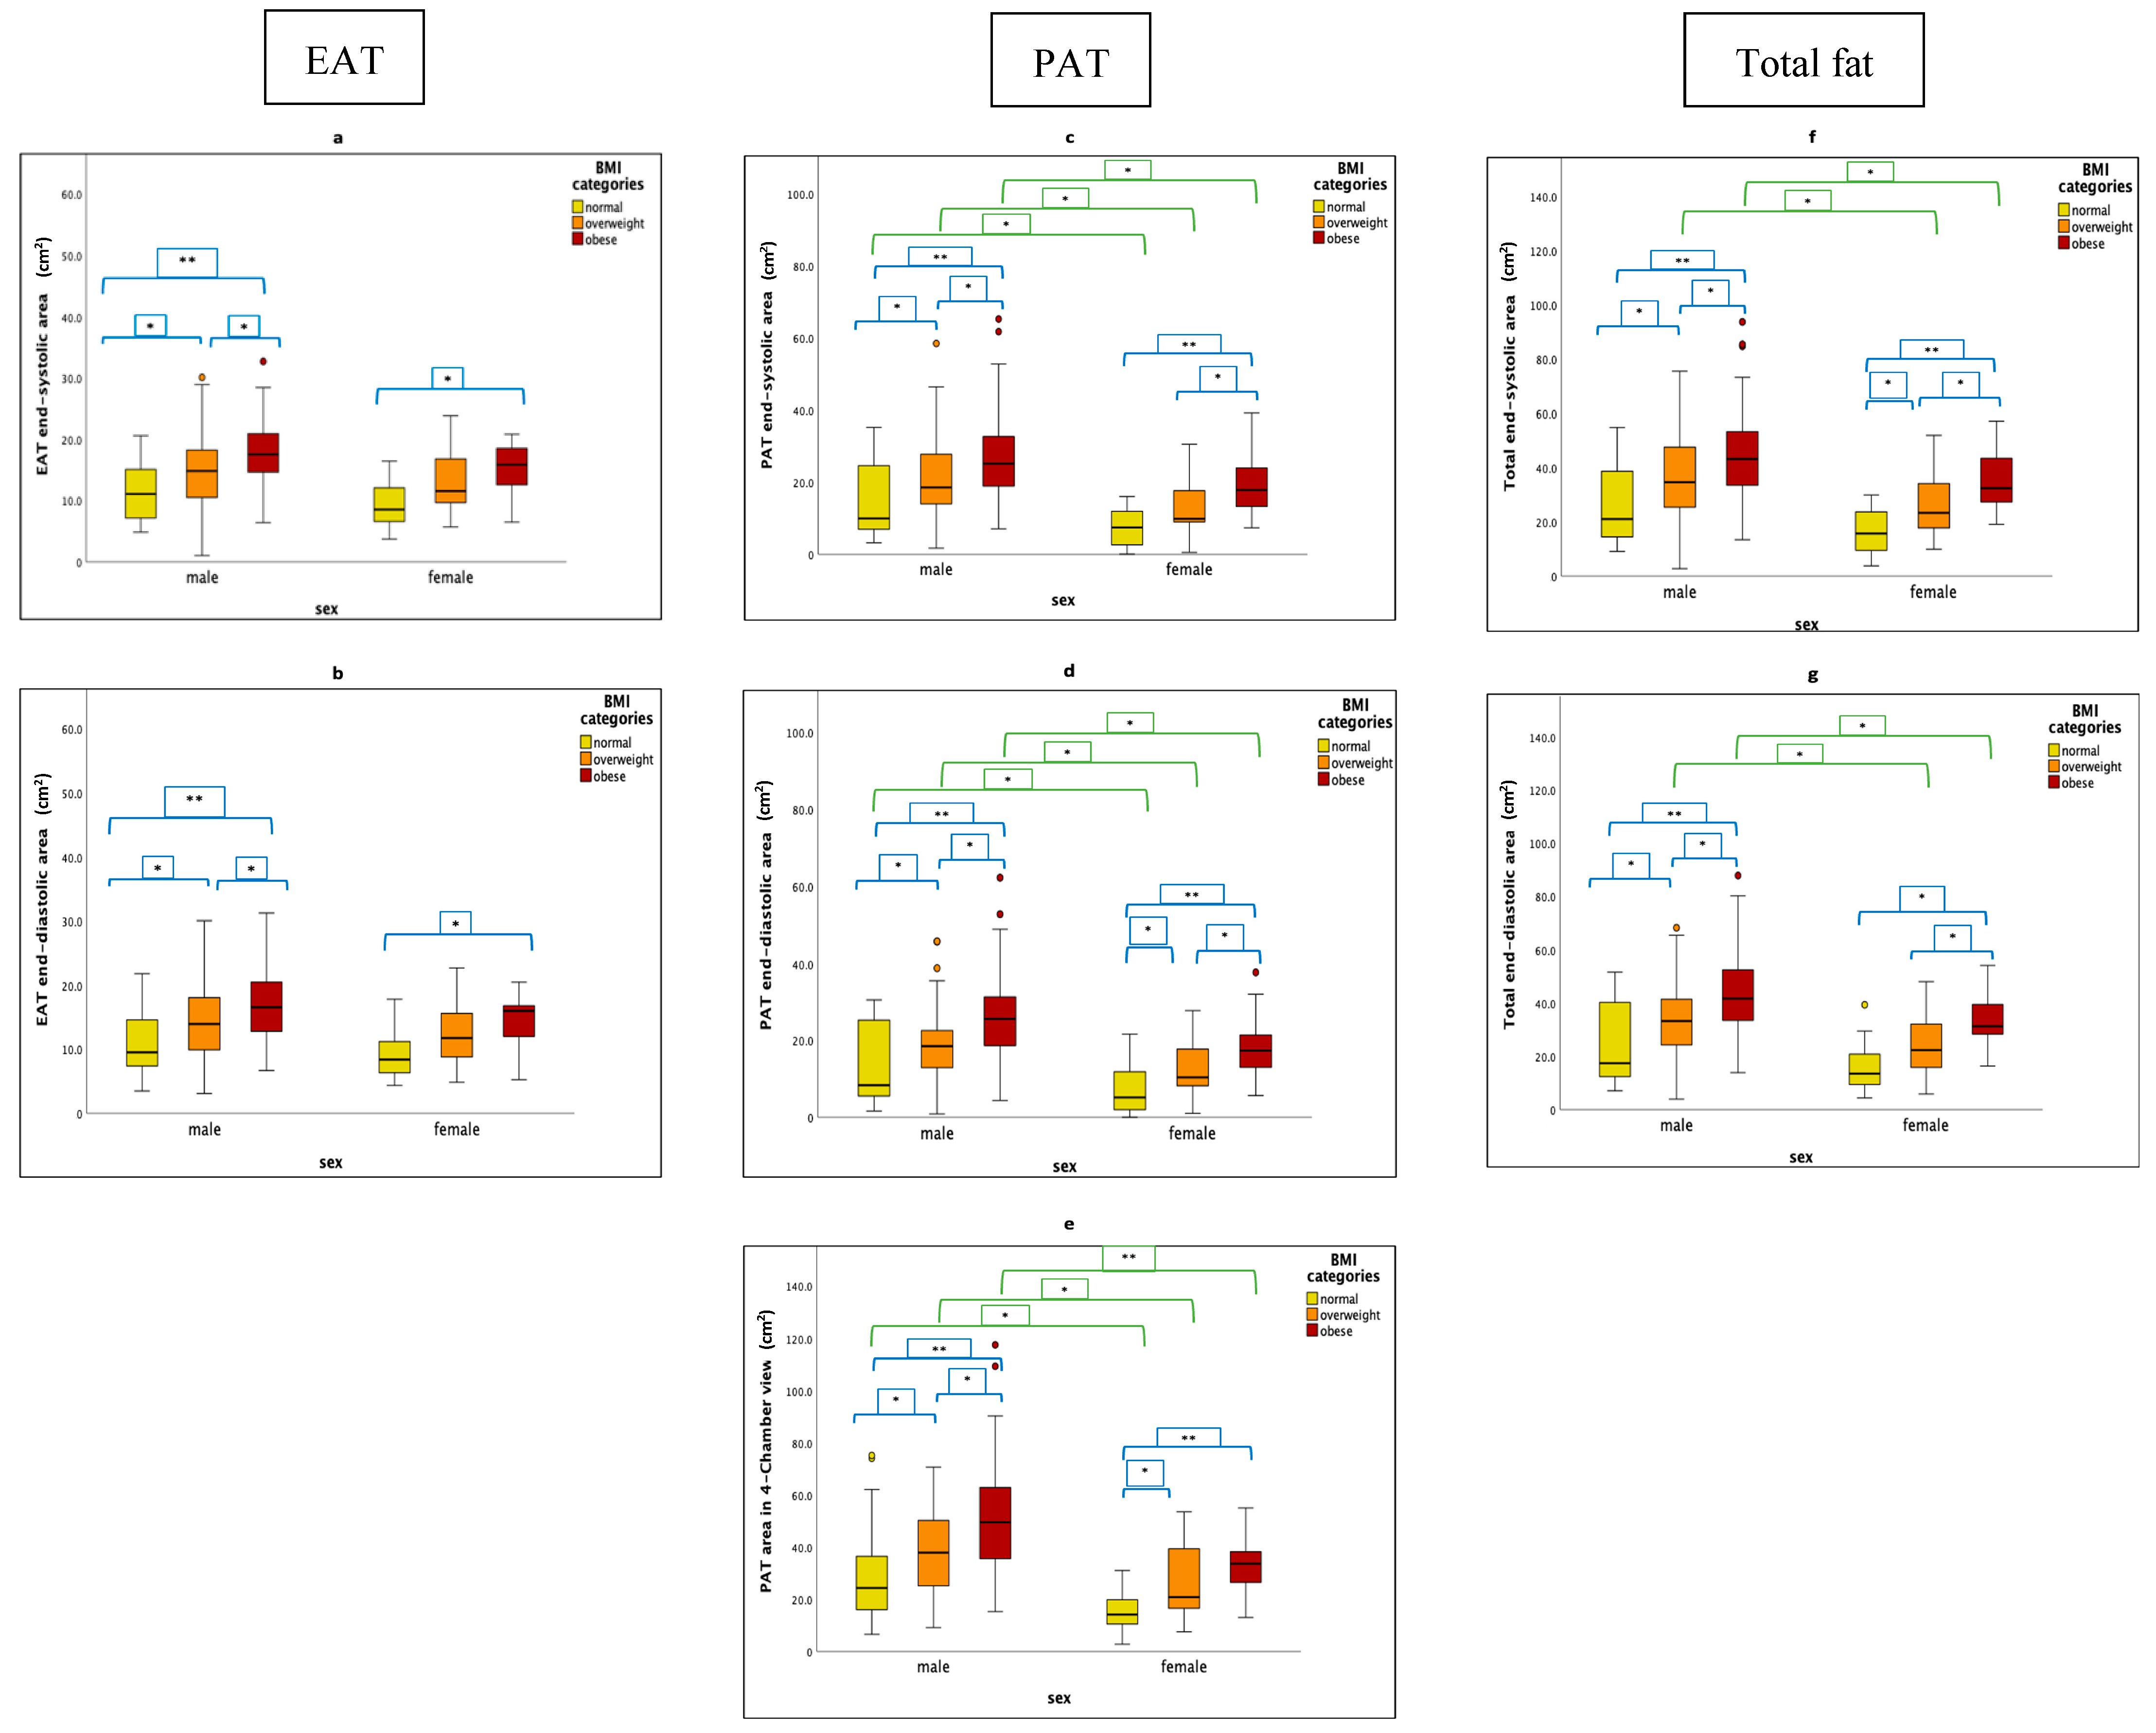
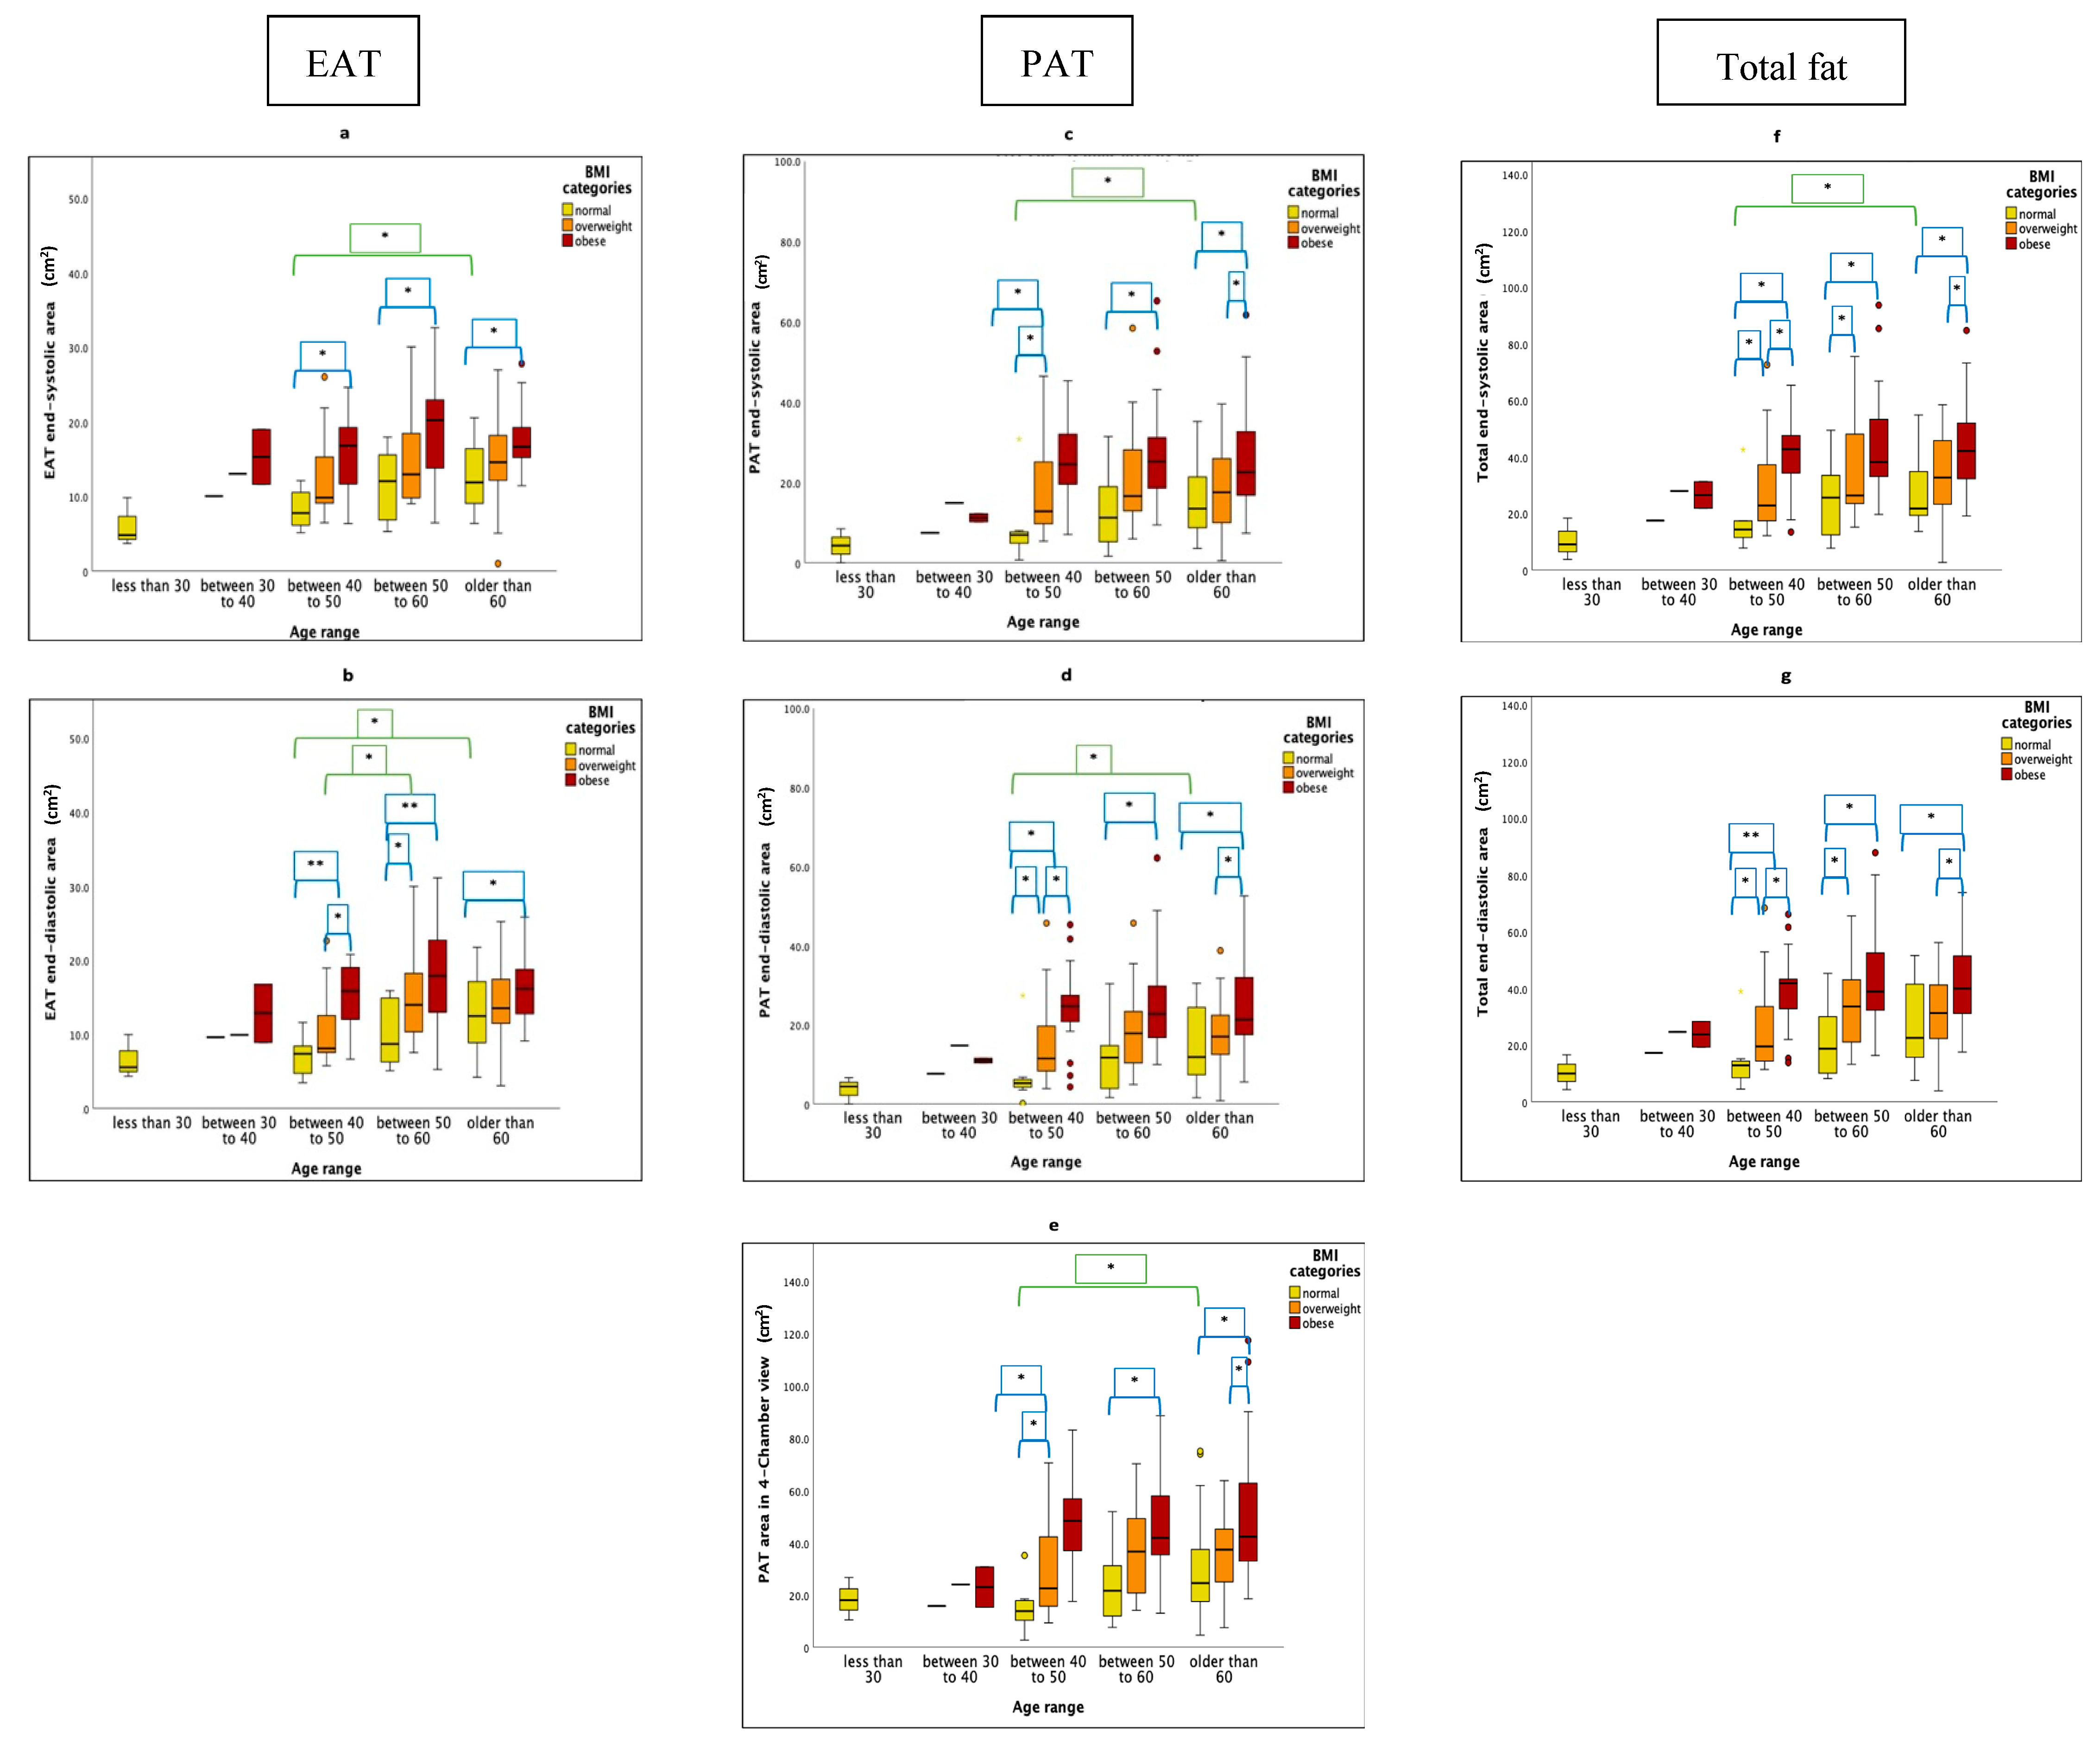
| EAT End-systolic area (cm2) | 10.8 (±4.5) † | 14.7 (±5.7) ‡ | 17.6 (±5.1) # | <0.001 ** |
| EAT End-diastolic area (cm2) | 10.4 (±4.8) † | 13.9 (±5.7) ‡ | 16.5 (±4.9) # | <0.001 ** |
| Pericardial Adipose Tissue (PAT) | ||||
| PAT Area in 4-Chamber view (cm2) | 24.9 (±17.6) † | 35.2 (±16.6) ‡ | 48.1 (±21.7) # | <0.001 ** |
| PAT End-systolic area (cm2) | 12.8 (±9.8) † | 18.9 (±10.7) ‡ | 25.6 (±12.2) # | <0.001 ** |
| PAT End-diastolic area (cm2) | 11.8 (±9.8) † | 17.7 (±9.6) ‡ | 24.5 (±11.5) # | <0.001 ** |
| Total cardiac fat (EAT + PAT) | ||||
| Total end-systolic area (cm2) | 23.6 (±13.8) † | 33.6 (±15.6) ‡ | 43.1 (±16.2) # | <0.001 ** |
| Total end-diastolic area (cm2) | 22.1 (±14.12) † | 31.6 (±14.5) ‡ | 40.9 (±15.2) # | <0.001 ** |
| BMI | Age Ranges a | Sex b | |
|---|---|---|---|
| Epicardial Adipose Tissue (EAT) | |||
| EAT End-systolic area (cm2) | 0.389 **, <0.001 | 0.172 *, 0.016 | −0.167 *, 0.20 |
| EAT End-diastolic area (cm2) | 0.429 **, <0.001 | 0.190 **, 0.008 | −0.168 *, 0.019 |
| Pericardial Adipose Tissue (PAT) | |||
| PAT Area in 4-Chamber view (cm2) | 0.434 **, <0.001 | NS | −0.331 **, <0.001 |
| PAT End-systolic area (cm2) | 0.434 **, <0.001 | NS | −0.296 **, <0.001 |
| PAT End-diastolic area (cm2) | 0.432 **, <0.001 | NS | −0.282 **, <0.001 |
| Total cardiac fat (EAT + PAT) | |||
| Total end-systolic area (cm2) | 0.458 **, <0.001 | NS | −0.267 **, <0.001 |
| Total end-diastolic area (cm2) | 0.443 **, <0.001 | 0.145 *, 0.043 | −0.258 **, <0.001 |
| BMI | Normal (n = 45) | Overweight (n = 79) | Obese (n = 74) | p-Value |
|---|---|---|---|---|
| Left Ventricle (LV) | ||||
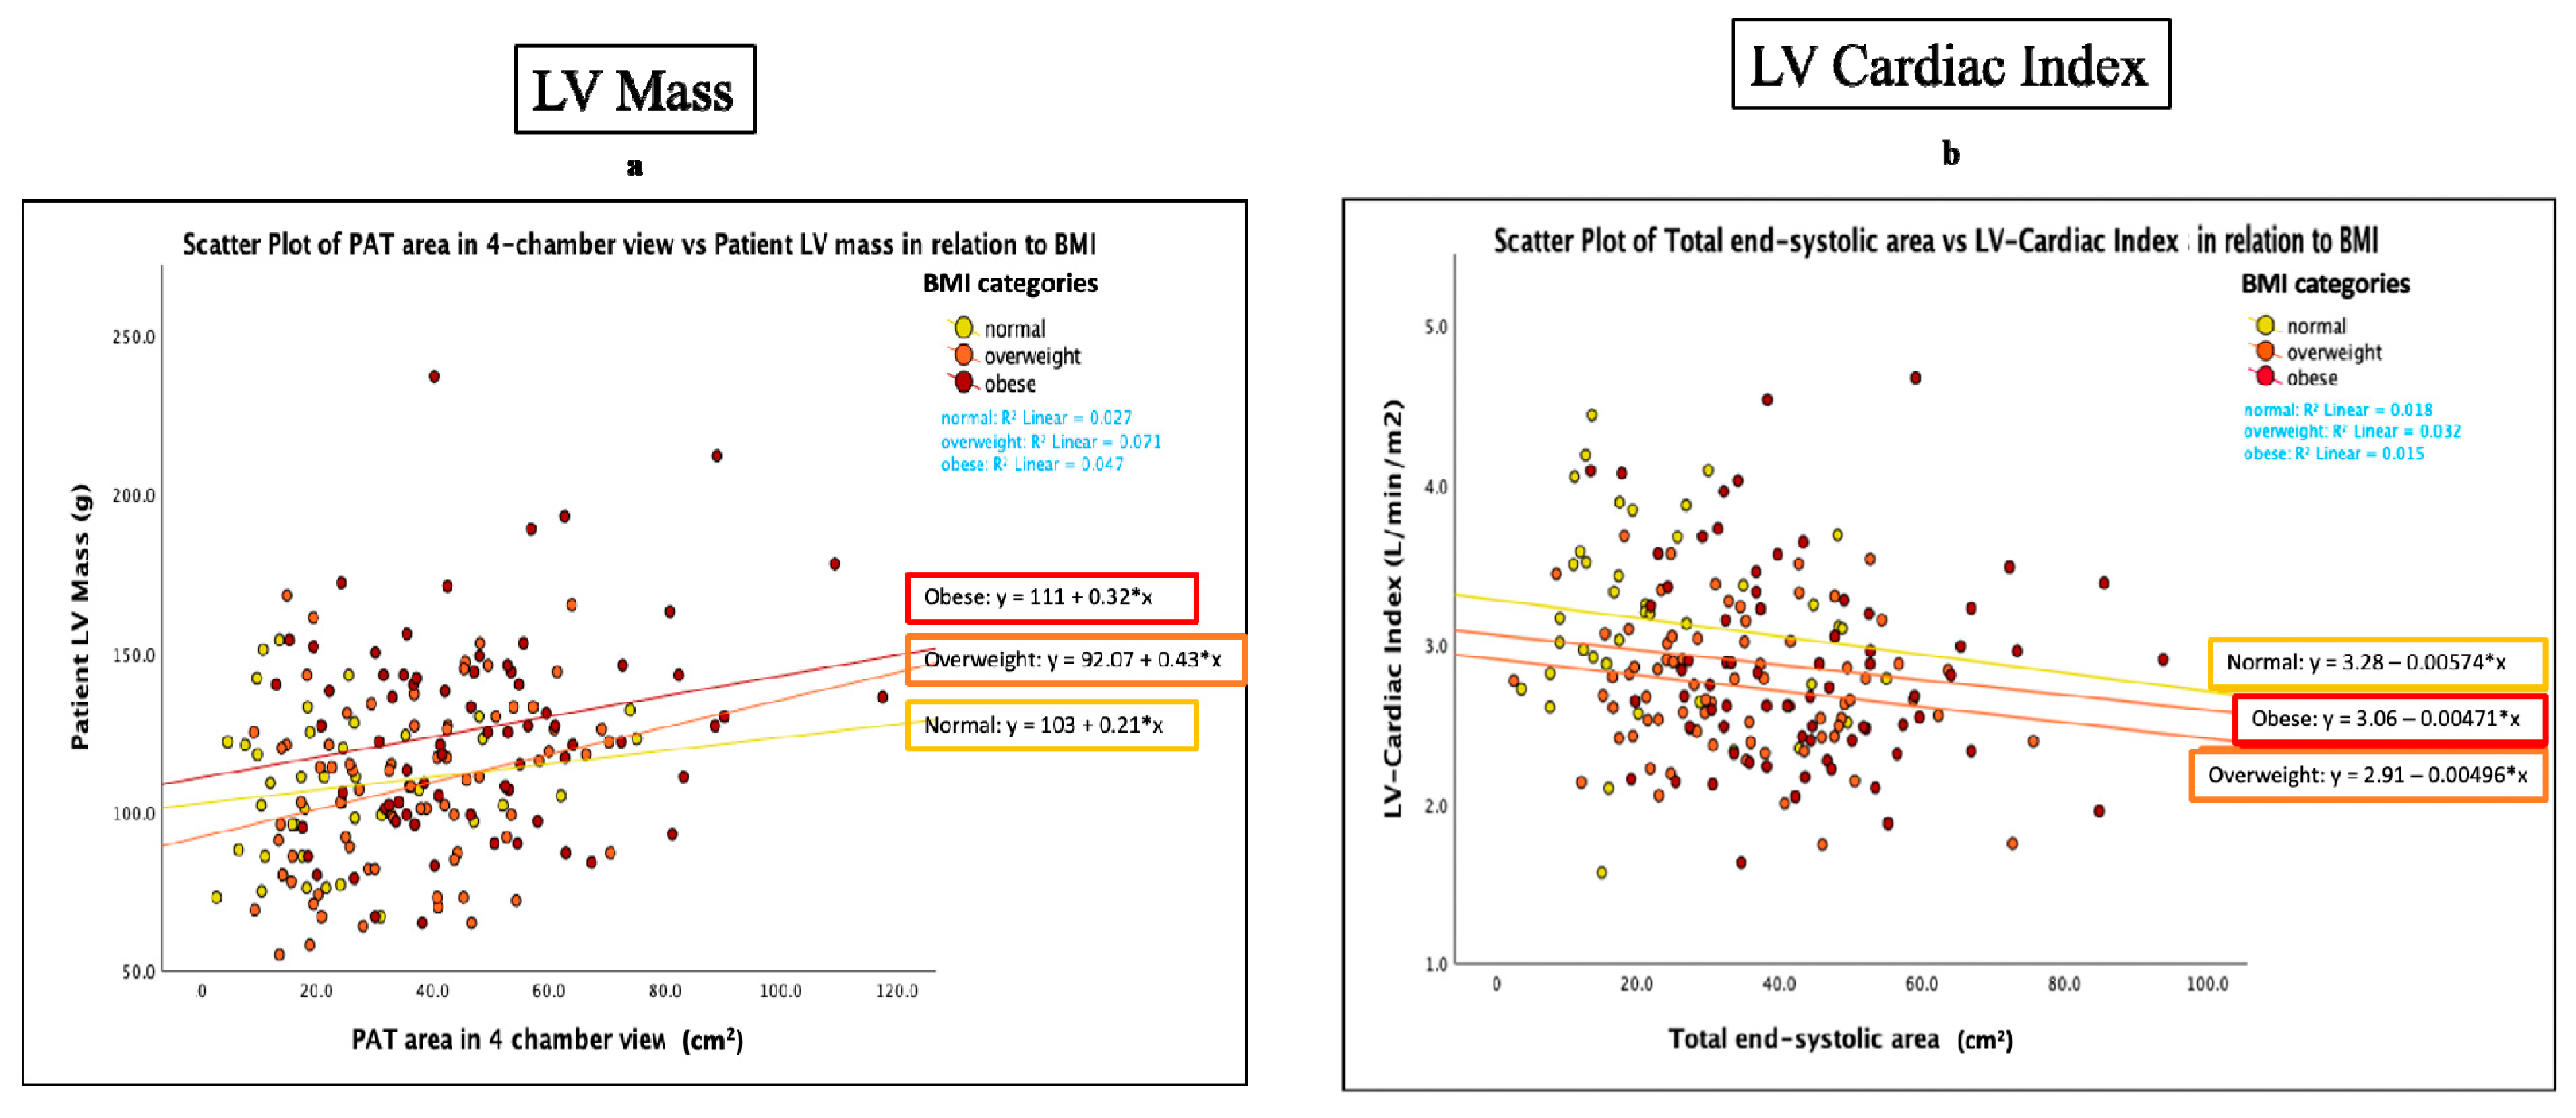
| LV-EDV (mL) | 161.7 (±31.8) | 161.7 (±30.5) ‡ | 177.4 (±38.0) # | <0.001 ** |
| LV-ESV (mL) | 62.9 (±17.8) | 65.2 (±18.7) ‡ | 71.8 (±20.5) # | 0.01 * |
| LV-Mass (g) | 107.0 (±21.8) | 107.6 (±26.6) ‡ | 126.2 (±32.6) # | <0.001 ** |
| LV-EF (%) | 61.0 (±8.3) | 59.9 (±7.1) | 59.5 (±8.0) | 0.14 |
| Indexed LV-EDV (mL/m2) a | 84.5 (±14.0) † | 78.3 (±11.9) | 77.3 (±12.9) # | <0.001 ** |
| Indexed LV-ESV (mL/m2) a | 32.8 (±8.3) | 31.5 (±7.8) | 31.3 (±8.0) | 0.21 |
| Indexed LV-Mass (g/m2) a | 56.0 (±9.8) † | 51.8 (±10.3) | 55.1 (±11.8) | 0.03 * |
| LV-Cardiac Index (L/min/m2) a | 3.2 (±0.6) † | 2.7 (±0.4) | 2.9 (±0.6) # | <0.001 ** |
| Left Atrium (LA) | ||||
| LA-Volume (mL) | 73.0 (±20.8) † | 88.2 (±32.4) ‡ | 100.1 (±30.7) # | <0.001 ** |
| Indexed LA-Volume (mL/m2) a | 38.3 (±11.4) | 43.1 (±16.5) | 43.9 (±13.1) # | 0.04 * |
| Right Ventricle (RV) | ||||
| Patient RV-EDV (mL) | 178.5 (±47.0) | 174.6 (±41.3) ‡ | 191.0 (±48.6) | 0.03 * |
| Patient RV-ESV (mL) | 80.1 (±26.5) | 78.9 (±26.4) | 86.3 (±27.5) | 0.09 |
| RV-EF (%) | 55.3 (±7.7) | 55.5 (±7.5) | 55.1 (±6.6) | 0.32 |
| Indexed RV-EDV (mL/m2) a | 92.9 (±20.4) † | 84.3 (±16.4) | 83.0 (±17.4) # | 0.01 * |
| Indexed RV-ESV (mL/m2) a | 41.6 (±11.8) | 37.9 (±11.1) | 37.4 (±10.2) # | 0.04 * |
| Indexed LV-EDV a | LV-EDV | LV-ESV | LV-Cardiac Index a | LV-Mass | Indexed RV-EDV a | LA-Volume | |
|---|---|---|---|---|---|---|---|
| Epicardial Adipose Tissue (EAT) | |||||||
| EAT End-systolic area (cm2) | −0.166 *, 0.02 | NS | NS | −0.220 **, <0.01 | 0.188 **, 0.01 | −0.173 *, 0.02 | NS |
| EAT End-diastolic area (cm2) | −0.183 *, 0.01 | NS | NS | −0.211 **, <0.01 | 0.157 *, 0.03 | −0.168 *, 0.02 | NS |
| Pericardial Adipose Tissue (PAT) | |||||||
| PAT Area in 4 Chamber view (cm2) | NS | 0.159 *, 0.03 | 0.179 *, 0.01 | NS | 0.279 **, <0.01 | NS | 0.156 *, 0.04 |
| PAT End-systolic area (cm2) | −0.146 *, 0.04 | NS | 0.164 *, 0.02 | −0.207 **, <0.01 | 0.224 **, <0.01 | NS | NS |
| PAT End-diastolic area (cm2) | NS | 0.176 *, 0.02 | 0.194 **, 0.01 | −0.163 *, 0.03 | 0.249 **, <0.01 | NS | 0.174 *, 0.02 |
| Total cardiac fat (EAT + PAT) | |||||||
| Total end-systolic area (cm2) | −0.174 *, 0.02 | NS | NS | −0.213 **, <0.01 | 0.217 **, <0.01 | −0.154 *, 0.03 | NS |
| Total end-diastolic area (cm2) | NS | NS | 0.156 *, 0.03 | −0.184 *, 0.01 | 0.224 **, 0.01 | NS | 0.164 *, 0.03 |
| BMI | Normal (n = 45) | Overweight (n = 79) | Obese (n = 74) | p-Value * |
|---|---|---|---|---|
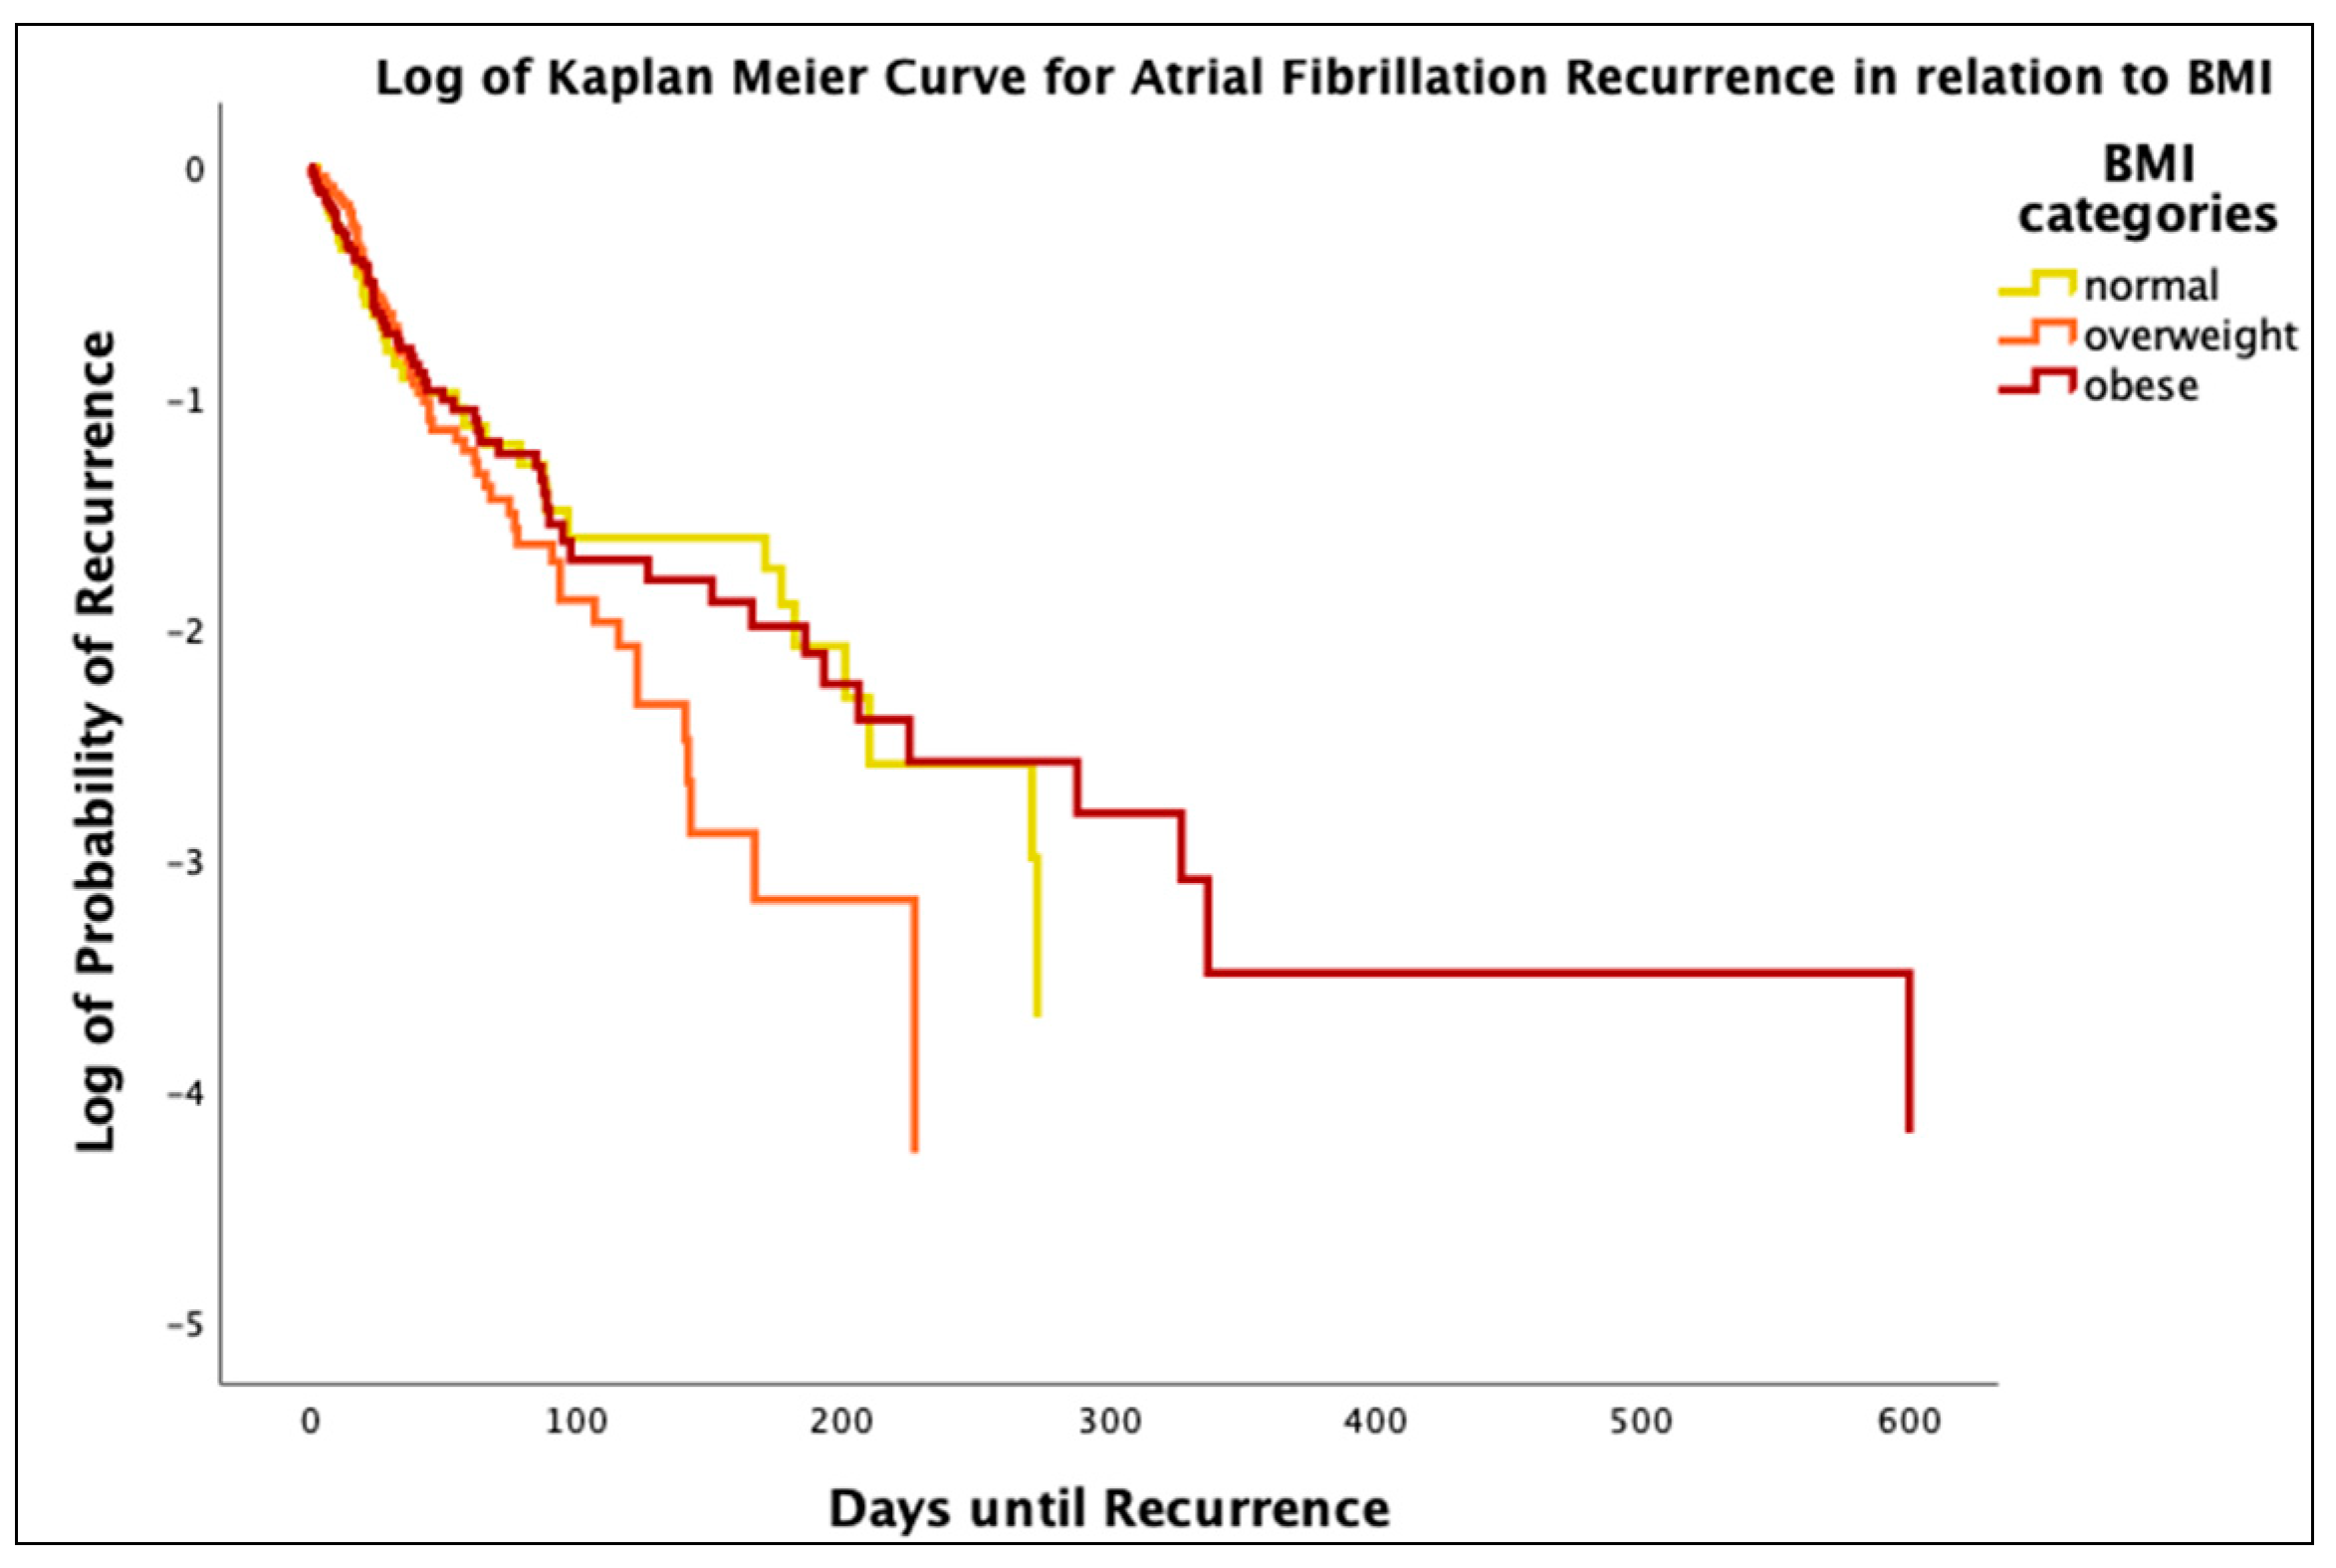
| Frequency of recurrence n(%) | 40 (20.2%) | 72 (36.4%) | 66 (33.3%) | 0.298 |
| Days until recurrence | 69.0 (±86.7) | 53.3 (±59.3) | 80.1 (±131.1) | 0.321 |
Disclaimer/Publisher’s Note: The statements, opinions and data contained in all publications are solely those of the individual author(s) and contributor(s) and not of MDPI and/or the editor(s). MDPI and/or the editor(s) disclaim responsibility for any injury to people or property resulting from any ideas, methods, instructions or products referred to in the content. |
© 2023 by the authors. Licensee MDPI, Basel, Switzerland. This article is an open access article distributed under the terms and conditions of the Creative Commons Attribution (CC BY) license (https://creativecommons.org/licenses/by/4.0/).
Share and Cite
Peer-Zada, F.; Hamze, D.; Garcia, J. Characterization of Cardiac Fat in Atrial Fibrillation Patients Prior to Ablation Treatment. Appl. Sci. 2023, 13, 12005. https://doi.org/10.3390/app132112005
Peer-Zada F, Hamze D, Garcia J. Characterization of Cardiac Fat in Atrial Fibrillation Patients Prior to Ablation Treatment. Applied Sciences. 2023; 13(21):12005. https://doi.org/10.3390/app132112005
Chicago/Turabian StylePeer-Zada, Feham, Dima Hamze, and Julio Garcia. 2023. "Characterization of Cardiac Fat in Atrial Fibrillation Patients Prior to Ablation Treatment" Applied Sciences 13, no. 21: 12005. https://doi.org/10.3390/app132112005
APA StylePeer-Zada, F., Hamze, D., & Garcia, J. (2023). Characterization of Cardiac Fat in Atrial Fibrillation Patients Prior to Ablation Treatment. Applied Sciences, 13(21), 12005. https://doi.org/10.3390/app132112005