Article

Experimental and Statistical Study on the Formation Characteristics and Discrimination Criteria of River Blockages Caused by Landslides

1
Laboratory of Hydraulics and Mountain River Engineering, College of Water Resources and Hydropower, Sichuan University, Chengdu 610065, China
2
Institute of Mountain Hazards and Environment, Chinese Academy of Sciences, Chengdu 610041, China
*
Author to whom correspondence should be addressed.
Appl. Sci. 2023, 13(21), 12003; https://doi.org/10.3390/app132112003
Submission received: 8 October 2023 / Revised: 28 October 2023 / Accepted: 2 November 2023 / Published: 3 November 2023

Abstract

:
The discrimination of river blockages is very important for the risk assessment of landslide disasters and secondary hazards. Experimental studies and statistical analyses were carried out to explore the formation process and discriminant criteria of river blockages caused by landslides. An adjustable slide chute was designed and built to conduct forty-five landslide experiments. According to the experimental results, river blockage was identified as having six types based on the differences between the water depth and the height of the landslide dam, and the degree of river blockage increased from 70% to 100% as the chute angle, particle size, and landslide volume increased. It is also found that landslide volume controls the landslide dam height and degree of blockage, and particle size and slide angle control both the landslide velocity as it enters the river and the cross-section shape of the landslide dam. To investigate more influence factors, a statistical investigation of 60 real landslide cases was carried out, and it revealed that some geometric attributes related to landslide volume have the highest correlation with river blockage, especially landslide thickness. Finally, an improved probability model was proposed to assess the possibility of complete blockage, and it has overall accuracies of 91.1% and 83.3% when applied to predict experimental landslide cases and real landslide cases, respectively.

1. Introduction

Landslide disasters occur frequently in the southwestern areas of China due to the alpine landforms and rainy climatic conditions [1,2,3]. Landslides are events in which the originally stable slope or geologic mass becomes unstable and undergoes shearing because of external influences, ultimately resulting in a complete or partial slide occurrence [4,5,6]. Landslides have many characteristics, such as prediction difficulty, abruptness of occurrence, magnitude of impact, and the possibility of causing secondary hazards [7,8]. Landslides can also produce a landslide dam with a large reservoir capacity, which increases the risk of flooding downstream [9,10,11]. For example, the Wenchuan earthquake in 2008 triggered numerous landslides, many of which led to the formation of large dammed lakes, including the Tangjiashan dammed lake with a reservoir capacity of 300 × 106 m3 and the Laoyingyan dammed lake with a dam height of 130 m [12,13]. More than 30 dammed lakes of significant sizes that posed a great security threat to downstream areas were produced by the Wenchuan earthquake. In 2000, peak flow from the breakage of the Yigong landslide dam reached 124,000 m3/s, which forced more than 6000 people to evacuate and washed away a large number of roads, bridges, and additional infrastructure [14]. River blockages triggered by landslides affect larger areas and produce greater hazards than those impacted by and resulting from the landslides directly. The study of river blockage processes caused by landslides is of great importance to reveal the blockage characteristics, including blockage type and dam-break mode, as well as to identify hazard warning techniques and expand the understanding of landslide dams [15].
Research on landslide-induced river blockages is mainly focused on the prediction and assessment of landslide risk [16], the mechanisms of landslide movements and river blockage [5,17], and the use of numerical simulations [18,19]. At present, the research methods used to investigate the formation of dammed lakes mainly include on-site investigations, physical model tests, and numerical simulations [3,20,21,22,23,24,25,26]. Landslide disasters are difficult to predict and monitor, especially large-scale landslides, and it is also difficult to precisely deduce the landslide movement process through on-site investigations. Tests using physical models are of substantial significance for the study of these types of river blockages. The distribution of the debris in the landslide dam is affected mainly by the roughness of the sliding surface [27]. The landslide volume and the discharge area can be used to assess the damming capacity of rock slides [22]. For the study of the mechanism and characteristics of river blockage caused by landslides, these three aspects are particularly important: (1) the possibility of river blockage after the occurrence of landslides; (2) the volume of debris sliding into a river that may block the river and form a dammed lake [28]; and (3) the morphological characteristics and types of river blockage. The study of dams produced after a landslide requires the integration of geotechnics, hydraulics, material mechanics, sediment movements, etc. Although numerical simulation studies have been carried out extensively, there is still a lack of conventional experimental tests [29].
Experimental studies are a useful method to reveal the characteristics of river blockages caused by landslides [27]. The material type, source volume, and slope angle are some of the predominant factors in landslide movement [27,30]. However, the influences of natural material characteristics involved in river blockage, such as slope topography and dynamic water flow during the blocking process, are seldom taken into account in physical model tests [31]. Moreover, whether the river flow conditions are put into the model will substantially affect the final deposition of landslide dams. When water flow is not considered in the test, the landslide dam will be roughly symmetric [23]. However, actual landslide dams usually lack this symmetry and present steeper upstream dam slopes than downstream dam slopes. To simulate the real conditions of a landslide and obtain a realistic result, it is necessary to consider the flowing water in the model test. In addition, models rarely consider the processes of landslide transport, deposition, and river blockage synthetically, especially if dynamic water flow is included [32,33,34]. As a result, the influence of landslide material and slope characteristics on river blockage under dynamic water flow is still unclear.
To experimentally reveal the influences of slope characteristics, landslide volume, and particle size on the formation of landslide dams and river blockage, an adjustable slide chute that includes the functions of landslide and dynamic water flow was designed and built, and forty-five repeatable landslide experiments were carried out in this chute. Some typical landslide movement processes, including debris sliding, water flow, and dam deposition, were recorded to analyze the influences of these three factors. The influences of more factors were investigated by a statistical investigation of sixty real landslide cases. Based on the forty-five experiments and the sixty landslide cases, an improved probability model for predicting the degree of river blockage was established, and its accuracy was analyzed based on experimental results and real landslide cases. Finally, the degrees of influence of various factors were discussed. A flow chart is shown in Figure 1 to illustrate the methodologies and processes of this study. The experimental findings and proposed model could improve the risk assessment of landslide disasters and secondary hazards, and they are also helpful in identifying vulnerable areas and developing mitigation strategies.

2. Materials and Methods

2.1. Experimental Setup

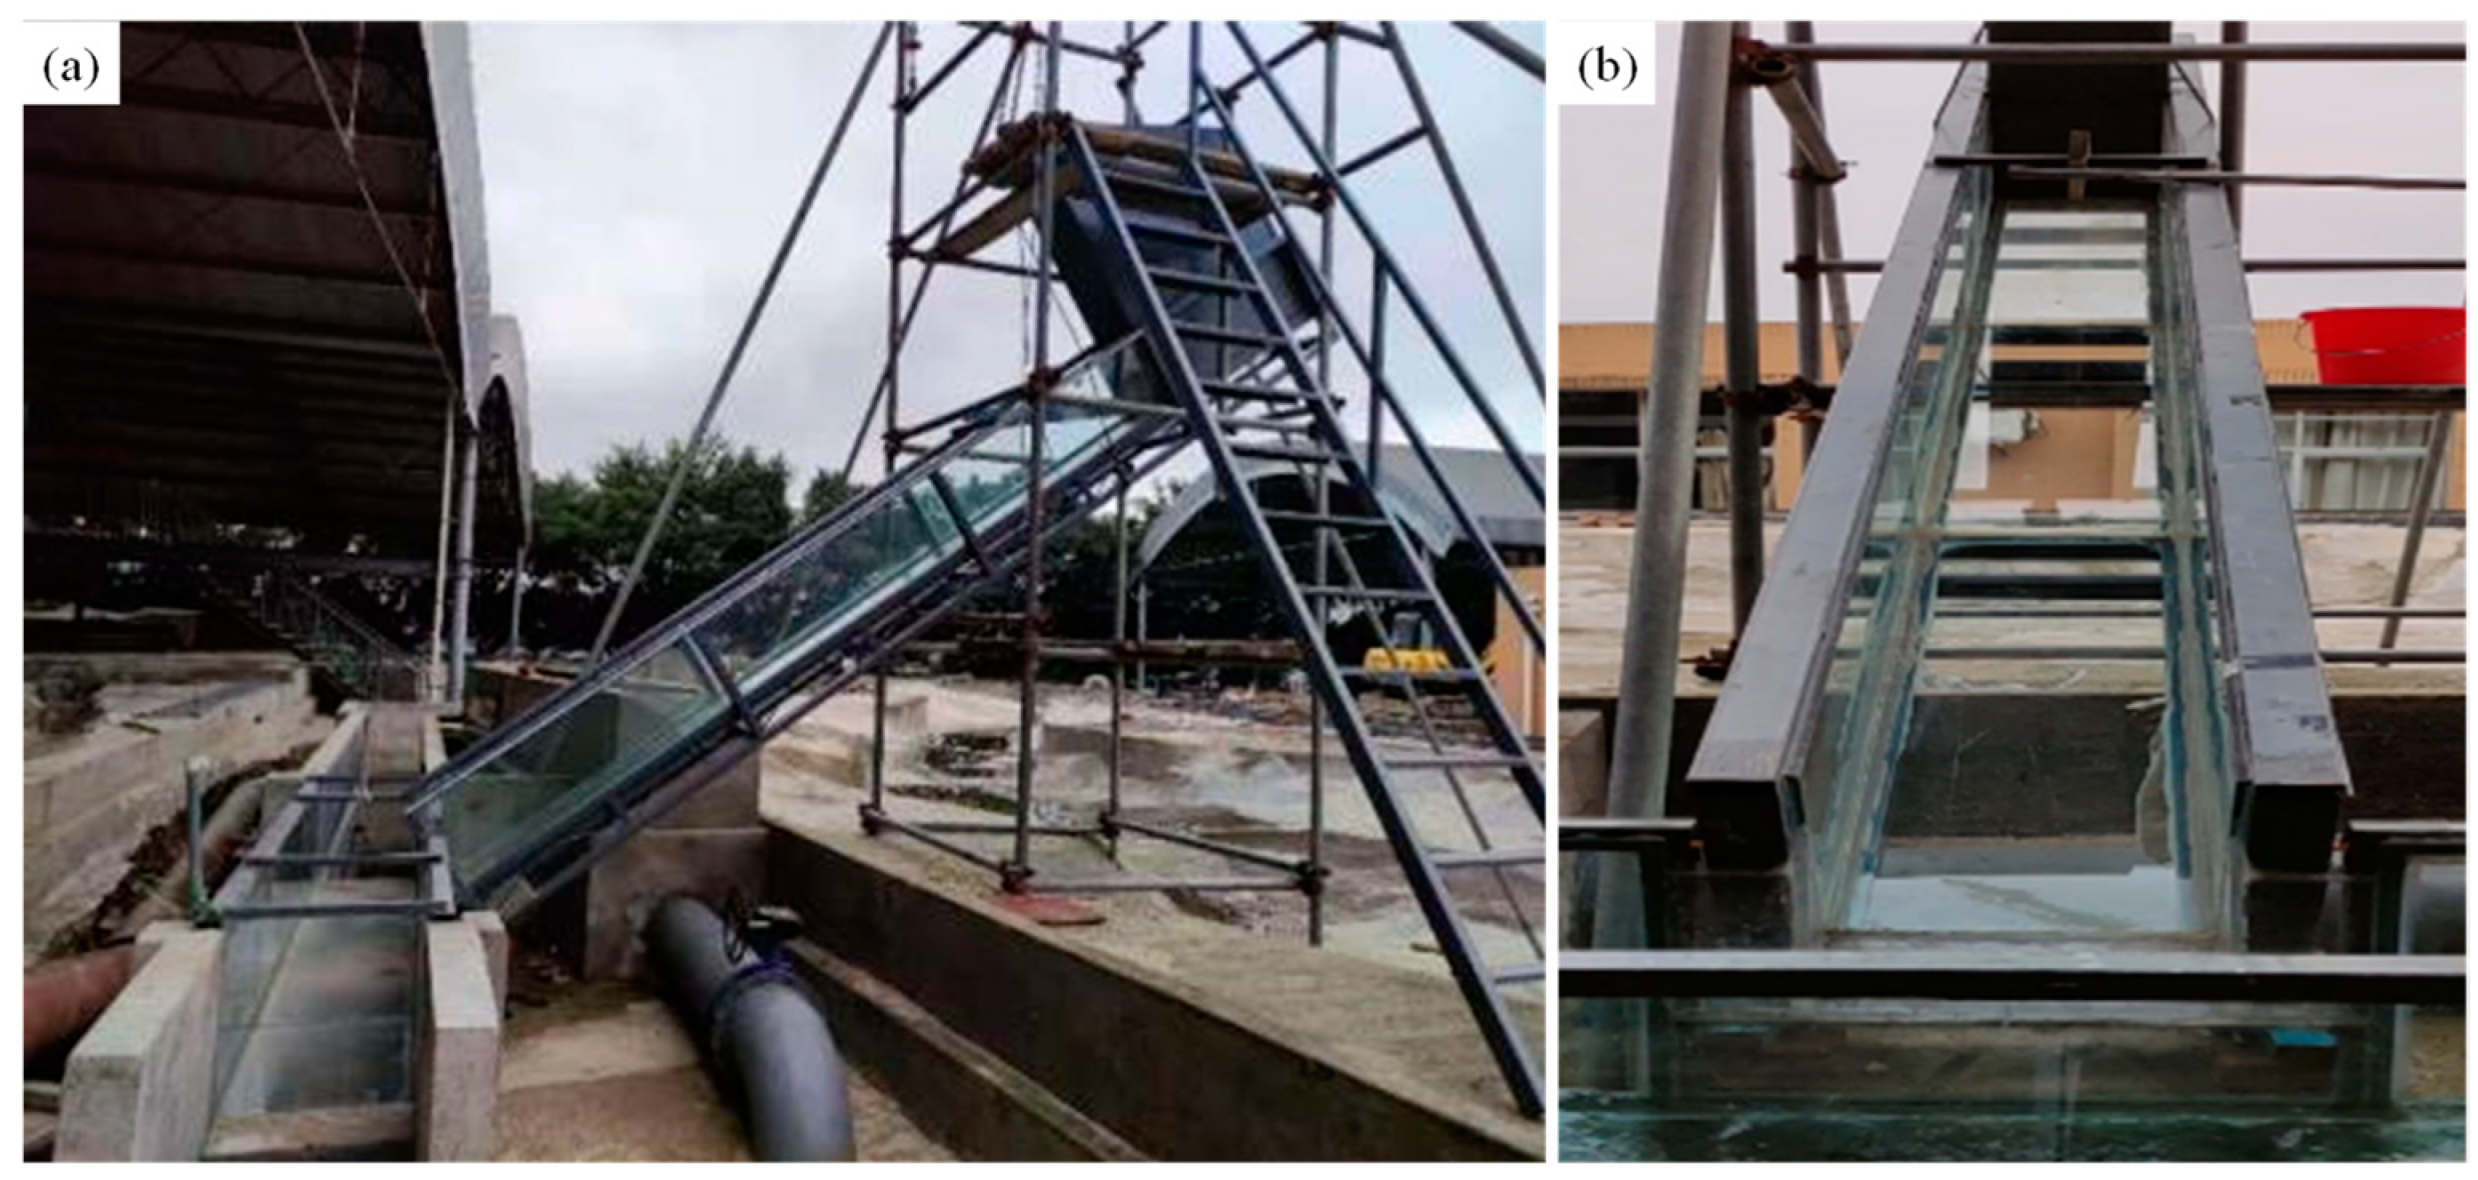
An experimental apparatus was built to simulate the formation and evolution processes of river blockages. The experimental setup consisted of four parts: sediment material container, inclined slide chute, river flume, and desilting basin, as shown in Figure 2 and Figure 3. Considering the complex and diverse topographic conditions of slopes, the chute was set up as an adjustable inclined slope to simulate different slope gradients and landslide height conditions. The angle adjustment device was made up of a steel frame and a lifting device. By adjusting the lifting device, the dip of the chute can be changed from 30° to 40°, and the corresponding landslide height varies from 2.0 m to 2.57 m. The inclined chute has a length of 4.0 m, a width of 0.3 m, and a depth of 0.4 m. Its surface and two lateral walls are made of glass to facilitate observation. The river flume has a length of 6 m and a gradient of 0.88%. Its rectangular cross-section is 0.5 m in width and 0.5 m in depth. The flume bottom and lateral walls are also composed of glass. Transparent material panels are used to build the chute and the flume to facilitate observation of the landslide process. The sediment material container is seamlessly connected to the chute, and a trapdoor is used to control landslide materials initiating simultaneously and the acceleration of the sliding motion from rest.
The water supply system mainly consists of a large underground cistern, a balance tank with triangular weirs, and a submerged pump. The desired inflow discharges could be achieved by adjusting the valve of the inflow pipe until the water depth at the triangular weir reaches the desired depth. A small flat weir with a height of 0.2 m was set at 0.3 m after the triangular weirs to reduce the kinetic energy of water flow. As shown in Figure 2, three digital cameras were installed at the observation point before the tests. To record the entire process, two cameras were placed on the side of the flume, and the other was positioned above the flume. The geometries of the landslide dams were obtained immediately after their complete formation from video records and by using the standard grids and rulers pasted on the flume walls.

2.2. Experimental Materials

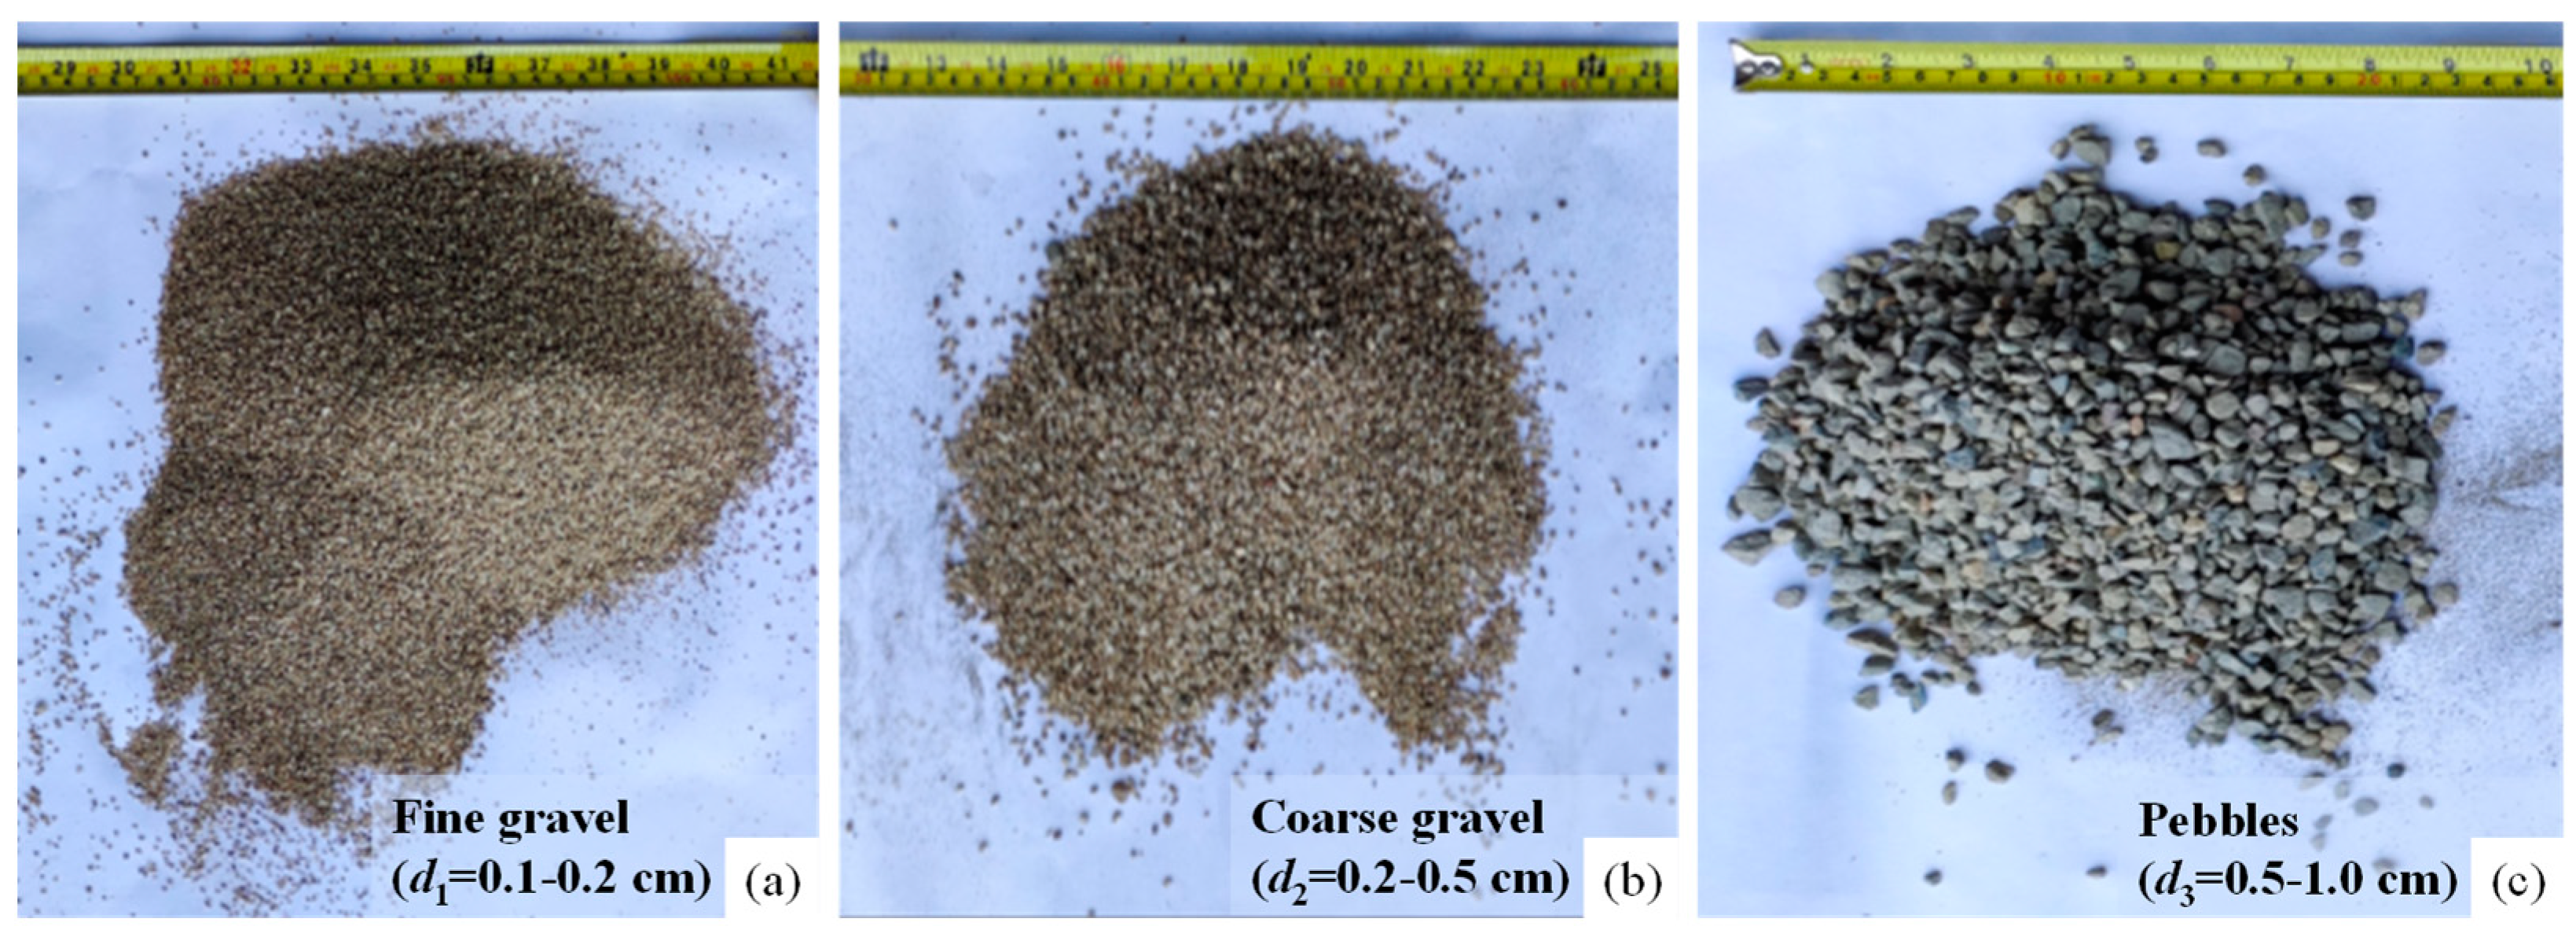
It is difficult to simulate the particle size distribution of landslide materials, which is very complicated for a real landslide and varies markedly between landslides. Thus, this experiment is designed not to simulate a real landslide but to investigate some basic mechanisms of river blockage caused by landslides. Based on this consideration, three types of typical and highly operable sands were used to represent landslide materials in the experiment. To study the influence of different material sizes on landslide dams and river blockages, the materials were divided into fine gravel (d1 = 0.1~0.2 cm), coarse gravel (d2 = 0.2~0.5 cm), and pebbles (d3 = 0.5~1.0 cm). Particle sizes are not uniform but encompass a range of sizes in each category to better simulate the landslide mass. In addition, they were dried by the same dehydrator to minimize different variables other than particle size. The different types of materials used in this experiment are shown in Figure 4.

2.3. Experimental Scheme

The water flow rate is one of the crucial parameters in the formation of landslide dams, so a constant water flow supply is vital during the experiments. The design of a constant hydraulic head and the opening area of the sluice ensured a constant water flow supply for each experiment. To measure the water flow rate in each experiment, a series of preliminary experiments were conducted. The water depth and water flow velocity were recorded when the water flow stabilized. The water flow velocity was measured by a flow velocity measuring instrument, and the water flow rate was calculated from the width of the flume, the water depth, and the flow velocity. The water flow rate was almost kept constant to effectively analyze the influence of other factors on river blockage caused by landslides.
One of the purposes of this study is to reveal the influence of landslide materials and slope conditions on river blockage. Thus, a total of 45 experiments were carried out. Table 1 summarizes the characteristics of the landslide volume, material size, and slope conditions of the 45 experiments. It is more likely to obtain a similar river blockage if the disparity of the landslide volume is minimized between repeated tests. Therefore, several pretests were conducted to determine the maximum volume for completely blocking the river and the minimum volume for partially blocking the river without material being flushed away immediately after deposition. Following that, the experiments were divided into five groups of different landslide volumes to explore the influences of volume on landslide dam formation processes and the types of river blockages. Thus, the chute of this experiment was designed to be adjustable from 30° to 40°. During the experiment, the landslide material in the storage tank was released after a steady water flow rate in the flume was established. The experiment was complete when all the landslide materials that had been emptied into the flume had been flushed away by the water.

3. Experimental Results

All the landslide and dam formation processes were recorded by three digital video cameras. The following experimental results are video snapshots and include some characteristic data of the landslides and dams measured from the videos, such as the duration of the landslide, velocity of the landslide, and geometric sizes of the landslide dam. Some objects whose sizes are known and constant between the videos were taken as references to ensure the accuracy of the data.

3.1. Landslide Dam Formation Process

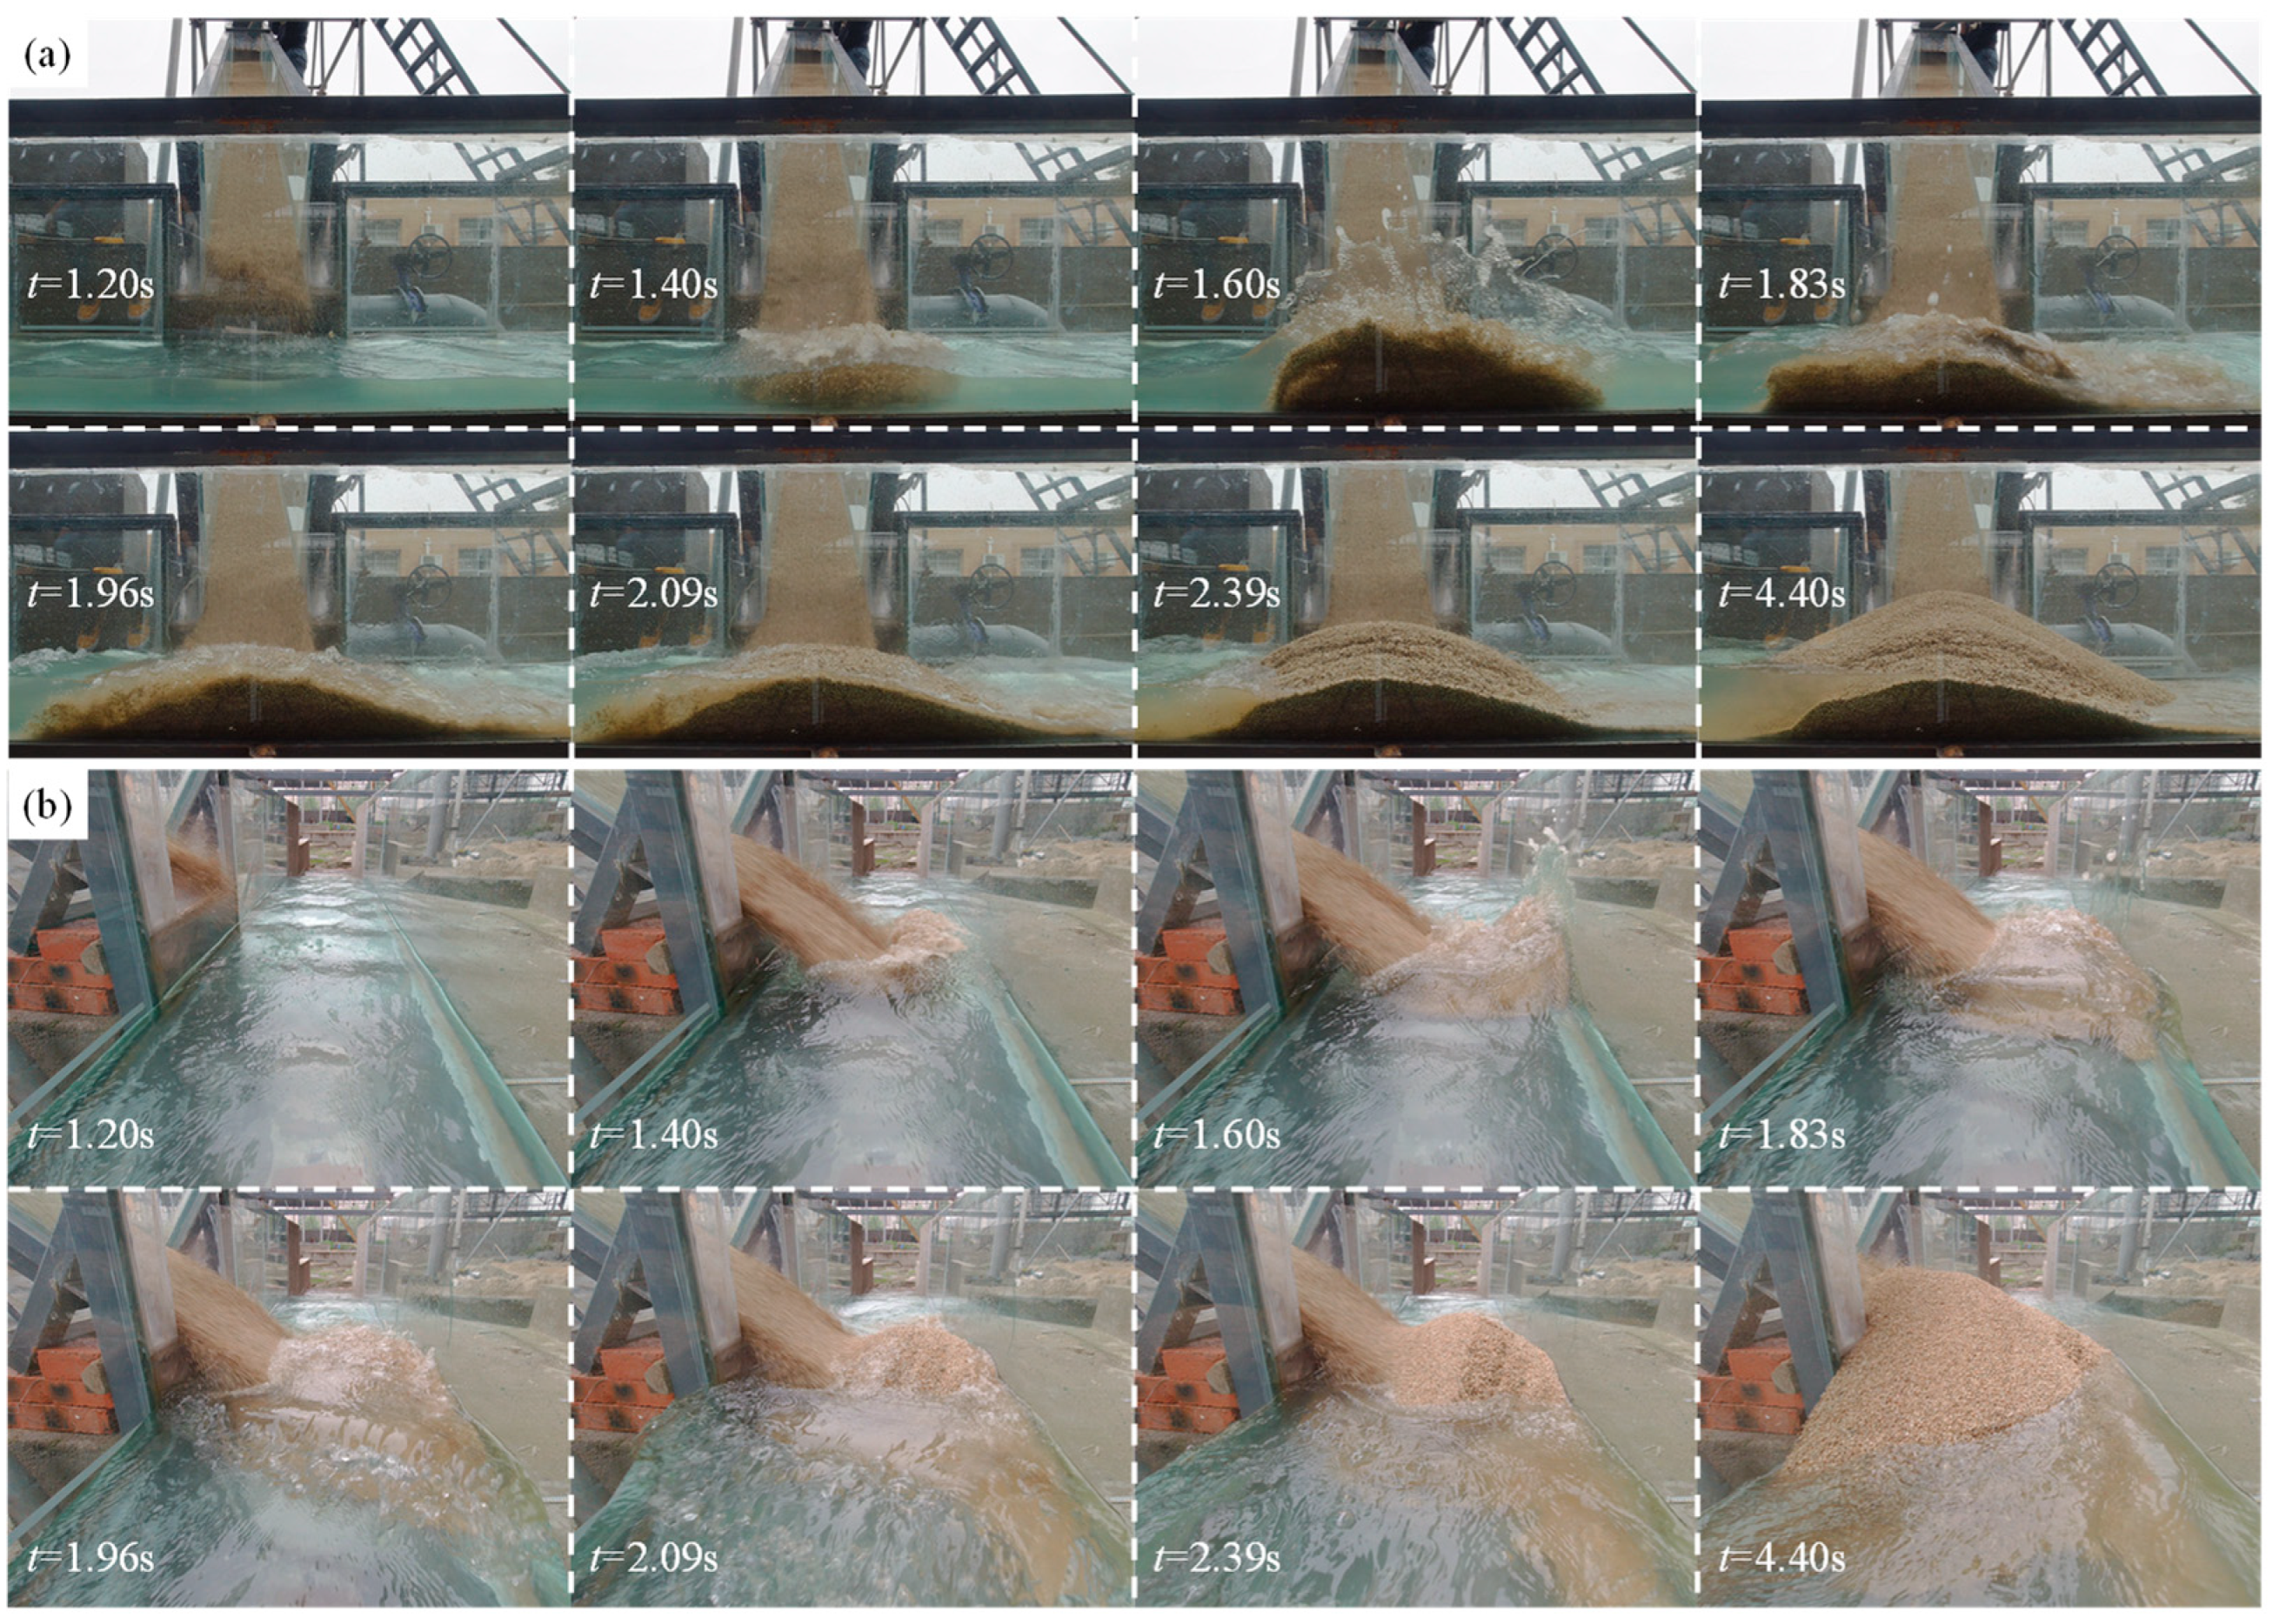
The formation process of the landslide dam is shown in Figure 5 by taking B2-4 as an example. The landslide mass begins to emerge from the trapdoor at t = 0 s. After 1.2 s, the landslide material accelerates toward the exit of the chute under the influence of gravity and enters the flume at a high speed. Subsequently, the landslides flow into the river at high speed to initiate deposition. At t = 1.26 s, the head of the landslide mass has entered the flume, but a large volume of the landslide material remains in motion. The landslide material plunges into the river and initiates severe turbulent flow due to the interaction between the landslide mass and water flow. The landslide material flows to and ascends the opposite bank from t = 1.4 s to t = 1.6 s. The material then descends after it reaches the maximum runup height. Material is deposited up and downstream within the flume during the deposition process. Landslide movement ends at t = 5.5 s, and this deposition blocks the river completely. The resulting blockage raises the water level upstream. The kinetic energy of the landslide head is greatest when it enters the flume, and the rest of the landslide mass enters the flume at a slower speed, which significantly dampens water surface perturbations and surge effects.
The total movement time T of the landslide is divided into the landslide time and the dam formation time. As shown in Figure 6, the change in the total time T is mainly influenced by the dam formation time. Increasing the slide angle will significantly decrease the time of landslide movement and dam formation. As the landslide volume varies, the times of landslide movement and dam formation change more significantly for the cases with a slide angle of 30° than for the other two cases. The total movement time T increases with decreasing particle size. Compared with large particles, small particles in the landslide debris have a larger equivalent friction coefficient [35]. Therefore, larger particle sizes decrease the time of the landslide and deposition processes.

3.2. River Blockage Induced by Landslide Dams

The different types of river blockage are summarized in Figure 7, where three characteristic heights are marked as the stable water depth hw, the maximum dam height Hmax, and the minimum dam height Hmin. According to the relationships between these three characteristic heights, river blockages are characterized into six types, as listed in Table 2.
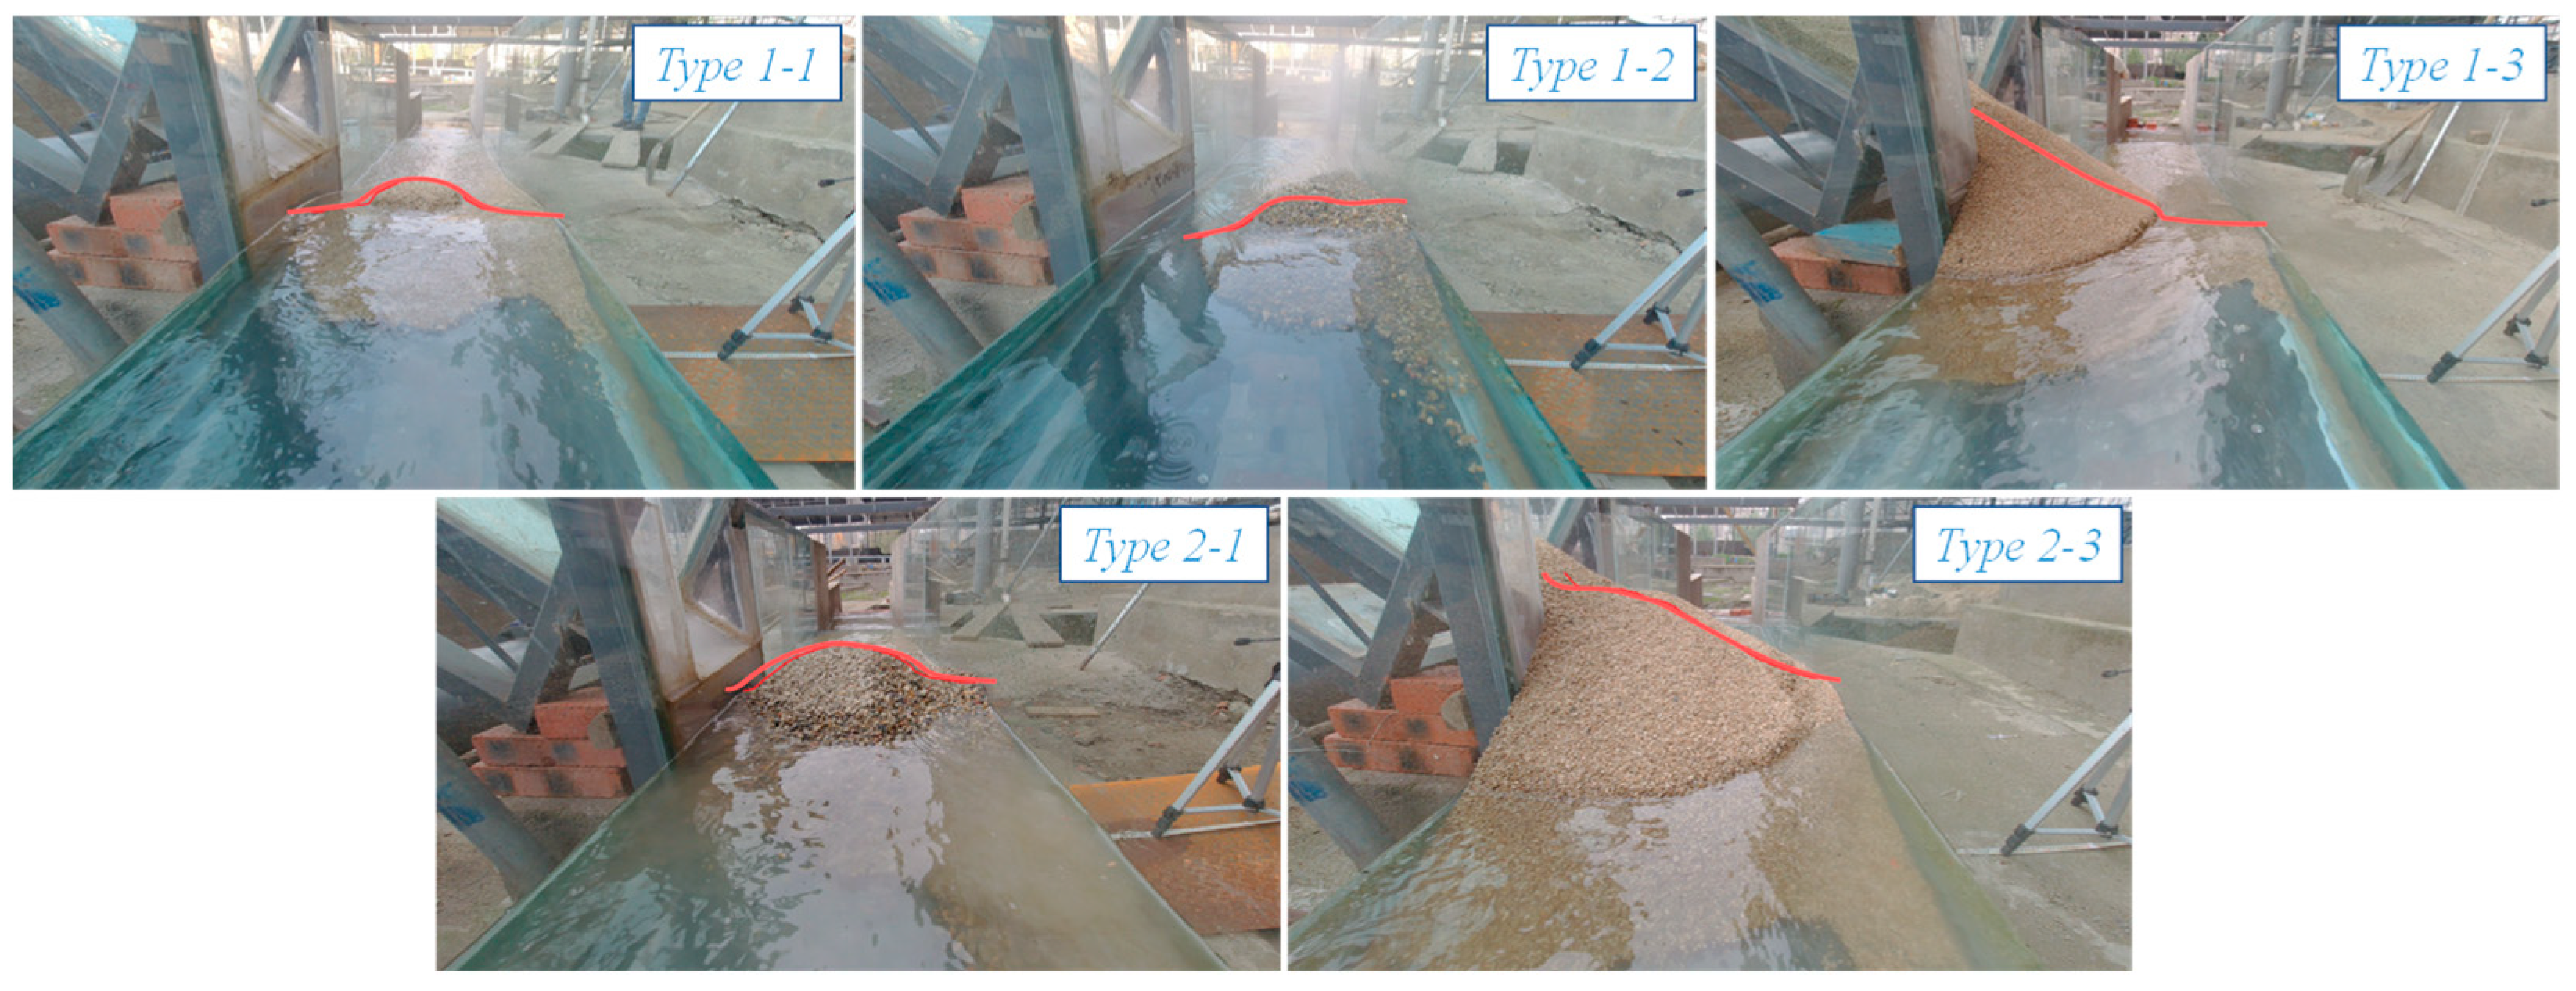
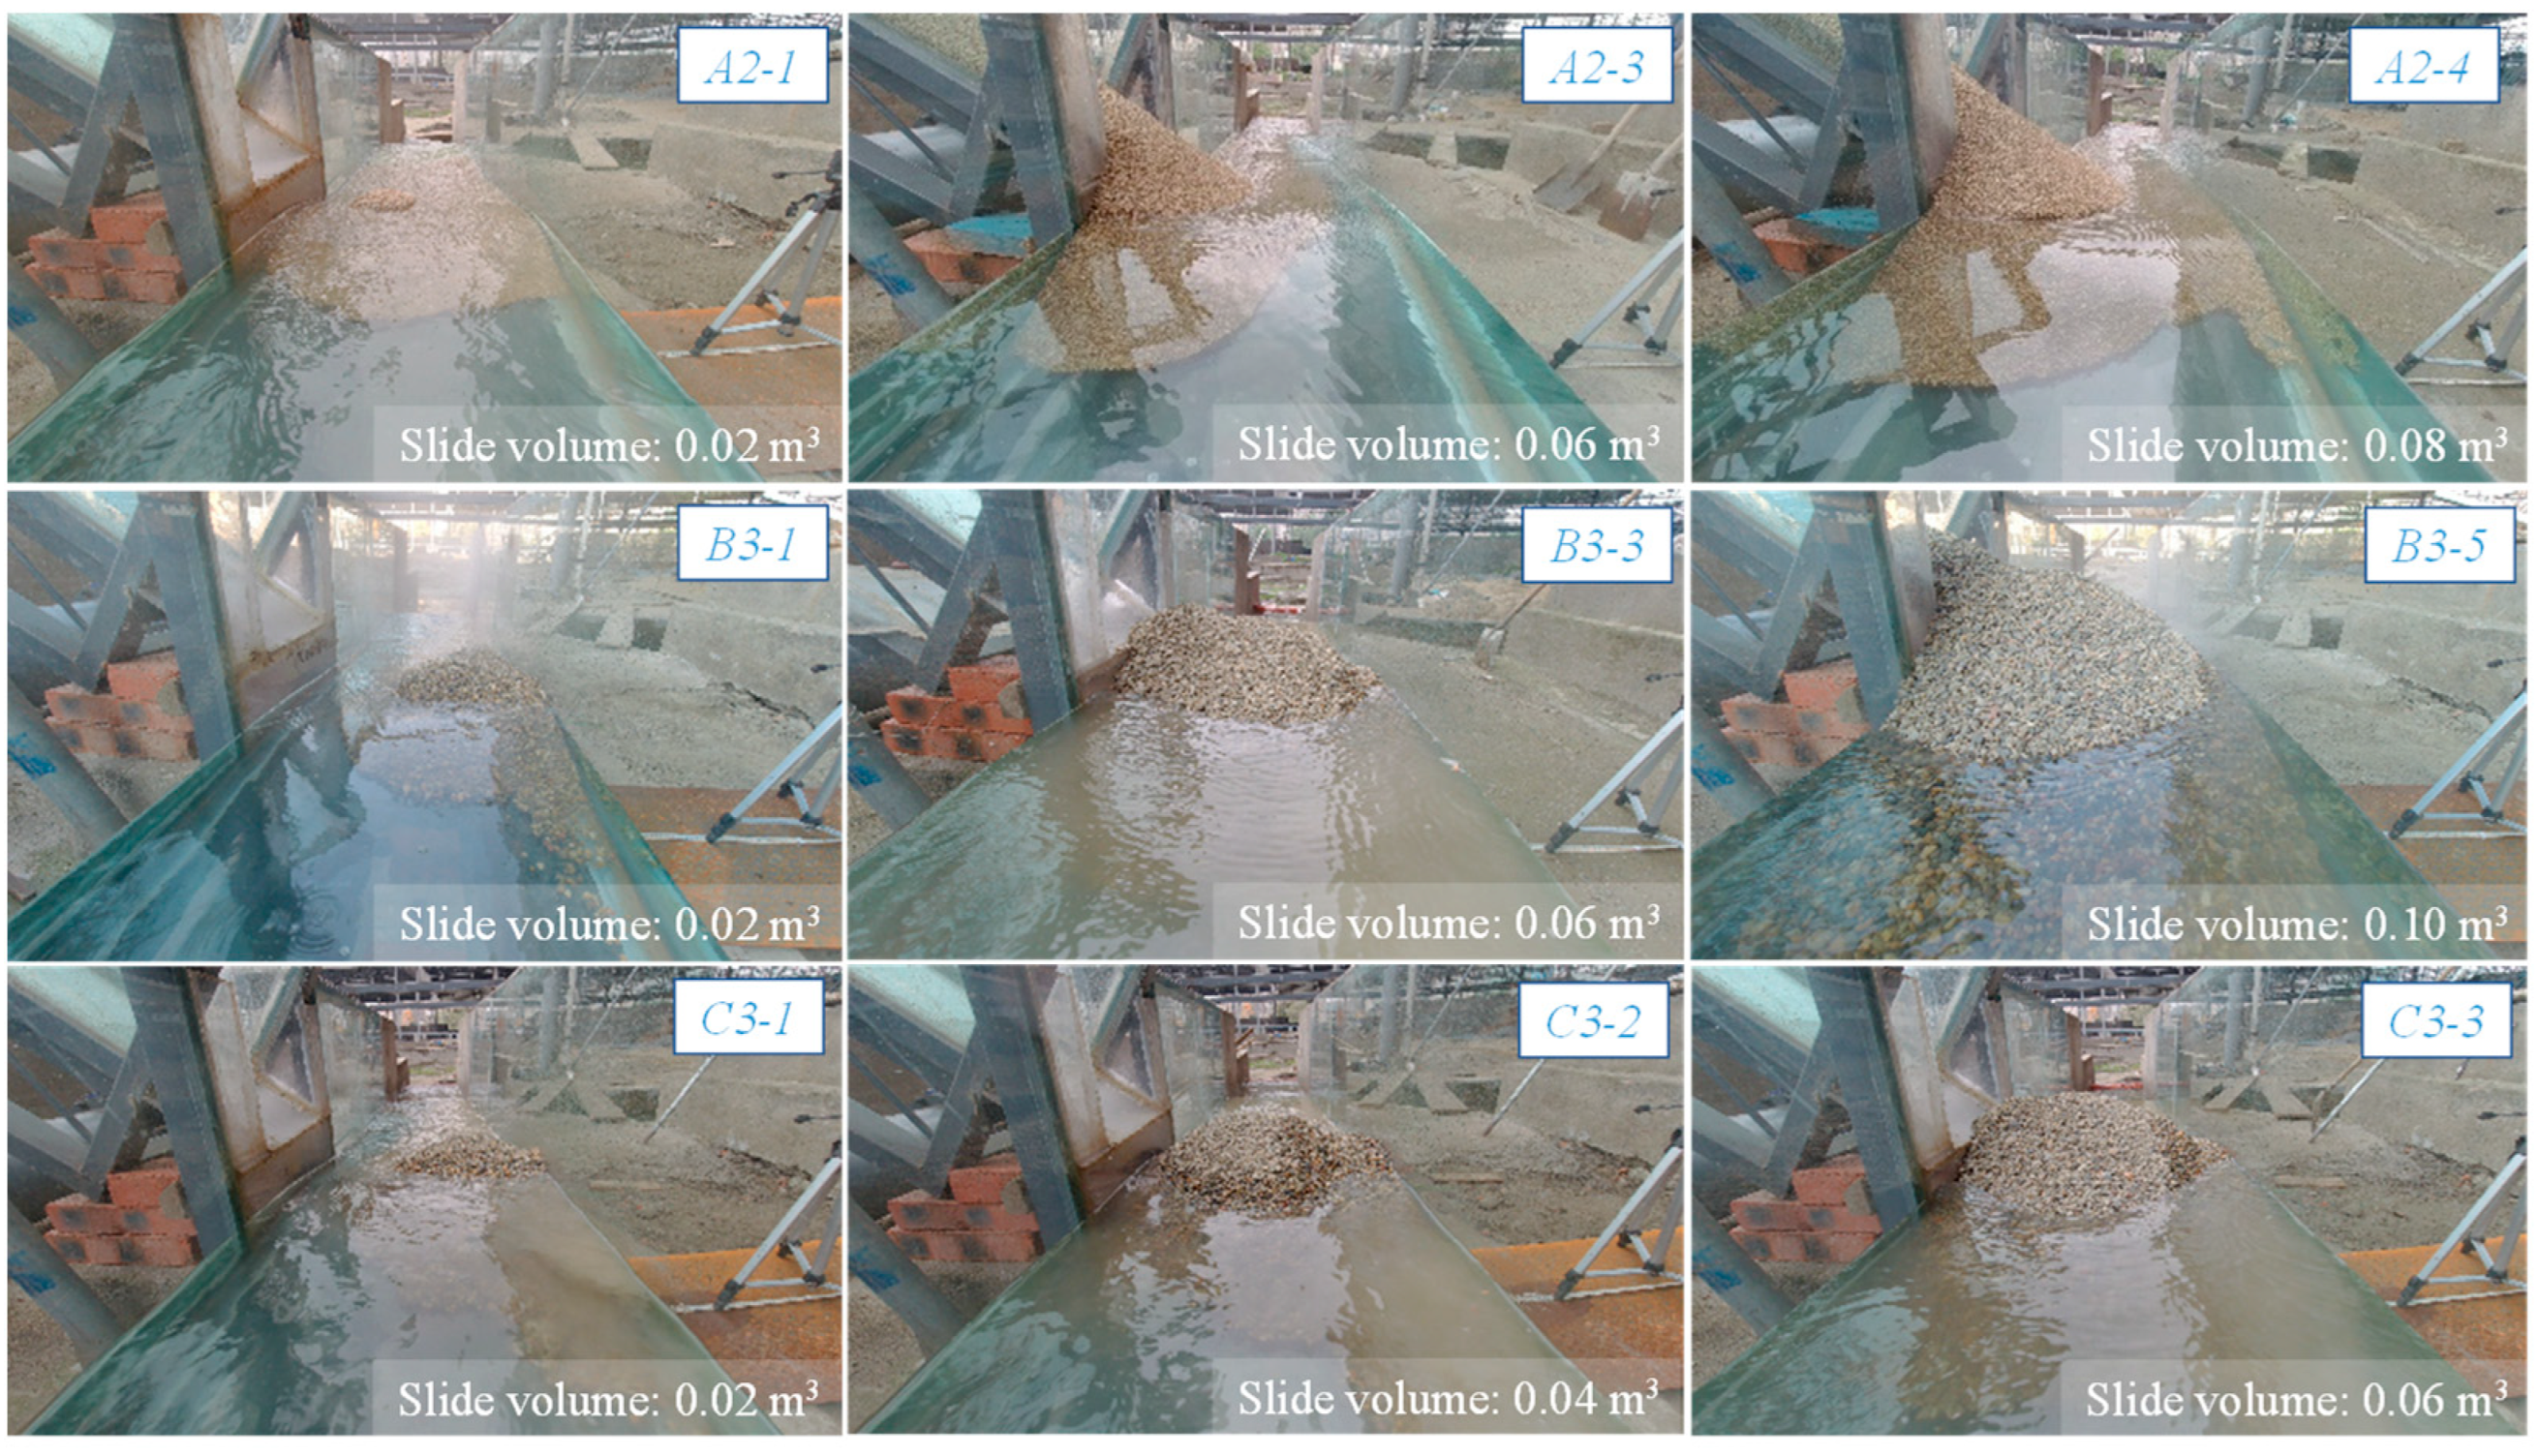
Based on the images of the landslide dams recorded by the cameras, only five types of river blockages were observed in these experiments, as listed in Table 2. Because the chute exit is lower than the stable water surface, type 2-2 was not observed in these experiments. Typical experimental landslide dams for the five types are presented in Figure 8. The landslides entered into the flume, and the heads of the landslides slowed the rear landslides. Large volumes of landslide material will accumulate in the chute. If the height of landslide deposition on the side where it enters the flume surpasses the height of the chute’s exit, then further landslide movement could be prevented by this outcrop of material; thus, not all landslide material could enter the flume. In this case, the landslide dam is highest on the landslide side and lowest on the opposite side, which is characteristic of blockage types 1-3. The main reason for the difference between types 1-2 and 1-3 is the difference in velocity entering the flume. As the slide angle and particle size increase, the cross-section type of the landslide dam will gradually transform to type 1-2. When a large volume of landslide material moved at a slow velocity, the landslide formed a complete blockage dam of type 2-3, in which Hmax appeared on the landslide side. With a steeper slope, larger particle size, and larger material volume, landslides are more likely to result in dam type 2-1, which presents as a completely blocked channel with Hmax near the center axis of the dam.
According to the experiments conducted in this study, the proportions of the five blockage types are illustrated in Figure 9. Type 1-3, which has the highest deposition on the landslide side of the river, is the most common. All the sliding masses enter the flume and form the landslide dam in the experiments. In most tests, the maximum dam height Hmax is observed on the landslide side of the river because the landslide materials slide into the flume at a low velocity. Hmin is almost always on the opposite side because the final volume of the landslide materials has lower speeds and moves slowly across the surface of the deposition near the landslide side. The influence of slide angle, particle size, and landslide volume on the characteristics of deposition geometry and blockage type will be analyzed in the following sections.

3.3. Effect of Different Factors on Blockage Type

Landslides blocking rivers are complex problems that involve debris flows and river flows [36]. The depositional process is highly dependent on the properties of individual landslides and rivers. These factors determine whether landslides can block the river before being flushed away. Every test was conducted under the same river conditions to explore the influence of other factors on the blockage type. Figure 8 shows that the deposition height increases notably with increasing landslide volume and varies for landslides with different particle sizes or slide angles. The effects of each parameter on the dam geometry and blockage type are analyzed in detail, as presented below.

3.3.1. Effect of Material Conditions

The landslide dam consists of landslide materials, so the landslide volume is the most significant factor [28,37] that directly determines the formation of a landslide dam and the degree of river blockage. Figure 10 shows that the dam blockage type varies as the volume changes. The blockage degree, as well as Hmax and Hmin, increase as the volume increases. It can be inferred that the larger the landslide volume, the larger the cross-section of the landslide dam. The landslide material will deposit to form the landslide dam instead of being flushed away by the water flow.
The increase in landslide volume could significantly increase the maximum and minimum heights of the landslide dam. As shown in Figure 11, Hmax shows a relatively linear increase with increasing landslide volume. When the landslide volume doubles, the maximum dam height increases by approximately 10–30%. However, the increase in maximum dam height will continuously decrease as landslide volume increases because the deposit will slide upstream and downstream as more material is introduced. The minimum height of the landslide dam also increases significantly with increasing landslide volume. Thus, it can be concluded that the initial volume of the landslide is a key factor controlling the geometric characteristics of the landslide dam. The larger the landslide volume, the larger the dam height, and the larger the cross-sectional area of the dam. A larger landslide volume will also increase the degree of river blockage and the stability of the landslide dam.
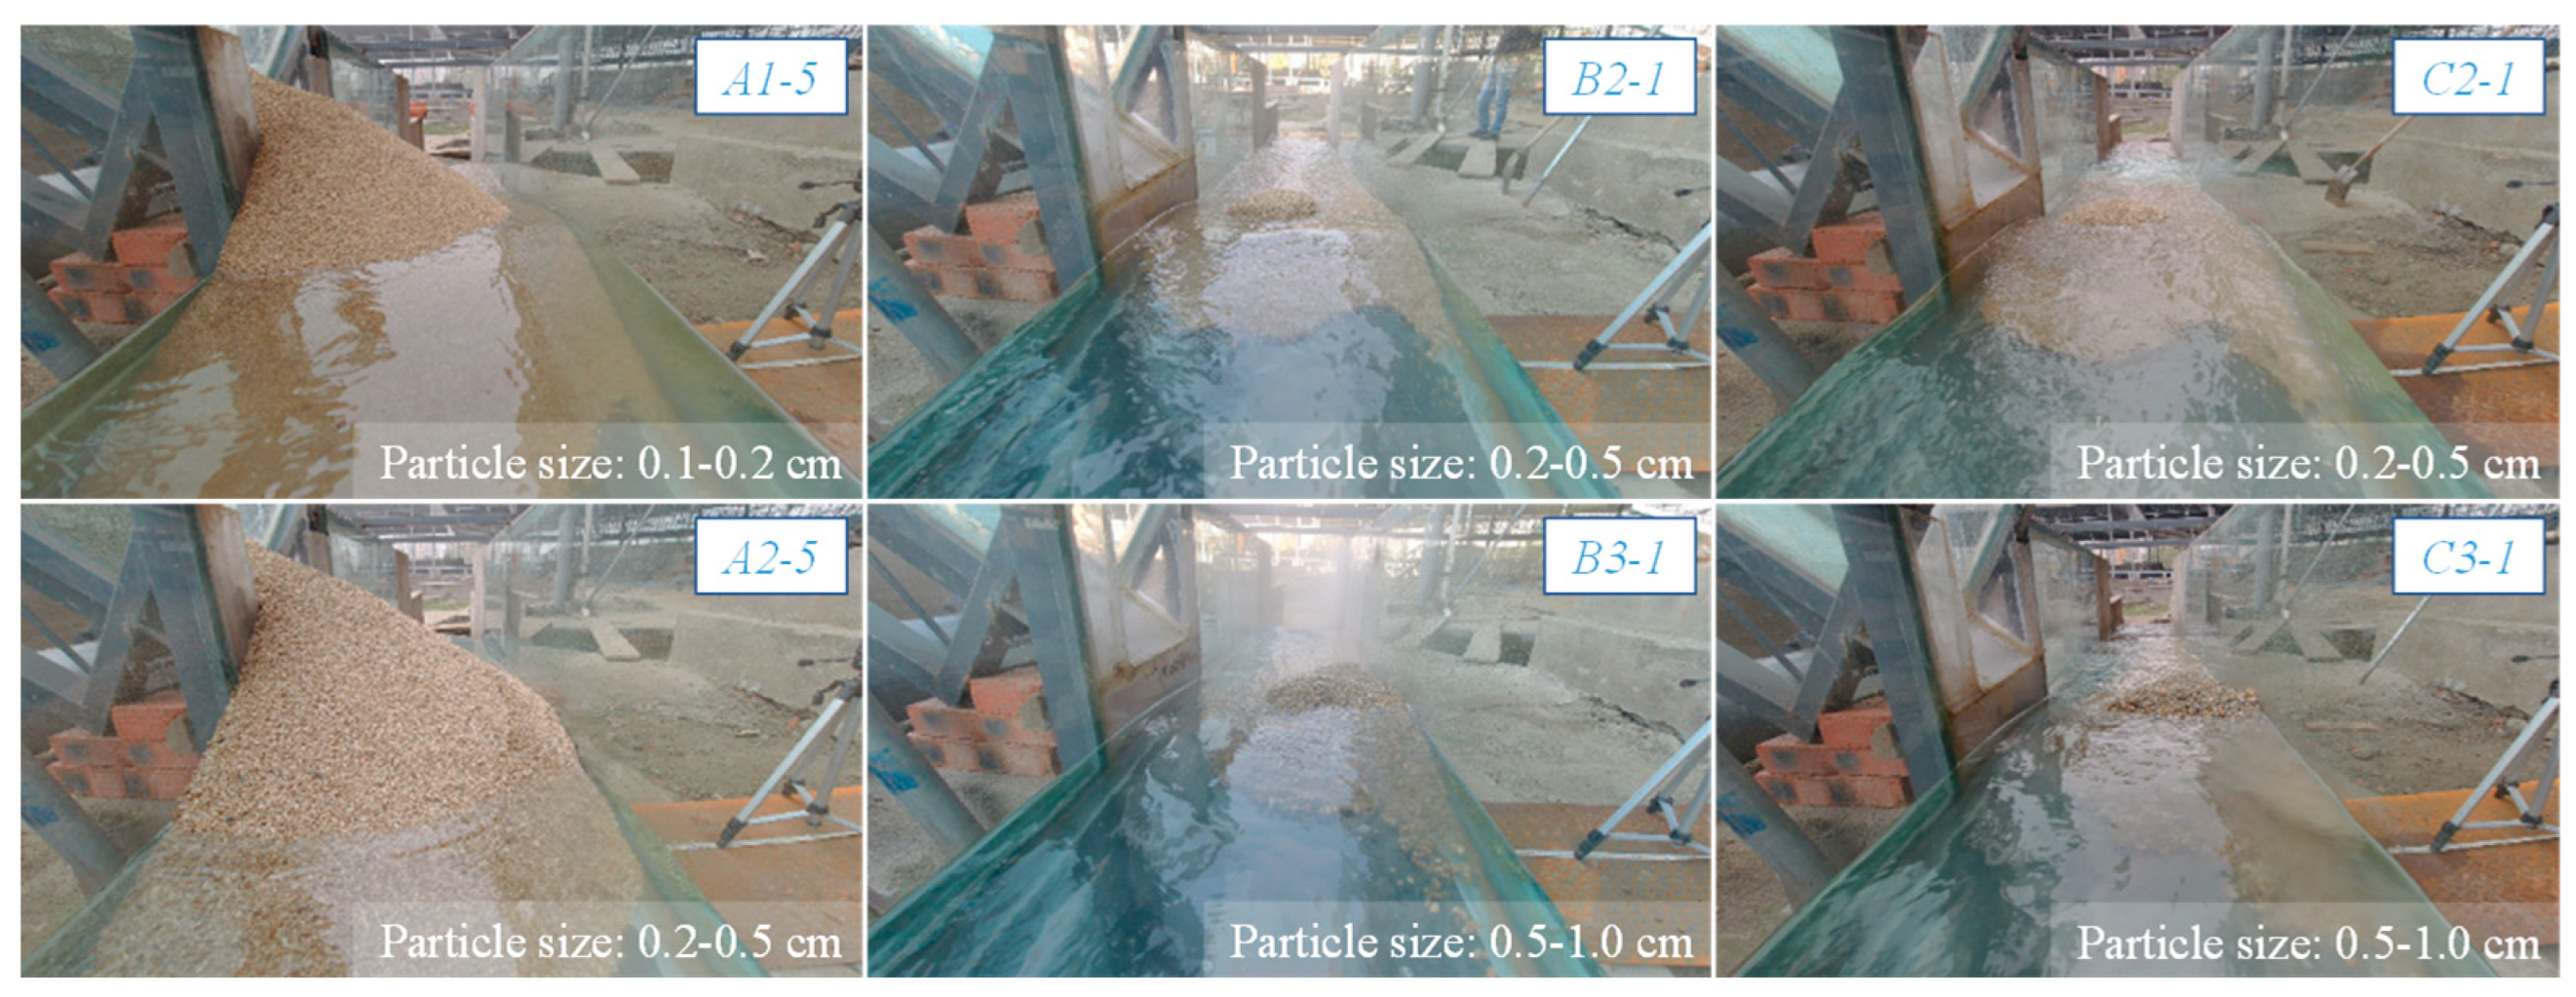
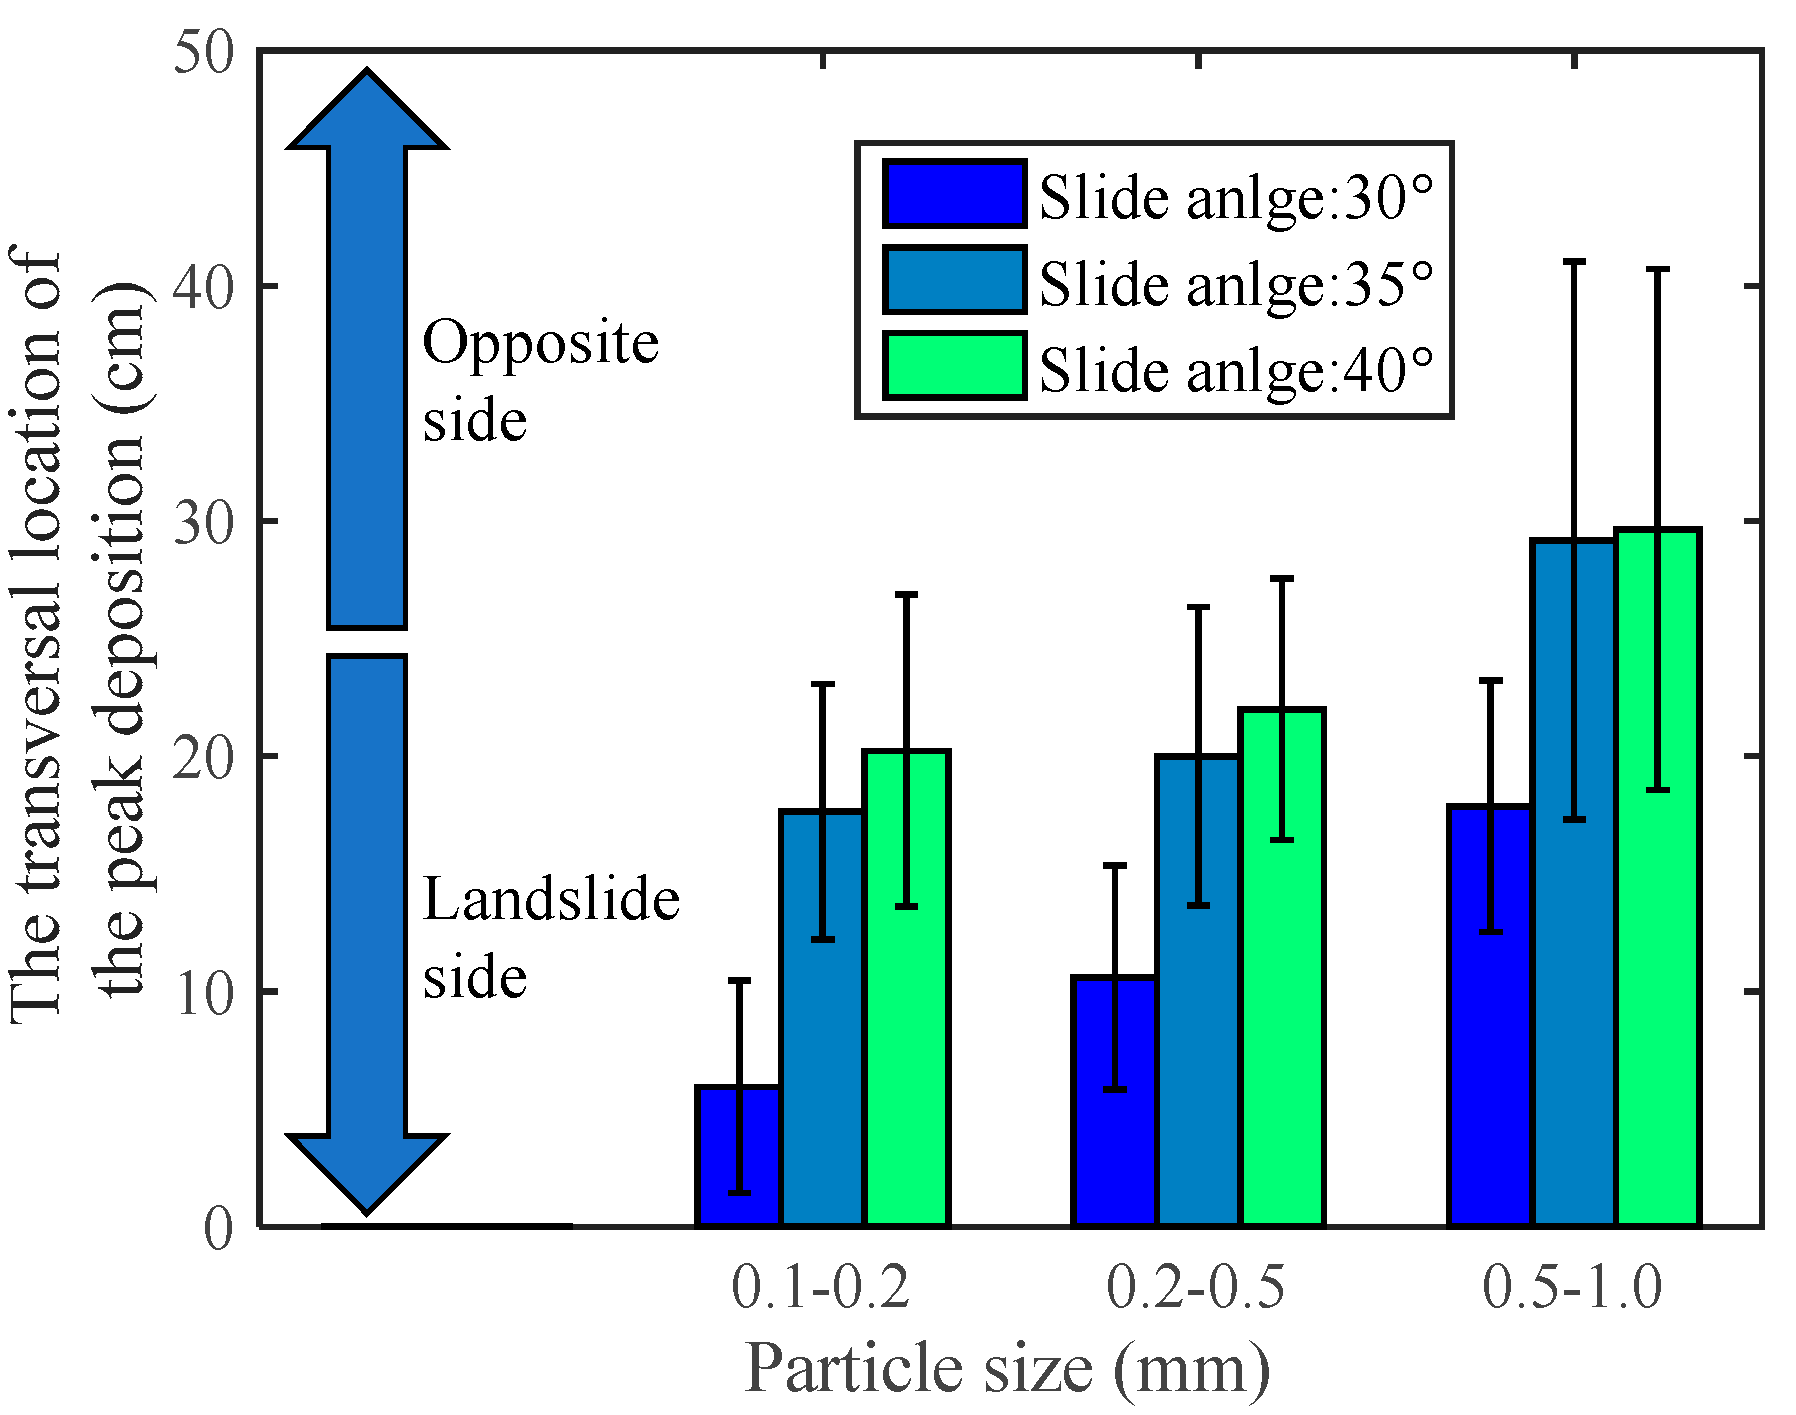
The particle size of landslide material determines the characteristics of landslide movement. Figure 12 and Figure 13 show that as the particle size increases, the location of the highest deposition will significantly shift from the landslide side to the opposite side. This phenomenon will not substantially change the blockage degree or dam heights but will obviously change the dam blockage type. Thus, particle size is a key factor in determining the location of the highest and lowest depositional heights in the channel. In addition, landslides with larger particle sizes are more likely to completely block rivers since they can form dams with smaller height differences.
Additionally, the deposition of small particles is more sensitive to flow conditions than that of large particles. For the same landslide volume, small particles are more likely to be flushed away than large particles. The portion of deposition transported downstream does not contribute to the deposition height at the intersection of the slope chute and flume. In conclusion, the effects of landslide volume and particle size on deposit geometry and dam blockage type are interdependent. The landslide volume plays a key role in deposit height, which determines the blockage type under the condition of constant water depth.

3.3.2. Effect of Slide Angle

In reality, there are many different slope conditions for landslides that determine the movement process of landslides and the final type of river blockage. Although much research focuses on the influences of slope conditions on landslides, there is still a lack of precise conclusions on how slope conditions influence the process of dam formation and river blockage. Figure 14 shows that some cross-sections of landslides initiate on slopes with different angles. When the slide angle increases, the landslide velocity also increases significantly, so the landslide movement process is reduced and the type of river blockage is changed. The increase in slide angle reduces the height difference between Hmin and Hmax and makes the landslide dam more compact and more resistant to flushing.

3.3.3. Effect of the Landslide Velocity Entering the River

The movement and deposition processes are affected by factors related to the landslide material and slope conditions. It is difficult to identify a complete blockage from only one condition because a complete blockage is a consequence of many different factors. However, from these tests, it was found that landslide velocity plays an important role in identifying the type of river blockage. Although the same blockage may be induced by different materials and slope conditions, the velocities of landslides when entering the river are almost the same. When the velocity varies, the type of river blockage also changes. The greater the difference in landslide flow velocity, the more the dam cross-section changes. As shown in Figure 15, different velocities yield completely different dam cross-sections and blockage types, and a roughly equivalent velocity yields almost the same blockage type under the same landslide volume.
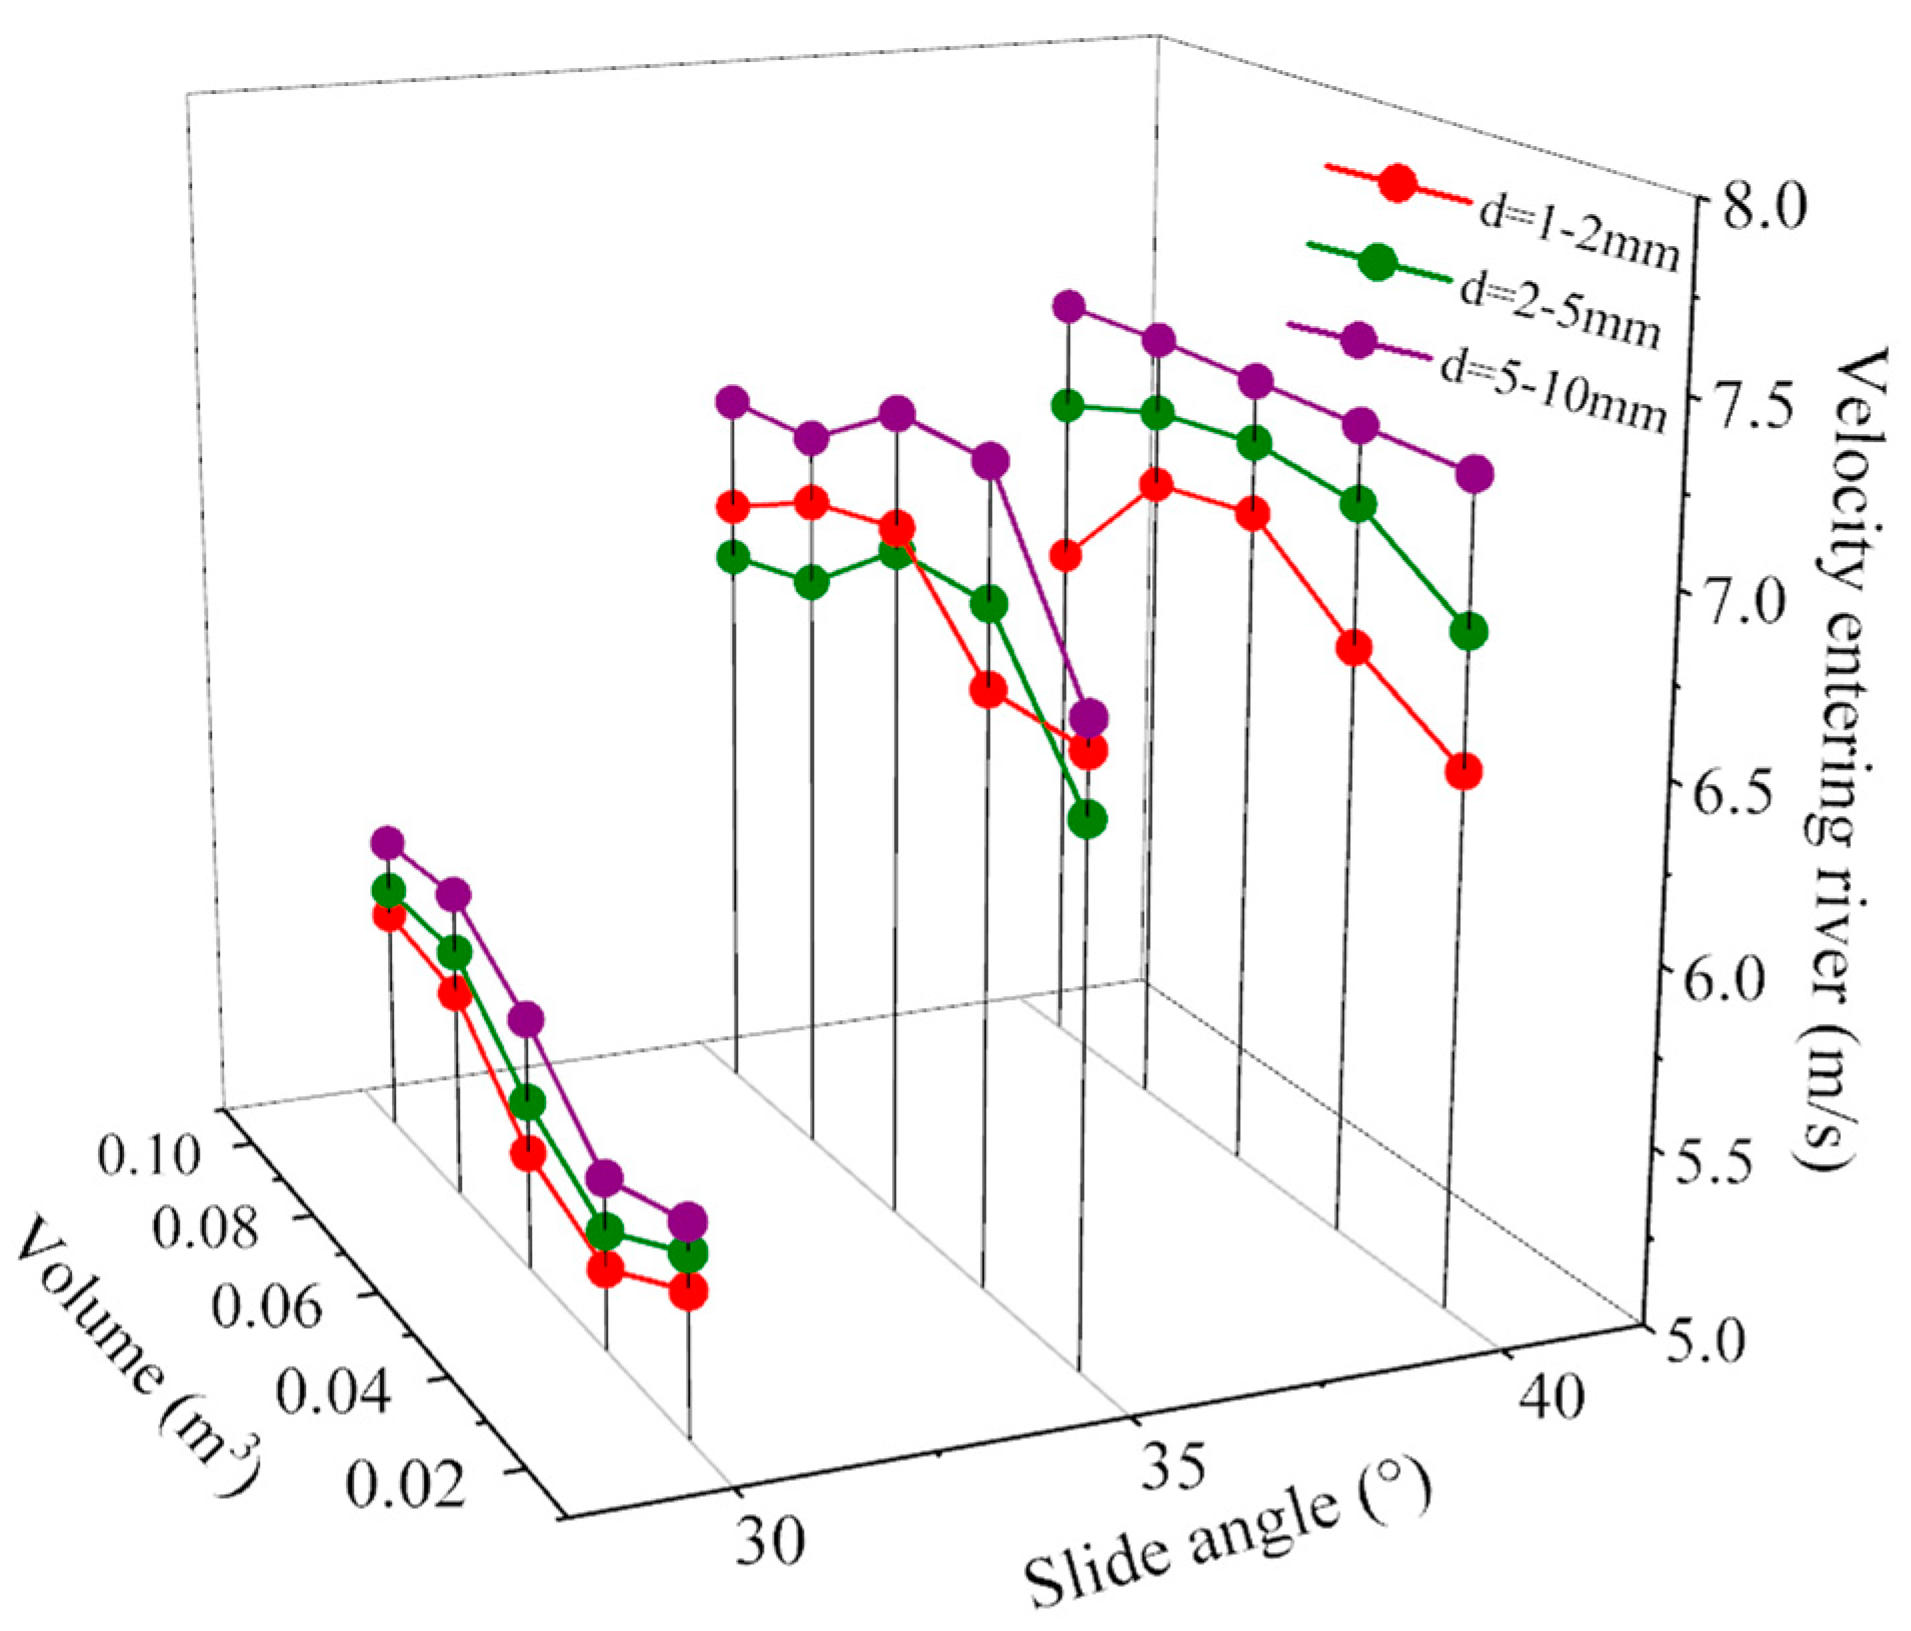
As shown in Figure 16, the velocity of landslides entering rivers is mainly affected by the slide angle, and the other two factors, including landslide volume and particle size, have relatively small influences on the velocity of landslides entering rivers. The fluctuation range of the velocity is within 1 m/s when the slide angle is the same but becomes 2 m/s if the slide angle changes. As the slide angle increases, not only does the initial potential energy of landslide materials increase directly, but the dissipated friction energy is also reduced during the movement process, which results in a significant improvement in the transformation of potential energy into kinetic energy. Therefore, the increase in slide angle makes the landslide velocity rise significantly, and the range of the velocity for different slide angles is much larger than that for the same slide angle. In addition, landslide volume and particle size are two other factors that affect the velocity of landslides entering rivers, and the influence of landslide volume on the landslide velocity is less than the influence of particle size. In actuality, the velocity of landslides entering rivers does not change significantly and even decreases slightly when the landslide volume increases. Landslides with smaller volumes are more likely to roll freely without too much influence from other particles. Following this perspective, as the particle size increases, landslide materials with the same volume could consist of fewer particles, and the interactions among particles decrease; as a result, landslide materials are more easily accelerated in the movement process and present a higher velocity, as observed in the experiments.

3.4. Analysis of the Degree of River Blockage

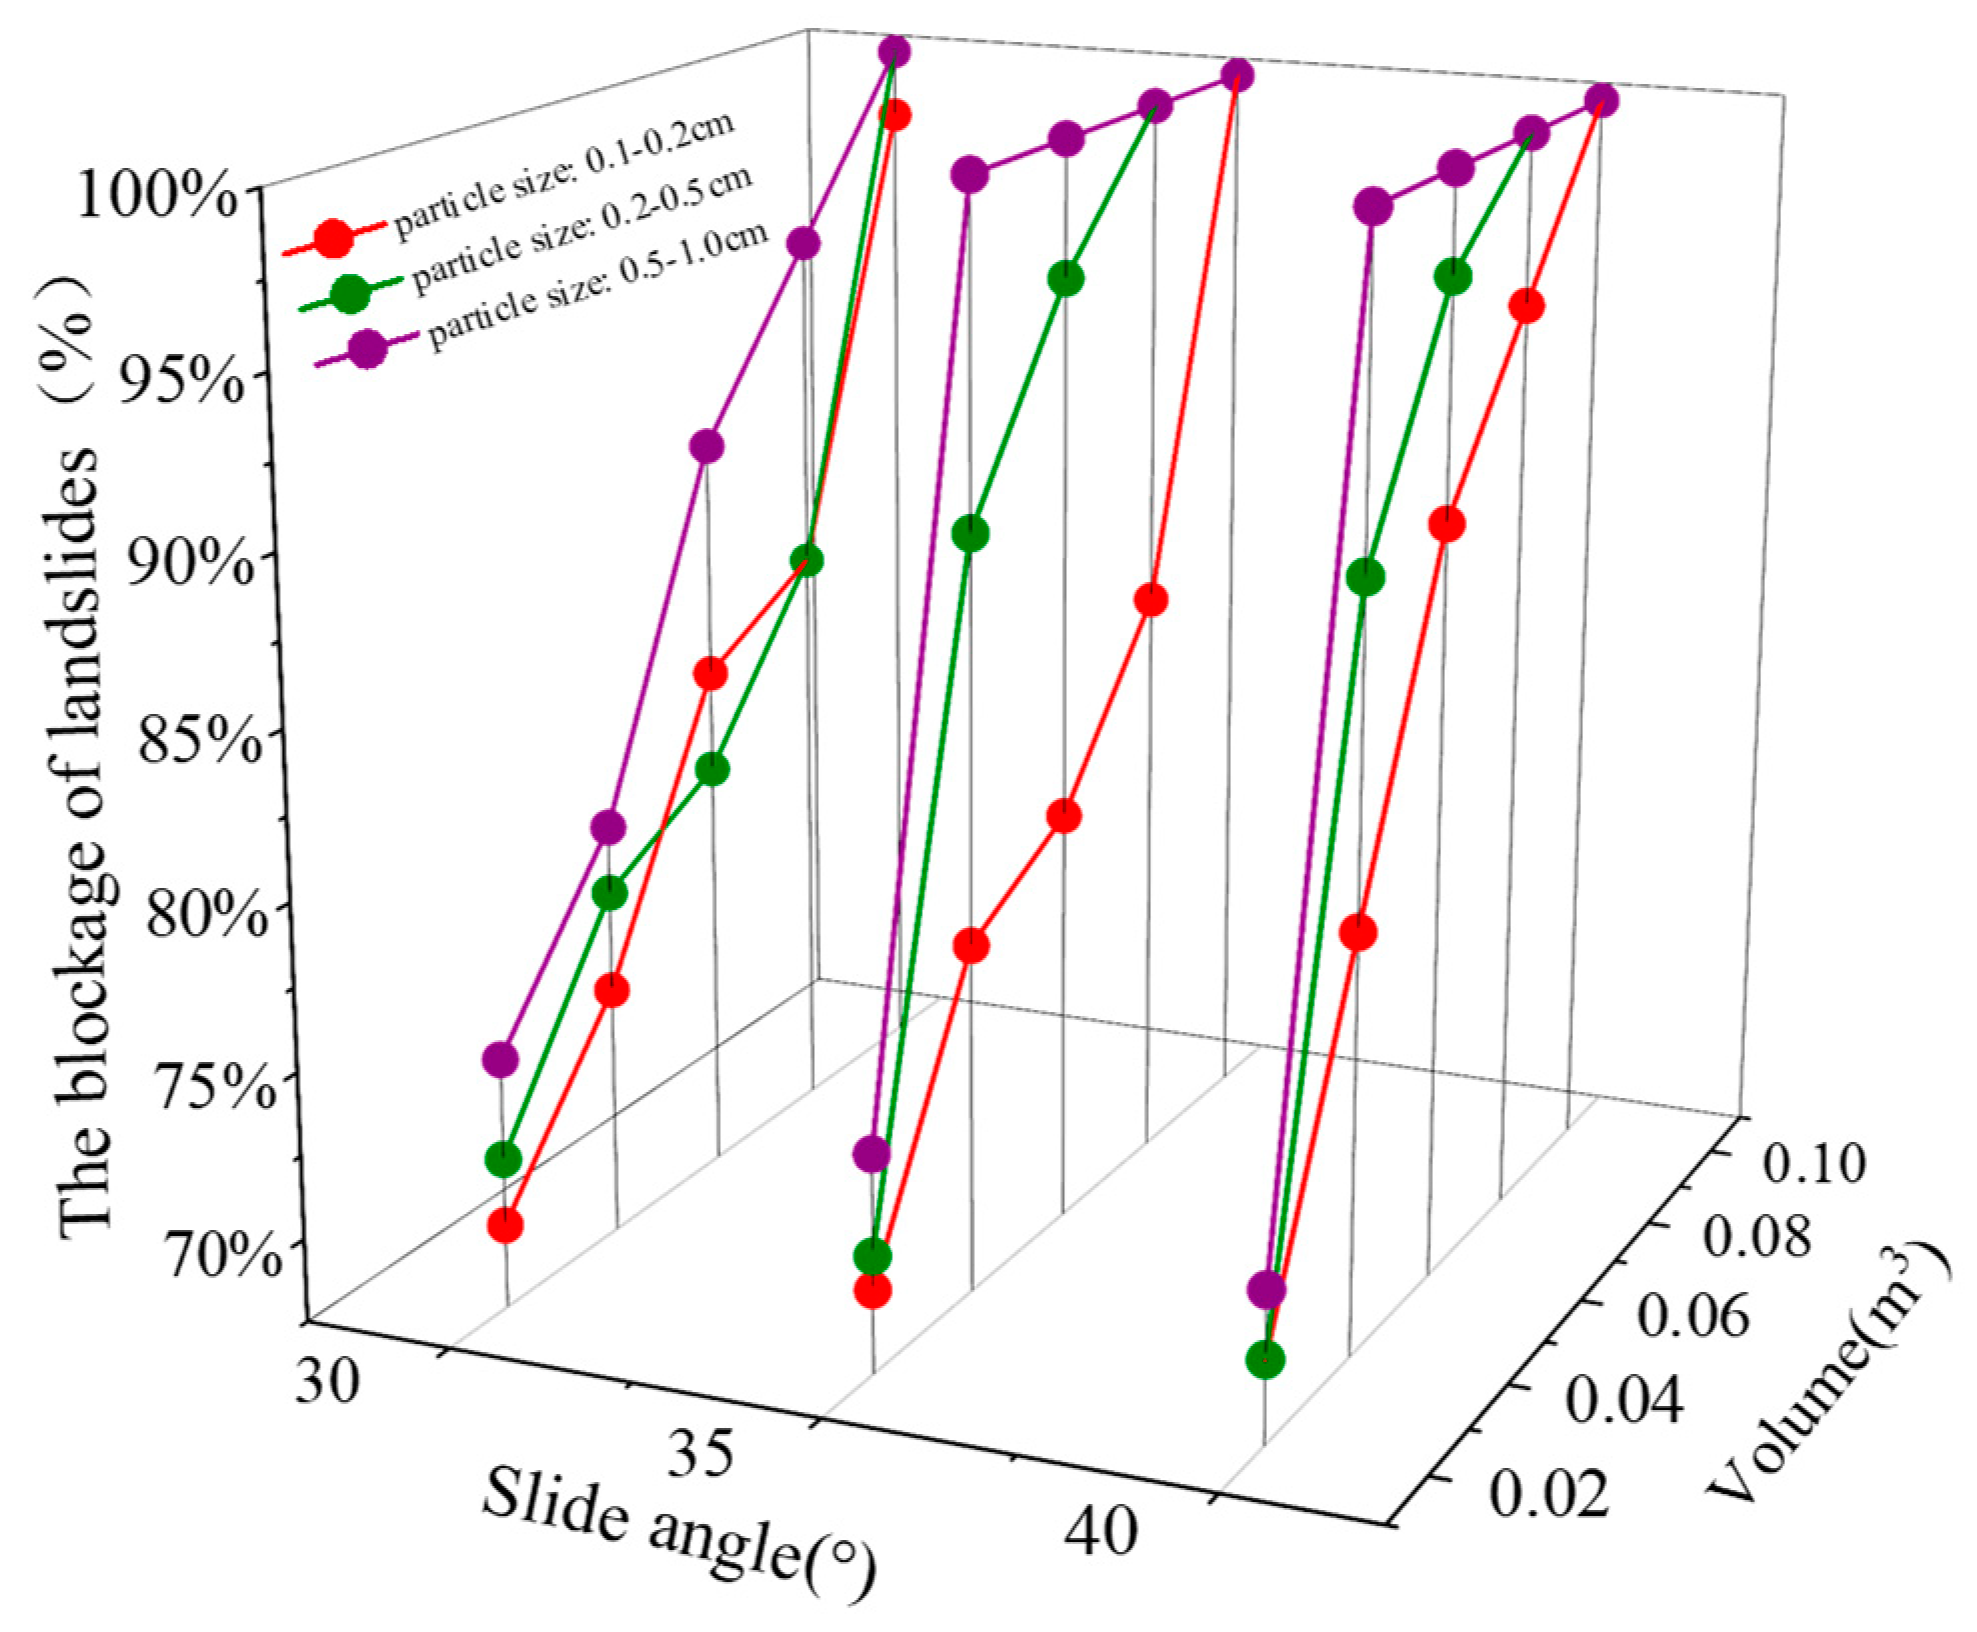
The degree of river blockage can be divided into two cases: partial blockage and complete blockage. There were 60% partial blockages and 40% complete blockages in these tests. The influences of slide angle, landslide volume, and particle size on the degree of river blockage are summarized from the test data, as shown in Figure 17.
The degree of river blockage increases significantly with increasing slide angle, landslide volume, and particle size. As shown in Figure 17, the degrees of river blockage for the conditions of slide angles of 35° and 40° are 10% and 20% higher, respectively, than those of 30°. The increase in slide angle transforms more gravity-potential energy from landslides into kinetic energy when the landslide materials enter the river. When the landslide materials move slowly in the chute, it is easier for a large portion of the landslide materials to stay on the chute. Figure 17 shows that when the landslide volume or particle size increases, the degree of river blockage also increases significantly. The increase in landslide volume could promote the formation of landslide dams. When the material source is sufficient, the landslide is more likely to form a landslide dam, completely blocking the river. As the particle size increases, the landslide will enter the river at a higher speed without staying in the chute, and the degree of river blockage will increase.

4. River Blockage Criteria

4.1. An Improved Probability Model

Landslides may induce two types of river blockage: complete blockage and partial blockage. The secondary disasters induced by these blockage types have completely different developing processes and impact ranges and offer different degrees of hazard. Compared with partial blockage, complete blockage is induced by a larger landslide dam and could form a more dangerous dammed lake. If the massive dammed lake abruptly ruptures, it may produce severe mudslides or flood disasters downstream. Because the dangers of complete blockages are much greater than those of partial blockages, it is critical to evaluate the degree of river blockage caused by landslides. All experimental results were used to explore an assessment model of river blockage under different landslide conditions. Because many factors could affect the degree of river blockage, it is difficult to obtain a quantitative assessment that approximates reality due to the limited experimental factors. Thus, a logic evaluation was carried out by simply assuming complete blockage and partial blockage as 1 and 0 to enhance the applicability of the following method. Here, logistic regression analysis was used to establish the strongest relationships between the river blockage state and the investigated experimental factors. This could also be applied to more complicated cases by taking more factors into consideration.
According to the linear probability model, the probability function of complete river blockage can be expressed as:
y ^ = P ( y = 1 | x ) = β 0 + β 1 x 1 + β 2 x 2 + + β n x n ,
where y indicates the river blockage state, y ^ indicates the probability of complete river blockage, and x i and β n indicate factors that could affect the river blockage state and the corresponding fitting coefficients.
The linear probability model has two drawbacks. First, it violates the assumption of the Gauss–Markov theory that makes the covariance nonzero, thus leading to poor regression. Second, y ^ may indicate two meaningless results where the probability of complete river blockage is negative or greater than 1. Thus, the sigmoid function was selected as a connection function to overcome these drawbacks, and the improved probability model is expressed as:
S ( x , β ) = P ( y = 1 | x ) = 1 1 + e y ^ ,
The result of S ( x , β ) is a number within the range [0, 1]. If a result is less than 0.5, it means a partial blockage; otherwise, it means a complete blockage. The coefficients β could be estimated by the least squares method.
Three factors were considered in this experiment, i.e., the slide angle α, the landslide volume V, and the particle size D. Because the particle size of each group was randomly distributed in a range, the average particle size (D50) was used to determine the fitting coefficients. It can be calculated as the average value of the maximum and minimum particle sizes, so the particle size ranges of 0.1~0.2 cm, 0.2~0.5 cm, and 0.5~1.0 cm are represented by 0.15 cm, 0.35 cm, and 0.75 cm, respectively. Finally, the improved probability model for the experimental results was fitted as:
S ( α , V , D 50 ) = 1 1 + e 37.2 0.6 α 9.1 D 50 156.6 V ,
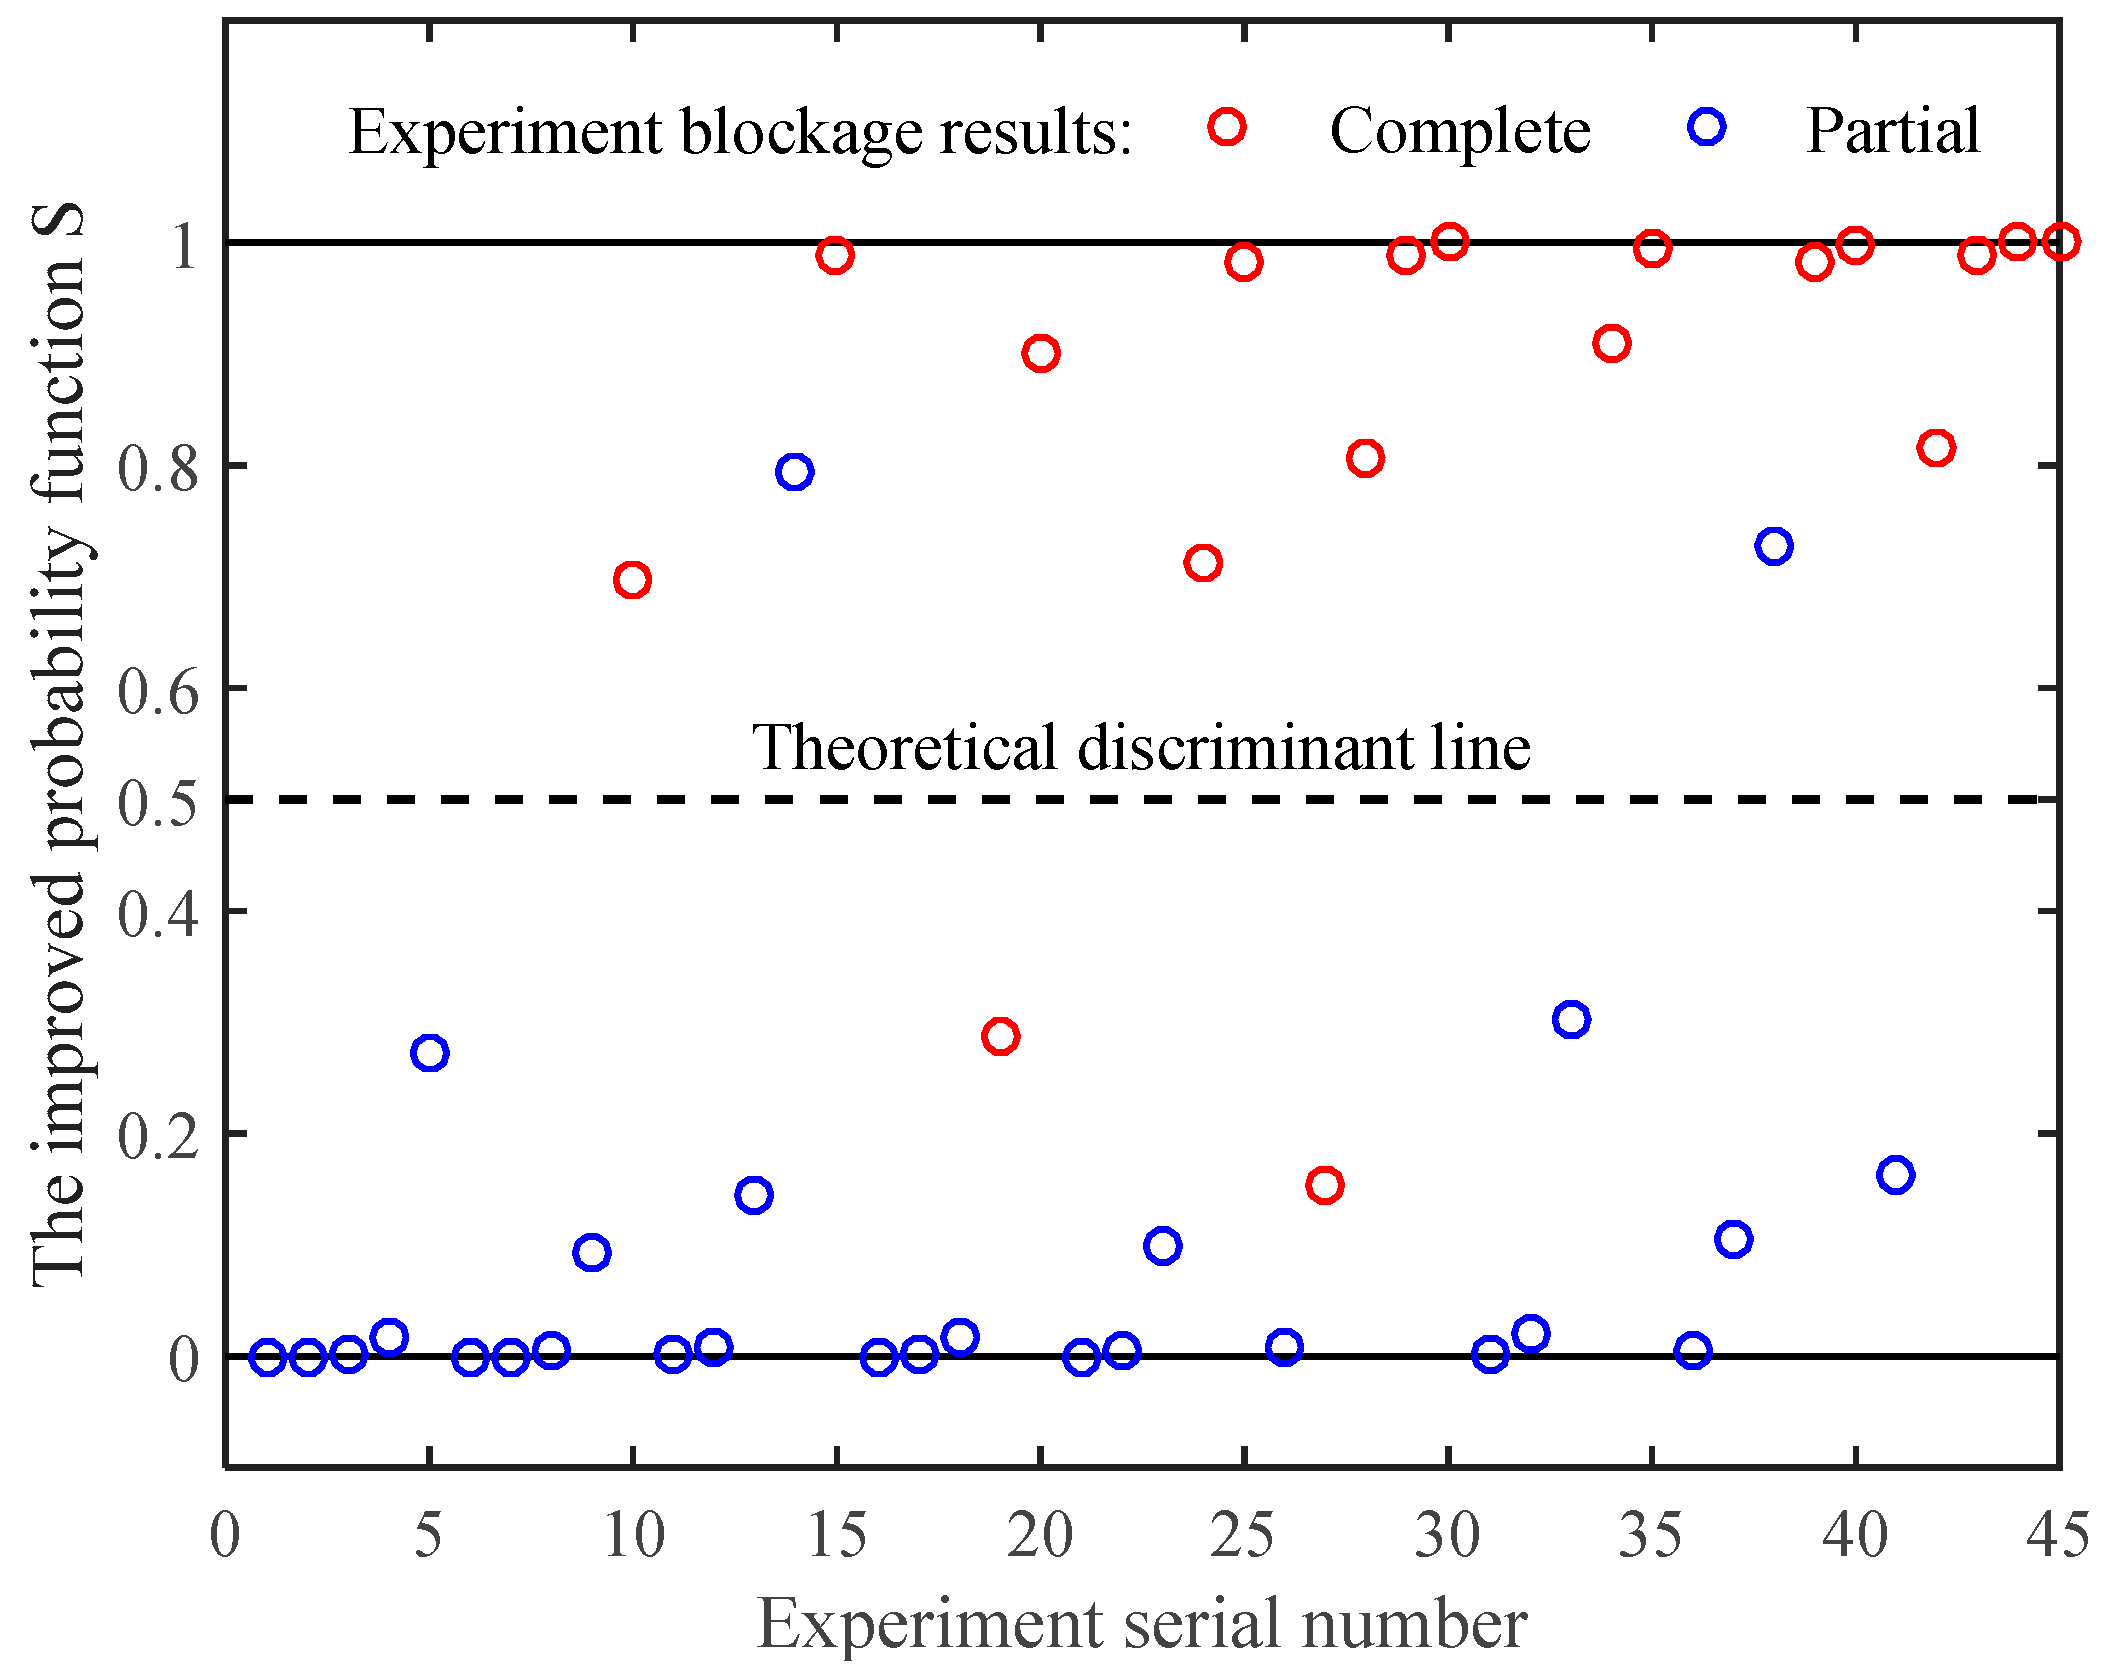
Figure 18 presents the discriminant results of the improved probability model as a scatter plot. These points are divided into two categories by the line S = 0.5. If a point is located below this line, the discriminant result is partial blockage; otherwise, the discriminant result is complete blockage.
The experimental results of blockage states are also presented in Figure 18 in different colors. The red color indicates complete blockage in the experiment, and the blue color indicates partial blockage in the experiment. Compared with the experimental results, only four cases are not correctly classified by the improved probability model. The detailed prediction accuracies are listed in Table 3. The prediction accuracies of partial blockage and complete blockage are approximately 92.6% and 88.9%, respectively, and the overall prediction accuracy is approximately 91.1%. Thus, the improved probability model is accurate enough to predict the blockage state of the landslide dam.

4.2. Discrimination of Statistical Landslide Cases

Tacconi Stefanelli et al. [37] collected a large database that includes three hundred landslide dams from the Alps to the Southern Apennines and Sicily. Fifty-seven information fields, such as the geomorphic parameters of the landslide, the dam body, the valley, and the lake, were recorded in detail. Among these landslides, 60 landslides with the fully recorded geomorphic parameters of the landslide and the stream were chosen to verify the proposed discriminant model. As presented in Appendix A, these parameters are the height difference between the maximum and minimum values of landslide variable H, steepness of landslide slope α, total length of landslide LT, length of landslide body LL, maximum width of landslide Wmax, thickness of landslide T, volume of landslide V, valley width WV, and steepness of riverbed θ.
Considering these factors in the discrimination of landslide cases, the improved probability model was fitted as follows:
S = 1 1 + e 3.172 0.014 H + 0.064 α + 0.003 L T 0.002 L L + 0.0004 W max 0.044 T 5.5 × 10 8 V + 0.023 W V 0.026 θ ,
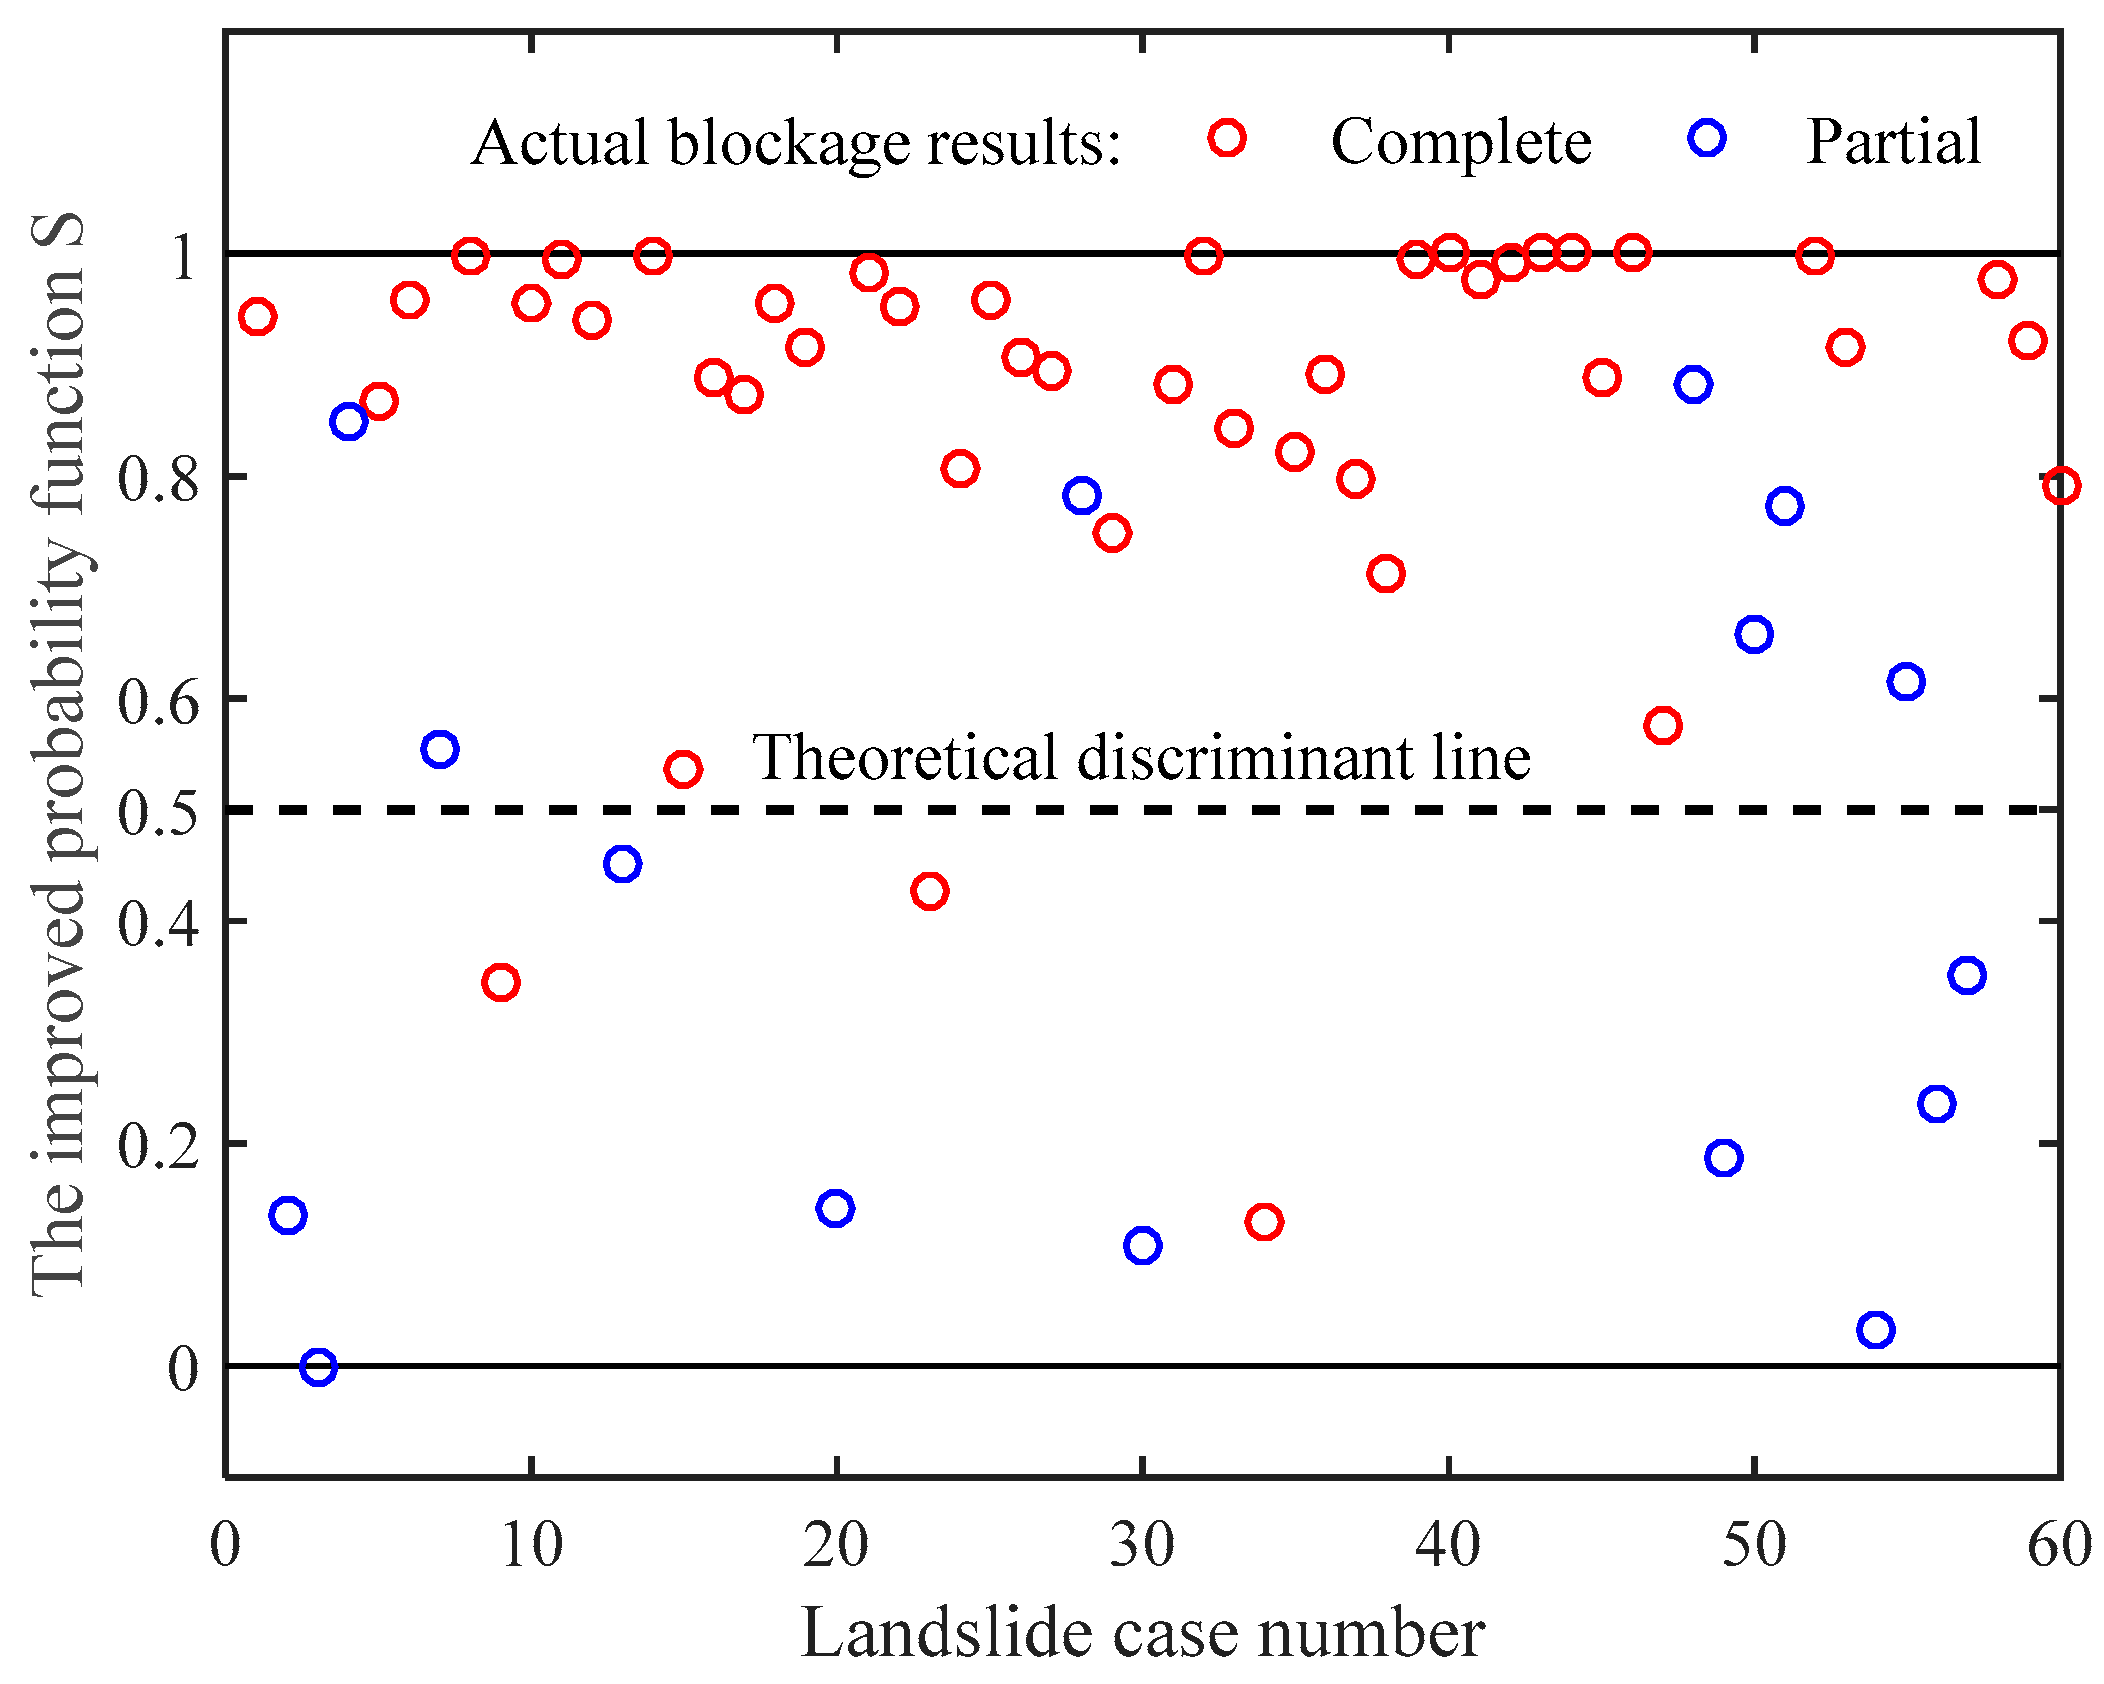
Figure 19 presents the discriminant results of the real landslide cases in a scatter plot. Most points are located above the line of S = 0.5, so most landslide cases are complete blockages. The discriminant results are also marked in different colors to indicate the actual blockage state. Compared with the actual blockage state, seven cases are not correctly classified by the improved probability model. The detailed prediction accuracies are listed in Table 4. The prediction accuracies of partial blockage and complete blockage are approximately 56.3% and 93.2%, respectively, and the overall prediction accuracy is approximately 83.3%. Thus, the improved probability model is accurate enough to predict the blockage state of the landslide dam. Since Equation (4) is obtained from real landslide cases, it can be applied to forecast the blockage state of other potential landslides.

5. Discussion

Although the improved probability model can be used to discriminate between river blockages, it cannot reflect the degree of influence of each factor on river blockages. Thus, correlation analysis was carried out to identify their influence degree based on 60 landslide cases. The correlation coefficients were calculated as
R ( X , B ) = i = 1 n ( X i X ¯ ) ( B i B ¯ ) i = 1 n ( X i X ¯ ) 2 i = 1 n ( B i B ¯ ) 2 ,
where B indicates the logistic variable of river blockage and X indicates the influence factor.
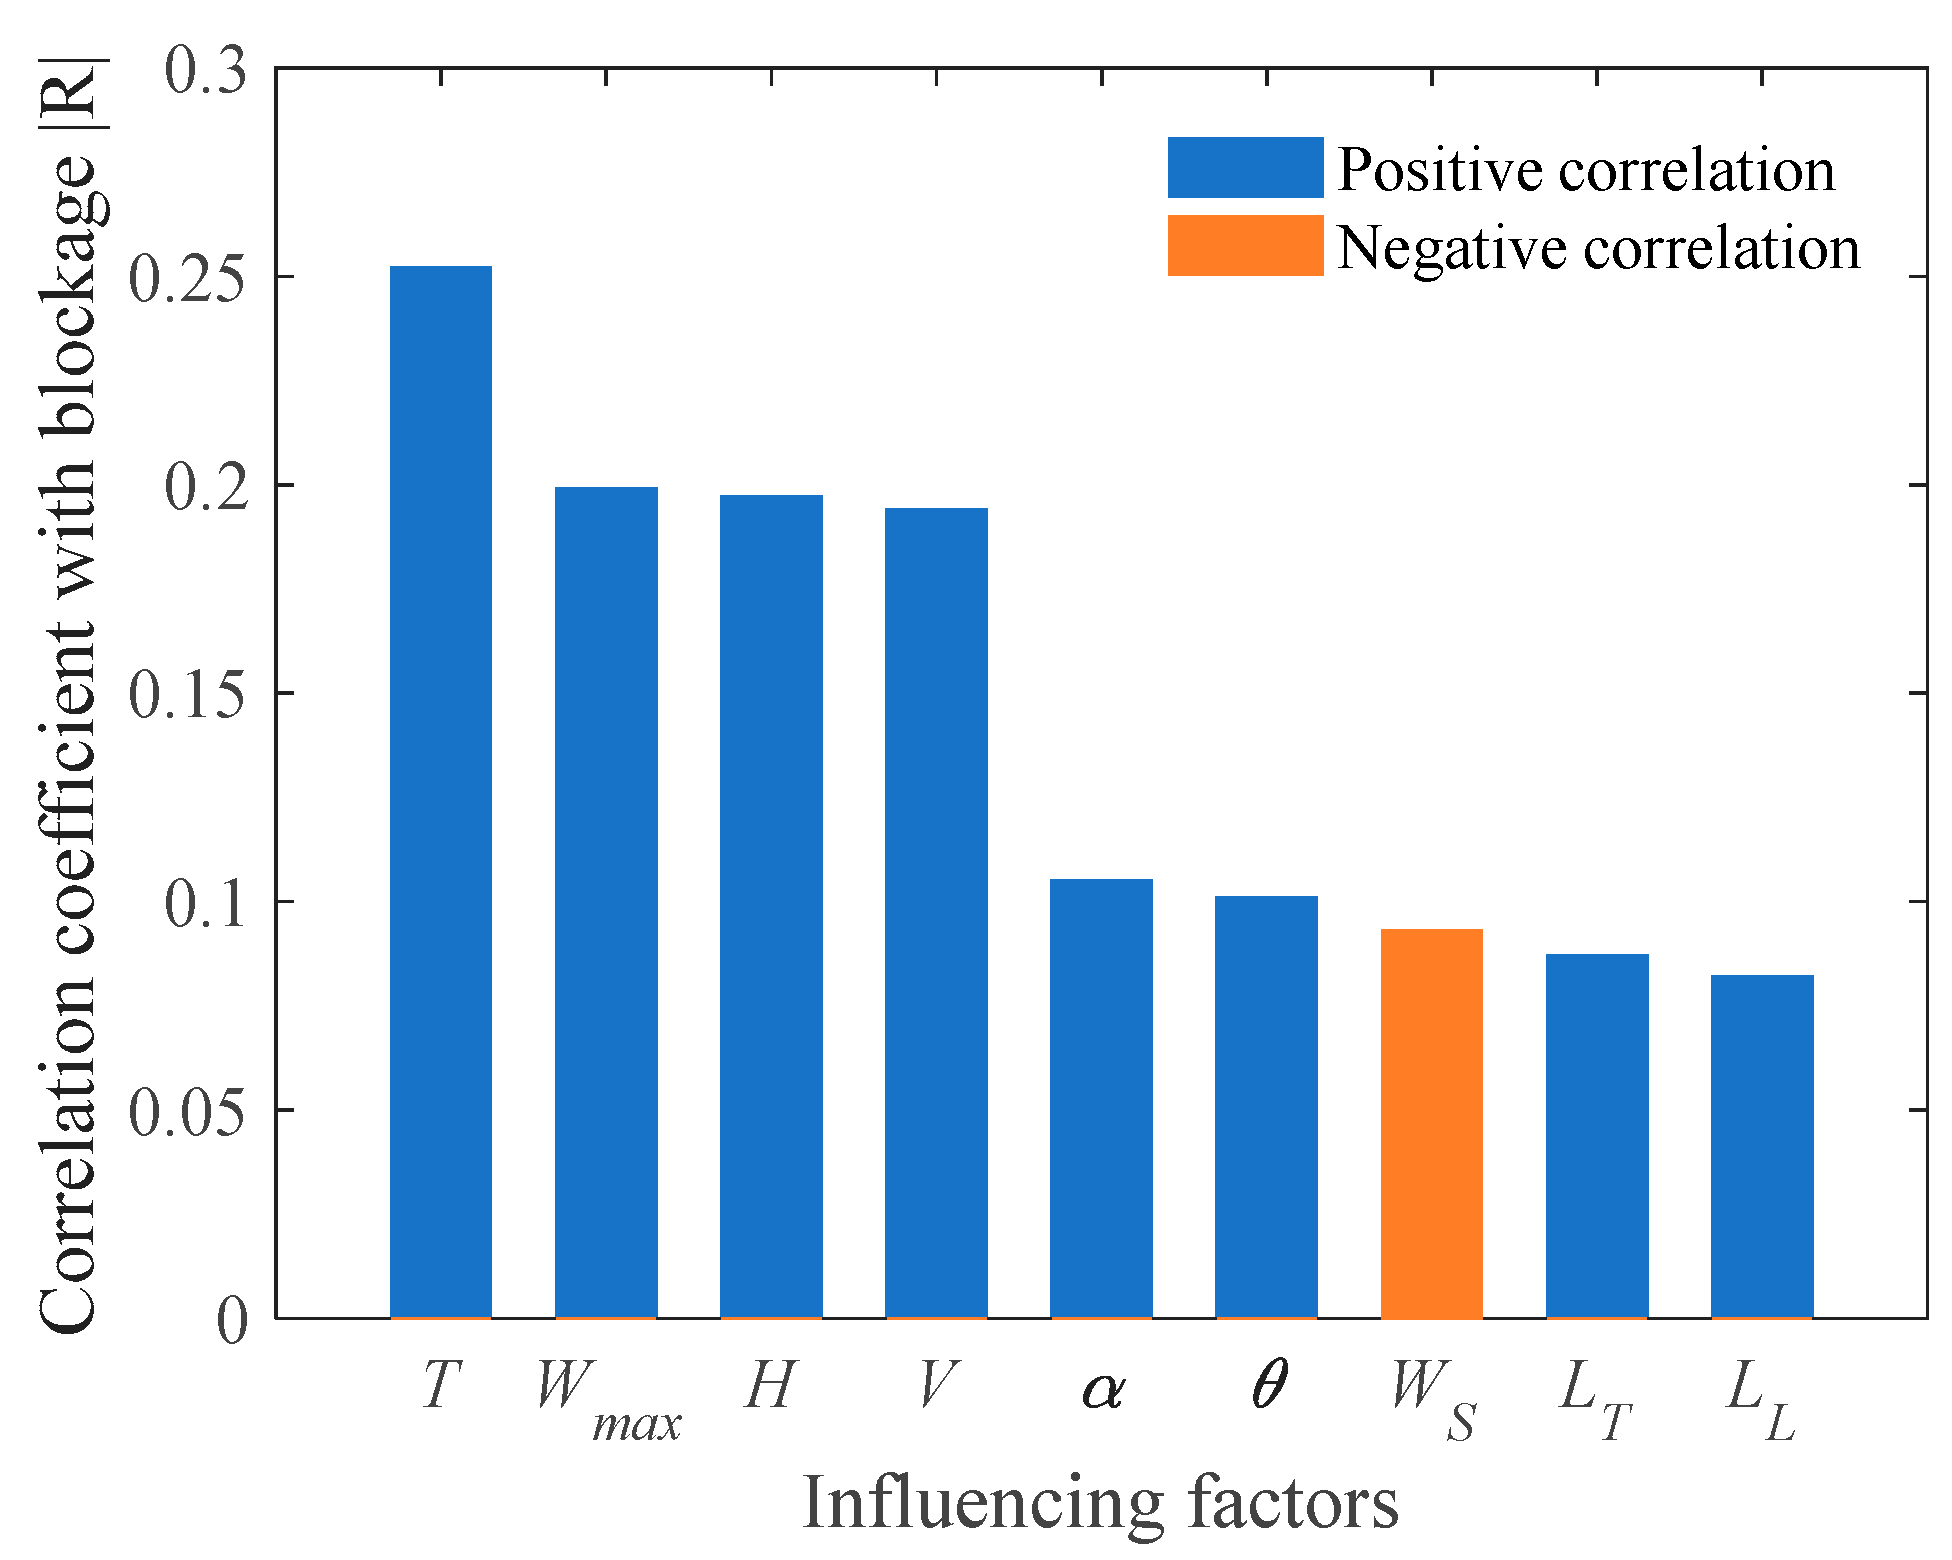
The correlation coefficients between the nine factors in the above analysis and river blockages were calculated, and the results are presented in Figure 20. Most of the factors present a positive correlation with river blockage, except valley width. These factors were sorted in descending order according to their degree of influence on river blockages. The top four factors are the thickness of the landslide T, the maximum width of the landslide Wmax, the height difference between the maximum and minimum values of the landslide variable H, and the volume of the landslide V. These factors are the geometric sizes of the landslide and can be classified as a category related to landslide volume. Thus, the geometric sizes of landslides have the greatest influence on river blockage. Among the geometric sizes, landslide thickness has the highest correlation with river blockage, which is approximately 0.25, which means that a landslide with a higher volume per unit width is more likely to trigger a complete river blockage. The second category in the order is the steepness of topography, which includes the steepness of landslide slope α and steepness of riverbed θ. Their correlations with river blockages are almost the same. River blockages are more likely to form in valleys with steeper topography. The third category in the order is valley width WV, which has a negative correlation with river blockage. The possibility of river blockage decreases as the valley width increases. The fourth category in the order is the length of the landslide, which includes the total length of the landslide LT and the length of the landslide body LL. They were also the geometric sizes of landslides, but they may have less influence on the landslide volume, so they have the lowest correlation with river blockage. Overall, according to the degree of influence, the order of these factors reflects some key geometric attributes, including landslide size, steepness of the topography, width of the valley, and length of the landslide.
The resulting influence degrees of various factors are consistent with some indexes that were used to estimate the degree of river blockage, such as the Morphological Obstruction Index (MOI) proposed by Tacconi Stefanelli et al. [37] and the Blockage Index (BI) proposed by Liao et al. [22]. The MOI takes the landslide volume and the valley width as two important factors that affect the formation of river blockages, while the BI takes the landslide volume and the wet cross-sectional area as two important factors. Thus, both indexes take the landslide volume as the most important factor in discriminating river blockage, and its importance is also demonstrated by the experimental and statistical analyses in this study. The valley width and the wet cross-sectional area belong to the shape factor of the valley, which has a secondary influence on the river blockage, as shown in Figure 20.
To demonstrate the advantage of the proposed probability model, it is compared with the MOI method, which is more widely used than the BI. Tacconi Stefanelli et al. [37] demonstrated that a landslide must block the river when MOI > 0.46 and may block the river when MOI > 0.383. When the proposed method and these two critical MOIs were used to analyze the data listed in Table A1 and discriminate river blockage induced by landslides, the critical MOIs of 0.383 and 0.46 had an accuracy of 36.0% and 81.7%, respectively, while the probability model had an accuracy of 83.3% and was more accurate than the MOI method. The proposed model has higher accuracy because it includes more factors than the MOI method.

6. Conclusions

An experimental study was carried out to investigate river blockages caused by landslides in an experimental setup that consists of a water flume with dynamic water flow. Various slope conditions and landslide materials were tested to explore the influences of slide angle, particle size of deposit, and landslide volume on the river blockage type and degree. Asymmetrical cross-sections of landslide dams were observed. The flow of the water makes the upstream dam slope steeper than the downstream dam slope, and the volume of final deposition decreases after some of the landslide material is washed away.
The degree of river blockage varies from 70% to 100% and increases with increasing chute angle, particle size, and landslide volume. Thus, river blockage is divided into two categories: partial blockage and complete blockage. Furthermore, six subtypes of river blockage were summarized according to the differences between the water depth and the height of the landslide dam. The initial volume of landslides is the key factor controlling the landslide dam height and blockage degree. Landslides with larger particle sizes are more likely to form landslide dams with small height differences and completely block rivers. The increase in slide angle will significantly increase the landslide velocity entering the river, which further affects the formation process and type of landslide dam.
Based on 60 real landslide cases, the influence degrees of these factors are sorted according to key geometric attributes, including landslide size, steepness of the topography, width of the valley, and length of the landslide. An improved probability model was developed to assess the possibility of complete blockage under the influence of these factors. The coefficients of the model were obtained by logistic regression analysis, and the overall prediction accuracies of the experimental results and real landslide cases were approximately 91.1% and 83.3%, respectively, which are accurate enough to predict the blockage state of landslide dams. The proposed model is applicable to more complicated landslide cases by considering more factors that could affect river blockage.
This study has a shortcoming in that the experiment and the proposed model do not include the influence of water flow velocity, which could affect the formation of a landslide dam if its accumulation process takes a relatively long time. The influence of water flow velocity needs further investigation by designing another special flume chute, which could keep both flow velocity and water depth as specific values.

Author Contributions

Conceptualization, L.Z.; methodology, Y.L.; software, Y.-F.H.; validation, M.-L.X. and H.-Q.X.; formal analysis, Y.-F.H.; investigation, Y.-F.H.; writing—original draft preparation, L.Z. and Y.-F.H.; writing—review and editing, M.-L.X. and Y.L.; visualization, H.-Z.L.; supervision, J.-L.P.; funding acquisition, M.-L.X. and Y.L. All authors have read and agreed to the published version of the manuscript.

Funding

This research was funded by the Chinese Academy of Sciences (CAS) program of the “Western Youth Scholar”, grant number E2R2050050, and the National Key R&D Program of China, grant number 2017YFC1501100.

Institutional Review Board Statement

Not applicable.

Informed Consent Statement

Not applicable.

Data Availability Statement

The data presented in this study are available on request from the corresponding author. The data are not publicly available due to ethical restrictions.

Acknowledgments

The authors sincerely acknowledge Jiang-Da He and Jia-Wen Zhou for their help in conducting the laboratory experiments and analyzing the data.

Conflicts of Interest

The authors declare no conflict of interest.

Appendix A

Table A1. The geomorphic parameters of the landslide and the stream of some landslides were collected from Tacconi Stefanelli et al. [37].
NumberLocalityMaterialH
(m)
α
(°)
LT
(m)
LL
(m)
Wmax
(m)
T
(m)
V
(106 m3)
WV
(m)
θ
(°)
Blockage
1Cominetodebris1771282054045022.52.86753.4Complete blockage
2Groppallodebris61811368017007252522.243308.5Partial blockage
3Cianodebris245101640105075037.518.556600.2Partial blockage
4Cervarezzadebris760133300150012007850.544401.3Partial blockage
5Caselledebris20025500380500151.491000.6Complete blockage
6S.Piero in Bagnodebris420545002900180050136.593001.2Complete blockage
7Tozzirock33516.61370900400203.142250.5Partial blockage
8S.Agata Feltriaearth5938.24530300013753064.76754.4Complete blockage
9Sorbanorock2319.31640950350355.822251.1Complete blockage
10Pian de’ Romitidebris255300160120200.72200.5Complete blockage
11Fosso Falteronadebris35030700530200101.402510Complete blockage
12Roncovetrodebris3357.825001500280153.30403.4Complete blockage
13Gallarerock9011.5590400110250.581750.6Partial blockage
14Scannobedrock49511.73200240020005082.002000.6Complete blockage
15Schiazzanodebris and earth7551.32256070150.04401.9Complete blockage
16Corniolorock325181000530420153.001400.9Complete blockage
17Valderchiadebris11014.3430400170150.50903.1Partial blockage
18Castello di Serravalledebris39024.91030840280101.001302.6Partial blockage
19Boschi di Valoriaearth81013350020006201013.002501.7Partial blockage
20Rosoladebris904.31200620350121.001803.5Partial blockage
21Roccalbegnaearth23410.213001300400208.008010.2Partial blockage
22Piaggiagrande-Renaiorock and debris8318.7245215130300.70609.5Partial blockage
23Camporelladebris26013.311001000300505.003201.9Partial blockage
24Ossoladebris1707.71250950270153.001101.1Partial blockage
25Settefratirock and debris6318.8185135180270.344517.2Partial blockage
26Benedellorock and debris246101400830480203.50901.7Partial blockage
27Dragaearth2409.714001200500206.501353.8Partial blockage
28Bardeadebris4912230130140100.20802.4Partial blockage
29Zillonarock and debris14512.6650375160100.351101.1Partial blockage
30Voltredebris and earth1159.1719690150101.002600.9Partial blockage
31Cà di Ricoearth659410380170100.50652.7Partial blockage
32Lago Costantinodebris and earth32028.160036075013016.002003.4Partial blockage
33Ronchidebris11514460410365202.001101.9Partial blockage
34Covattaearth28011.11430700500102.002500.3Partial blockage
35S. Cristinadebris1017.280075012007025.002503Complete blockage
36Marrodebris584.47506507005015.001501.9Complete blockage
37Cumidebris and earth614.48007109006020.002102Complete blockage
38Cuccodebris and earth192.2500360270201.001157.8Complete blockage
39Antronadebris and rock1500452900120017008028.006206.4Complete blockage
40Val Polarock134032203590017009040.004001.2Complete blockage
41Alleghedebris and rock90030200075014007020.004000.8Complete blockage
42Val Vanoidebris820252428600120010015.003001.6Complete blockage
43Bortadebris and rock925302200950115010030.002500.5Complete blockage
44Villarrock78018.7280023001500120150.003301.3Complete blockage
45Fenestrellerock and debris30014160012001100100100.005001.1Complete blockage
46Serre la Vouterock and debris59018.1190018001350140150.005000.9Complete blockage
47Piurodebris and rock12505530001000900106.004503.6Complete blockage
48Contr. Cugno Giovannirock14519.9400230275401.321303.2Partial blockage
49Randazzo-Norddebris and rock250.7220022008002018.421902.1Partial blockage
50Contr. Vettranarock and earth4157.930002350720126.211801.6Partial blockage
51Roccella Valdemone-
Ovest
rock and earth13017.242041026090.481153.6Partial blockage
52Portella Colla IIdebris, earth,
and rock
129011.762504500300040282.608503.5Complete blockage
53Contr. Ufrarock13010.570064010008740.002951.1Complete blockage
54Fondo Baroneearth403.1750600300181.702902.4Partial blockage
55Contr. Salmicellarock24028.1450185280200.541802Partial blockage
56Contr. La Sarcullarock20027.8380220800151.002308.9Partial blockage
57Contr. Scala Vecchiarock15031250230400300.802100.4Partial blockage
58Cavallerizzorock and debris14391100900200405.00658.4Complete blockage
59Testidebris489.4340290400201.21609.8Complete blockage
60Barattanoearth276.424020050140.07953.6Complete blockage

References

  1. Xu, C.; Dai, F.; Yao, X.; Chen, J.; Tu, X.; Sum, Y.; Wang, Z. GIS-based landslide susceptibility assessment using analytical hierarchy process in Wenchuan earthquake region. Chin. J. Rock Mech. Eng. 2009, 28, 3978–3985. [Google Scholar]
  2. Chen, C.-Y.; Chang, J.-M. Landslide dam formation susceptibility analysis based on geomorphic features. Landslides 2016, 13, 1019–1033. [Google Scholar] [CrossRef]
  3. Fan, X.; Xu, Q.; Scaringi, G.; Dai, L.; Li, W.; Dong, X.; Zhu, X.; Pei, X.; Dai, K.; Havenith, H.-B. Failure mechanism and kinematics of the deadly 24 June 2017 Xinmo landslide, Maoxian, Sichuan, China. Landslides 2017, 14, 2129–2146. [Google Scholar] [CrossRef]
  4. Yin, Y.; Cheng, Y.; Liang, J.; Wang, W. Heavy-rainfall-induced catastrophic rockslide-debris flow at Sanxicun, Dujiangyan, after the Wenchuan Ms 8.0 earthquake. Landslides 2016, 13, 9–23. [Google Scholar] [CrossRef]
  5. Zhou, J.-W.; Xu, F.-G.; Yang, X.-G.; Yang, Y.-C.; Lu, P.-Y. Comprehensive analyses of the initiation and landslide-generated wave processes of the 24 June 2015 Hongyanzi landslide at the Three Gorges Reservoir, China. Landslides 2016, 13, 589–601. [Google Scholar] [CrossRef]
  6. Zhang, S.-L.; Yin, Y.-P.; Hu, X.-W.; Wang, W.-P.; Zhu, S.-N.; Zhang, N.; Cao, S.-H. Initiation mechanism of the Baige landslide on the upper reaches of the Jinsha River, China. Landslides 2020, 17, 2865–2877. [Google Scholar] [CrossRef]
  7. Dong, J.-J.; Lai, P.-J.; Chang, C.-P.; Yang, S.-H.; Yeh, K.-C.; Liao, J.-J.; Pan, Y.-W. Deriving landslide dam geometry from remote sensing images for the rapid assessment of critical parameters related to dam-breach hazards. Landslides 2014, 11, 93–105. [Google Scholar] [CrossRef]
  8. Han, L.; Zhang, J.; Zhang, Y.; Ma, Q.; Alu, S.; Lang, Q. Hazard assessment of earthquake disaster chains based on a Bayesian network model and ArcGIS. IJGI 2019, 8, 210. [Google Scholar] [CrossRef]
  9. Ouimet, W.B.; Whipple, K.X.; Royden, L.H.; Sun, Z.; Chen, Z. The influence of large landslides on river incision in a transient landscape: Eastern margin of the Tibetan Plateau (Sichuan, China). Earth Surf. Process. Landf. 2007, 119, 1462–1476. [Google Scholar] [CrossRef]
  10. Ermini, L.; Casagli, N. Prediction of the behaviour of landslide dams using a geomorphological dimensionless index. Surf. Process. Landf. 2003, 28, 31–47. [Google Scholar] [CrossRef]
  11. Pei, R.; Ni, Z.; Meng, Z.; Zhang, B.; Liao, R. Characteristics of secondary mountain disaster chain in Wenchuan earthquake. Am. J. Civ. Eng. 2017, 5, 408–413. [Google Scholar] [CrossRef]
  12. Guo, X.; Cui, P.; Li, Y.; Zou, Q.; Kong, Y. The formation and development of debris flows in large watersheds after the 2008 Wenchuan Earthquake. Landslides 2016, 13, 25–37. [Google Scholar] [CrossRef]
  13. Xu, W.-J.; Xu, Q.; Wang, Y.-J. The mechanism of high-speed motion and damming of the Tangjiashan landslide. Eng. Geol. 2013, 157, 8–20. [Google Scholar] [CrossRef]
  14. Zhou, G.G.D.; Roque, P.J.C.; Xie, Y.; Song, D.; Zou, Q.; Chen, H. Numerical study on the evolution process of a geohazards chain resulting from the Yigong landslide. Landslides 2020, 17, 2563–2576. [Google Scholar] [CrossRef]
  15. Gan, B.-R.; Yang, X.-G.; Liao, H.-M.; Zhou, J.-W. Flood routing process and high dam interception of natural discharge from the 2018 Baige landslide-dammed lake. Water 2020, 12, 605. [Google Scholar] [CrossRef]
  16. Gu, X.B.; Ma, Y.; Wu, Q.H.; Ji, X.J.; Bai, H. The risk assessment of landslide hazards in Shiwangmiao based on intuitionistic fuzzy sets-Topsis model. Nat. Hazards 2022, 111, 283–303. [Google Scholar] [CrossRef]
  17. Song, H.; Cui, W. A large-scale colluvial landslide caused by multiple factors: Mechanism analysis and phased stabilization. Landslides 2016, 13, 321–335. [Google Scholar] [CrossRef]
  18. Montrasio, L.; Schilirò, L.; Terrone, A. Physical and numerical modelling of shallow landslides. Landslides 2016, 13, 873–883. [Google Scholar] [CrossRef]
  19. Zhao, T.; Dai, F.; Xu, N.-W. Coupled DEM-CFD investigation on the formation of landslide dams in narrow rivers. Landslides 2017, 14, 189–201. [Google Scholar] [CrossRef]
  20. Zhu, Y.; Xu, S.; Zhuang, Y.; Dai, X.; Lv, G.; Xing, A. Characteristics and runout behaviour of the disastrous 28 August 2017 rock avalanche in Nayong, Guizhou, China. Eng. Geol. 2019, 259, 105154. [Google Scholar] [CrossRef]
  21. Wang, W.; Chen, G.; Zhang, Y.; Zheng, L.; Zhang, H. Dynamic simulation of landslide dam behavior considering kinematic characteristics using a coupled DDA-SPH method. Eng. Anal. Bound. Elem. 2017, 80, 172–183. [Google Scholar] [CrossRef]
  22. Liao, H.-M.; Yang, X.-G.; Lu, G.-D.; Tao, J.; Zhou, J.-W. Experimental study on the river blockage and landslide dam formation induced by rock slides. Eng. Geol. 2019, 261, 105269. [Google Scholar] [CrossRef]
  23. Wu, H.; Nian, T.-K.; Chen, G.-Q.; Zhao, W.; Li, D.-Y. Laboratory-scale investigation of the 3-D geometry of landslide dams in a U-shaped valley. Eng. Geol. 2020, 265, 105428. [Google Scholar] [CrossRef]
  24. Ge, Y.; Zhou, T.; Tang, H.; Lin, Z. Influence of the impact angle on the motion and deposition of granular flows. Eng. Geol. 2020, 275, 105746. [Google Scholar] [CrossRef]
  25. Chen, K.-T.; Chen, T.-C.; Chen, X.-Q.; Chen, H.-Y.; Zhao, W.-Y. An experimental determination of the relationship between the minimum height of landslide dams and the run-out distance of landslides. Landslides 2021, 18, 2111–2124. [Google Scholar] [CrossRef]
  26. Zhou, Y.; Shi, Z.; Zhang, Q.; Liu, W.; Peng, M.; Wu, C. 3D DEM investigation on the morphology and structure of landslide dams formed by dry granular flows. Eng. Geol. 2019, 258, 105151. [Google Scholar] [CrossRef]
  27. Zhou, Y.; Shi, Z.; Zhang, Q.; Jang, B.; Wu, C. Damming process and characteristics of landslide-debris avalanches. Soil Dyn. Earthq. Eng. 2019, 121, 252–261. [Google Scholar] [CrossRef]
  28. Fan, X.; Rossiter, D.G.; van Westen, C.J.; Xu, Q.; Görüm, T. Empirical prediction of coseismic landslide dam formation. Earth Surf. Process. Landf. 2014, 39, 1913–1926. [Google Scholar] [CrossRef]
  29. Nian, T.; Wu, H.; Chen, G.; Zheng, D.; Zhang, Y.; Li, D. Research progress on stability evaluation method and disaster chain effect of landslide dam. Chin. J. Rock Mech. Eng. 2018, 37, 1796–1812. [Google Scholar]
  30. Guo, D.; Hamada, M.; He, C.; Wang, Y.; Zou, Y. An empirical model for landslide travel distance prediction in Wenchuan earthquake area. Landslides 2014, 11, 281–291. [Google Scholar] [CrossRef]
  31. Nian, T.-K.; Wu, H.; Li, D.-Y.; Zhao, W.; Takara, K.; Zheng, D.-F. Experimental investigation on the formation process of landslide dams and a criterion of river blockage. Landslides 2020, 17, 2547–2562. [Google Scholar] [CrossRef]
  32. Zhong, Q.; Chen, S.; Shan, Y. Prediction of the overtopping-induced breach process of the landslide dam. Eng. Geol. 2020, 274, 105709. [Google Scholar] [CrossRef]
  33. Jiang, X.; Cui, P.; Chen, H.; Guo, Y. Formation conditions of outburst debris flow triggered by overtopped natural dam failure. Landslides 2017, 14, 821–831. [Google Scholar]
  34. Hu, Y.-X.; Li, H.-B.; Lu, G.-D.; Fan, G.; Zhou, J.-W. Influence of size gradation on particle separation and the motion behaviors of debris avalanches. Landslides 2021, 18, 1845–1858. [Google Scholar] [CrossRef]
  35. Hao, M.; Xu, Q.; Yang, X.; Peng, T.; Zhou, J. Physical modeling tests on inverse grading of particles in high speed landslide debris. Chin. J. Rock Mech. Eng. 2015, 34, 472–479. [Google Scholar]
  36. Liu, W.; He, S. Dynamic simulation of a mountain disaster chain: Landslides, barrier lakes, and outburst floods. Nat. Hazards 2018, 90, 757–775. [Google Scholar] [CrossRef]
  37. Tacconi Stefanelli, C.; Segoni, S.; Casagli, N.; Catani, F. Geomorphic indexing of landslide dams evolution. Eng. Geol. 2016, 208, 1–10. [Google Scholar] [CrossRef]
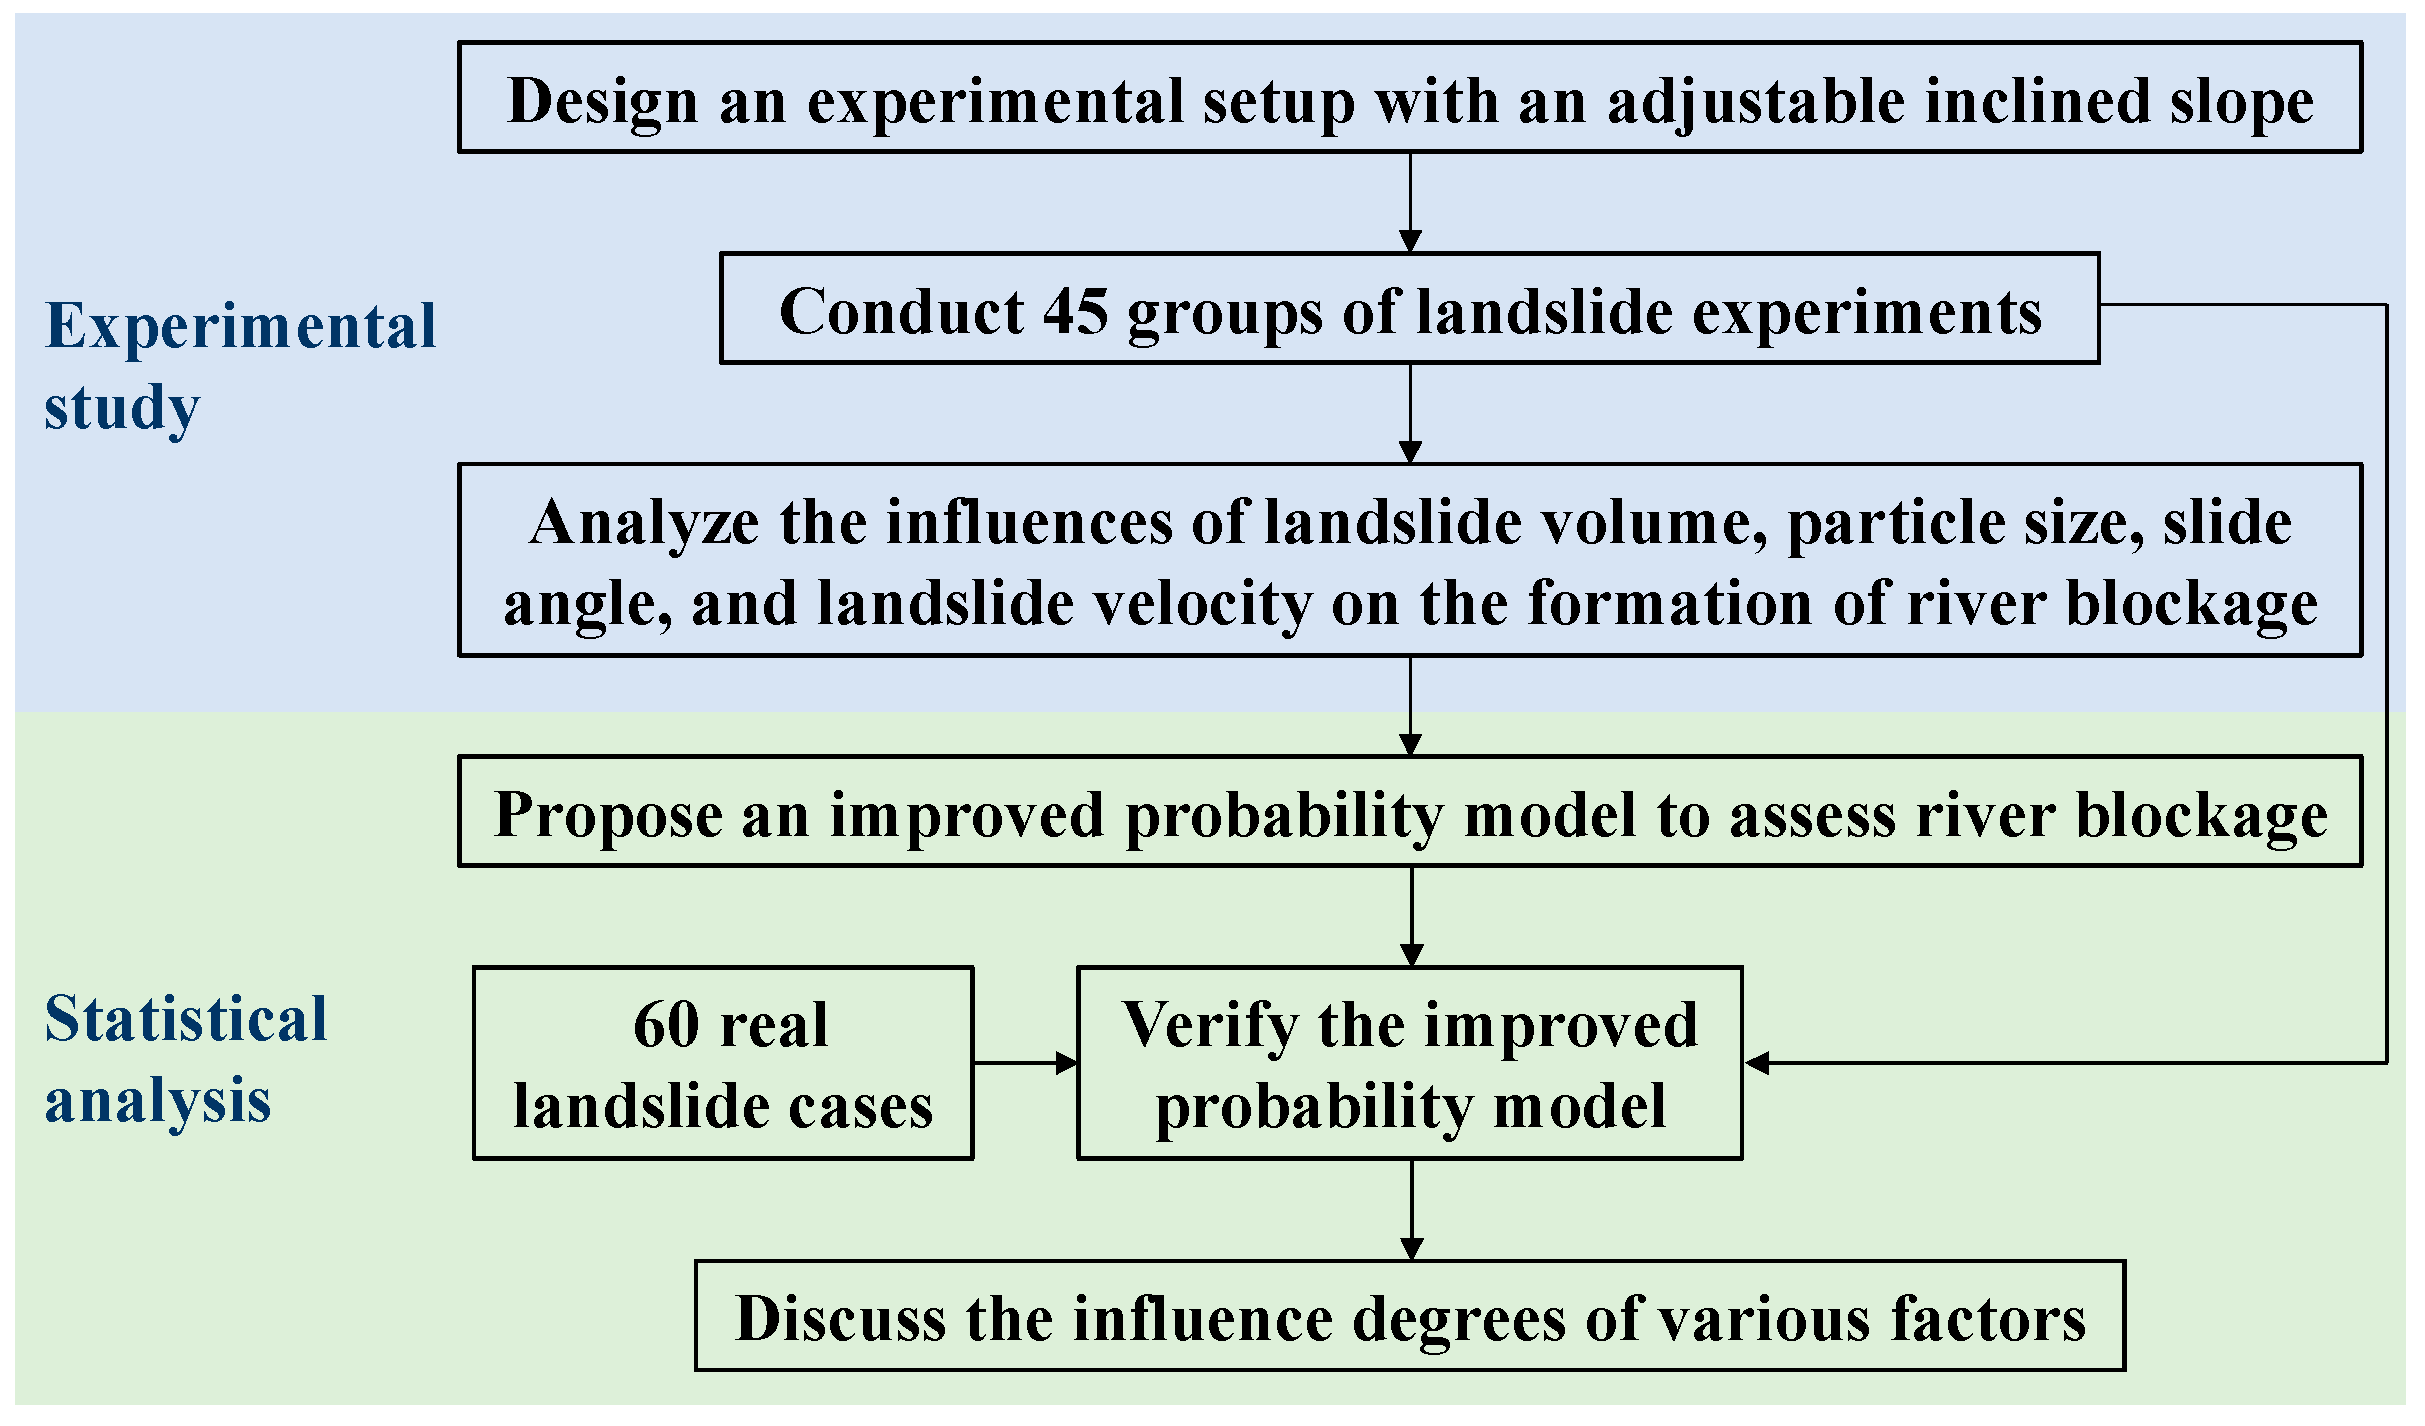
Figure 1. Flowchart of this study.
Applsci 13 12003 g001
Figure 2. The sketch of the experimental setup: (a) left view of the experimental setup and (b) vertical view of the setup.
Applsci 13 12003 g002
Figure 3. The setup for the landslide experiment: (a) overall view of the experimental setup; and (b) the inclined chute for landslide simulations.
Applsci 13 12003 g003
Figure 4. Materials with different particle sizes used for laboratory testing: (a) d1 = 0.1–0.2 cm; (b) d2 = 0.2–0.5 cm; and (c) d3 = 0.5–1.0 cm.
Applsci 13 12003 g004
Figure 5. Sequences of the landslide dam formation at different times. (a) Front view; (b) left side view.
Applsci 13 12003 g005
Figure 6. Changes in event time. (a) Variation in landslide movement time; (b) variation in landslide dam formation time; and (c) variation in total landslide movement time.
Applsci 13 12003 g006
Figure 7. Different types of river blockages are caused by landslide dams.
Applsci 13 12003 g007
Figure 8. Photographs of typical river blockages by landslides. The red line marks the shape of the landslide dam.
Applsci 13 12003 g008
Figure 9. Proportion of each blockage type.
Applsci 13 12003 g009
Figure 10. The variation in experimental river blockage under the influence of landslide volume.
Applsci 13 12003 g010
Figure 11. The variation in the maximum and minimum dam heights. (a) The maximum dam height, and (b) the minimum dam height.
Applsci 13 12003 g011
Figure 12. The variation in experimental river blockage is under the influence of particle size.
Applsci 13 12003 g012
Figure 13. The variation in the transversal location of the peak deposition.
Applsci 13 12003 g013
Figure 14. The variation in experimental river blockage under the influence of slide angle.
Applsci 13 12003 g014
Figure 15. Photographs of river blockages for different velocities of landslides entering rivers.
Applsci 13 12003 g015
Figure 16. The variation in velocity entering the river.
Applsci 13 12003 g016
Figure 17. Variations in river blockage degree with slide volume under different conditions of slide angle and particle size.
Applsci 13 12003 g017
Figure 18. Discriminant results of the experiments.
Applsci 13 12003 g018
Figure 19. Discriminant results of the real landslide cases.
Applsci 13 12003 g019
Figure 20. Correlation between each influencing factor and river blockage.
Applsci 13 12003 g020
Table 1. Experimental scheme of river blockage caused by landslides.
Experimental
ID
Slide Angle
(°)
Particle Size
(cm)
Volume
(m3)
Flow Velocity
(m/s)
Flow Rate
(m3/s)
A1-1300.1–0.20.020.63210.0199
A1-20.04
A1-30.06
A1-40.08
A1-50.1
A2-10.2–0.50.020.63780.0201
A2-20.04
A2-30.06
A2-40.08
A2-50.1
A3-10.5–1.00.020.64120.0202
A3-20.04
A3-30.06
A3-40.08
A3-50.1
B1-1350.1–0.20.020.62630.0197
B1-20.04
B1-30.06
B1-40.08
B1-50.1
B2-10.2–0.50.020.61450.0194
B2-20.04
B2-30.06
B2-40.08
B2-50.1
B3-10.5–1.00.020.63780.0201
B3-20.04
B3-30.06
B3-40.08
B3-50.1
C1-1400.1–0.20.020.63770.0201
C1-20.04
C1-30.06
C1-40.08
C1-50.1
C2-10.2–0.50.020.62760.0198
C2-20.04
C2-30.06
C2-40.08
C2-50.1
C3-10.5–1.00.020.62960.0198
C3-20.04
C3-30.06
C3-40.08
C3-50.1
Table 2. Classification of river blockage types.
River Blockage
Type
Degree of BlockageRelationships of Characteristic HeightsRepresentative Experimental Test
Type 1-1Partially blockedHmin < hw
Hmax appears in the middle of the river.
A1-1, A3-1
Type 1-2Hmax > hw > Hmin
Hmax appears on the opposite side.
B3-1, C3-1
Type 1-3Hmax > hw > Hmin
Hmax appears on the landslide side.
A2-2, B1-2
Type 2-1Fully blockedHmax > Hmin > hw
Hmax appears in the middle of the river.
B3-3, C3-2
Type 2-2Hmax > Hmin > hw
Hmax appears on the landslide side.
\
Type 2-3Hmax > Hmin > hw
Hmax appears on the opposite side.
A2-5, B1-4
Table 3. Prediction accuracies of the improved probability model based on the experimental results.
Experiment ResultsPrediction Results
Experiment
Blockage State
Total Number
of Groups
Number of
Partial Blockage
Number of
Complete Blockage
Accuracy
Partial blockage2725292.6%
Complete blockage1821688.9%
Overall accuracy 91.1%
Table 4. Prediction accuracies of the improved probability model based on real landslide cases.
Real Landslide CasesPrediction Results
Blockage State
of Landslide Case
Total Number
of Cases
Number of
Partial Blockage
Number of
Complete Blockage
Accuracy
Partial blockage169756.3%
Complete blockage4434193.2%
Overall accuracy 83.3%
Disclaimer/Publisher’s Note: The statements, opinions and data contained in all publications are solely those of the individual author(s) and contributor(s) and not of MDPI and/or the editor(s). MDPI and/or the editor(s) disclaim responsibility for any injury to people or property resulting from any ideas, methods, instructions or products referred to in the content.