Abstract
In this study, the characteristics of wind-blown sand in the hinterland of the Tengger Desert and the regularity of sand deposition in road cutting are studied by combining a field test and numerical simulation. Firstly, the meteorological observation system is used to obtain the long-term monitoring of the Tengger Desert hinterland, and the perennial wind speed, wind direction, and strong wind period are obtained. Then, a three-dimensional ultrasonic anemometer and stepwise sand accumulation instrument are used to measure the transient wind-blown sand velocity and density at the top of the cutting slope, which provide the basis and verification for the numerical simulation. Finally, Fluent software (2020R2) is used to establish two numerical models with and without grading. Based on Euler’s two-fluid theory and fluctuating-wind user-defined functions, the movement of wind-blown sand in the cutting section of the desert hinterland is simulated, and the regularity of sand accumulation in the cutting section is obtained. The main conclusions are as follows: (1) The strong wind period in the hinterland of the Tengger Desert in 2021 mainly occurs from April to August, and the mainstream wind direction is concentrated in the WSW and SW directions. (2) The sand in the hinterland of the Tengger Desert is mainly medium–fine, and the particle size range is mainly concentrated at 0.075–0.250 mm, accounting for 98.2% of the total sand; the curve of the wind-blown sand density with height is oblique and L-shaped. (3) The method of grading excavation is beneficial to reduce the sand accumulation rate on the road’s surface.
1. Introduction
There is a large area of desert in the northwest of China, and the wind speed is as high as 30 m/s. With the rapid development of northwest China, more and more new expressways pass through desert areas, and the safety of highway operations is seriously threatened by the wind and sand flow. The design speed of these expressways is often 100 km/h, and sand accumulation is not allowed on the road’s surface, which establishes extremely high requirements for the sand prevention performance of the expressway protection facilities. The study of the characteristics of wind-blown sand in subgrade cutting sections in desert hinterlands is of great significance for the protection of highways.
Scholars have conducted a large number of studies on the structure of aeolian sand flow by means of field monitoring [1,2,3]. Yizhaq et al. [4] studied the law of influence of the average wind speed on sediment transport through long-term field monitoring. Based on a large number of field investigations and measurements, Tian et al. [5] created a detailed review of the climatic conditions, the hazards of wind and sand in the Mogao Grottoes of Dunhuang, and their prevention and control.
Some scholars combined field and wind tunnel experiments to study the movement of wind-blown sand flow [6,7,8,9,10]. Bar et al. [11] used wind tunnel experiments and Fluent software to simulate the fine-scale turbulent flow structure near two-dimensional sand lines, with special emphasis on the shear stress distribution of the sand bed. Kang et al. [12] focused on studying the characteristics of the mass flux, mass concentration, horizontal velocity, and the transport rate of different particle-size groups and their relationships with their mass proportions in air and conducted an experimental analysis of these relationships in a wind tunnel with a particle-tracking velocimeter. Sun et al. [13] used a laser-phase Doppler particle analyzer to study the influence of a slope on the sand transition behavior in a wind tunnel.
The numerical simulation of wind-blown sand was developed into two main simulation methods in the 21st century: Euler–Euler and Euler–Lagrange [14,15,16,17,18,19,20,21]. Based on the field tests and Euler two-phase flow simulation, Horvat et al. [22] studied the influence of wind walls on the movement of aeolian sand flow. The sand-carrying capacity of an aeolian sand flow presents a negative exponential distribution with height, and the sand particles are mainly fine sand. Zhang et al. [23] combined experimental and numerical simulation methods to analyze the sediment accumulation law of the track structure.
In the field investigation of the Tengger Desert, road cuttings were more likely to be buried by sand dunes than embankments. In this study, the perennial wind direction, wind direction, and wind-blown sand movement law of subgrade cuttings in the hinterland of the Tengger Desert were monitored on site, and the data were statistically analyzed to further explore the wind-blown sand structure and sand deposition of cuttings in the hinterland of the Tengger Desert, in order to provide a theoretical reference for the cutting design, prevention, and control of wind-blown sand disasters and safe operations in the hinterland of the Tengger Desert.
2. Methodology
Study of the Perennial Wind Speed and Direction in the Desert Hinterland
As shown in Figure 1, a meteorological instrument was arranged in the hinterland of the Tengger Desert, Zhongwei, Ningxia Province. The meteorological instrument was equipped with a three-cup anemometer and a wind vane to simultaneously monitor the wind speed and direction. The model of the three-cup anemometer was an HYDZ-FS01 series, which had a measuring range of 0–50 m/s, a frequency of 1 min/time, and a resolution of 0.2 m/s. The instantaneous wind speeds were uploaded to the cloud database in real time by using the meteorological instrument and downloaded to the terminal for data analysis. From January 2021, the wind speed and direction in the desert hinterland was monitored for a long period, providing guidance for long-term wind prevention and sand control in the desert hinterland.
Figure 1.
Meteorological observation system.
When the wind speed exceeds the threshold velocity for particle movement, the sand is entrained into the air flow. Therefore, in order to intuitively study the movement of sand particles, only the high wind speed when the wind speed is higher than the sand moving wind speed (5.2 m/s) was studied. The monthly average wind speed in 2021 is shown in Figure 2, and the monthly average wind speed was higher than the sand. The frequency diagram of the starting wind speed is shown in Figure 3, and the wind direction rose diagram for the whole year of 2021 is shown in Figure 4. It can be seen in Figure 2, Figure 3 and Figure 4 that the average wind speed for the whole year was about 6.3 m/s, and the strong wind period mainly occurred from April to August. The reason is that it may be affected by the hot air flow, and the air flow rate becomes faster. The windy period in December was the shortest, only 0.9%. The main wind directions for the whole year were WSW and SW, followed by N and NNE. Therefore, not only should we maintain a single wind direction, with WSW and SW as the main directions, but the N and NNE directions also need to be maintained.
Figure 2.
Average monthly wind speed.
Figure 3.
Frequency graph of the monthly wind speed greater than the starting wind speed.
Figure 4.
Wind rose illustration.
3. Study of the Structural Characteristics of Wind-Blown Sand in the Desert Hinterland
A 3D ultrasonic anemometer and stepped sand accumulator were used to monitor the wind-blown sand. The 3D ultrasonic anemometer model was a Gill Wind Master Pro, and the height was 1.5 m. It can measure the 3D fluctuating wind speed and wind direction within 0–65 m/s. The resolution was 0.01 m/s, and the frequency was 32 Hz. We used the QN-JSY sand accumulation instrument. The overall height was 100 cm. There were five rows of 10 sand inlet channels and sandbags. The sand inlet channel was 50 × 50 mm, and the channel spacing was 50 mm. The data acquisition system was a Campbell CR6 data collector, and the wind field data were transmitted to the mobile terminal by a USB data line. As shown in Figure 5, a sand sampler and an anemometer were arranged at the top of the dune and the edge of the road in the graded excavation section of the cutting section of the desert test base.
Figure 5.
Wind–sand-flow observation system.
3.1. Instantaneous Wind Speed and Direction
Figure 6 and Figure 7 show the instantaneous wind speed and wind direction during a 24 h period. From the figures, it can be seen that in the desert hinterland, the wind speed pulsated. The average wind speed was 9.4 m/s, reaching a maximum wind speed at 12 a.m. The temperature at this time was the highest, indicating that the temperature significantly influenced the score. When the temperature dropped at night, the wind speed dropped correspondingly. When the wind speed was low, the wind direction was random. When the wind speed exceeded the sand wind speed, the wind speed tended toward the WSW direction with an increase in the wind speed, forming a single wind direction.
Figure 6.
Instantaneous wind speed at 24 h.
Figure 7.
Wind direction rose chart at 24 h.
3.2. Structural Characteristics of Wind-Blown Sand in the Desert Hinterland
Sediment transport represents the number of sand particles passing through a unit area. The density of wind-blown sand flow is a very important physical quantity when studying the movement of wind-blown sand flow and can better reflect the spatial distribution characteristics of sand particles in a two-phase wind-blown sand flow. The expression for the wind-blown sand flow density is as follows:
Among them, ρs is the density of the wind-blown sand flow, unit: g/m3; Q is the sediment collection, unit: g; A indicates that the area of the rectangular sand inlet is 25, unit: cm2; t is the time of the sand collection, unit is s; uz is the average wind speed at z altitude, unit: m/s.
The sand collected by the sand accumulator in the desert hinterland was weighed and screened in the laboratory. The sand accumulated at the height of 100 cm from the ground for 24 h is shown in Table 1. The sand was divided into six particle size ranges: [0–0.075], [0.075–0.1], [0.1–0.25], [0.25–0.5], [0.5–1], and [>1]. The particle size distributions of the sand are shown in Table 2. Figure 8 shows a plot of the wind-blown sand density as a function of height.
Table 1.
Weight of sand at different heights.
Table 2.
Particle size range distributions.
Figure 8.
Sand flow density at different heights.
From Table 1 and Table 2, it can be seen that the sand in the hinterland of the Tengger Desert mainly moved at the height of 50 cm from the ground, and the total sediment accumulated in 24 h reached 45.78 g; 42% of the sand rose 10 cm above the surface, and the amount of sediment accumulated in 24 h reached 19.28 g. By analyzing the grain size of sand, we can better study the characteristics of wind-blown sand flow and the law of sand deposition in the desert hinterland. Smaller particles are lighter, more trapped by airflows, and are more likely to be deposited on highways in desert hinterlands. The grain size of the sand in the hinterland of the Tengger Desert ranged from 0.075 mm to 0.25 mm, accounting for 98.20% of the total sand, of which 0.075 mm to 0.1 mm accounted for 73.80%. Sand with a size of 0–0.075 mm accounted for 1.06%, and sand with a size of 0.5–5 mm accounted for 2%. The grain size distribution of sand presented a highly concentrated normal distribution, and the sand was mainly medium and fine sand. As shown in Figure 8, when the average wind speed was 9.4 m/s, the wind-blown sand flow density decreased with an increase in height, and the curve showing the variation of the wind-blown sand flow density with height was basically inclined L-shaped. The wind-blown sand flow reached its maximum value at 10 cm above the ground, and the wind-blown sand flow density approached zero above a height of 70 cm. The protection facilities for wind-blown sand flow should be greater than 1 m, and targeted control measures should be proposed for 0.5 m wind-blown sand flow movement.
4. Numerical Simulation of Wind-Blown Sand in the Cutting in the Desert Hinterland
4.1. Wind–Sand Two-Phase Flow Theory
In the wind–sand two-phase flow, the sand phase is considered to be fluid. Because the wind speed and velocity of sand are both less than 50 m/s, the wind–sand two-phase flow is considered an incompressible fluid. We established the continuity Equation (2).
where ux and uy are, respectively, the velocity components in the x and y directions; φ and ρ, respectively, represent the volume fraction and density of the phase.
The momentum Equation (3) is as follows:
where φg and ρg, respectively, represent the volume fraction and density of the gas phase, φs and ρs, respectively, represent the volume fraction and density of the sand phase; φs + φg = 1, fsg is the acting force between the gas phase and sand phase; Ug and Us are the gas phase and sand phase velocities, respectively; p is the gas phase pressure; ps is the sand phase pressure; g is the acceleration due to gravity.
4.2. Reynolds-Averaged N–S Equation
The mass and momentum conservation equations of the Reynolds-averaged N–S equation RNG k-ε are as follows:
where represents the flow field parameters such as the velocity, fluid density, pressure, and energy.
4.3. Geometric Modeling and Meshing
Figure 9 shows the terrain of the cutting section of the Tengger Desert Highway Experimental Base in Ningxia Province, and the 10-high cutting was divided into two levels. According to the actual terrain of the desert, two computational fluid dynamics (CFD) models of desert hinterland cutting and graded excavation cutting were established using Fluent software. As shown in Figure 10, the CFD geometric model and the solution grid were introduced by taking the graded excavation cutting as an example. The calculation domain was 50 m high, 120 m wide, and 253 m long. The cutting depth was 13 m, and the width of one side was 26 m. Based on the nongraded cutting model, the graded cutting adopted two-stage stratification to reduce the cutting slope rate, and a 3 m sand barrier belt was added to the left and right sides of the road surface. The wind speed measuring points (1# and 2#) at the same position as the field measured were arranged at the top and bottom of the cutting. The computational domain mesh was divided by the mosaic mesh technology of Fluent meshing, and the ground area was encrypted. The minimum mesh size was 1 mm, and 10 boundary layers were used. The final mesh size was 10 million.
Figure 9.
Cutting section of the Ningxia Tengger Desert Highway Experiential Base: (a) no classification; (b) graded.
Figure 10.
Numeral model of the CFD cutting for the graded excitation.
4.4. Boundary Conditions and Solving Strategies
As shown in Figure 10, a velocity inlet was adopted on the left side of the CFD model. First, the measured fluctuating wind speed was decomposed along the x- and z-directions by 10 s. Using the linear difference method and the wind speed profile formula of Formula (4), the measured fluctuating wind speed was compiled as a user-defined function (UDF) and applied to the velocity inlet. From Section 3.2, it can be seen that most of the sand had particle sizes ranging from 0.075 to 0.25 mm, so the particle size of sand was set at 0.1 mm, a sand bed with a height of 0.2 m was set behind the velocity inlet to simulate the desert surface, and the particle size distribution of the sand particles was compiled into the UDF with reference to the measured values. The velocity variable of the transmission equation for the velocity inlet was set to the real-time pulsating wind speed. A press-outlet was adopted on the right side and left and right sides. The pressure variable of the transport equations for the pressure outlet was set to 0. Symmetry was adopted at the top, a no-slip wall was adopted at the desert surface and cutting, and the roughness height was 0.02 m.
where is the frictional wind speed, k is the von Karman constant (typically 0.4), and is the roughness height.
The solution model used was the Euler two-fluid unsteady model. Assuming that the turbulence was fully developed, the RNG k-ε turbulence model and Euler multiphase flow model were adopted. In the areas close to the boundary, the technique of wall function was adopted to solve the effect of the wall surface. The wall function was the scalable wall function. The y+ average values on each wall were 15–20. The momentum equation and time integral were solved by the bounded central difference scheme and the second-order upwind scheme, respectively. The SIMPLEC algorithm was adopted to solve the flow field with calculation steps of 0.001 and 10,000 steps. Each model used 24 cores and took 5 days to compute.
4.5. Mesh Independence Verification
To verify the grid independence of the CFD model, the grid size of the cutting and the number of boundary layers were adjusted to establish grids with high, medium, and low resolutions of 8, 10, and 12 million, respectively. The minimum mesh size of the high-resolution mesh was 0.5 mm, with 15 boundary layers. The minimum mesh size of the medium-resolution mesh was 1 mm, and 10 boundary layers were set. The minimum mesh size of the low-resolution mesh was 2 mm, and there were 10 boundary layers. A wind-speed profile with a constant wind speed of 8.3 m/s at the height of 10 m was applied to the speed inlet. Figure 11 shows the monitoring of the 5 m wind speed profile after the speed inlet with three resolution grids. It can be seen from the figure that the wind speed profile of the model with 10 million grids was in good agreement with the results of the model with 12 million grids, with a relative error difference of only about 2%, and the 8 million grids had a large deviation. Therefore, the model with a grid resolution of 10 million was more reasonable.
Figure 11.
Wind speed contours for different grid resolutions.
4.6. Mesh Independence Verification
4.6.1. Characteristics of the Cutting Wind Field in the Desert Hinterland
To analyze the structural characteristics of the wind field during cutting, the measured and numerically simulated wind speeds at the top and pavement of the graded cutting are shown in Figure 12 and Figure 13. From Figure 12 and Figure 13, it can be seen that the CFD numerical model simulated the measured fluctuating wind field well, and the fluctuating wind speed in the x- and z-directions monitored at the top of the cutting was consistent with the corresponding values of the 3D ultrasonic anemometer. The cutting pavement was basically blocked by the cutting, forming a single wind direction, which was basically parallel to the line, and the average wind speed was 8 m/s. The wind speed perpendicular to the line direction was approximately 1 m/s, and sand was not easily deposited on the road surface.
Figure 12.
Pulsating wind speed at the top of the cutting: (a) z-direction; (b) x-direction.
Figure 13.
Pulsating wind speed at the bottom of the cut: (a) z-direction; (b) x-direction.
4.6.2. Road Area Sand Characteristics of the Cutting in the Desert Hinterland
Without any protection, sand will move towards the cutting with the entrapment of the airflow. The higher the wind speed, the faster the speed of sand grain motion, and the direction of the sand grain motion depends on the wind direction of the airflow. Figure 14 shows the deposition of sand on the road surface of a highway in the desert hinterland with ungraded and two-layer graded cuttings.
Figure 14.
Sand acquisition in road cuttings in the desert hinterland: (a1–a5) ungraded; (b1–b5) graded.
As shown in Figure 14, because the wind speed in the desert hinterland fluctuates, and the wind direction changes, the movement of sand is directly related to the airflow speed and wind direction. For the nongraded cutting, at t = 6 s, sand began to fall from the top of the cutting slope; at t = 7 s, the sand fell to the bottom of the slope of the cutting; at t = 8 s, the sand moved towards the road surface; at t = 9 s, the sand moved to the other side of the road surface. Combined with Figure 9, it can be seen that the direction of the sand grain movement was parallel to the wind direction and not perpendicular to the road surface. The numerical simulation results were consistent with the measured results of the highway cutting in the hinterland of the desert. Therefore, the protection of wind-blown sand should be adjusted according to the wind direction. Long-term observations were carried out at the Ningxia Desert Highway Experimental Base, and the greatest sand accumulation height on the pavement reached 28 cm in two months without protection. At t = 10 s, sand covered the road surface.
For graded cutting, owing to the increase in the cutting slope ratio, the falling distance of the sand was short, and sand was first deposited on the first-layer plane. It only filled the first-layer plane when t = 10 s, and only a little sand moved to the pavement, which was in accordance with the field measurement results. The reason is that the height of the first-layer plane was lower than the cutting height, the wind speed at the first-layer plane was less than the starting wind speed of the sand grain, and it was difficult for the sand grains to rise again. Under the same conditions, the graded excavation of highway cutting in desert hinterlands is beneficial for reducing the sand accumulation rate on pavements. For the unprotected cutting with a 10 m excavation depth, graded excavation was adopted, and the sand height of the road area reached 28 cm and 0.03 cm within 2 months.
5. Conclusions
In this paper, the structure of wind-blown sand flow in the hinterland of the Tengger Desert and the rule of sand deposition in cutting were studied by means of field monitoring and numerical simulation. The main conclusions are as follows:
- (1)
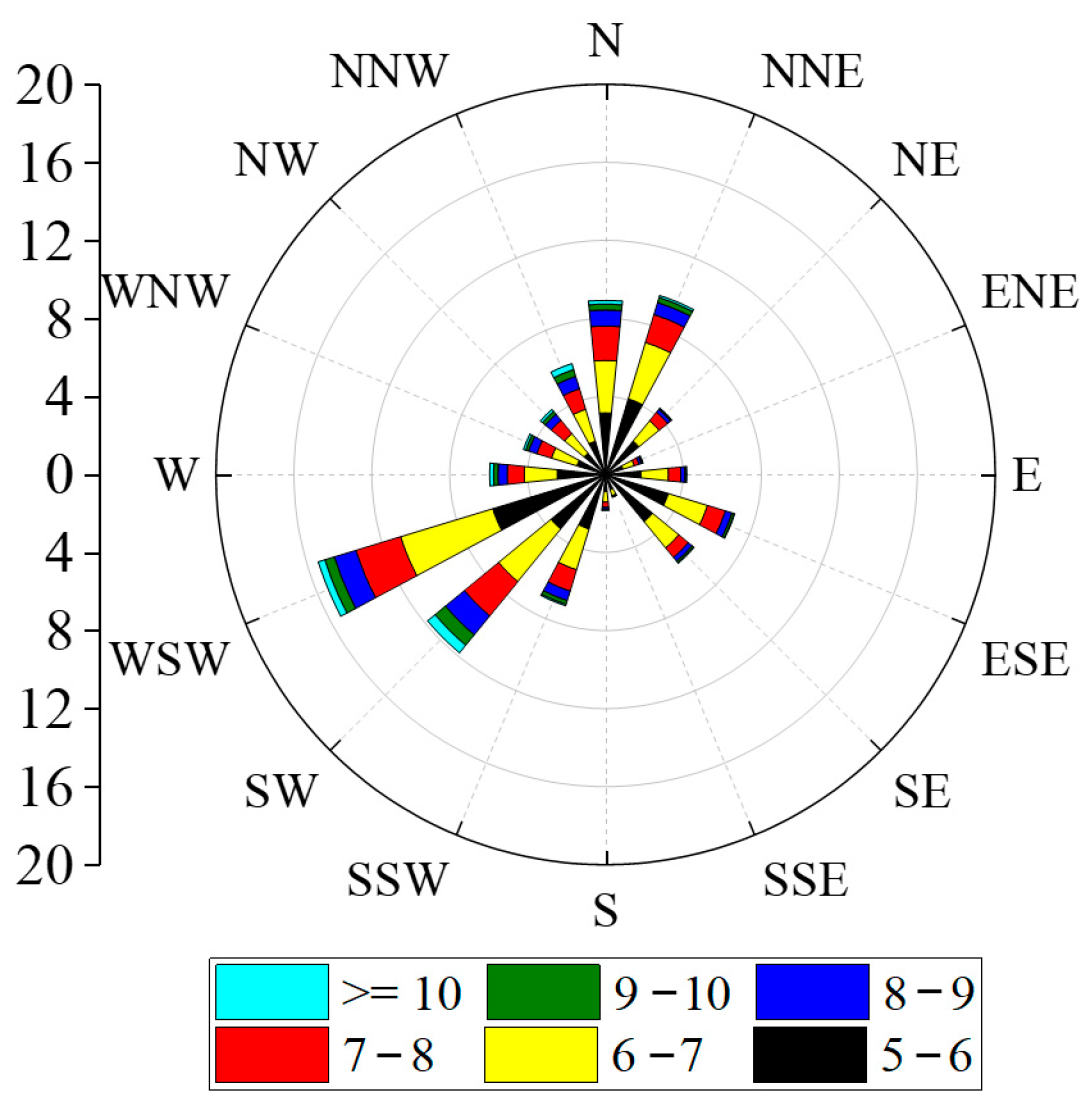
- The strong wind period in the hinterland of the Tengger Desert mainly occurs from April to August, with an average wind speed of 6.3 m/s. The main wind directions in the hinterland of the desert are concentrated in the WSW and SW directions, followed by the N and NNW directions.
- (2)
- The sand particles in the hinterland of the Tengger Desert mainly move at a height of 50 cm near the ground, and the total sand accumulation in 24 h reaches 45.78 g. The sand particles are mainly medium–fine sand, the particle size range is mainly concentrated in 0.075–0.25 mm, accounting for 98.2% of the total sand volume, and the curve of the wind-blown sand density with height is oblique L-shaped.
- (3)
- Under the same conditions, the graded excavation of the desert hinterland highway cutting is beneficial to reduce the sand accumulation rate on the road surface.
Author Contributions
Conceptualization, W.-H.Y.; methodology, W.-H.Y. and X.W.; software, W.-H.Y. and H.Y.; validation, W.-H.Y. and H.Y.; formal analysis, W.-H.Y. and X.W.; investigation, W.-H.Y., X.W. and H.Y.; resources, W.-H.Y.; data curation, W.-H.Y.; writing—original draft preparation, W.-H.Y., X.W. and H.Y.; writing—review and editing, W.-H.Y., X.W. and H.Y.; visualization, W.-H.Y. and H.Y.; supervision, X.W.; project administration, W.-H.Y.; funding acquisition, W.-H.Y. and X.W. All authors have read and agreed to the published version of the manuscript.
Funding
This research was funded by Special Funds for Guiding Local Scientific and Technological Development by The Central Government (22ZY1QA005) and the Department of Transportation of Ningxia Province (20200173).
Institutional Review Board Statement
Not applicable.
Informed Consent Statement
Not applicable.
Data Availability Statement
Not applicable.
Conflicts of Interest
The authors declare no conflict of interest.
References
- Huang, B.; Li, Z.; Zhao, Z.; Wu, H.; Zhou, H.; Cong, S. Near-ground impurity-free wind and wind-driven sand of photovoltaic power stations in a desert area. J. Wind Eng. Ind. Aerodyn. 2018, 179, 483–502. [Google Scholar] [CrossRef]
- Liu, L.; Yang, Y.; Shi, P.; Zhang, G.; Qu, Z. The role of maximum wind speed in sand-transporting events. Geomorphology 2015, 238, 177–186. [Google Scholar] [CrossRef]
- Shen, Y.; Zhang, C.; Huang, X.; Wang, X.; Cen, S. The effect of wind speed averaging time on sand transport estimates. Catena 2019, 175, 286–293. [Google Scholar] [CrossRef]
- Yizhaq, H.; Xu, Z.; Ashkenazy, Y. The effect of wind speed averaging time on the calculation of sand drift potential: New scaling laws. Earth Planet. Sci. Lett. 2020, 544, 116373. [Google Scholar] [CrossRef]
- Tan, L.; Zhang, W.; Qu, J.; Wang, J.; An, Z.; Li, F. Aeolian sediment transport over gobi: Field studies atop the Mogao Grottoes, China. Aeolian Res. 2016, 21, 53–60. [Google Scholar] [CrossRef]
- Raffaele, L.; Beeck, J.; Bruno, L. Wind-sand tunnel testing of surface-mounted obstacles: Similarity requirements and a case study on a Sand Mitigation Measure. J. Wind Eng. Ind. Aerodyn. 2021, 214, 104653. [Google Scholar] [CrossRef]
- Zheng, X.; Bo, T. Representation model of wind velocity fluctuations and saltation transport in aeolian sand flow. J. Wind Eng. Ind. Aerodyn. 2021, 220, 104846. [Google Scholar] [CrossRef]
- Jiang, C.; Parteli, E.; Dong, Z.; Zhang, Z.; Qian, G.; Luo, W.; Lu, J.; Xiao, F.; Mei, F. Wind-tunnel experiments of Aeolian sand transport reveal a bimodal probability distribution function for the particle lift-off velocities. Catena 2022, 217, 106494. [Google Scholar] [CrossRef]
- Liu, B.; Qu, J.; Tan, L.; An, Z.; Wang, H.; Wang, T.; Han, Q. A first wind tunnel study on the aeolian sand transport of coral sands. Catena 2022, 222, 106855. [Google Scholar] [CrossRef]
- Tan, L.; Qu, J.; Wang, T.; Zhang, W.; Zhao, S.; Wang, H. Vertical flux density and frequency profiles of wind-blown sand as a function of the grain size over gobi and implications for aeolian transport processes. Aeolian Res. 2022, 55, 100787. [Google Scholar] [CrossRef]
- Bar, N.; Elperin, T.; Katra, I.; Yizhaq, H. Numerical study of shear stress distribution at sand ripple surface in wind tunnel flow. Aeolian Res. 2016, 21, 125–130. [Google Scholar] [CrossRef]
- Kang, L.; Zou, X. Experimental investigation of mass flux and transport rate of different size particles in mixed sand transport by wind. Geomorphology 2020, 367, 107320. [Google Scholar] [CrossRef]
- Sun, W.; Huang, N. Influence of slope gradient on the behavior of saltating sand particles in a wind tunnel. Catena 2017, 148, 145–152. [Google Scholar] [CrossRef]
- Horvat, M.; Bruno, L.; Khris, S.; Raffaele, L. Aerodynamic shape optimization of barriers for windblown sand mitigation using CFD analysis. J. Wind Eng. Ind. Aerodyn. 2020, 197, 104058. [Google Scholar] [CrossRef]
- Giudice, A.; Preziosi, L. A fully Eulerian multiphase model of windblown sand coupled with morphodynamic evolution: Erosion, transport, deposition, and avalanching. Appl. Math. Model. 2020, 79, 68–84. [Google Scholar] [CrossRef]
- Wang, T.; Qu, J.; Liang, Y.; Liu, B.; Xiao, J. Shelter effect efficacy of sand fences: A comparison of systems in a wind tunnel. Aeolian Res. 2018, 30, 32–40. [Google Scholar] [CrossRef]
- Chen, B.; Cheng, J.; Xin, L.; Wang, R. Effectiveness of hole plate-type sand barriers in reducing aeolian sediment flux: Evaluation of effect of hole size. Aeolian Res. 2019, 38, 1–12. [Google Scholar] [CrossRef]
- Wang, T.; Qu, J.; Niu, Q. Comparative study of the shelter efficacy of straw checkerboard barriers and rocky checkerboard barriers in a wind tunnel. Aeolian Res. 2020, 43, 100575. [Google Scholar] [CrossRef]
- Zhang, K.; Zhao, P.; Zhao, J.; Zhang, X. Protective effect of multi-row HDPE board sand fences: A wind tunnel study. Int. Soil Water Conserv. Res. 2021, 9, 103–115. [Google Scholar] [CrossRef]
- Wu, X.; Guo, Z.; Wang, R.; Fan, P.; Xiang, H.; Zou, X.; Yin, J.; Fang, H. Optimal design for wind fence based on 3D numerical simulation. Agric. For. Meteorol. 2022, 323, 109072. [Google Scholar] [CrossRef]
- Sarafrazi, V.; Talaee, M. Simulation of wall barrier properties along a railway track during a sandstorm. Aeolian Res. 2020, 46, 100626. [Google Scholar] [CrossRef]
- Horvat, M.; Bruno, L.; Khris, S. CWE study of wind flow around railways: Effects of embankment and track system on sand sedimentation. J. Wind Eng. Ind. Aerodyn. 2021, 208, 104476. [Google Scholar] [CrossRef]
- Zhang, M.; Xiao, H.; Mahantesh, M.; Jin, F.; Liu, G. Track structure failure caused by sand deposition: Simulation and experimentation. Aeolian Res. 2020, 43, 100578. [Google Scholar]
Disclaimer/Publisher’s Note: The statements, opinions and data contained in all publications are solely those of the individual author(s) and contributor(s) and not of MDPI and/or the editor(s). MDPI and/or the editor(s) disclaim responsibility for any injury to people or property resulting from any ideas, methods, instructions or products referred to in the content. |
© 2023 by the authors. Licensee MDPI, Basel, Switzerland. This article is an open access article distributed under the terms and conditions of the Creative Commons Attribution (CC BY) license (https://creativecommons.org/licenses/by/4.0/).


