
The Effect of Ultrasonic Alternating Loads on Restoration of Permeability of Sedimentary Rocks during Crude Paraffinic Oil Flow

 , , , ,
Abstract
:Featured Application
Abstract
1. Introduction
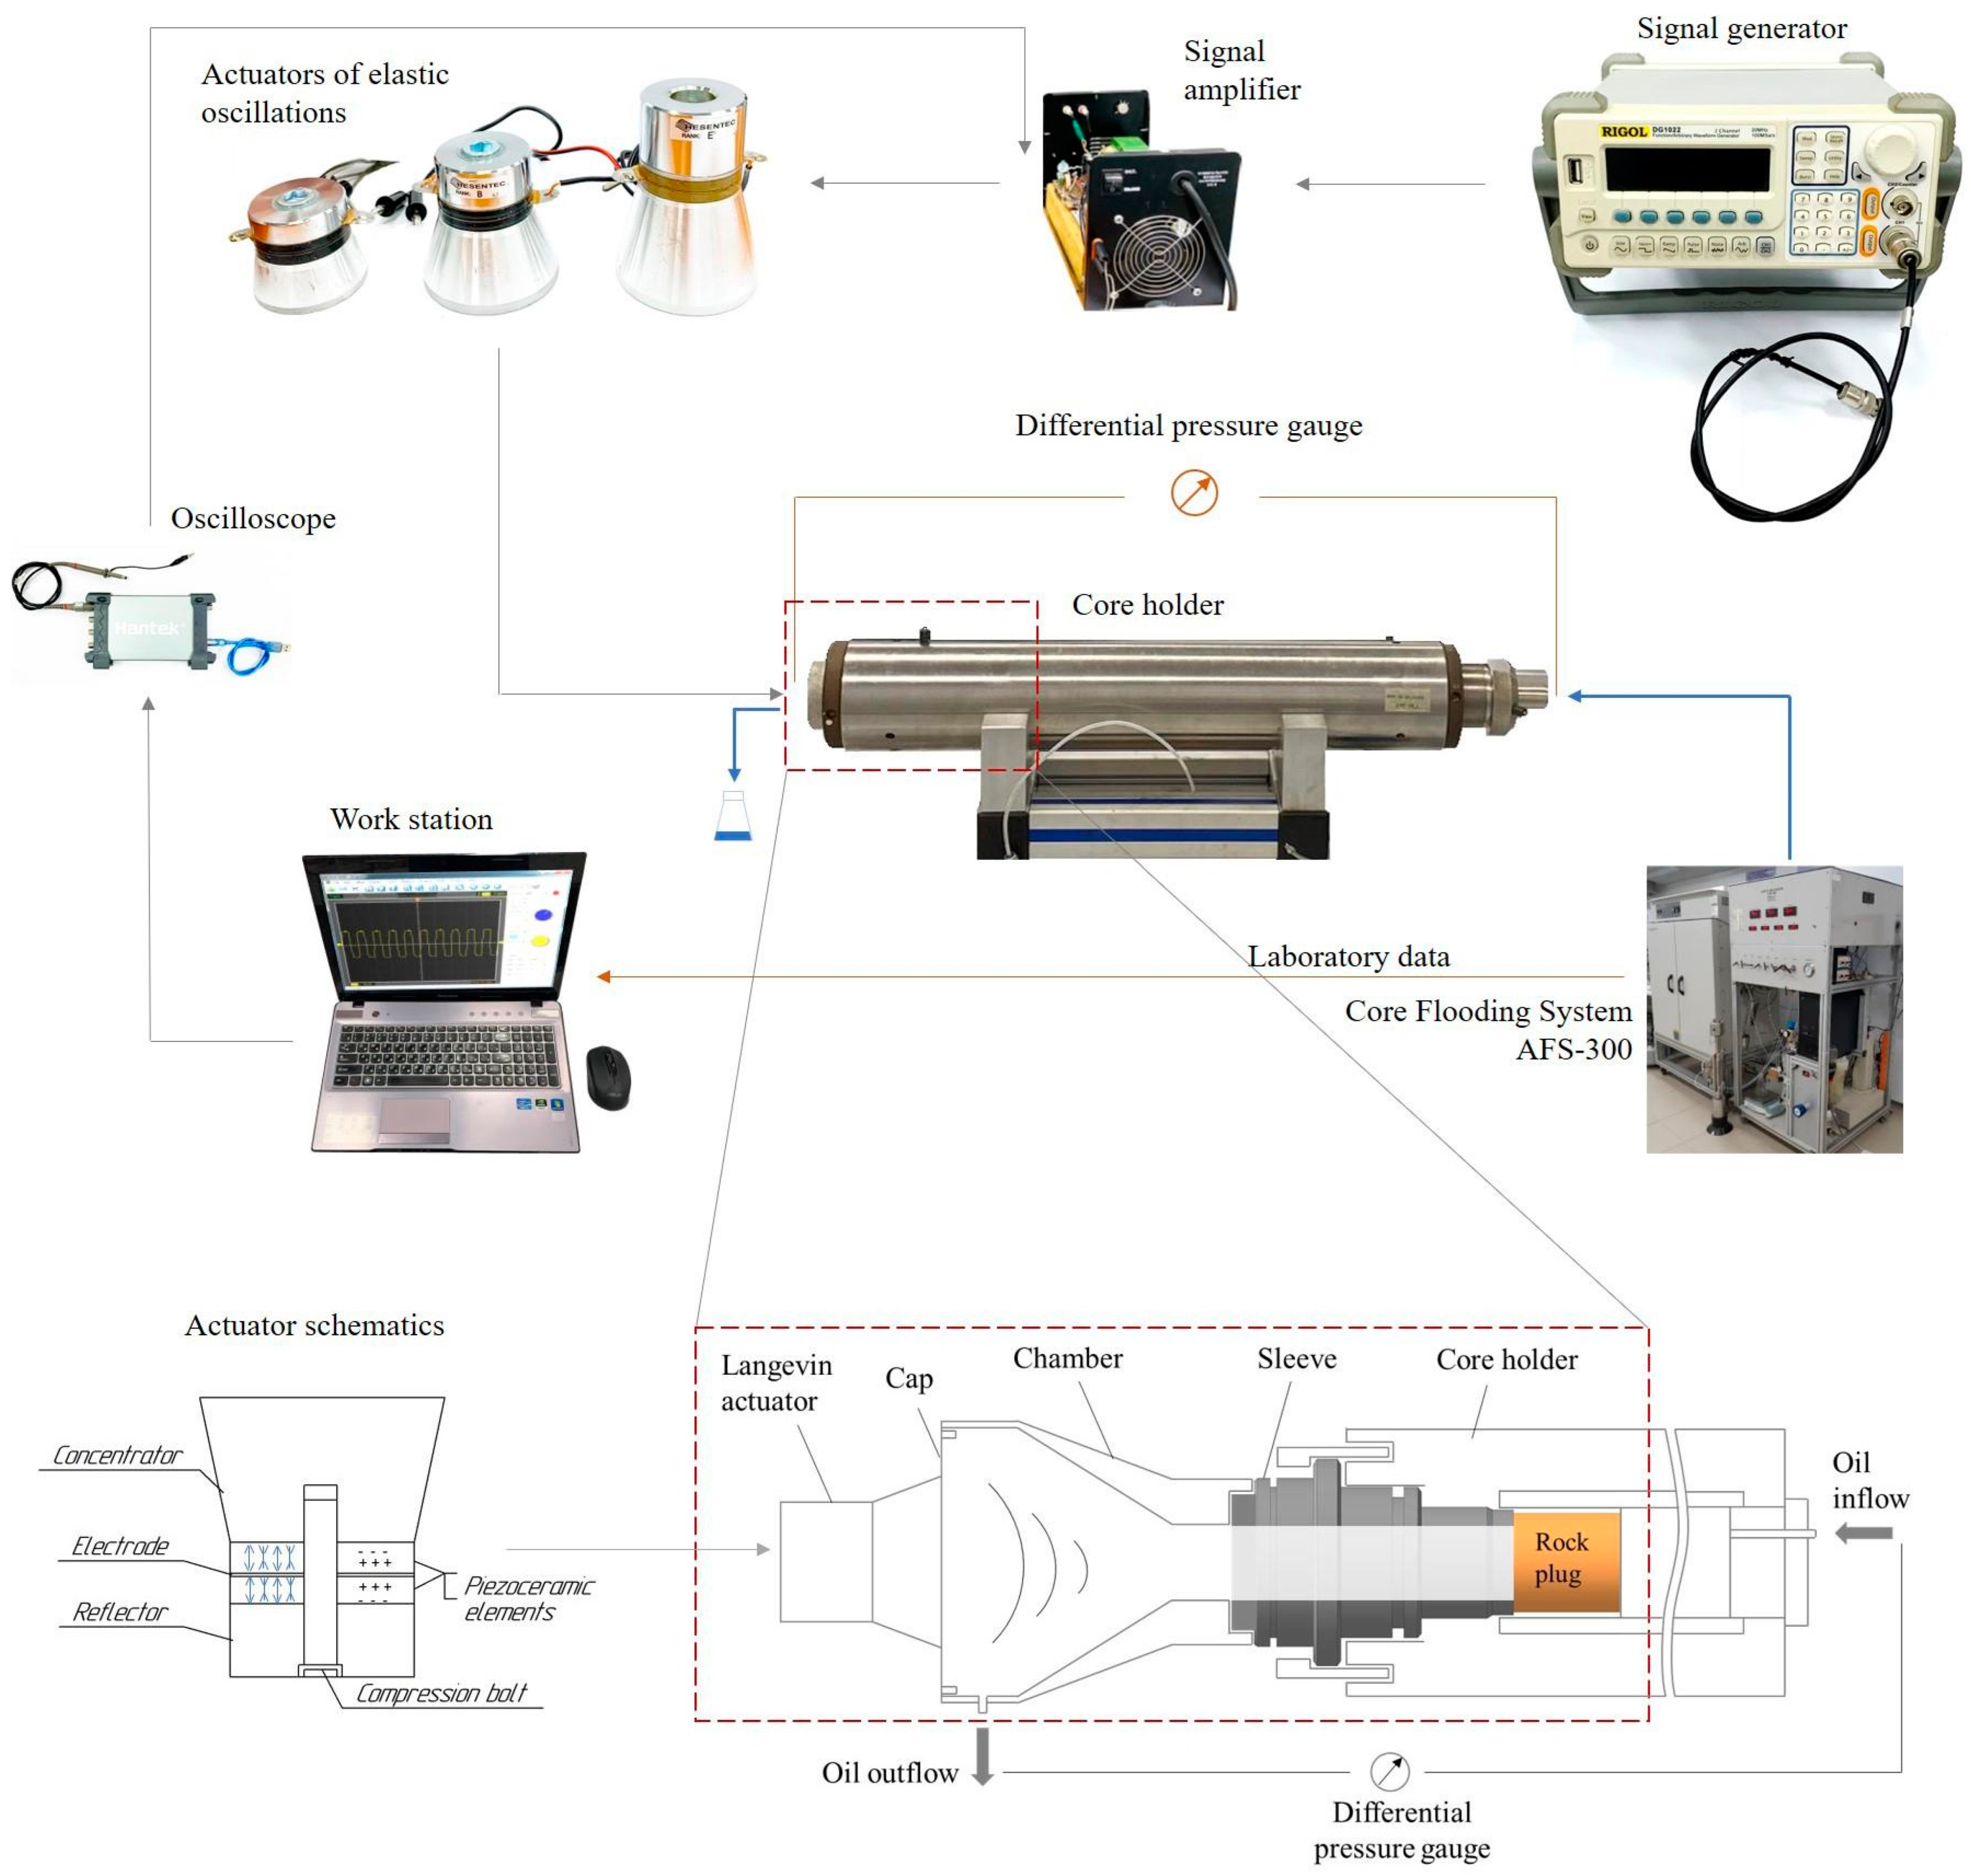
2. Materials and Methods
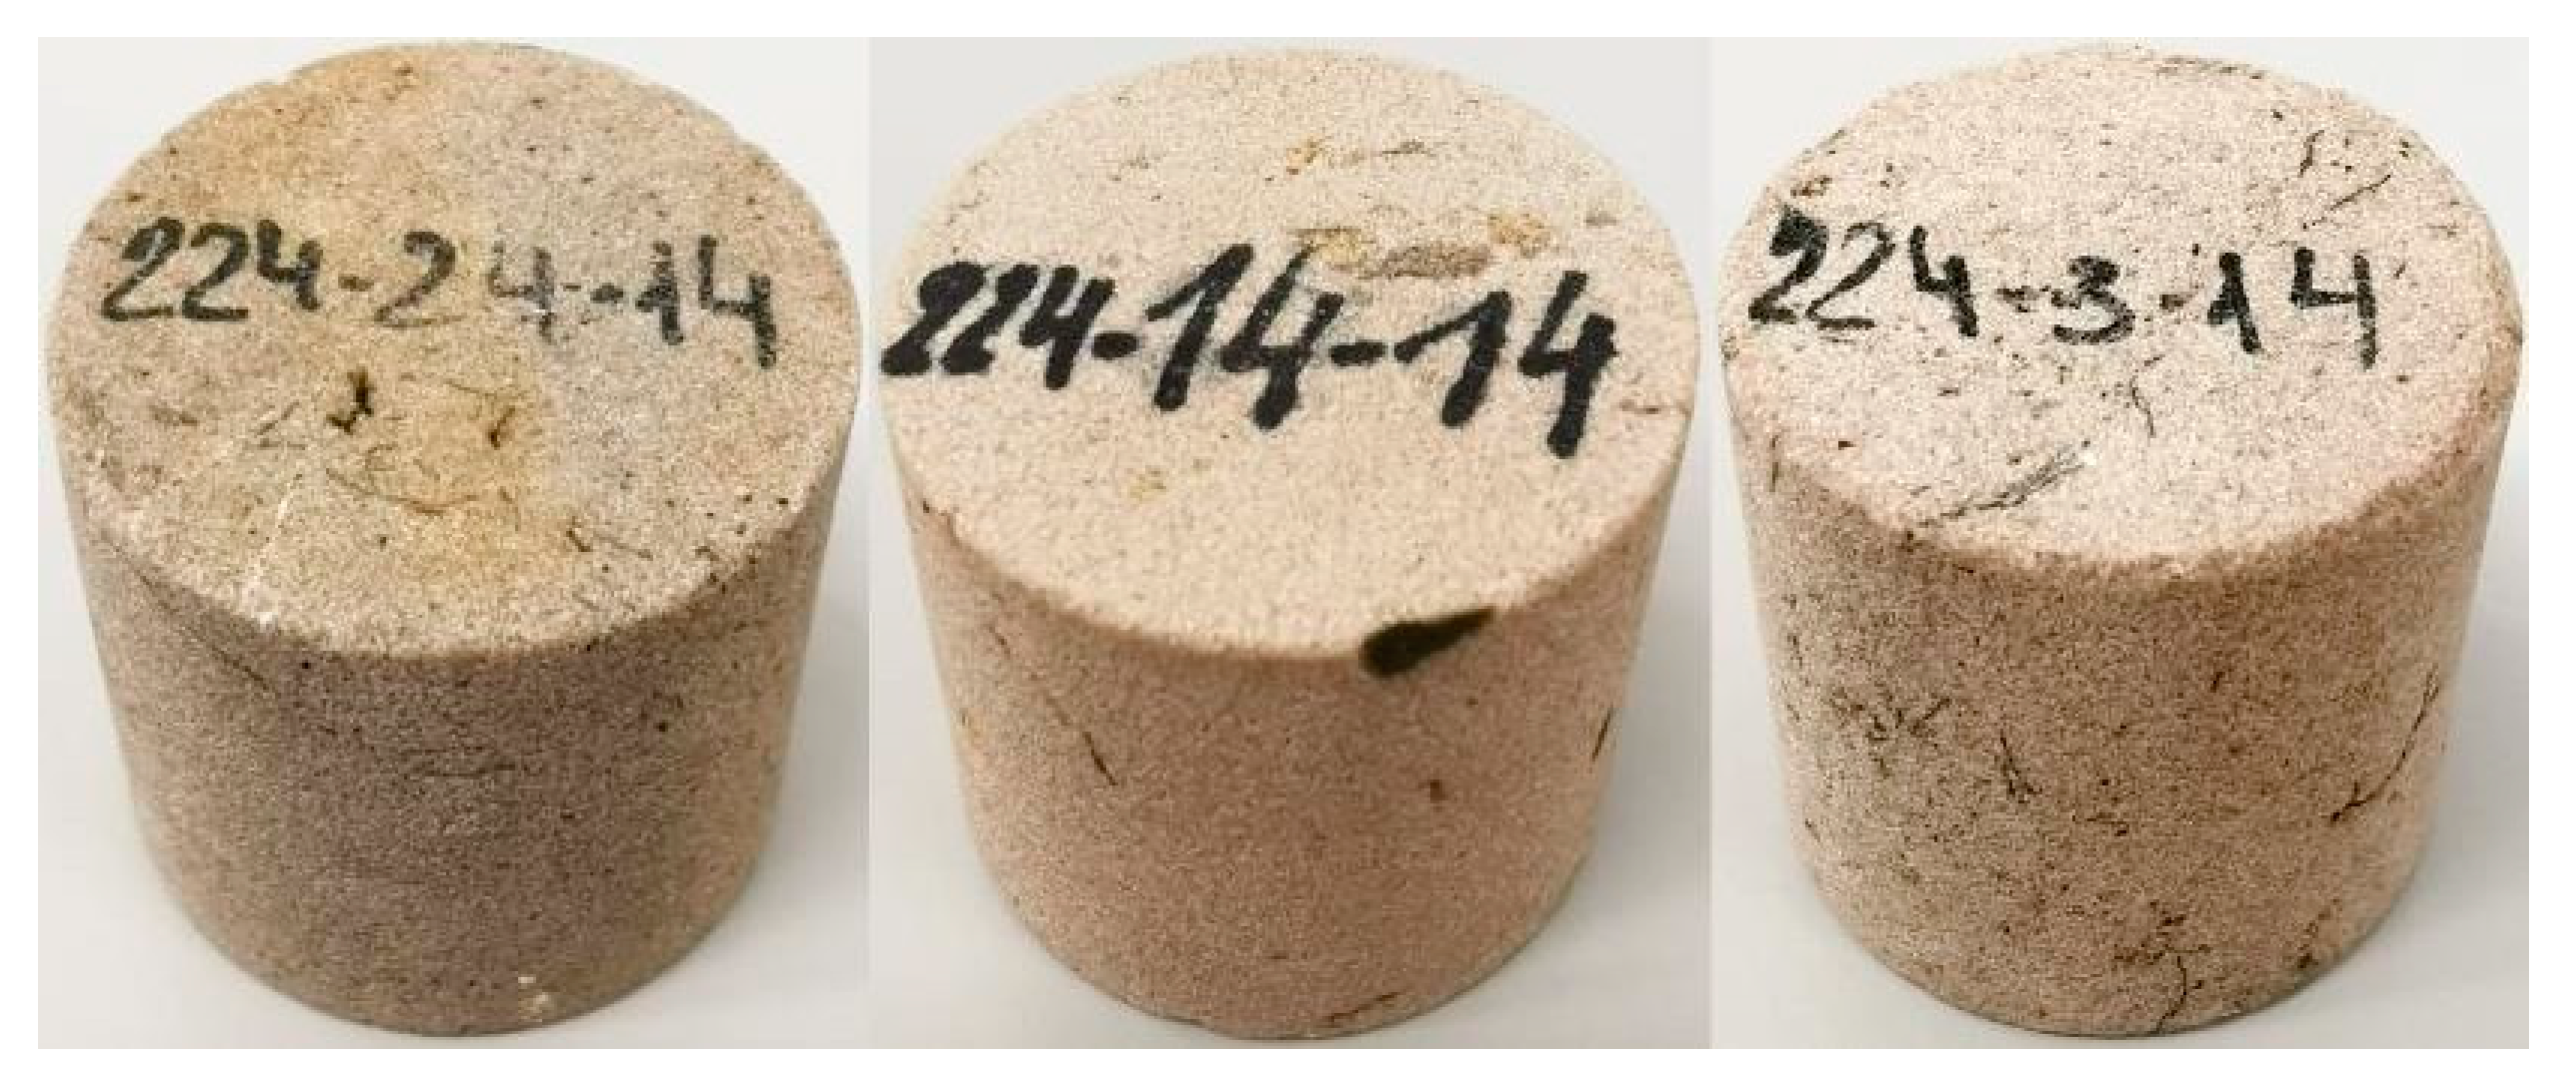
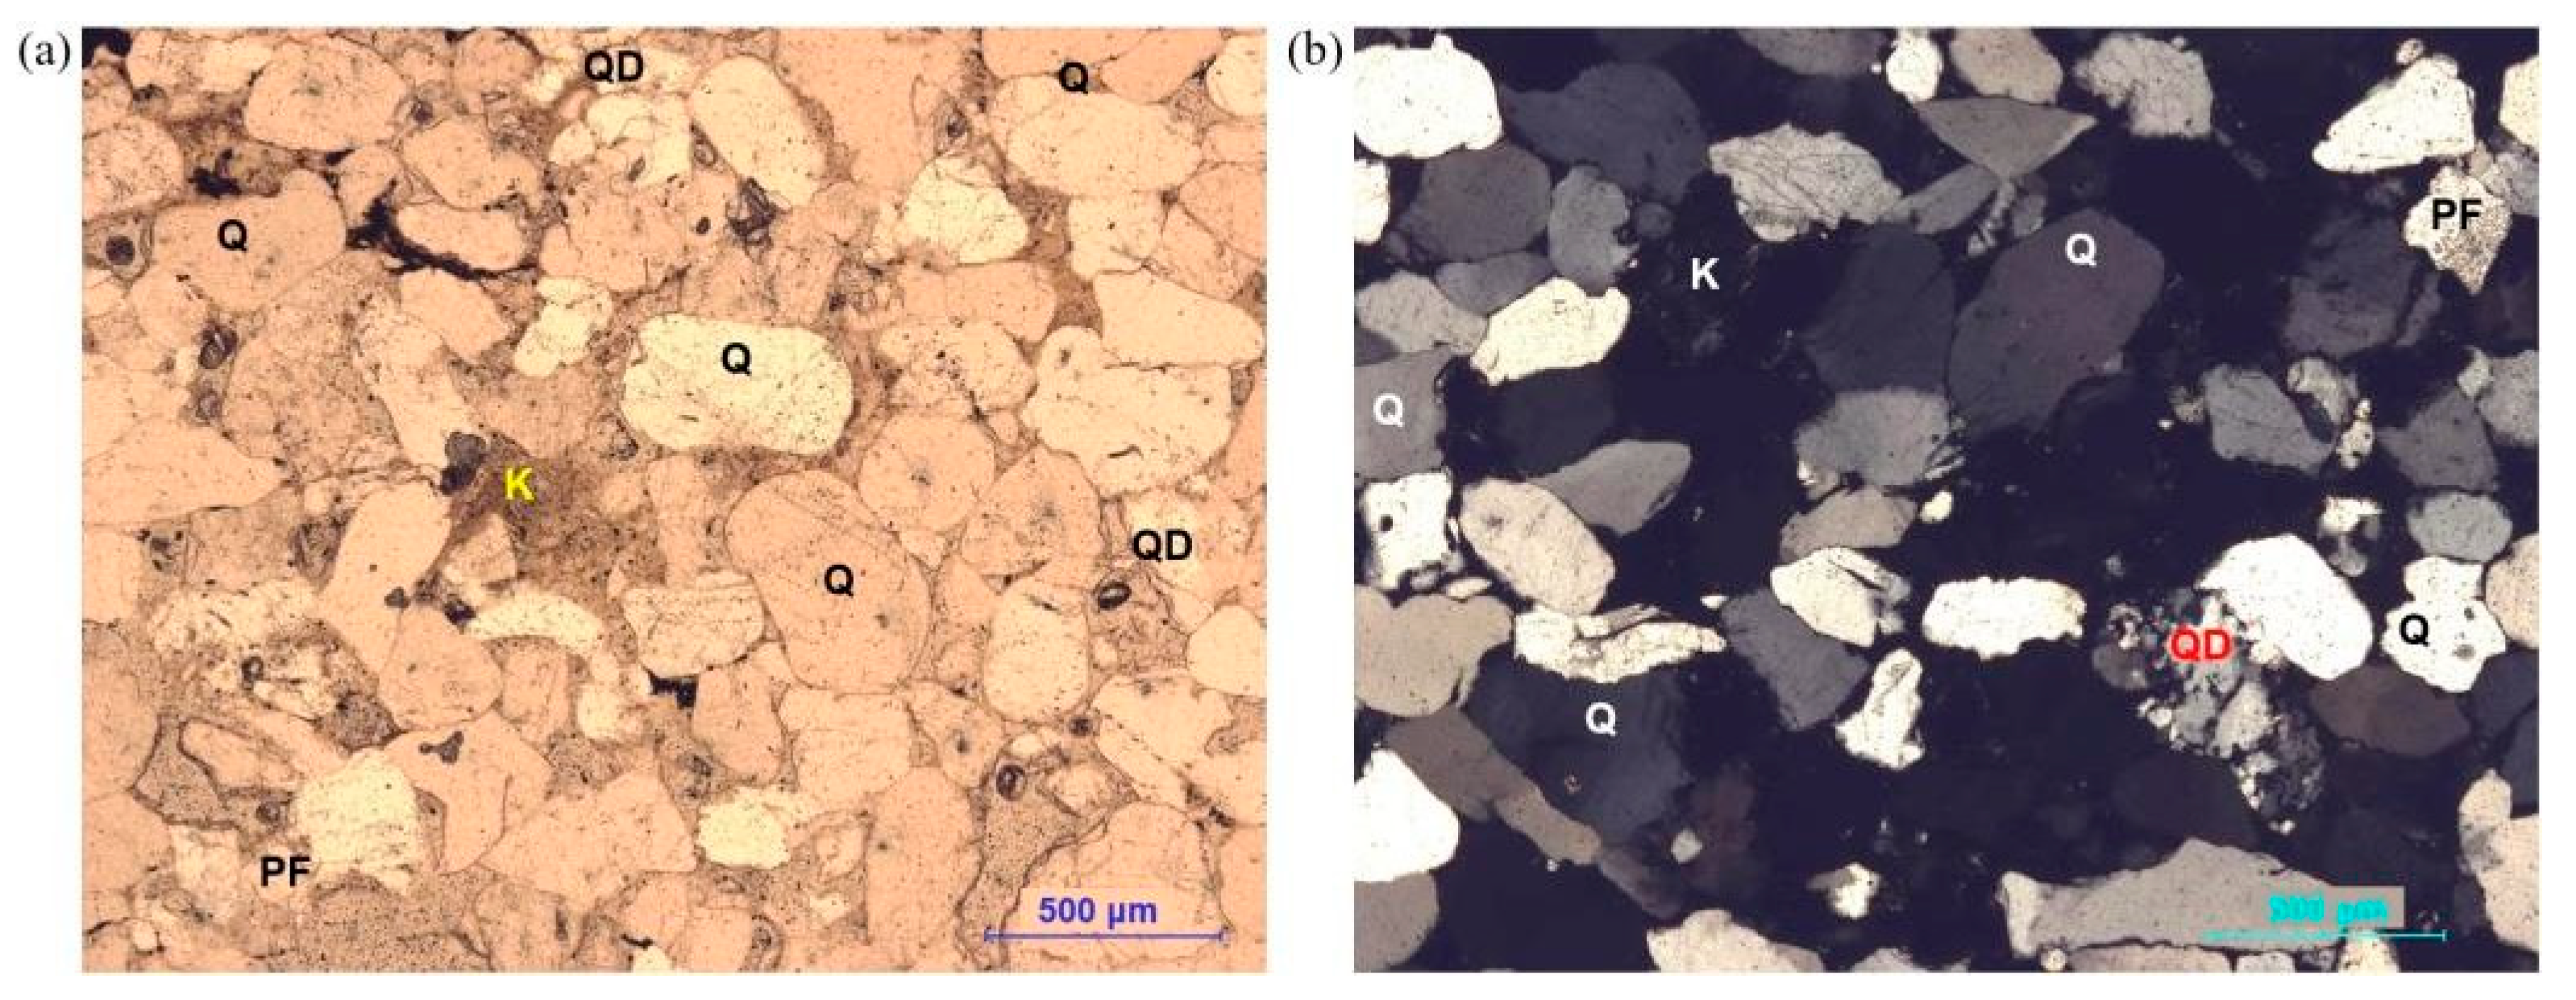
2.1. Materials
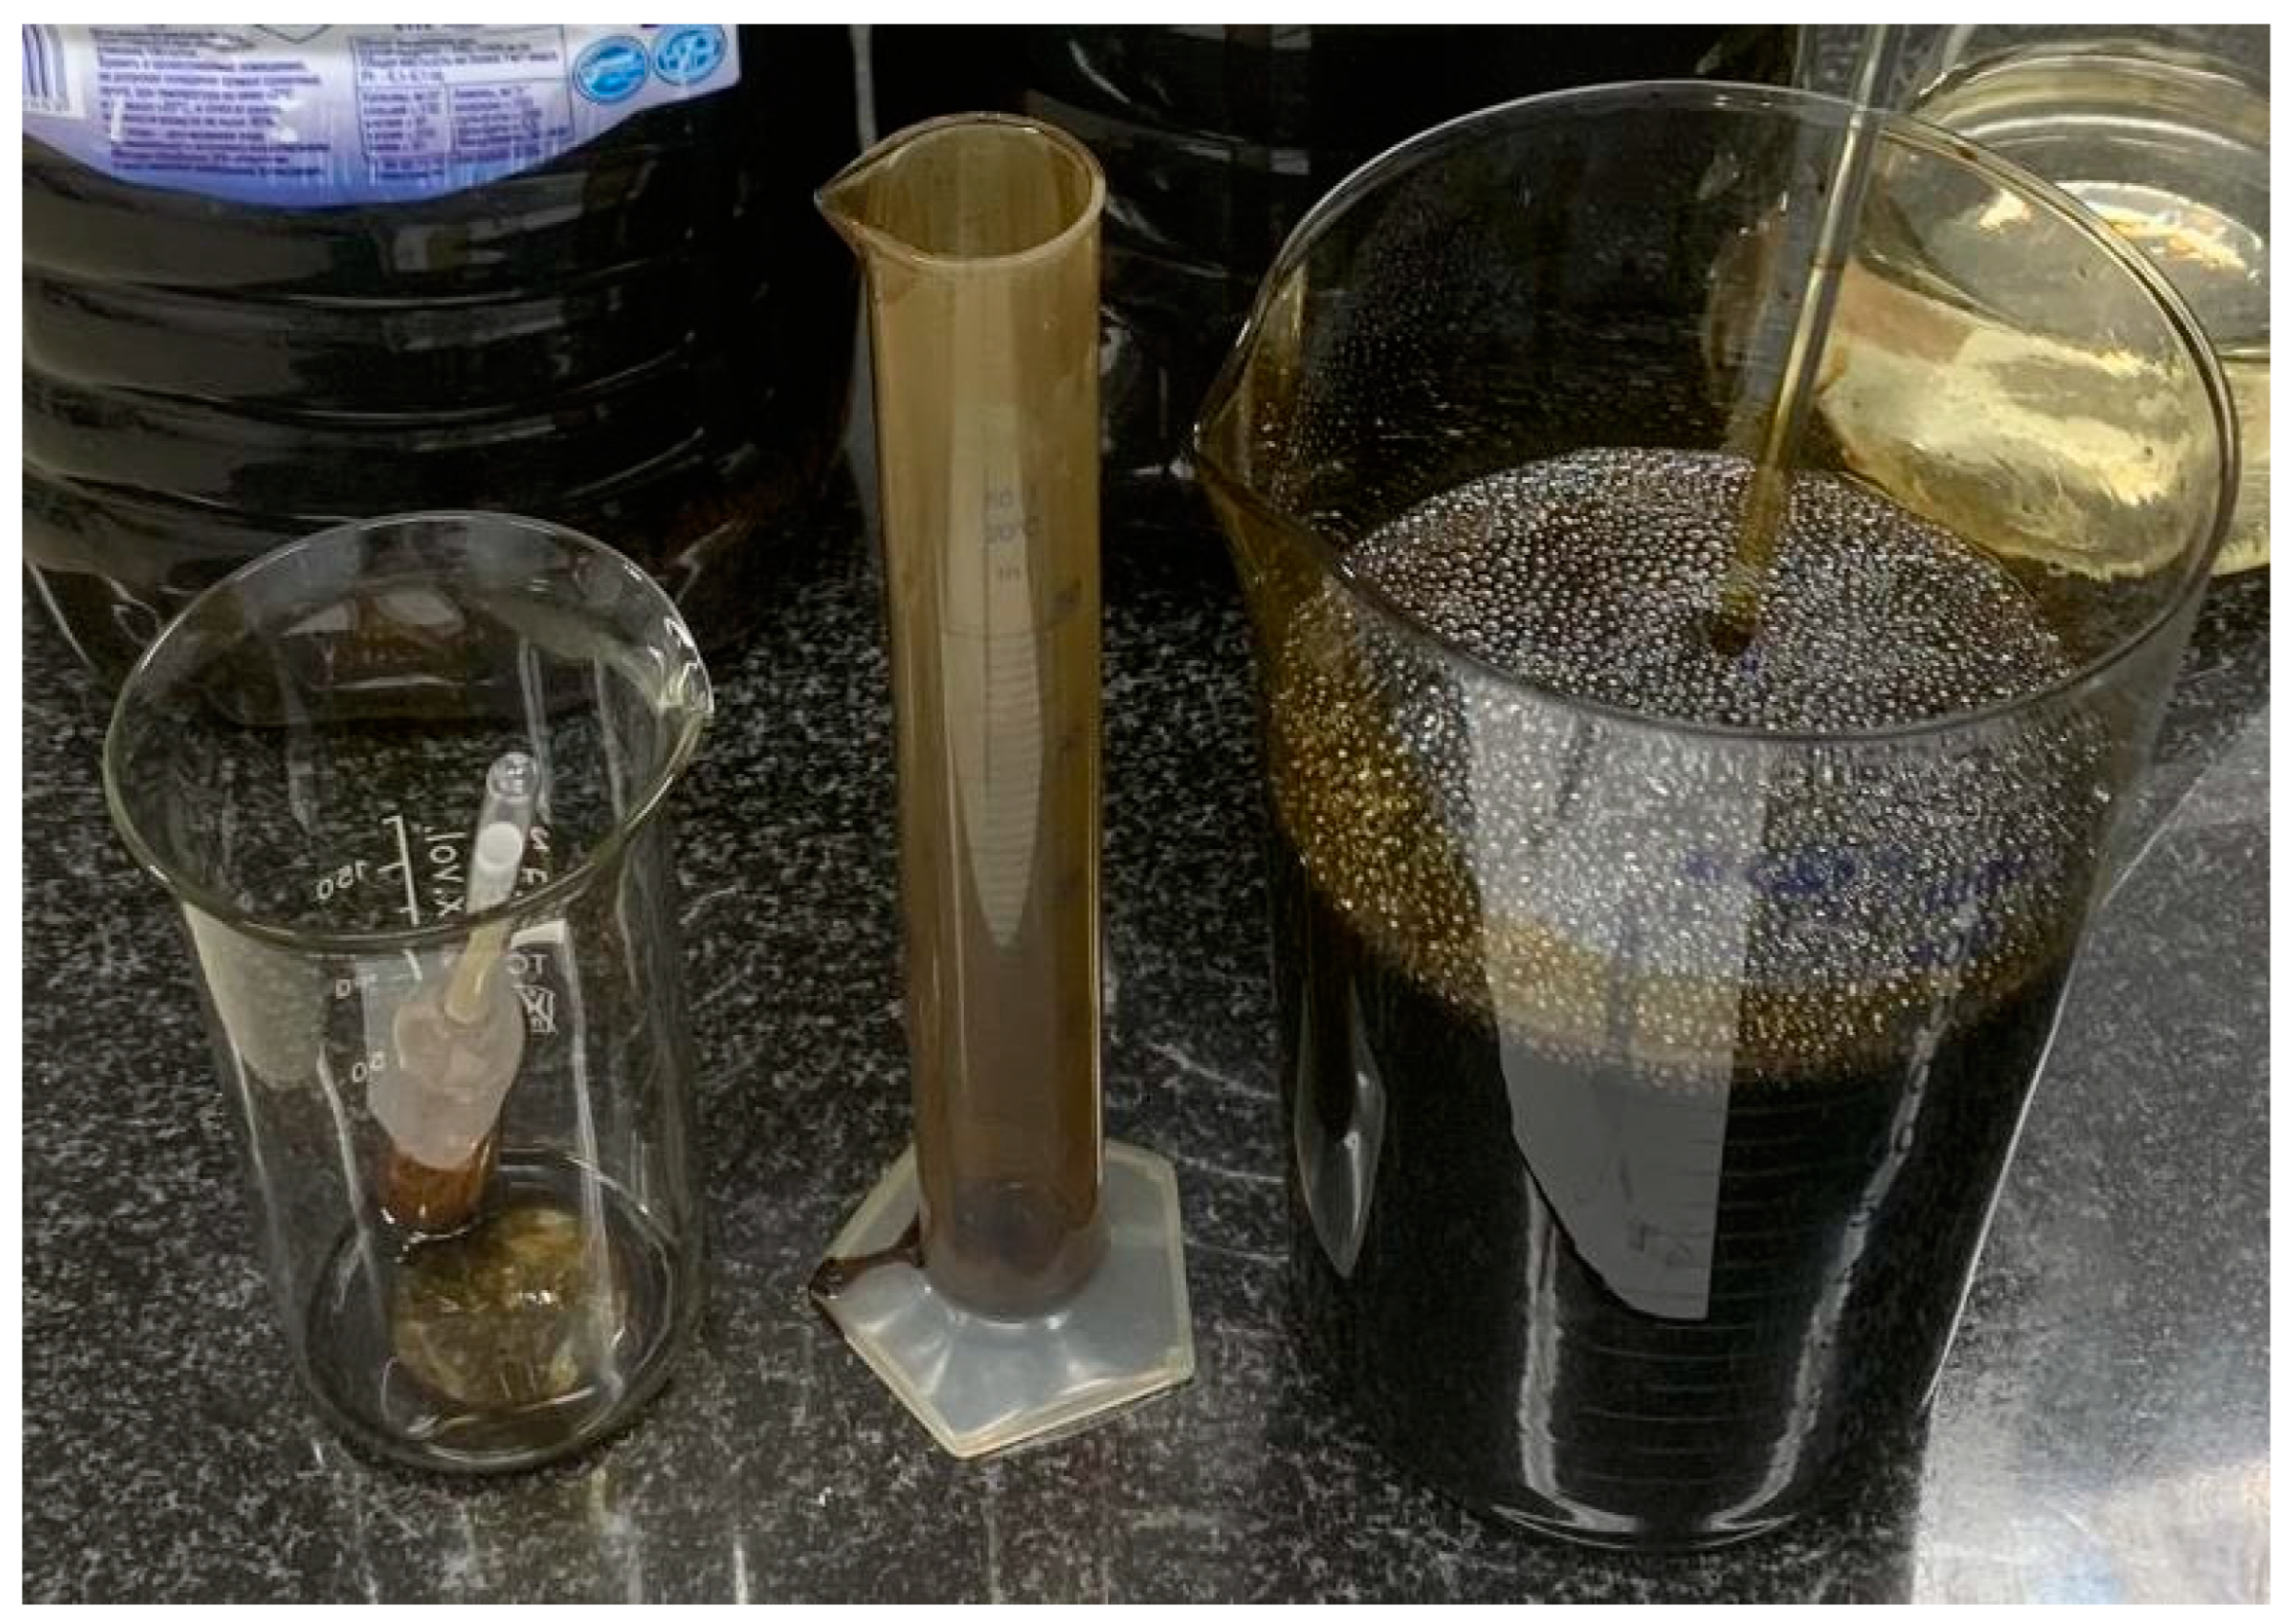
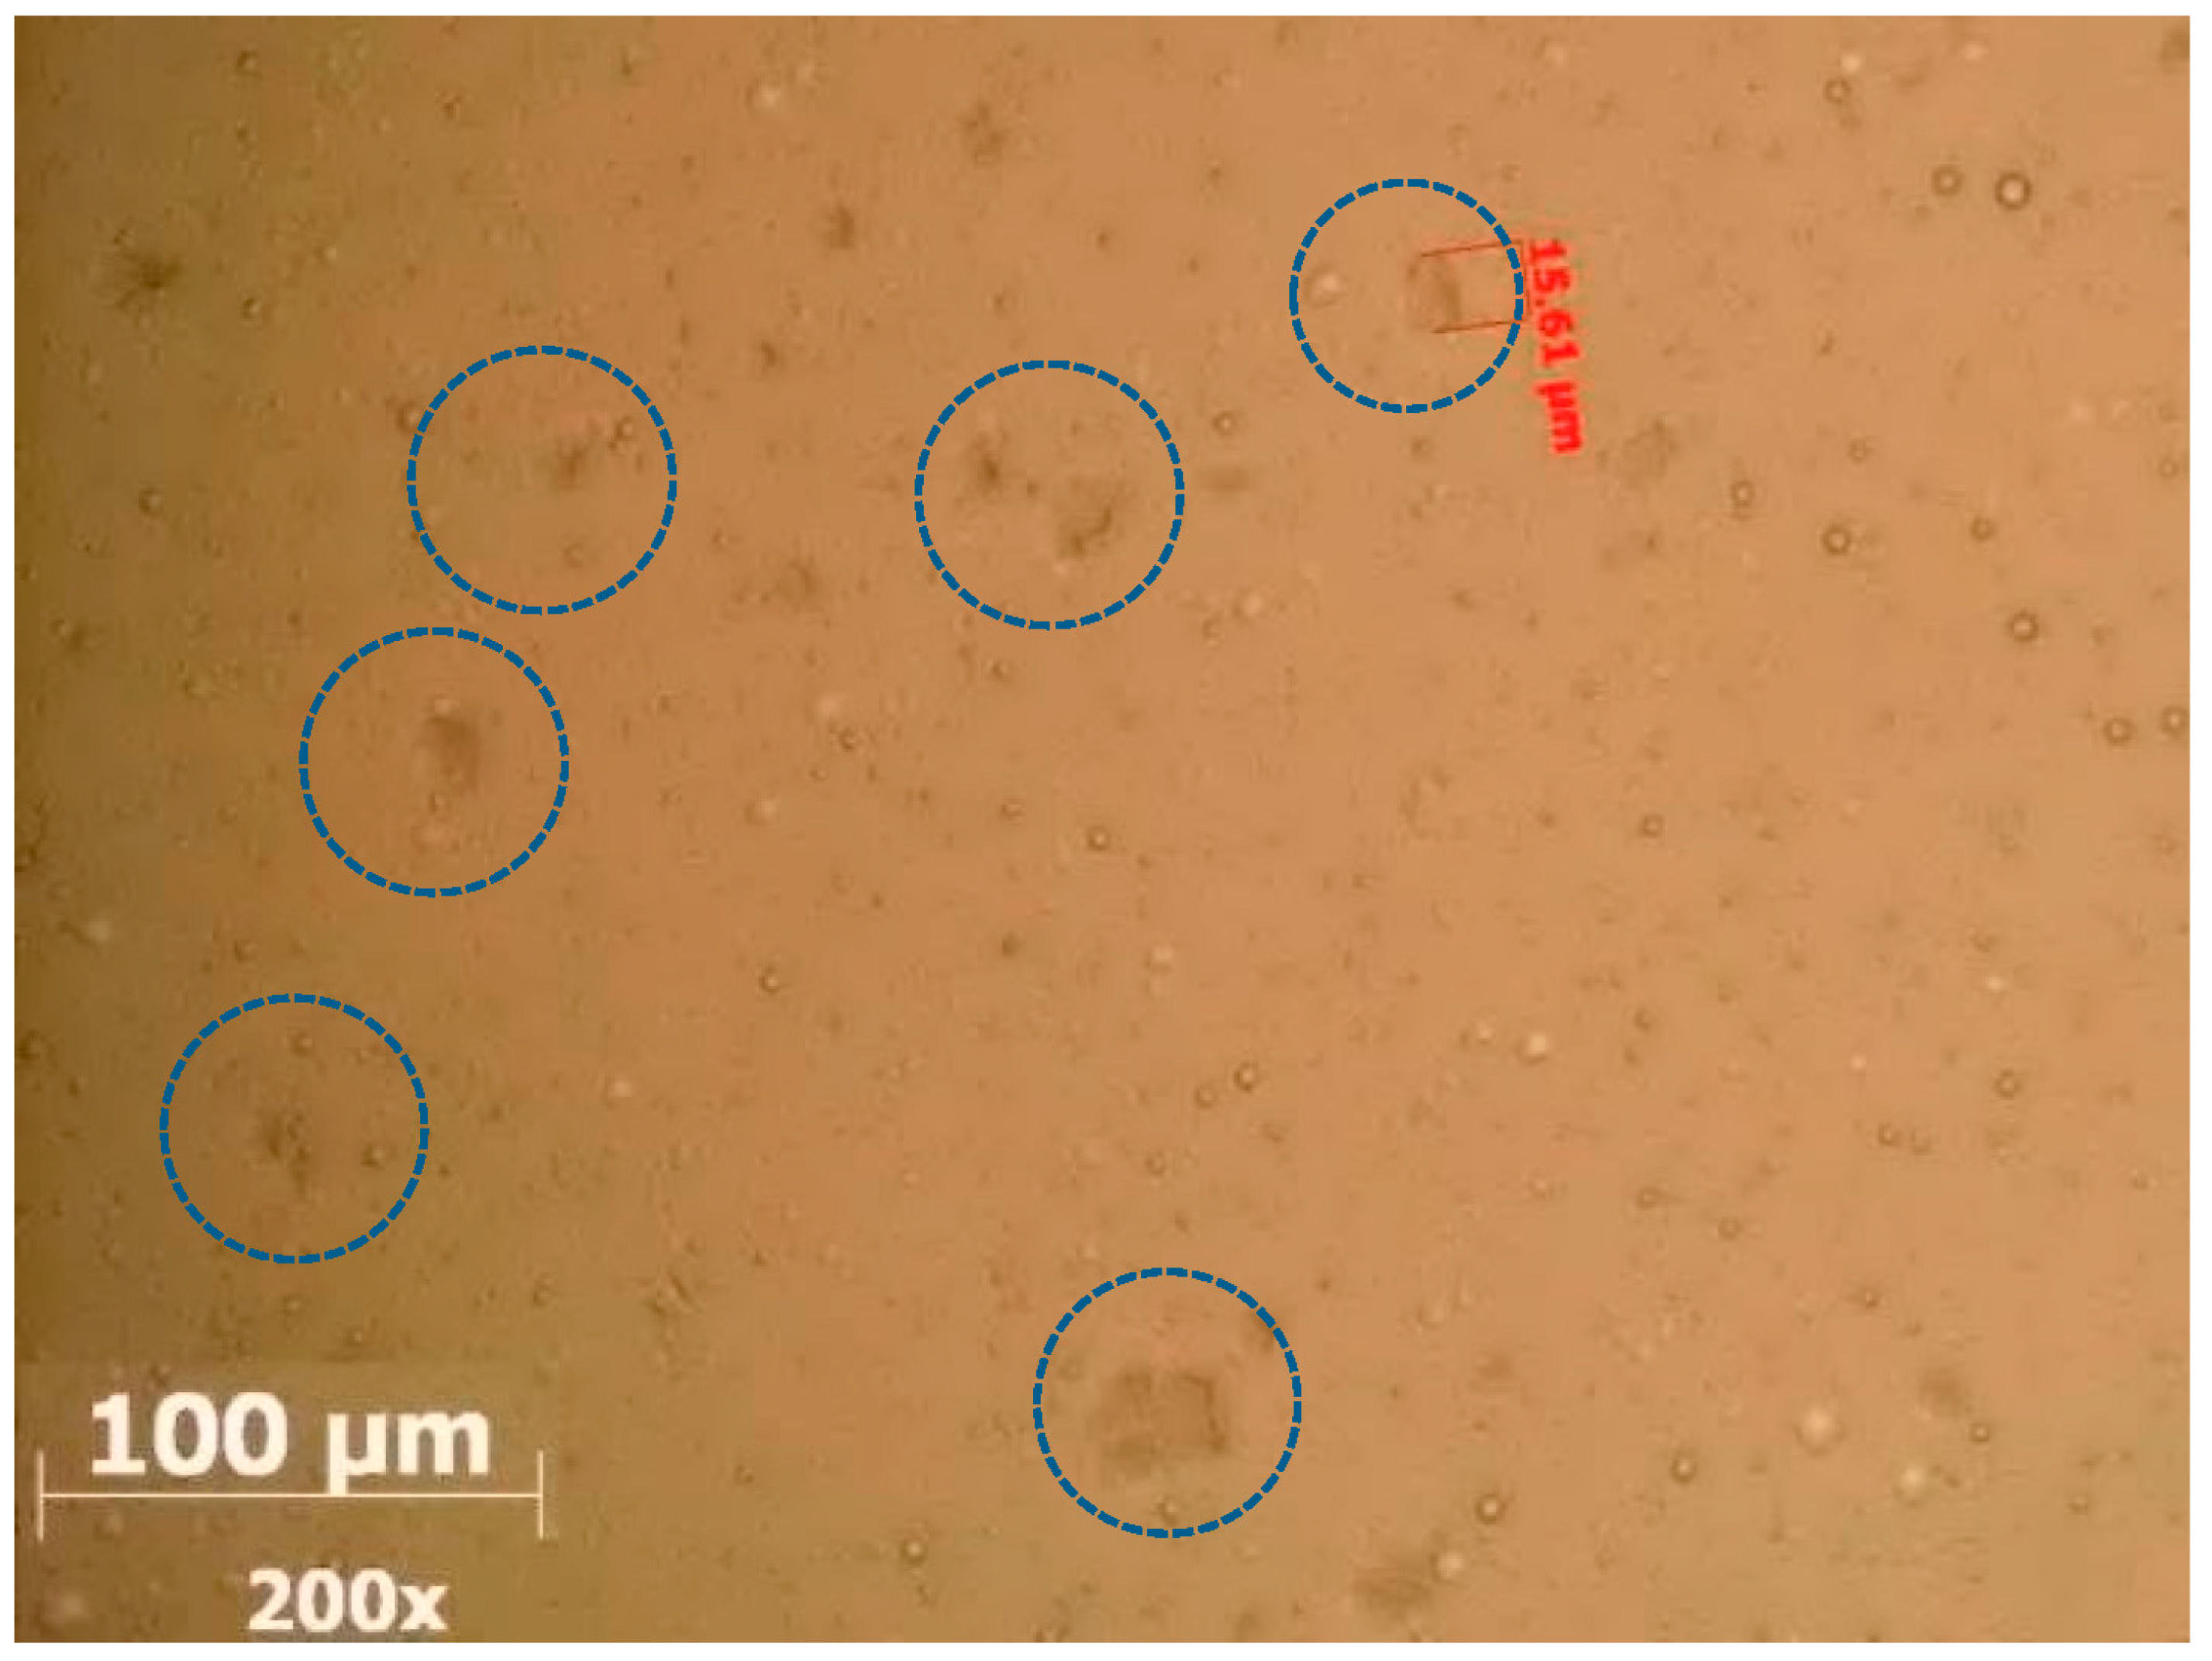
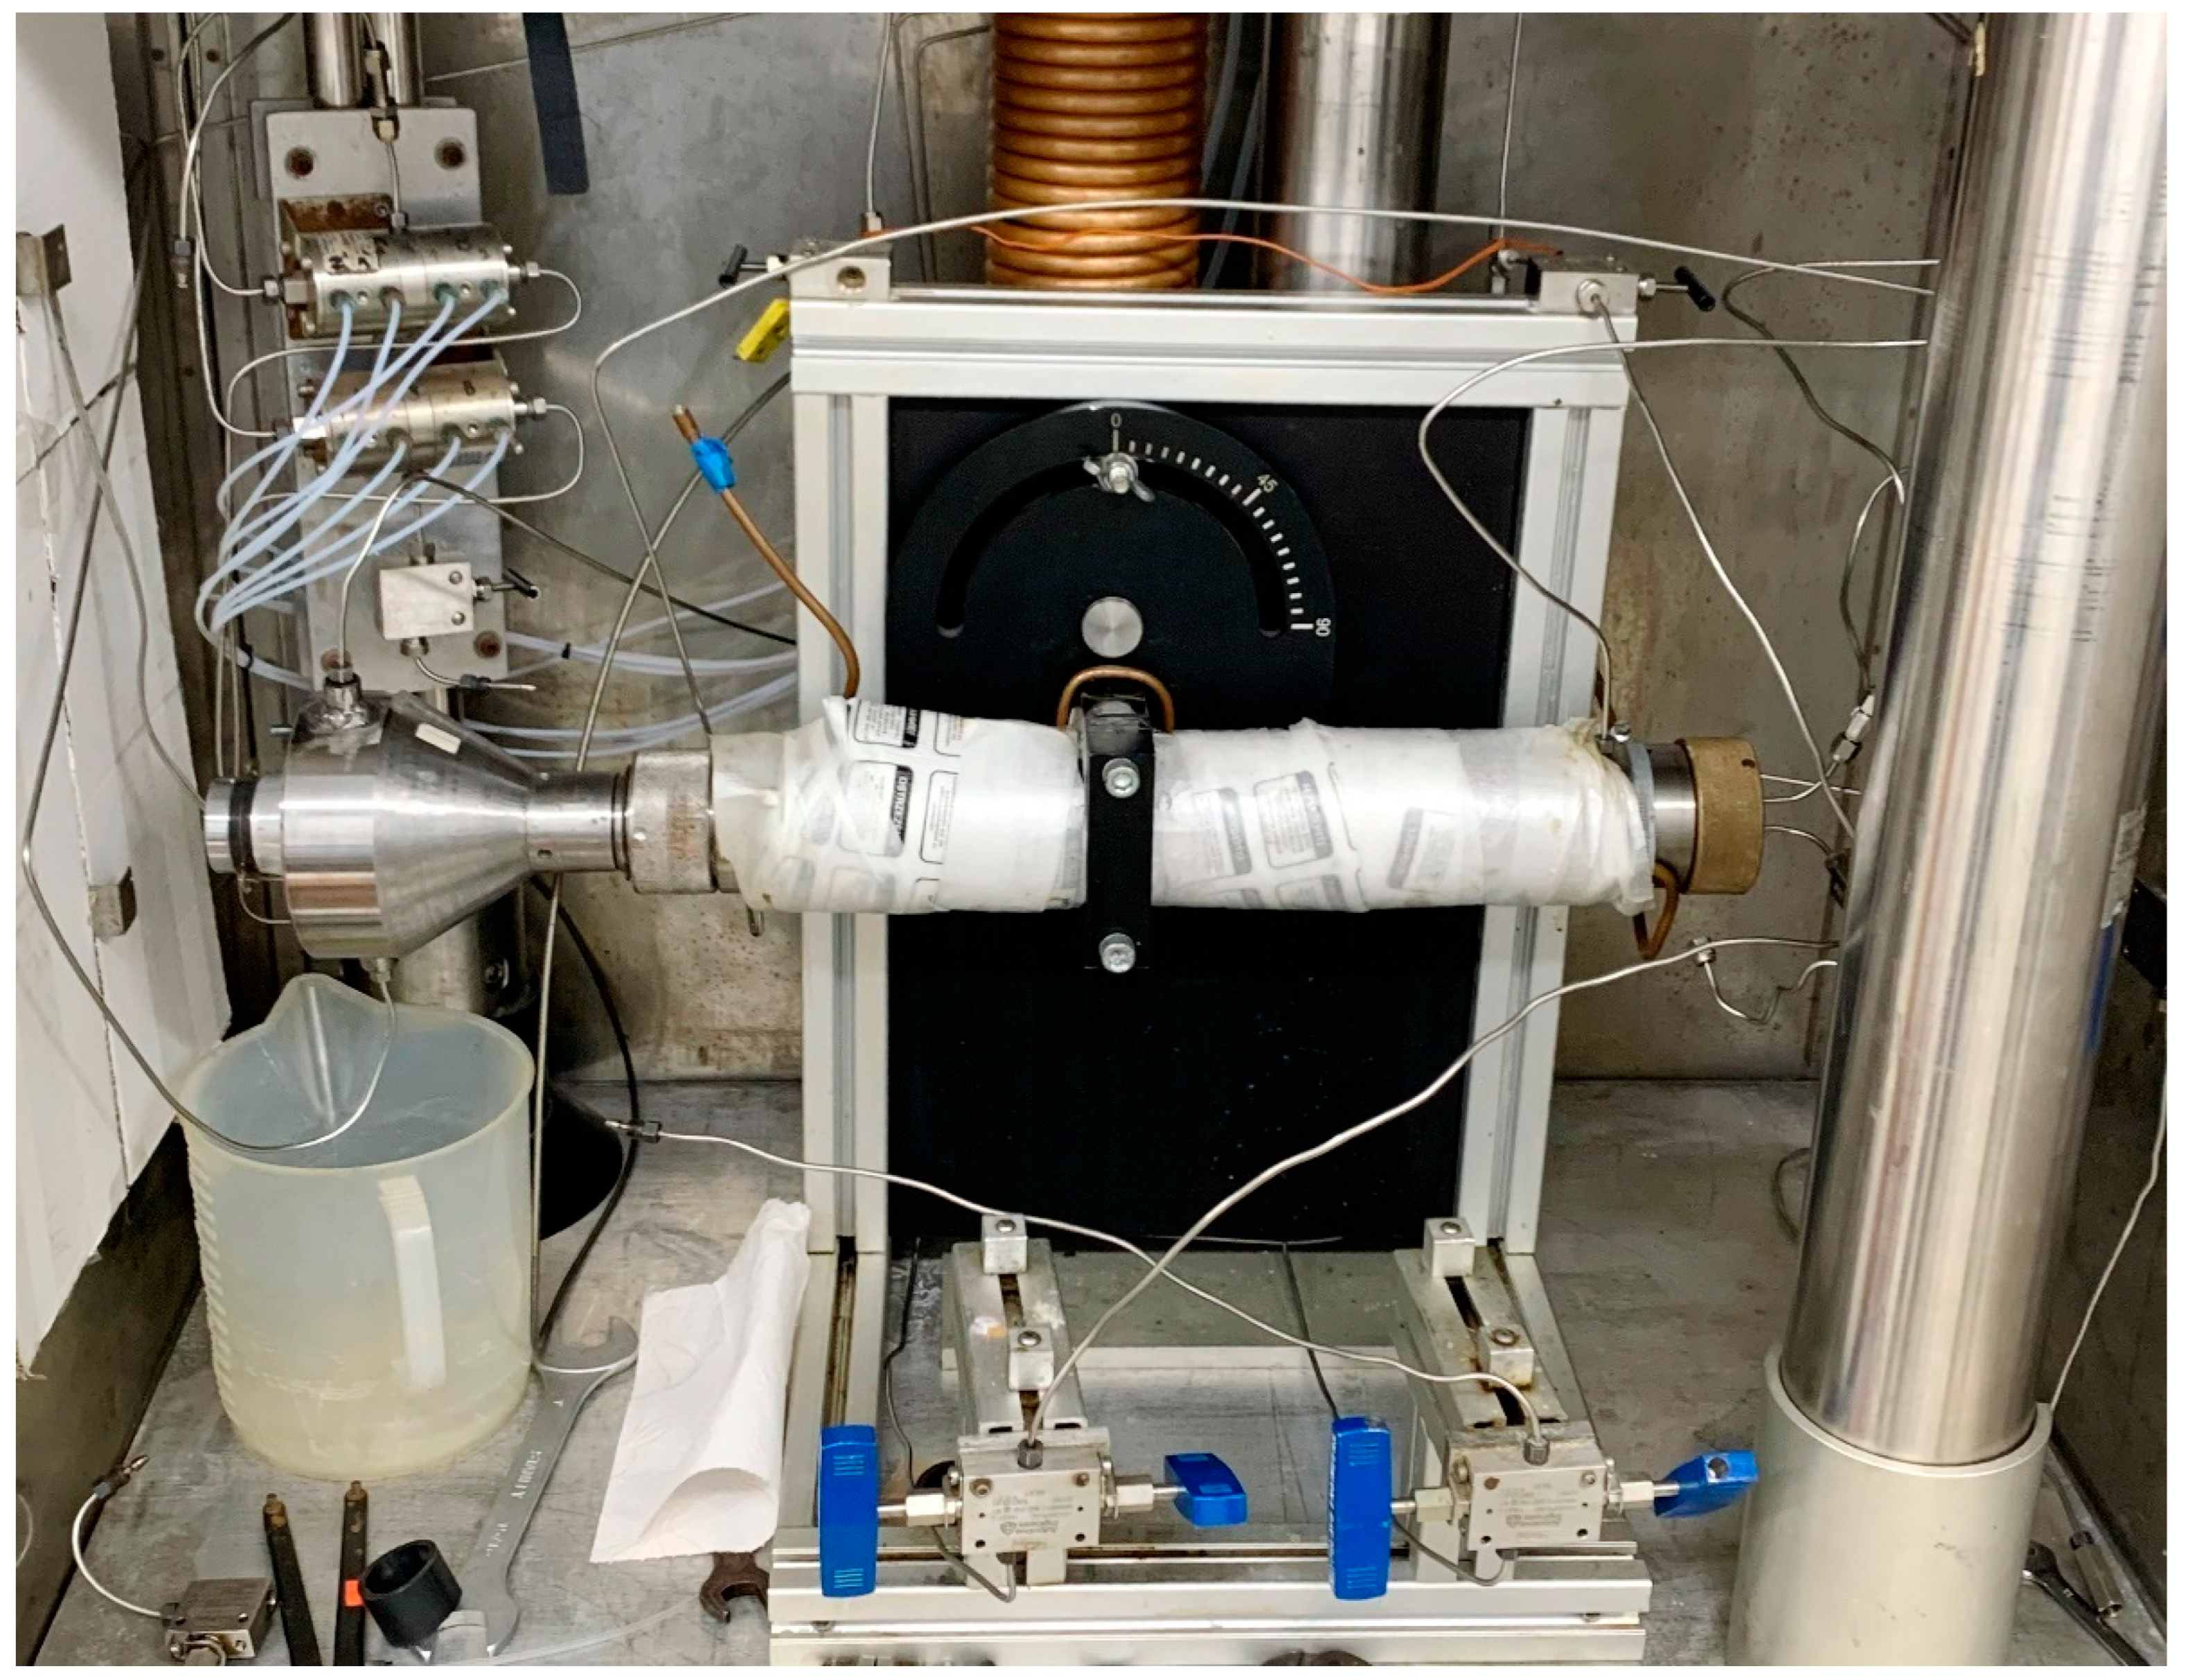
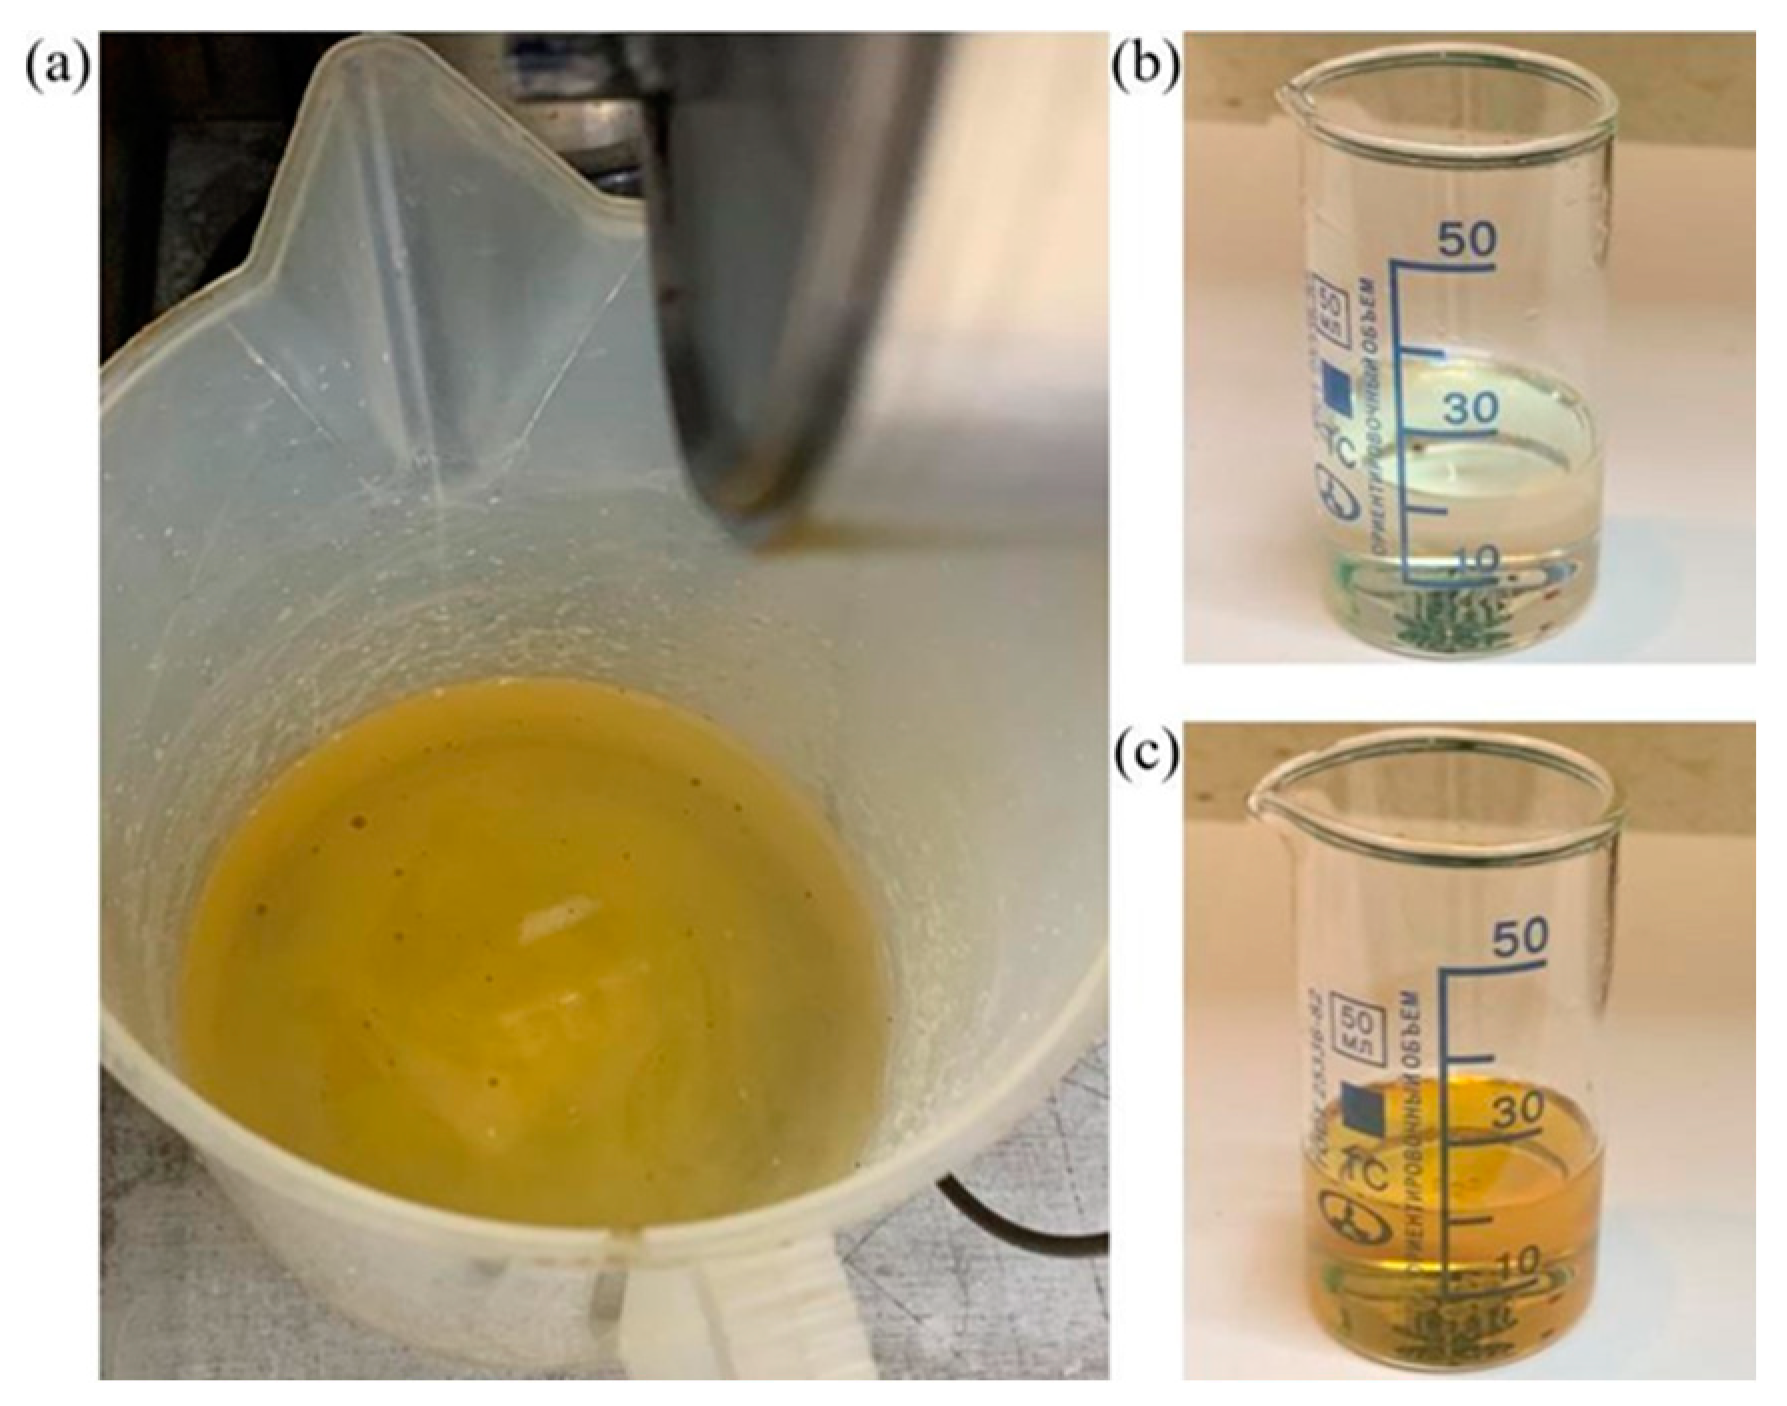
2.2. Methods
3. Results and Discussion
3.1. Residual Oil Mobilization
3.2. Intensification of Single-Phase Filtration
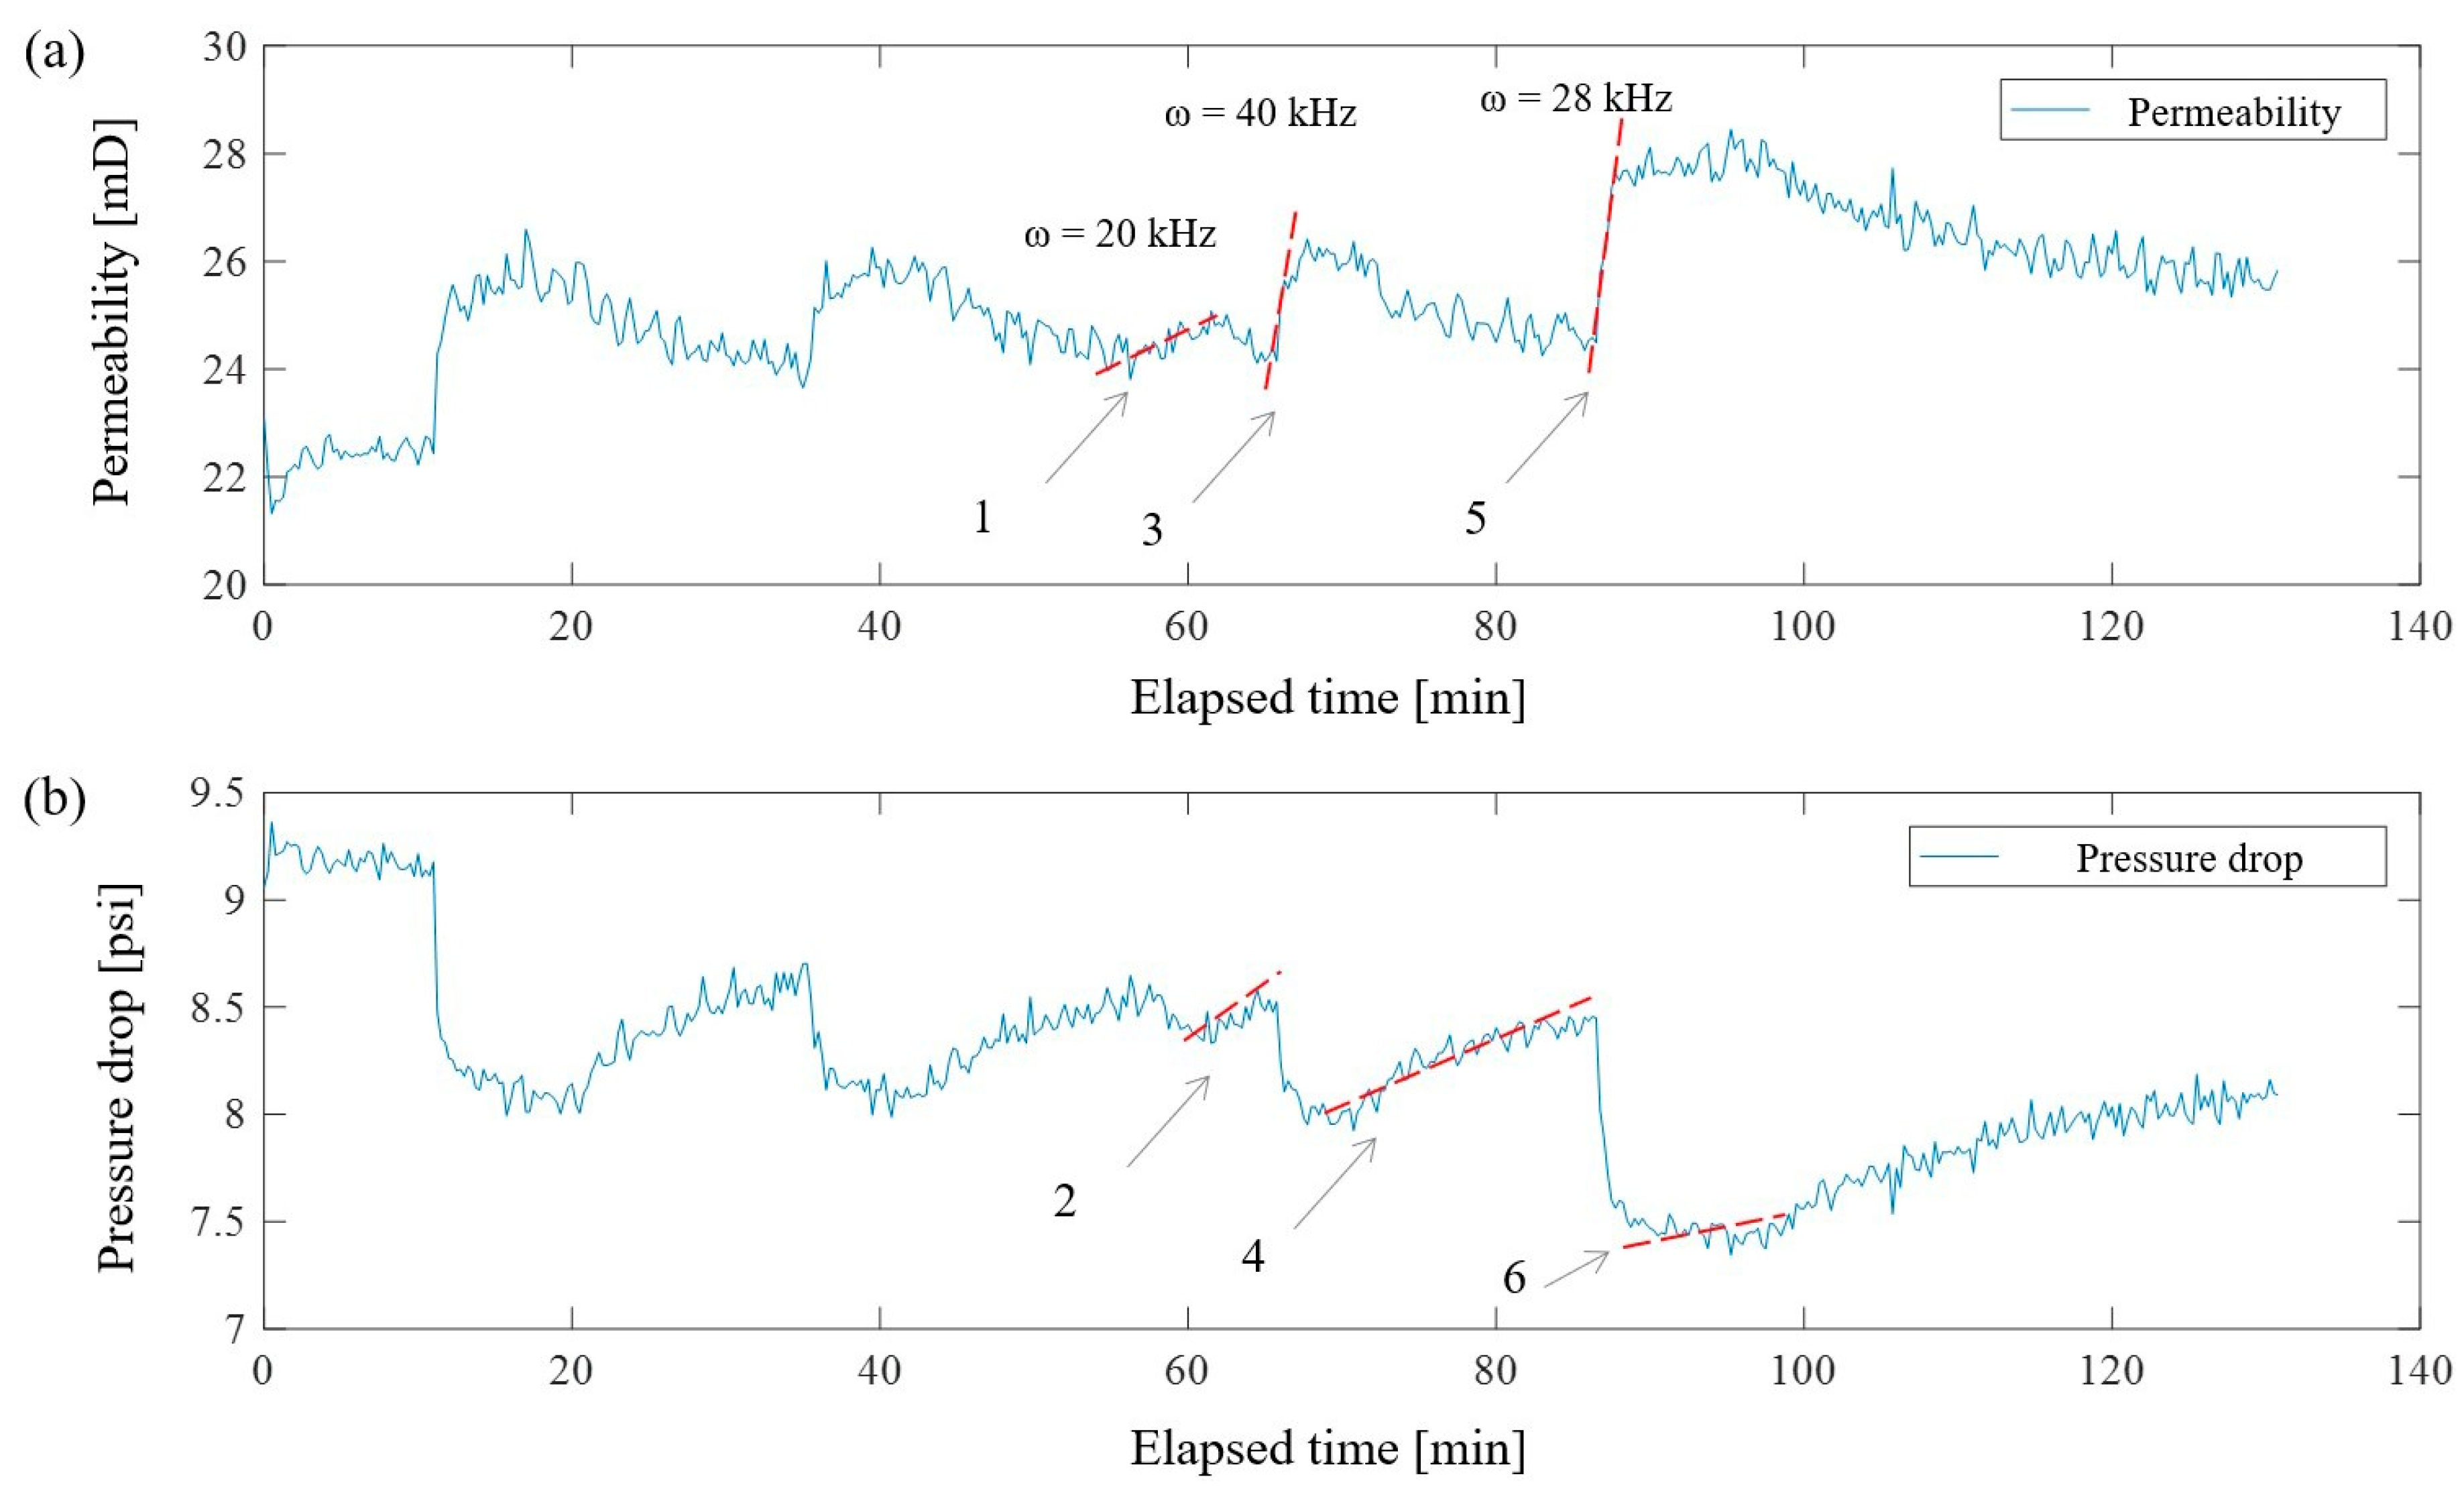
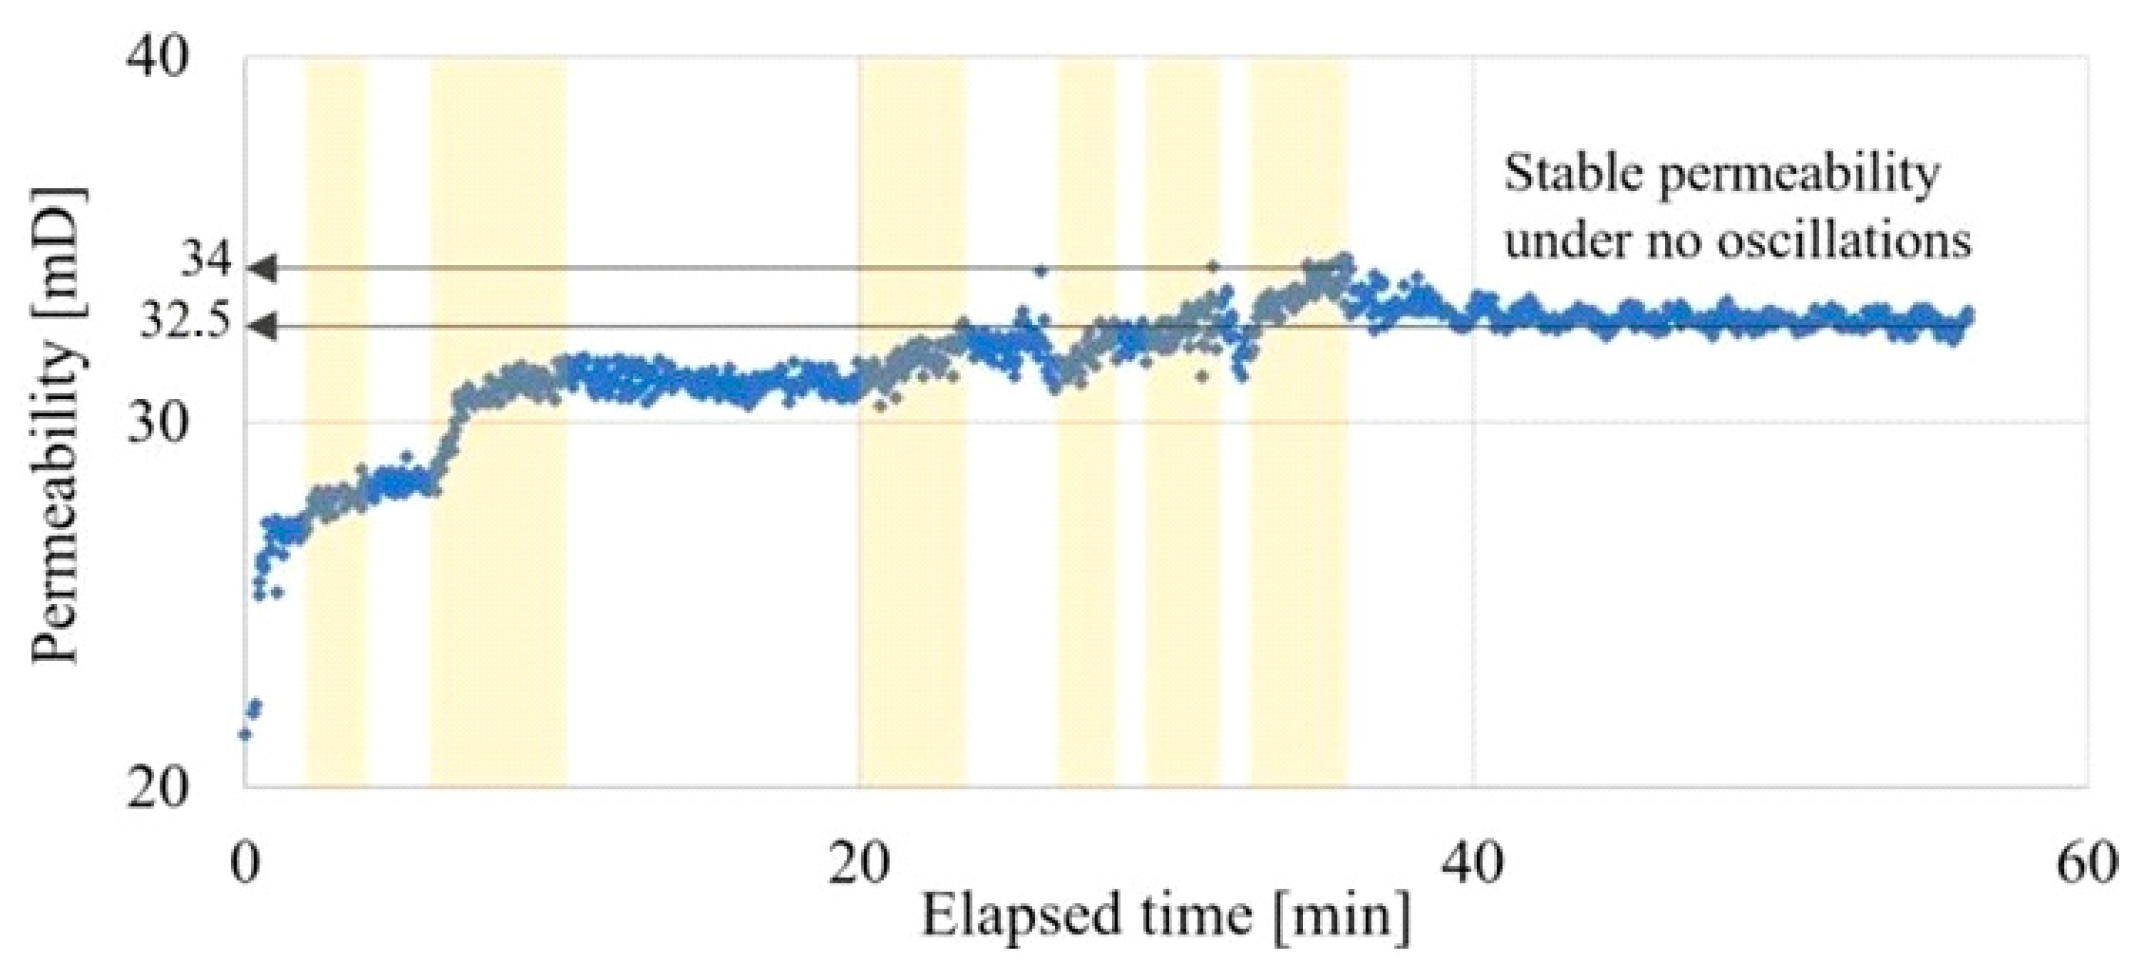
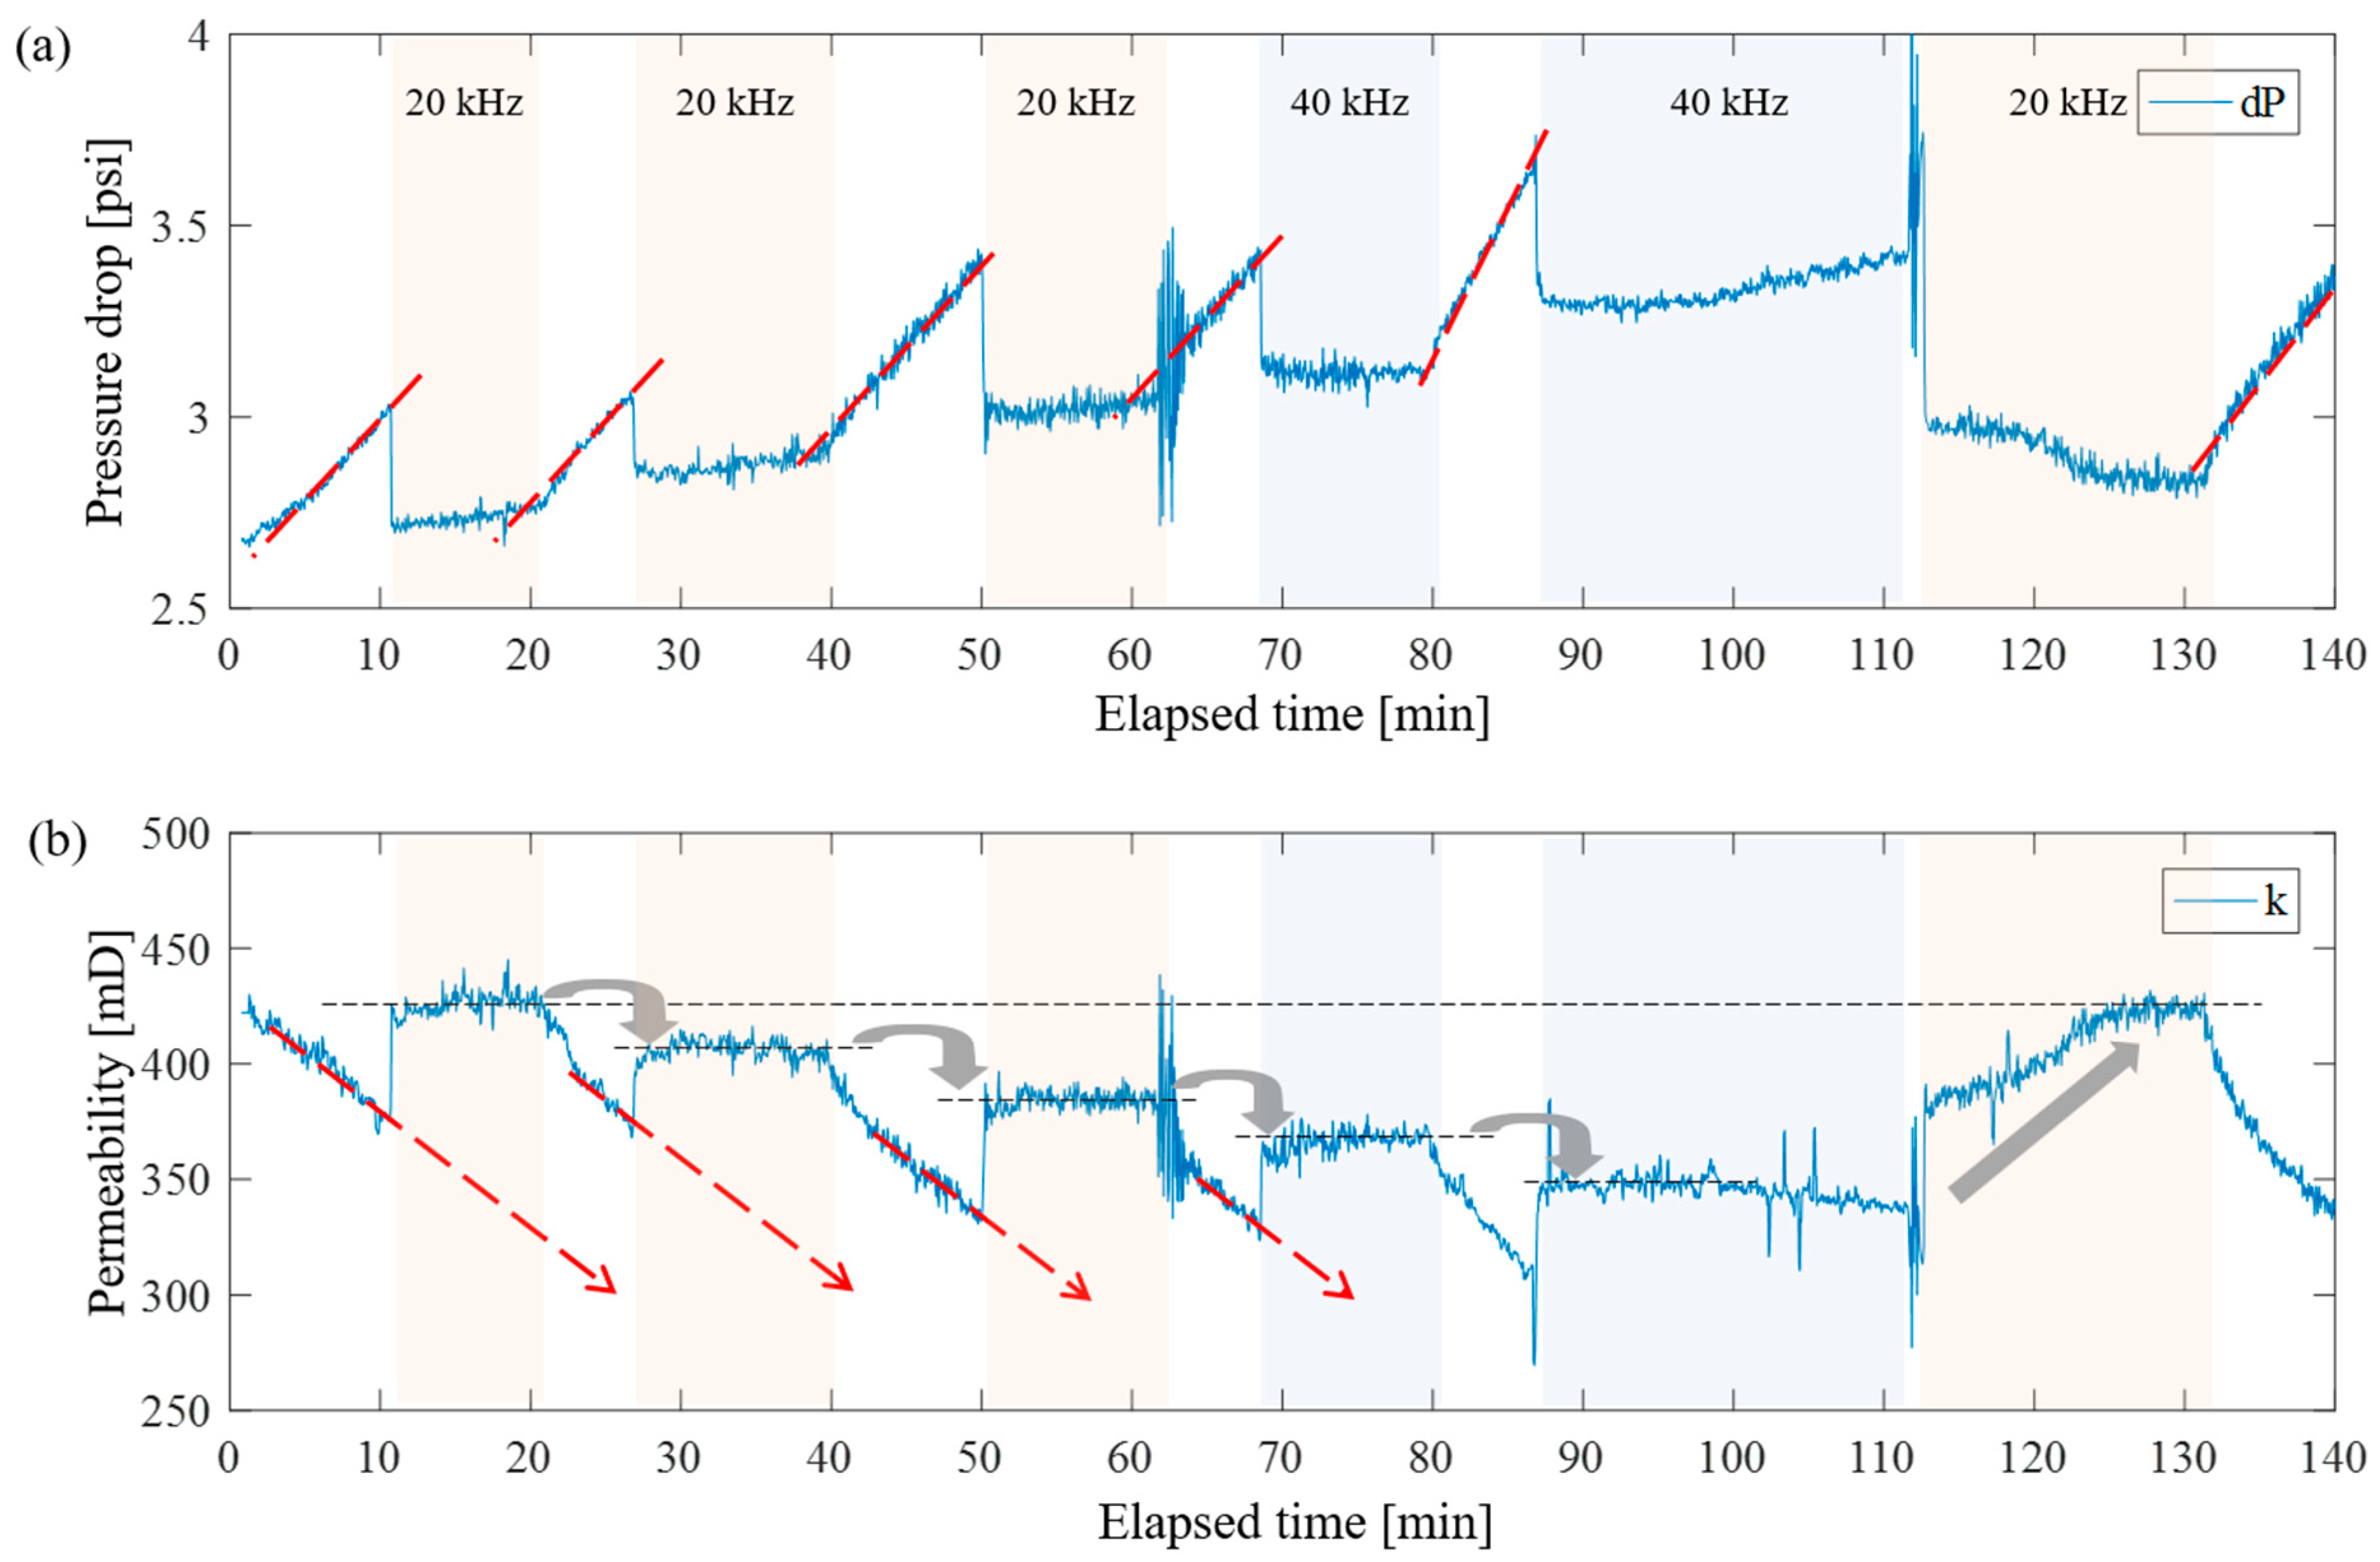
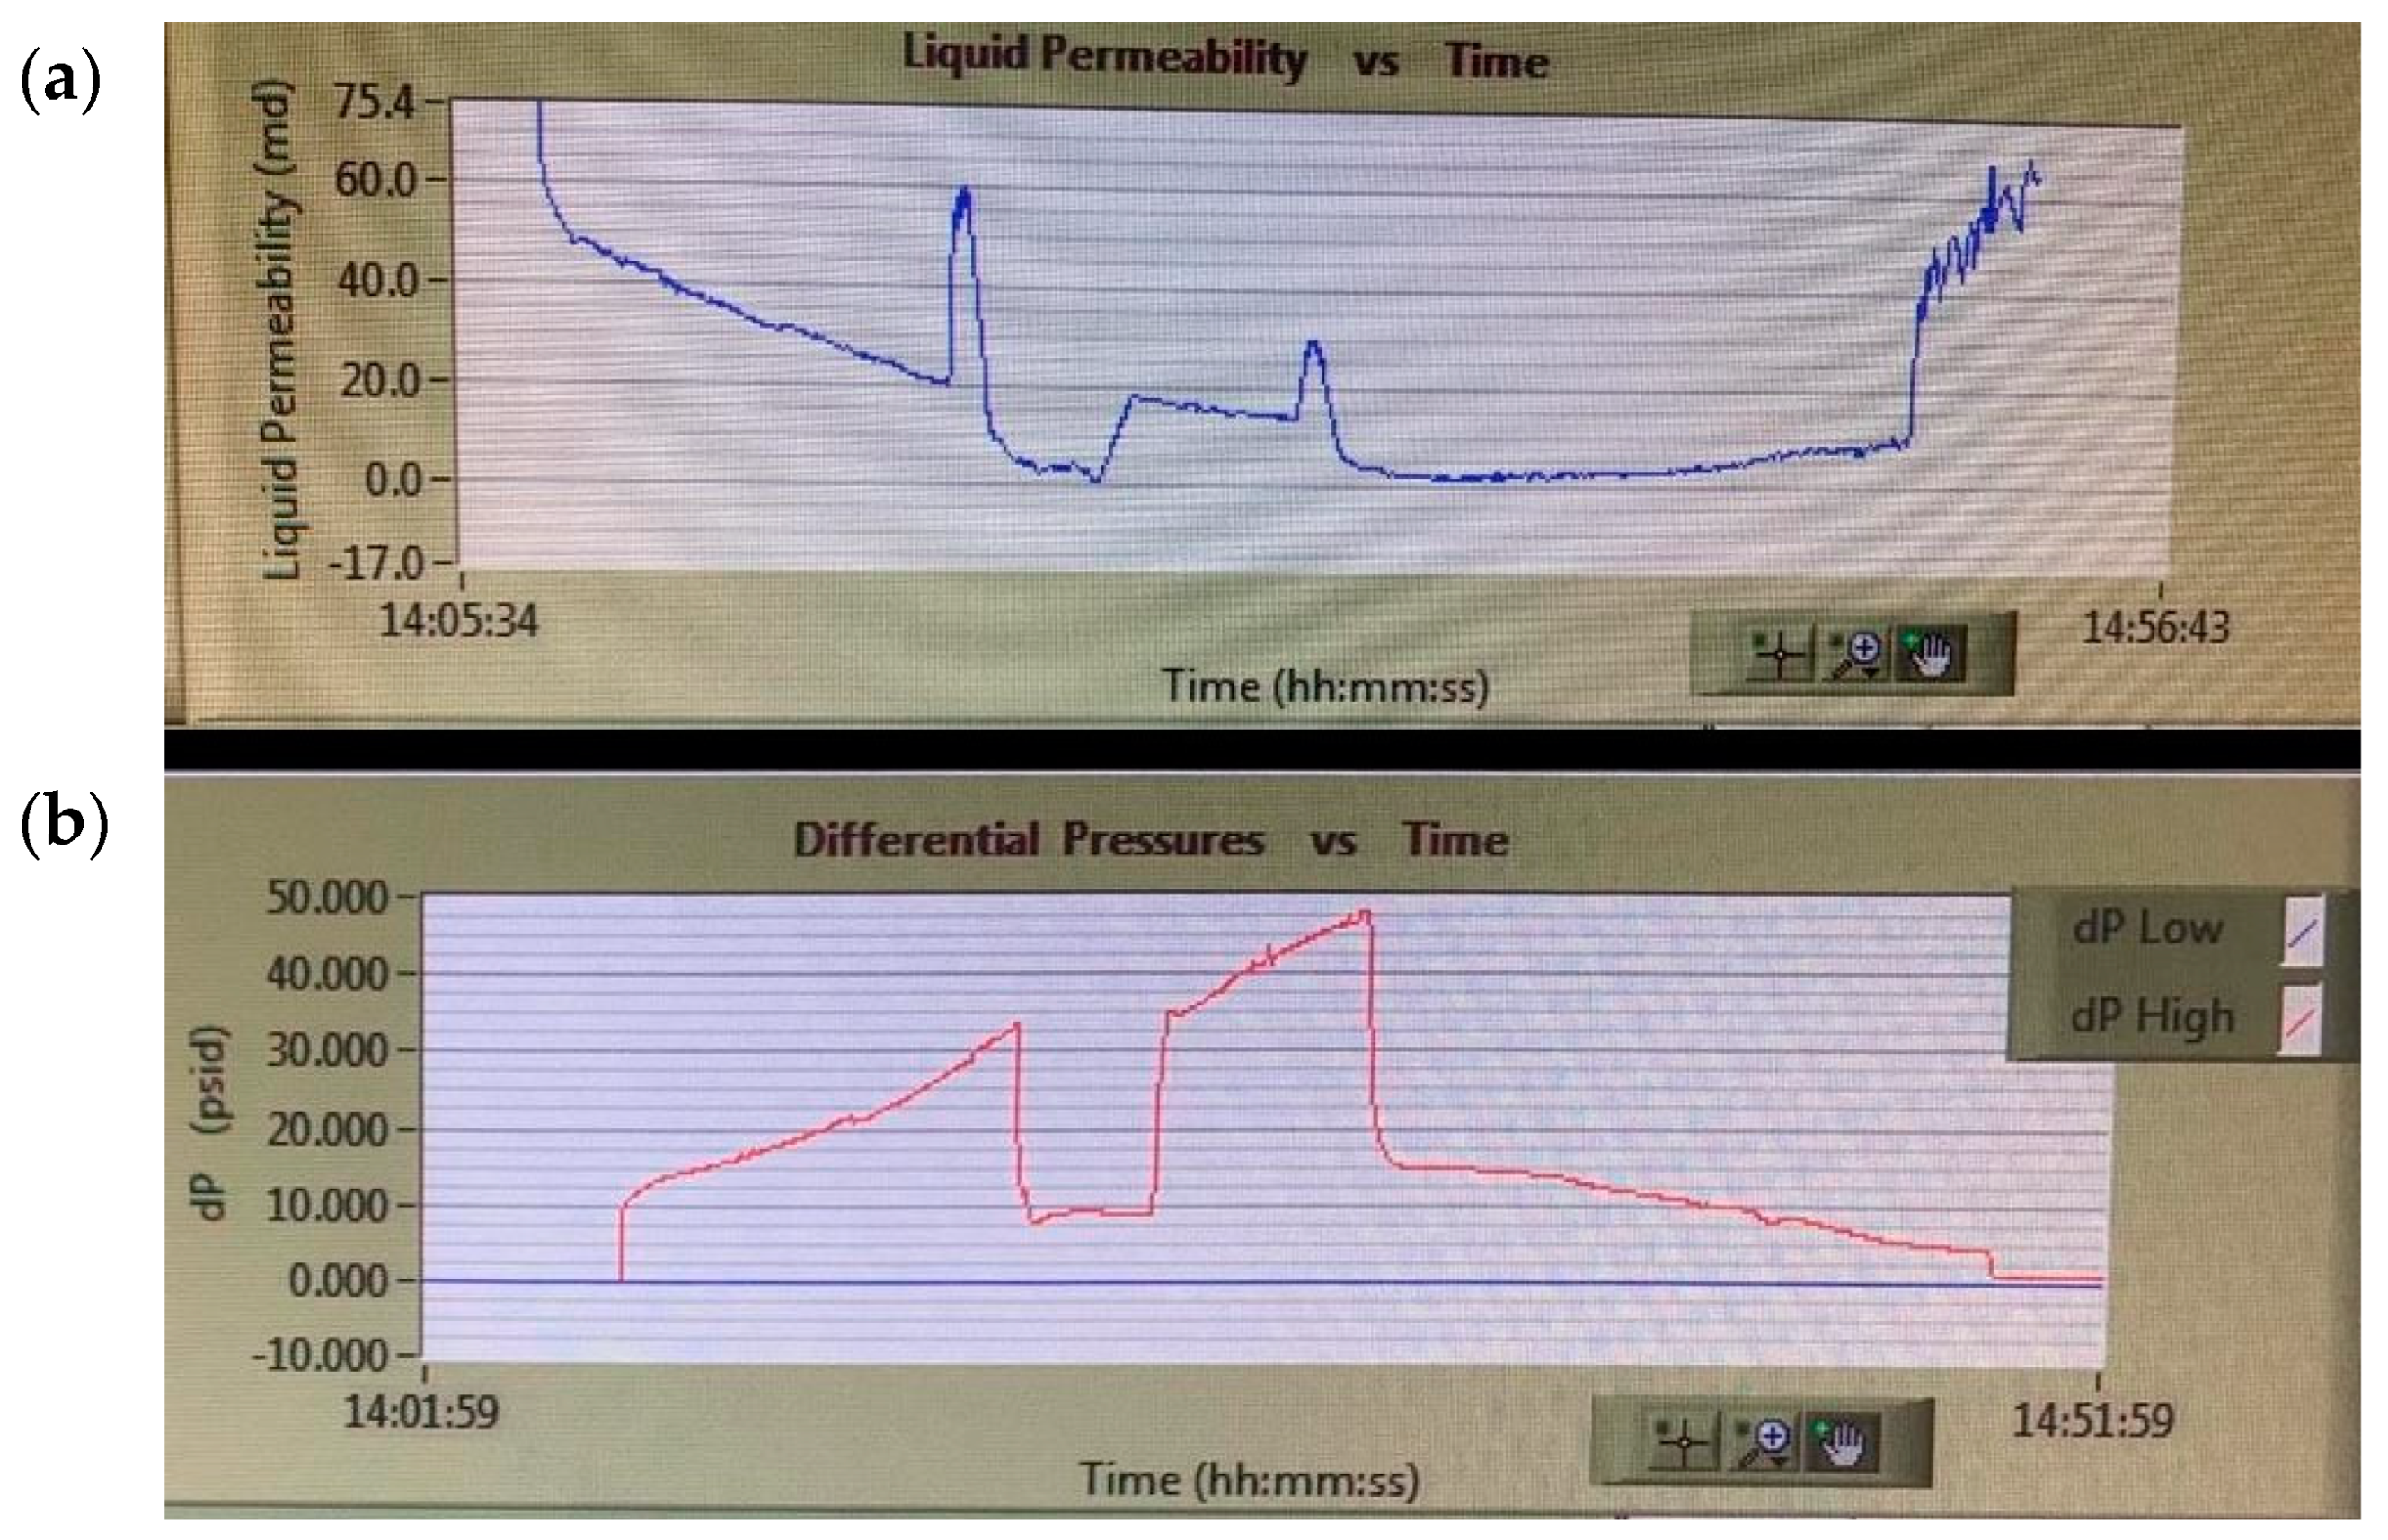
3.2.1. Medium-Permeability Sandstone
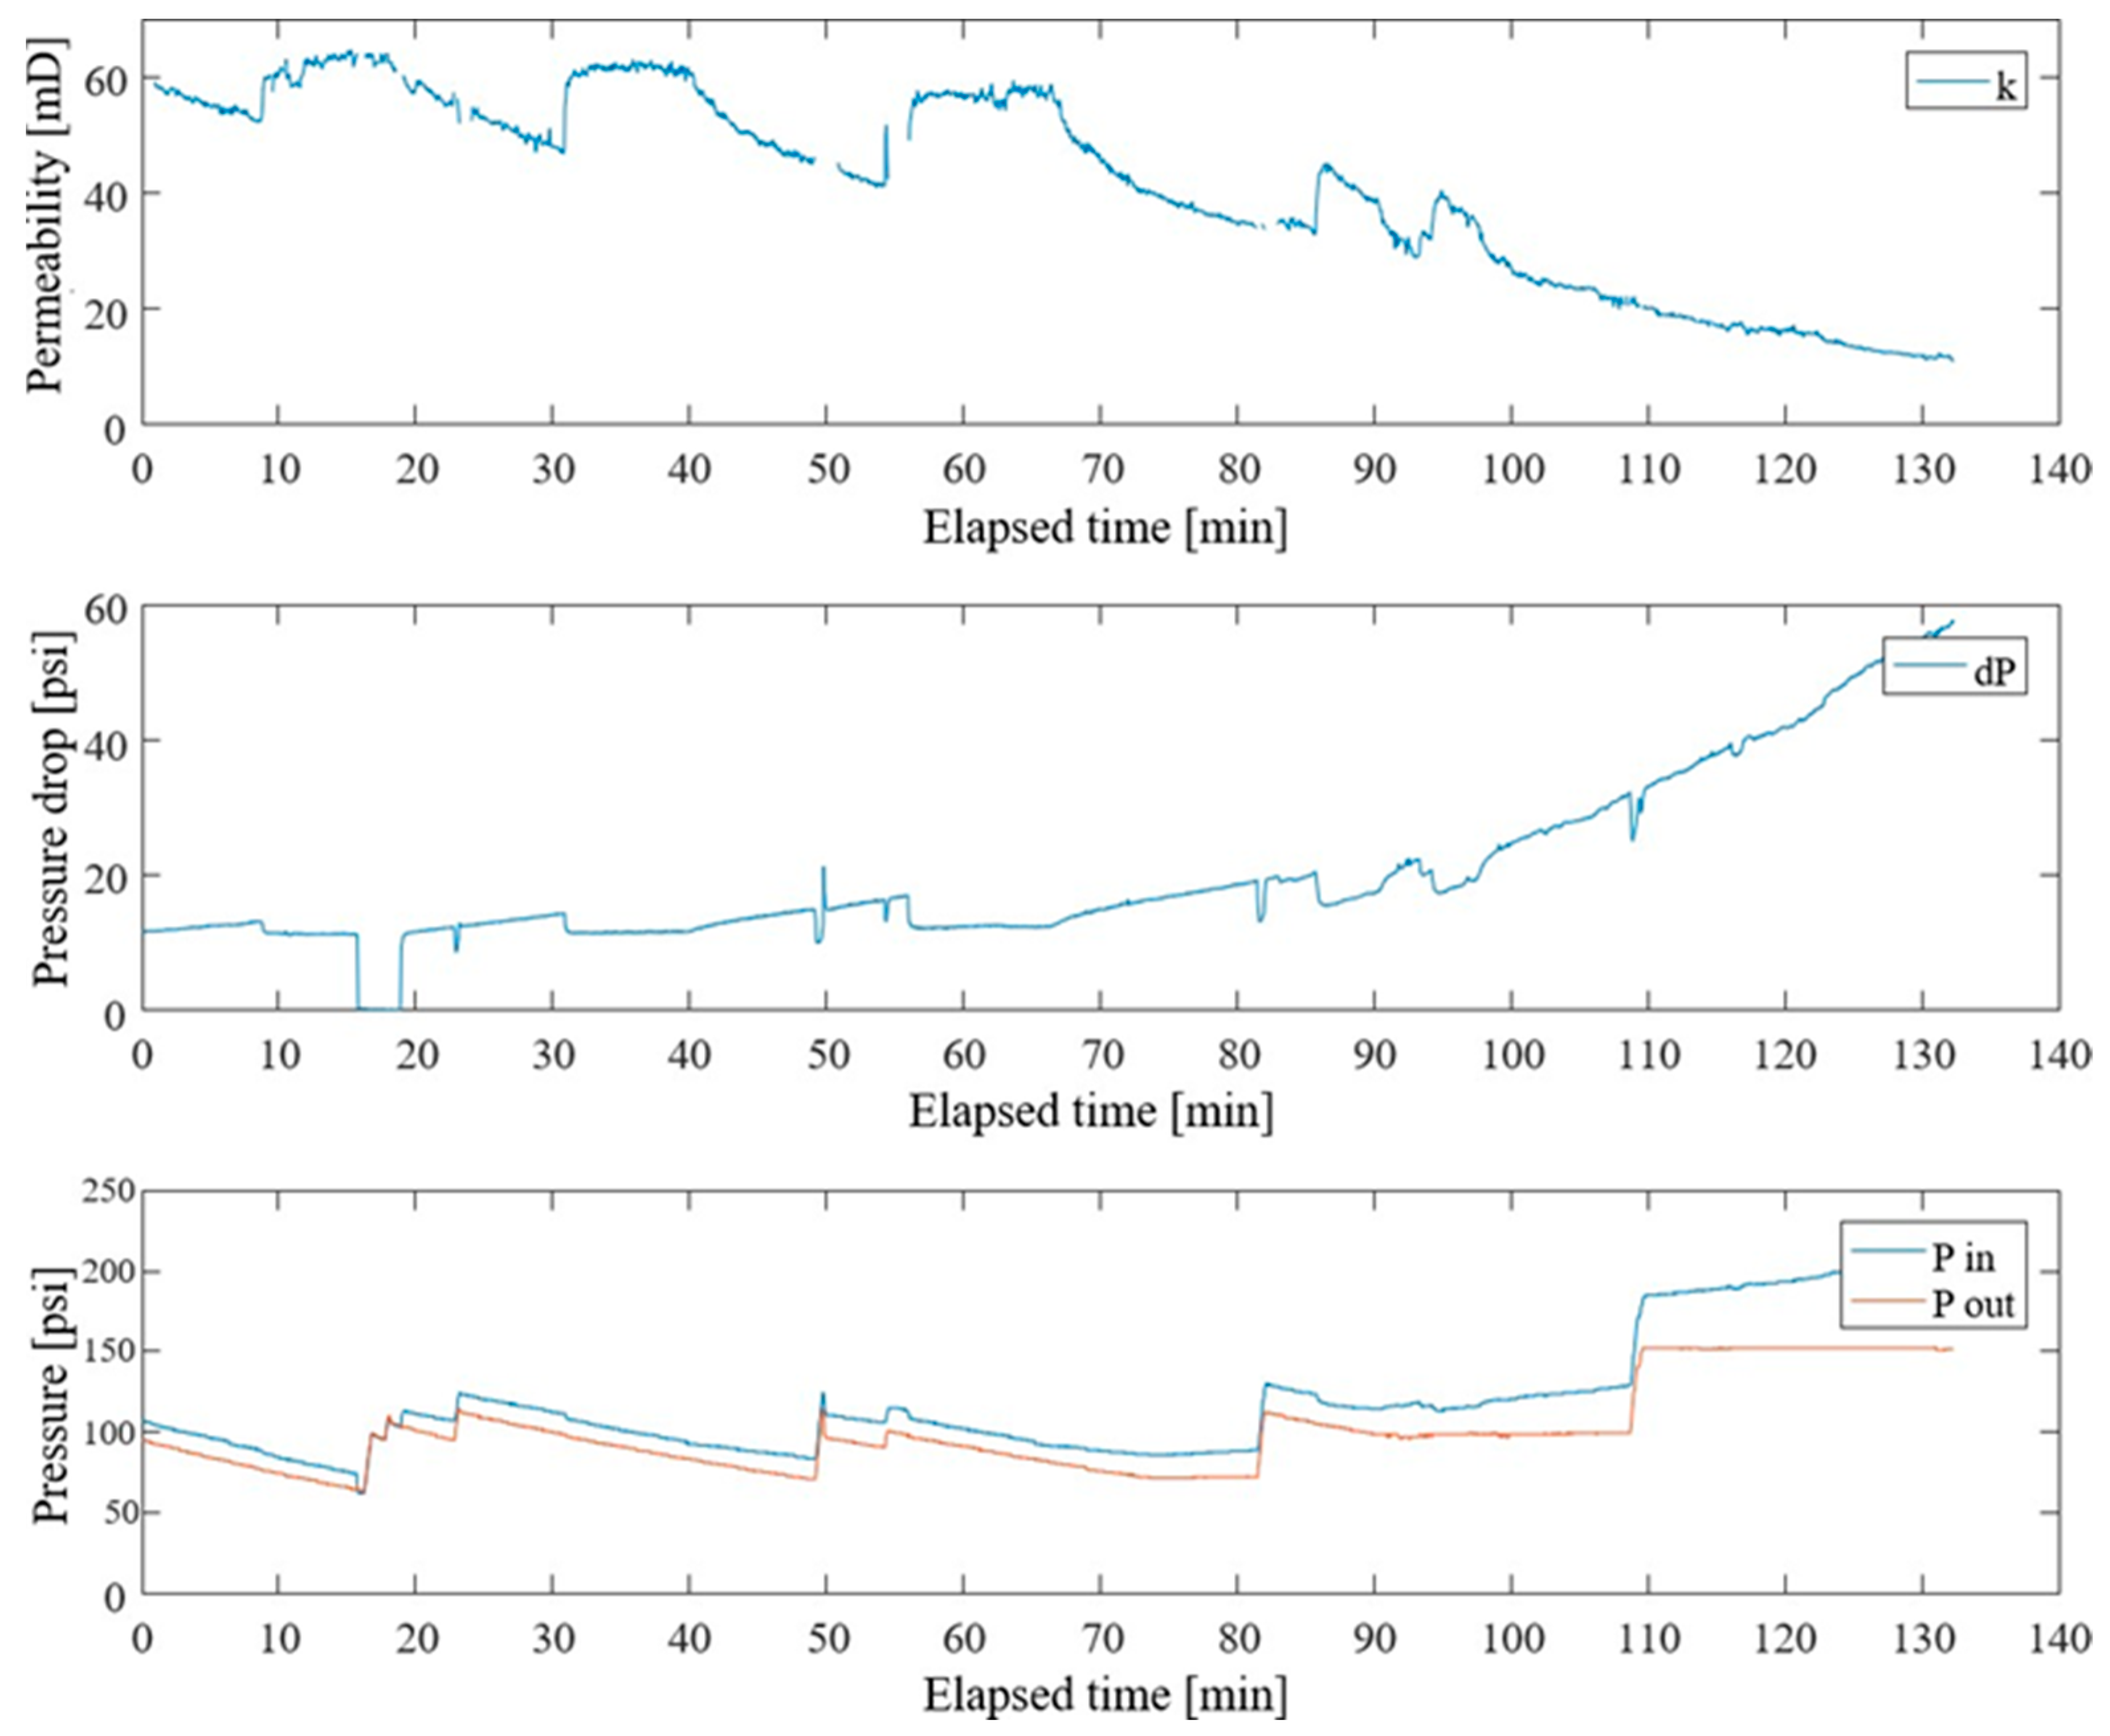
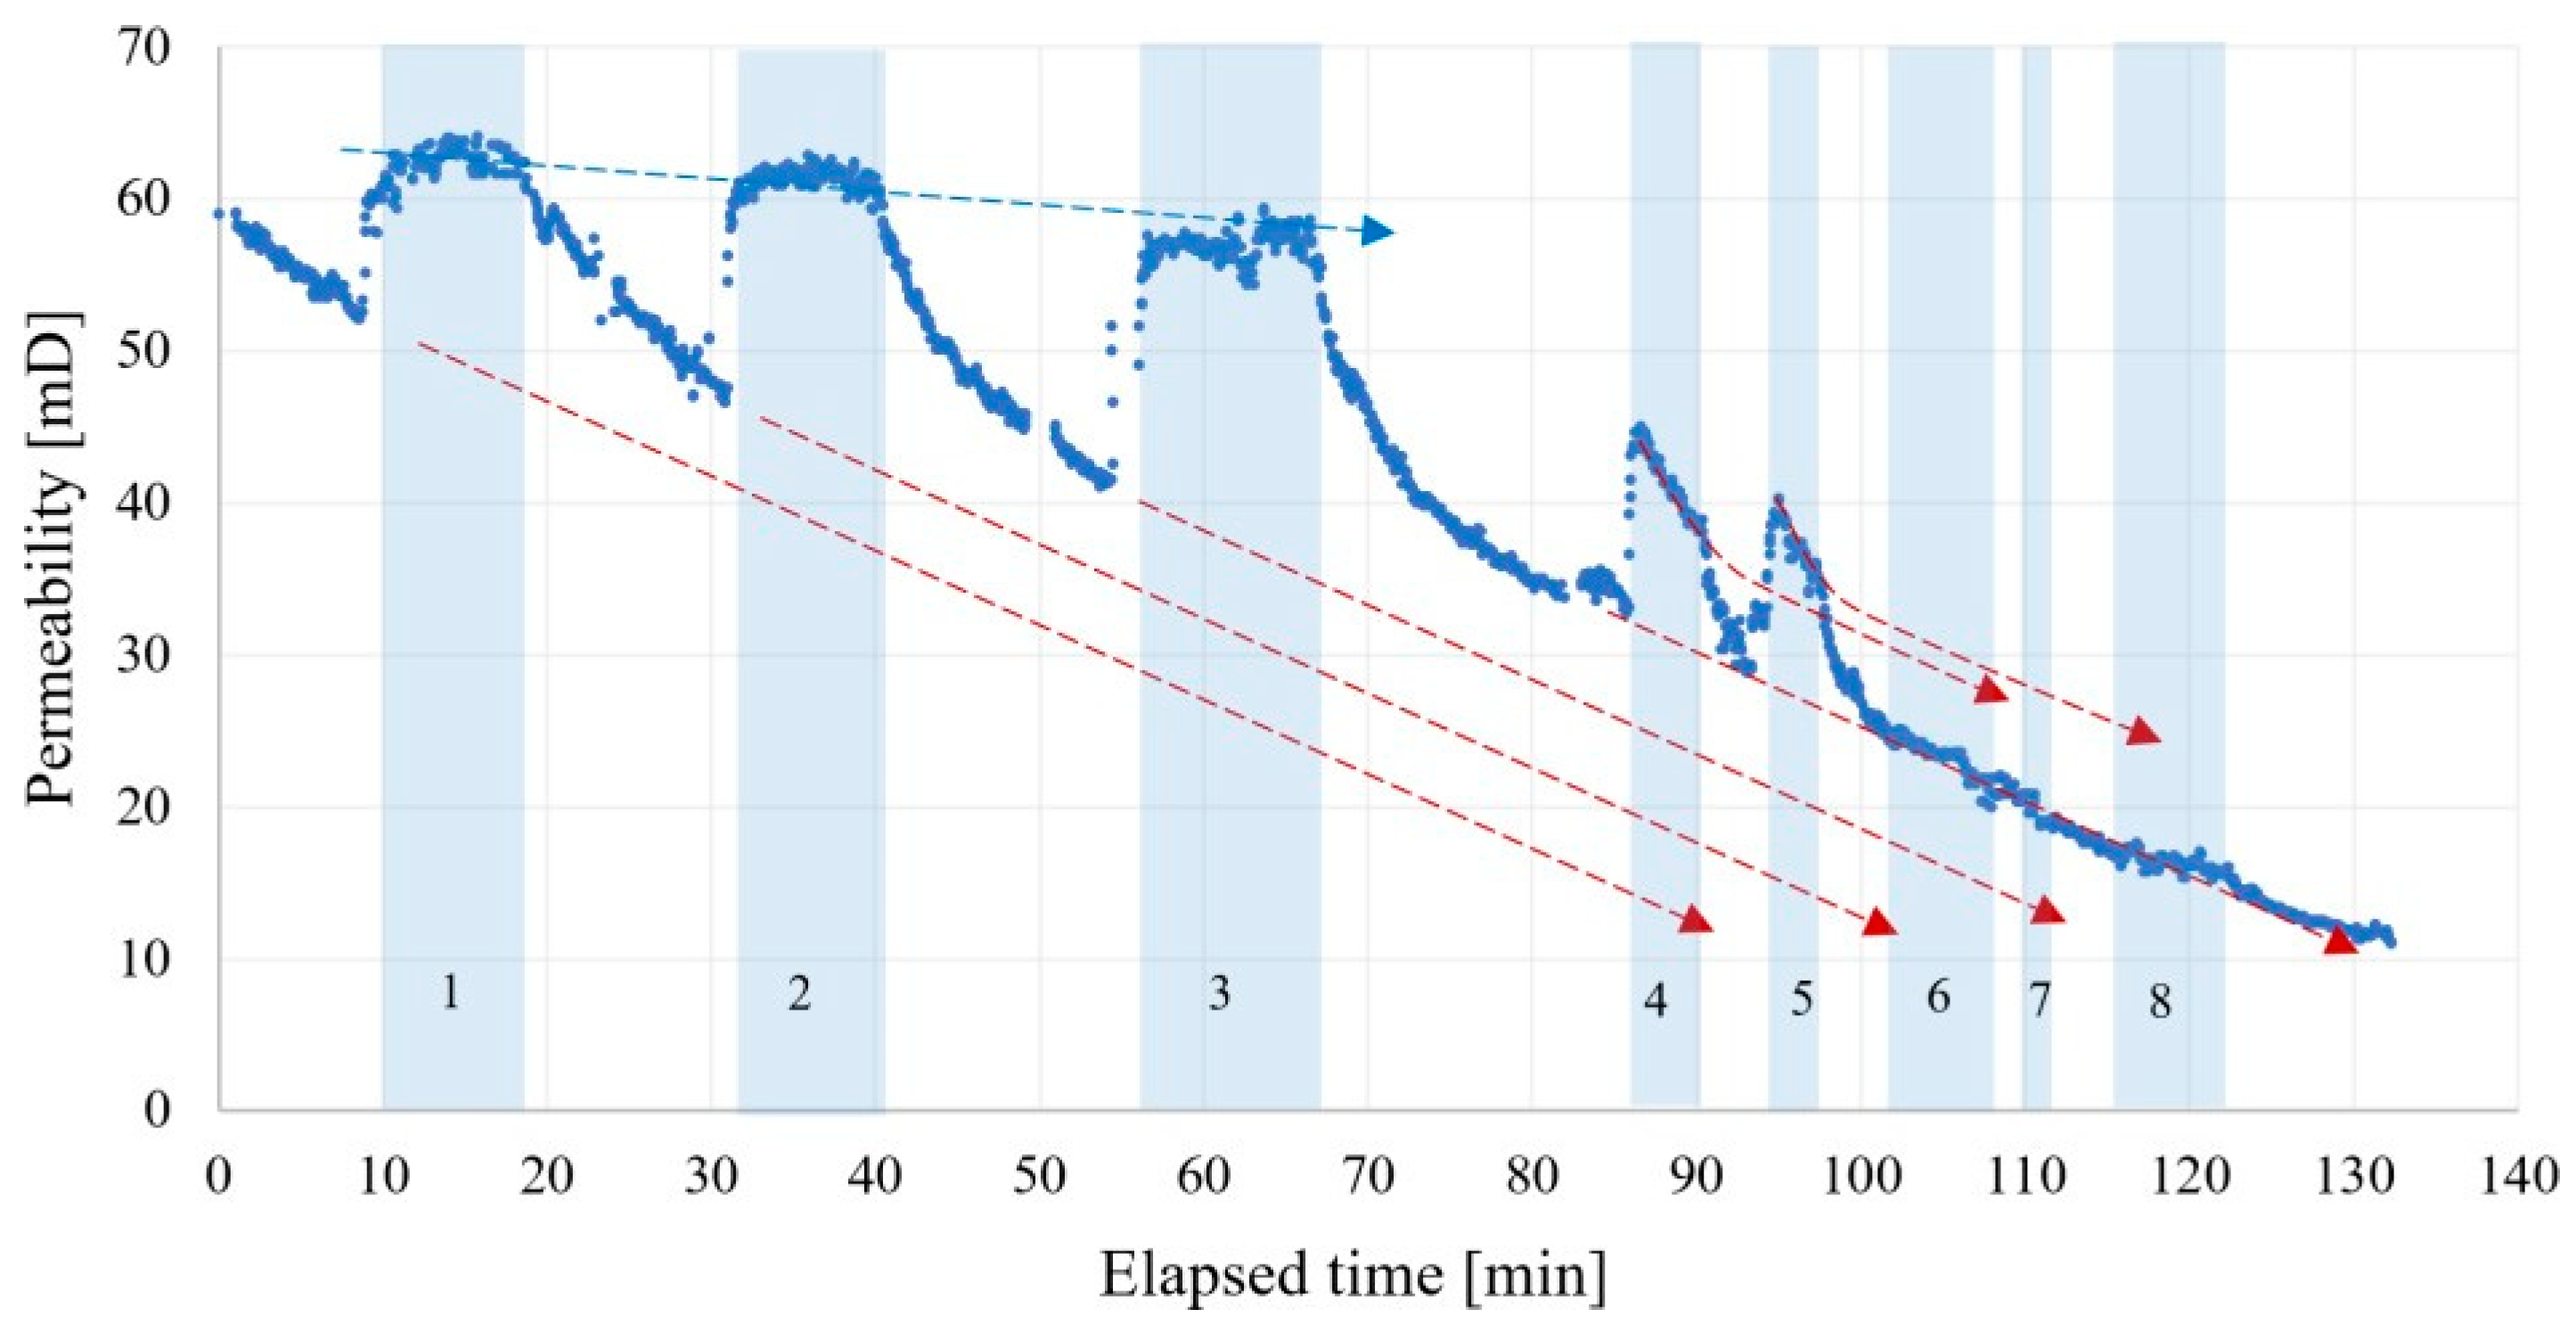
3.2.2. Low-Permeability Sandstone
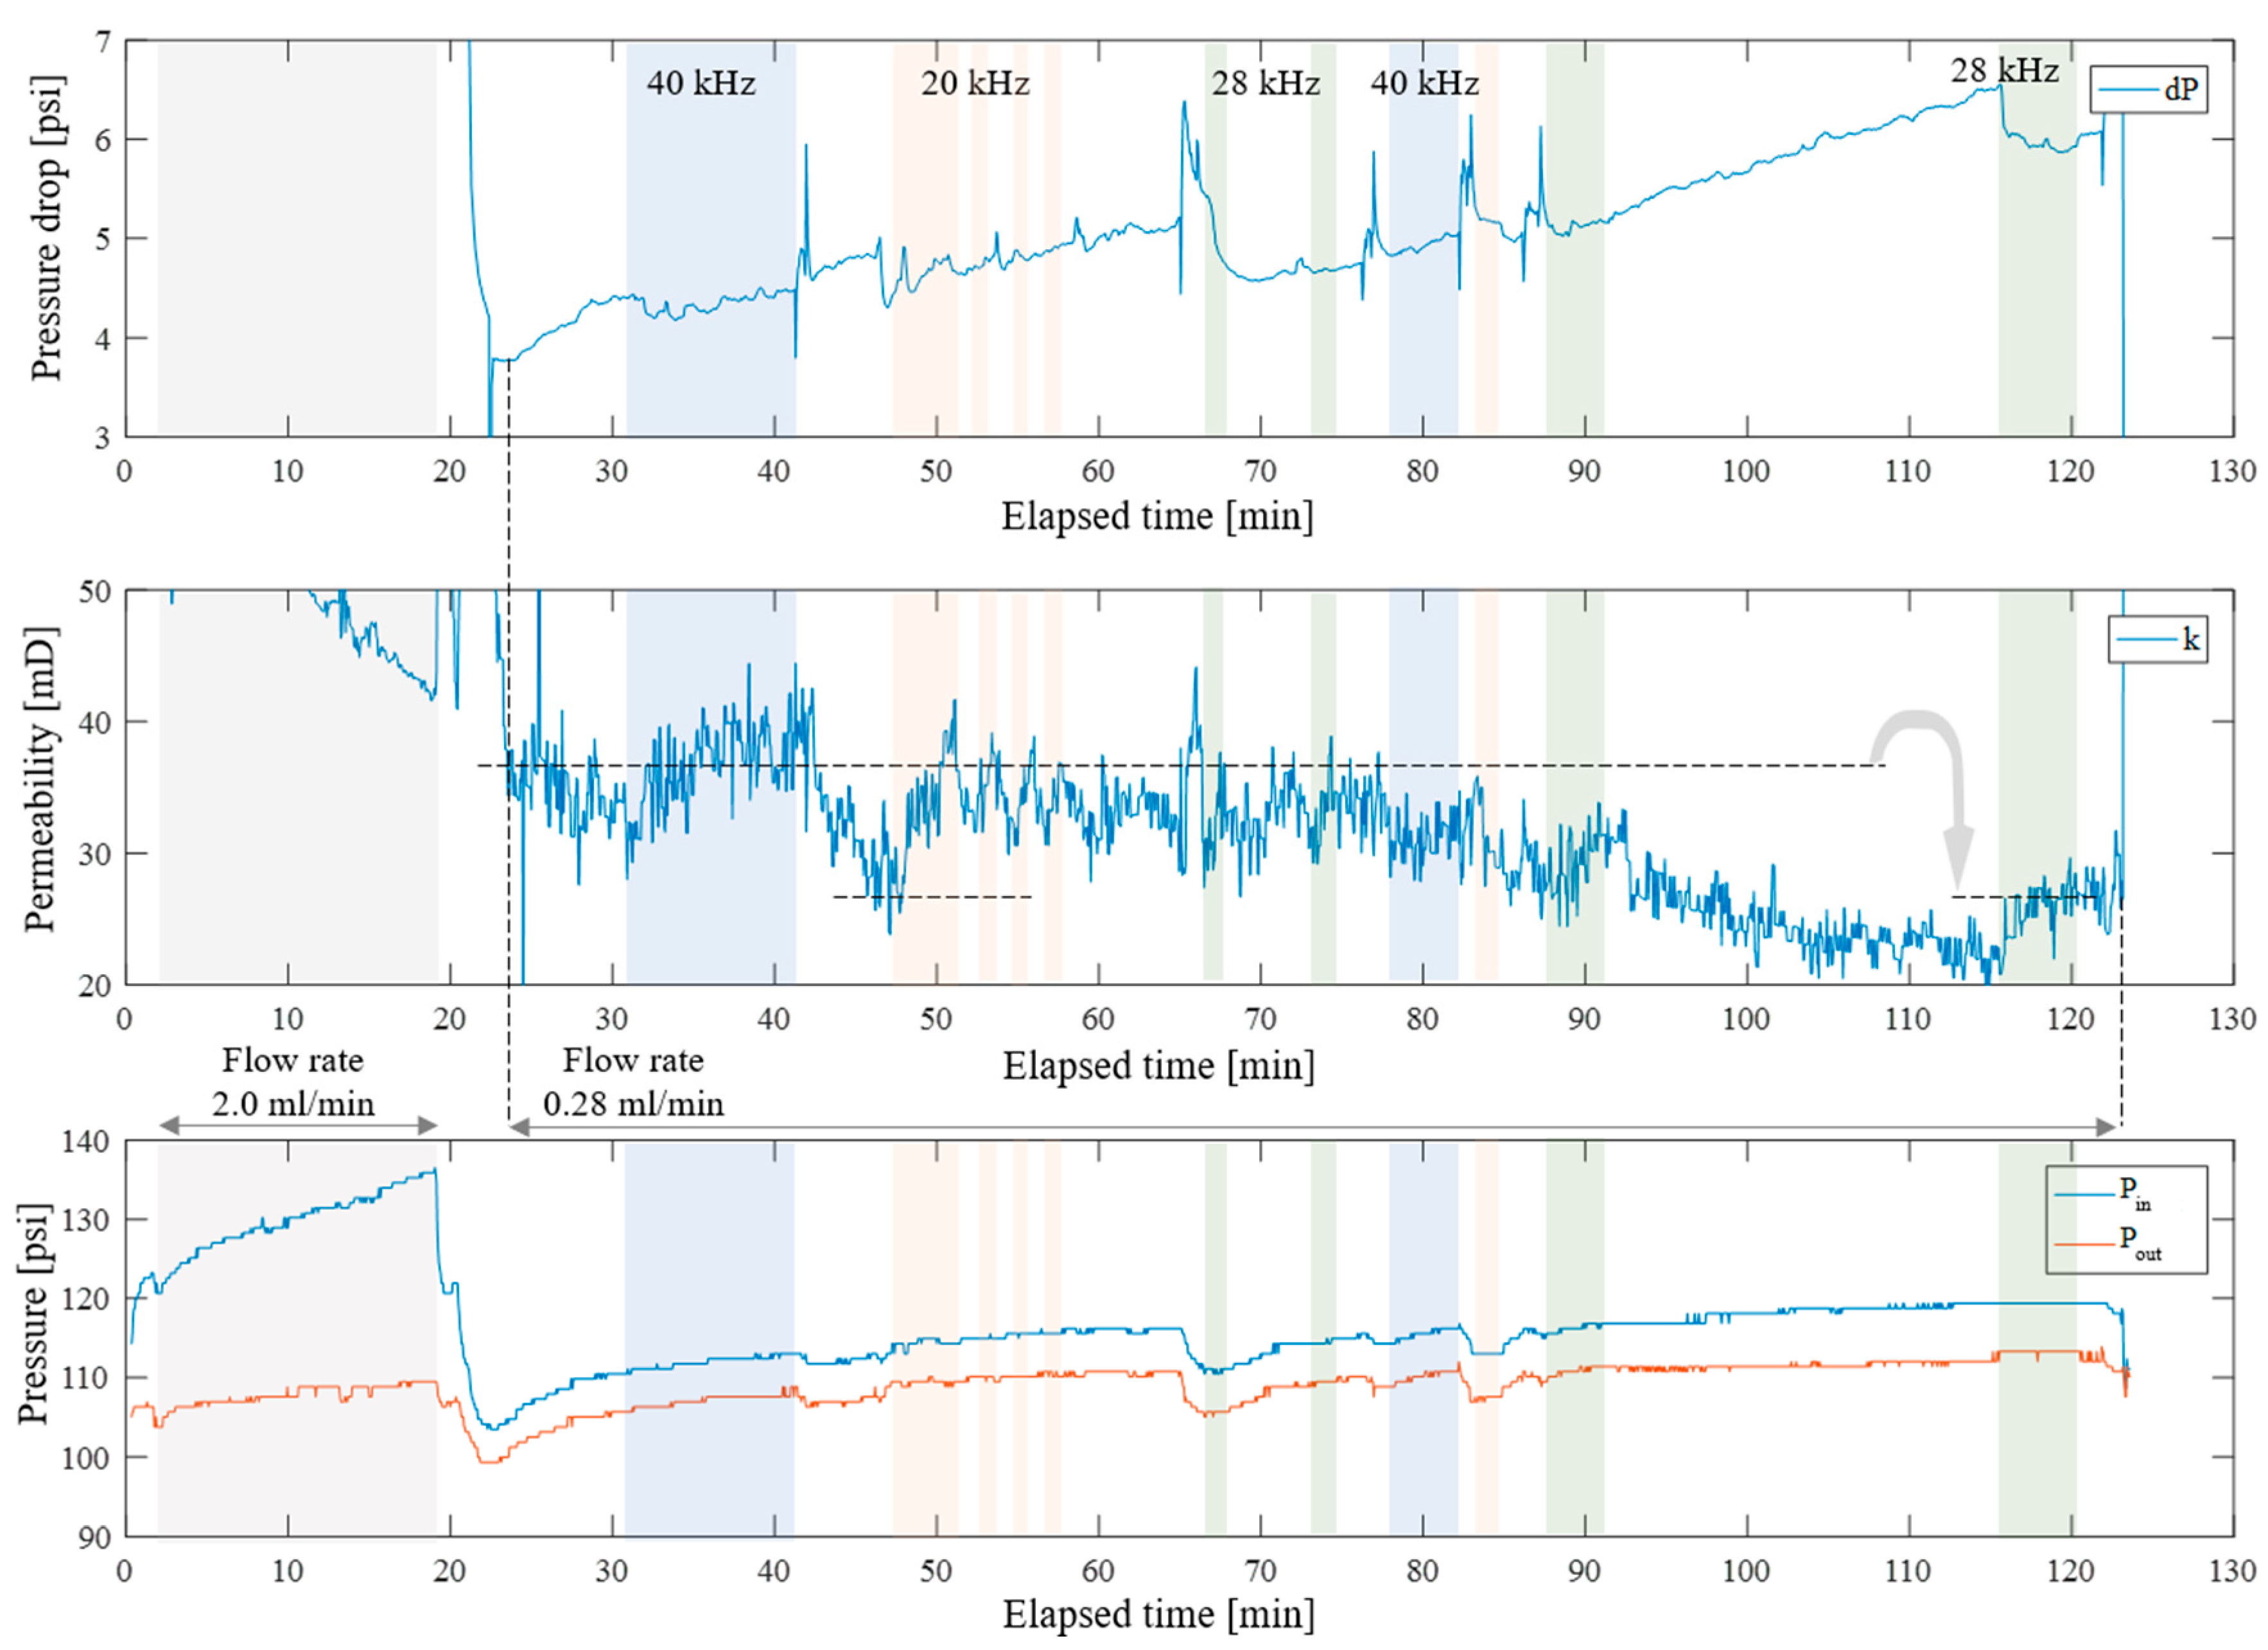
3.2.3. High-Permeability Sandstone
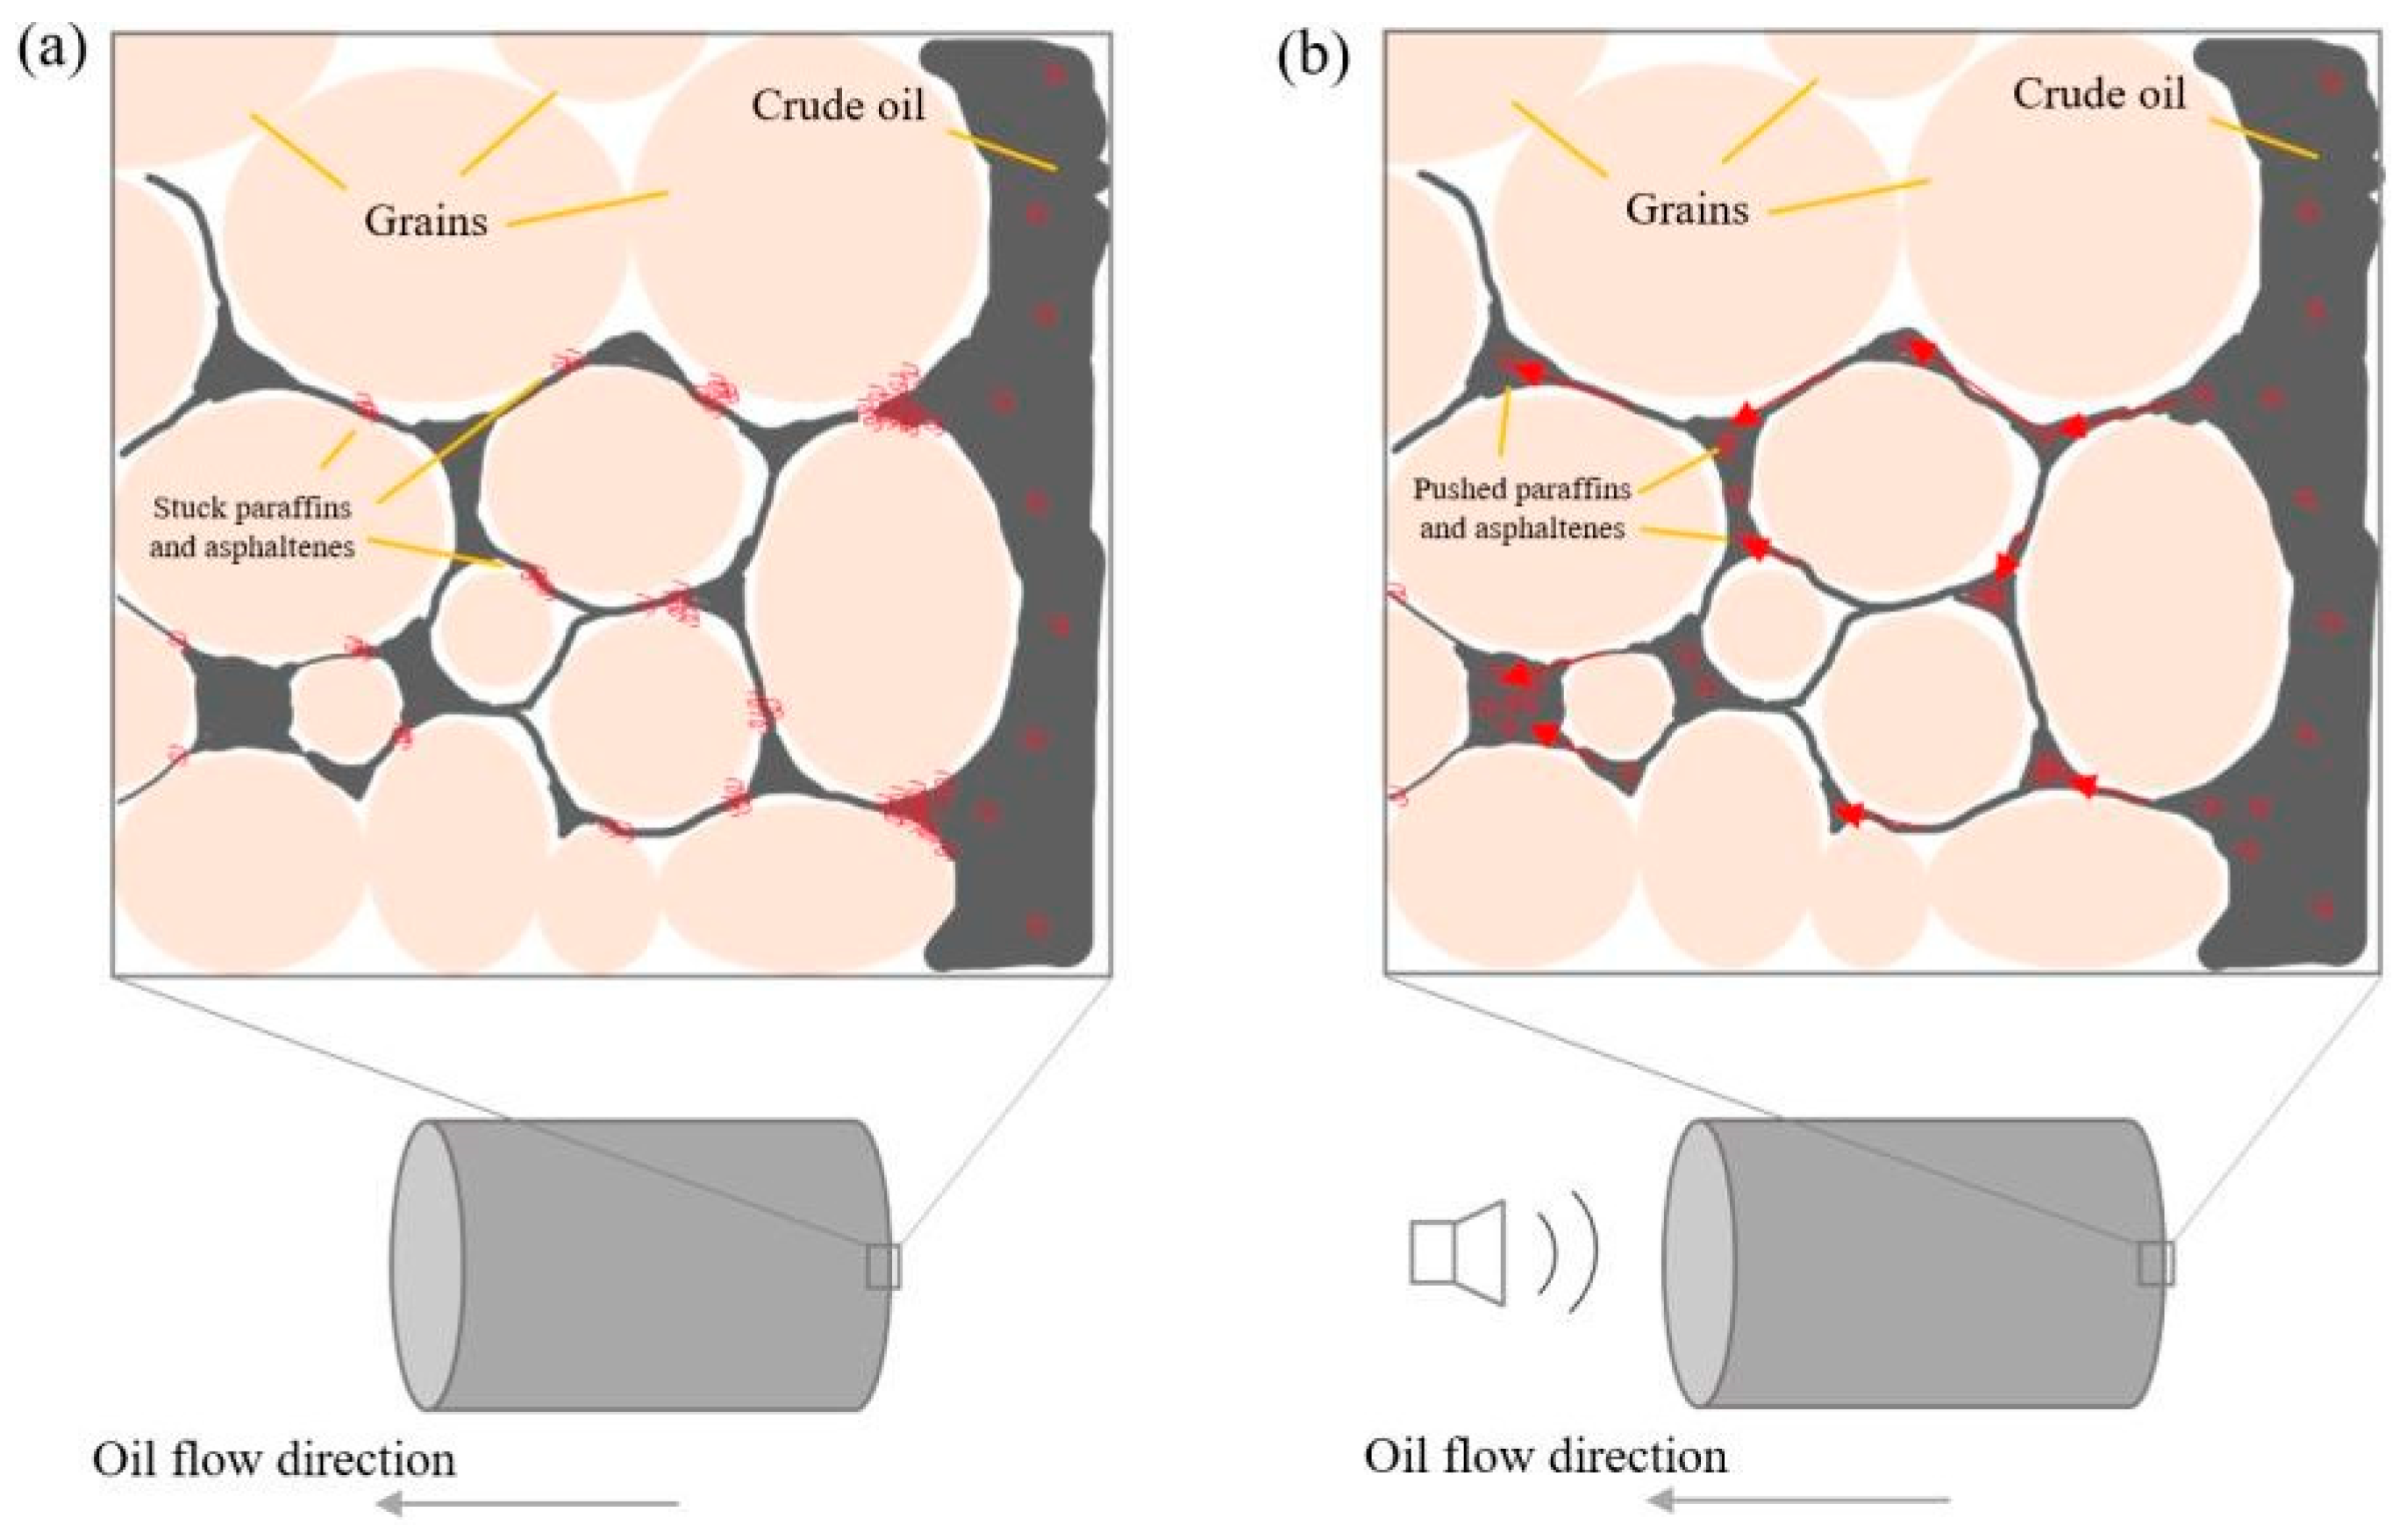
3.3. Model Interpretation
4. Conclusions
- (1)
- The impact of a nonlinear load on the rock, through which crude oil containing paraffins and asphaltenes is filtered, contributes to a change in the permeability coefficient of the rock. In the case of samples of medium and high permeability, when elastic vibrations are activated, the permeability of the rock is restored.
- (2)
- This paper developed the idea that during the filtration of paraffin and asphaltene-containing oil, particles block the pore space and are deposited in pore throats. To unblock the pore space, there is an artificial nonlinear loading, as a result of which an impulse is transferred to the rock sample by elastic vibrations, which leads to a relative displacement of the pore channel wall and paraffin and asphaltene accumulations. Having overcome the force threshold of adhesion of deposits to the wall, with the help of oscillatory acceleration, paraffin and asphaltene particles are torn off and carried away (pushed) further along the channel by the oil flow.
- (3)
- In the case of irreversible deterioration of a part of the permeable channels, the impact of a variable load contributes to postponing the moment of blocking the remaining part of the channels and maintaining the oil flow at a constant level.
- (4)
- The impact of nonlinear loading has no significant effect in the case of already existing strong blockage of permeable channels, high concentrations of paraffins and asphaltenes, or when the wax sizes are comparable to the size of the pore channels (rock of low permeability).
Author Contributions
Funding
Institutional Review Board Statement
Informed Consent Statement
Data Availability Statement
Conflicts of Interest
References
- El-Dalatony, M.M.; Jeon, B.-H.; Salama, E.-S.; Eraky, M.; Kim, W.B.; Wang, J.; Ahn, T. Occurrence and Characterization of Paraffin Wax Formed in Developing Wells and Pipelines. Energies 2019, 12, 967. [Google Scholar] [CrossRef]
- Sousa, A.L.; Matos, H.A.; Guerreiro, L.P. Preventing and removing wax deposition inside vertical wells: A review. J. Petrol. Explor. Prod. Technol. 2019, 9, 2091–2107. [Google Scholar] [CrossRef]
- Jorda, R. Paraffin Deposition and Prevention in Oil Wells. J. Pet. Technol. 1966, 18, 1605–1612. [Google Scholar] [CrossRef]
- Wang, M.; Yang, S.; Li, J.; Zheng, Z.; Wen, J.; Ma, Q.; Wang, Q.; Chen, H. Cold water-flooding in a heterogeneous high-pourpoint oil reservoir using computerized tomography scanning: Characteristics of flow channel and trapped oil distribution. J. Pet. Sci. Eng. 2021, 202, 108594. [Google Scholar] [CrossRef]
- Mandal, A.; Mahto, V.; Purohit, S.; Nihalani, M. Evaluation of synthesized polymeric additives as paraffin inhibitors forwax dissolution in the petroleum reservoir rock. J. Pet. Sci. Eng. 2019, 177, 250–260. [Google Scholar] [CrossRef]
- Leontaritis, K. Asphaltene near-well-bore formation damage modeling. In Proceedings of the SPE Formation Damage Control Conference, Lafayette, LA, USA, 18 February 1998. SPE–39446–MS. [Google Scholar] [CrossRef]
- Newberry, M.; Barker, K. Formation damage prevention through the control of paraffin and asphaltene deposition. In Proceedings of the SPE Production Operations Symposium, Oklahoma City, OH, USA, 10 March 1985. SPE–13796–MS. [Google Scholar] [CrossRef]
- Ariadji, T. Effect of vibration on rock and fluid properties: On seeking the vibroseismic technology mechanisms. In Proceedings of the SPE Asia Pacific Oil and Gas Conference and Exhibition, Jakarta, Indonesia, 5 April 2005; pp. 161–168. [Google Scholar] [CrossRef]
- Poplygin, V.; Qi, C.; Guzev, M.; Kozhevnikov, E.; Kunitskikh, A.; Riabokon, E.; Turbakov, M. Assessment of the Elastic-Wave Well Treatment in Oil-Bearing Clastic and Carbonate Reservoirs. Fluid Dyn. Mater. Process. 2023, 19, 1495–1505. [Google Scholar] [CrossRef]
- Chengzhi, Q.; Guzev, M.; Poplygin, V.V.; Kunitskikh, A.A. Predicting the permeability of the near-bottomhole zone during wave impact. J. Min. Inst. 2022, 258, 998–1007. [Google Scholar] [CrossRef]
- Hamidi, H.; Sharifi, H.A.; Wisdom, O.E.; Rafati, R.; Mohammadian, E.; Azdarpour, A.; Giles, P.W.; Wilhelm, F.P.; Ricardo, S.L.; Cota, N.; et al. Recent applications of ultrasonic waves in improved oil recovery: A review of techniques and results. Ultrasonics 2021, 110, 106288. [Google Scholar] [CrossRef]
- Beresnev, I.; Johnson, P. Elastic-wave stimulation of oil production: A reviewof methods and results. Geophysics 1994, 59, 1000–1017. [Google Scholar] [CrossRef]
- Prachkin, V.; Mullakaev, M.; Asylbaev, D. Improving the productivity of wells by means of acoustic impact on high-viscosity oil in the channels of the face zone of a well. Chem. Pet. Eng. 2015, 50, 571–578. [Google Scholar] [CrossRef]
- Mullakaev, M.; Abramov, V.; Abramova, A. Development of ultrasonic equipment and technology for well stimulation and enhanced oil recovery. J. Pet. Sci. Eng. 2015, 125, 201–208. [Google Scholar] [CrossRef]
- Abaa, K.; Ityokumbul, M.T.; Adewumi, M. Effect of acoustic stimulation on aqueous phase trapping in low-permeability sandstones. J. Energy Resour. Technol. 2017, 139, 062905. [Google Scholar] [CrossRef]
- Zhang, J.; Li, Y. Ultrasonic vibrations and coal permeability: Laboratory experimental investigations and numerical simulations. Int. J. Min. Sci. Technol. 2017, 27, 221–228. [Google Scholar] [CrossRef]
- Pu, C.; Shi, D.; Zhao, S.; Xu, H.; Shen, H. Technology of removing near wellbore inorganic scale damage by high power ultrasonic treatment. Pet. Explor. Dev. 2011, 38, P243–P248. [Google Scholar] [CrossRef]
- Xu, H.; Pu, C. Removal of near-wellbore formation damage by ultrasonic stimulation. Pet. Sci. Technol. 2013, 31, 563–571. [Google Scholar] [CrossRef]
- Taheri-Shakib, J.; Naderi, H.; Salimidelshad, Y.; Kazemzadeh, E.; Shekarifard, A. Resolution limit in community detection. Ultrason. Sonoche. 2018, 40A, 249–259. [Google Scholar] [CrossRef]
- Taheri-Shakib, J.; Naderi, H.; Salimidelshad, Y.; Teymouri, A.; Shekarifard, A. Using ultrasonic as a new approach for elimina tion of inorganic scales (nacl): An experimental study. J. Pet. Explor. Prod. Technol. 2018, 8, 553–564. [Google Scholar] [CrossRef]
- Shi, X.; Xu, H.; Yang, L. Removal of formation damage induced by drilling and completion fluids with combination of ultrasonic and chemical technology. J. Nat. Gas Sci. Eng. 2017, 37, 471–478. [Google Scholar] [CrossRef]
- Khan, N.; Pu, C.; Li, X.; He, Y.; Zhang, L.; Jing, C. Permeability recovery of damaged water sensitive core using ultrasonic waves. Ultrason. Sonochem 2017, 38, 381–389. [Google Scholar] [CrossRef]
- Abad-Guerra, B. Methods for restoring productivity to gas wells in the Clinton sand of Ohio: A laboratory and field experiment. Ph.D. Thesis, Pennsylvania State University, State College, PA, USA, 1979. [Google Scholar]
- Tutuncu, A.; Joha, R. An experimental study for removal of nearwellbore asphaltene deposits using ultrasonics. SEG Tech. Program Expand. Abstr. 2008, 27, 1719–1723. [Google Scholar] [CrossRef]
- Bjorndalen, N.; Islam, M. The effect of microwave and ultrasonic irradiation on crude oil during production with a horizontal well. J. Pet. Sci. Eng. 2004, 43, 139–150. [Google Scholar] [CrossRef]
- Paddock, J.; Islam, M. A new technique for cleaning horizontal wellbores. In Proceedings of the Technical Meeting/Petroleum Conference of The South Saskatchewan Section, Regina, SK, Canada, 17 October 1999. PETSOC–99–98. [Google Scholar] [CrossRef]
- Wang, W.; Liu, D.; Liu, X.; Pan, L. Fuzzy overlapping community detection based on local random walk and multidimensional scaling. Ultrason. Sonochem. 2015, 27, 339–344. [Google Scholar] [CrossRef] [PubMed]
- Roberts, P.; Venkitaraman, A.; Sharma, M. Ultrasonic removal of organic deposits and polymer-induced formation damage. SPE Drill Compl. 2000, 15, 19–24. [Google Scholar] [CrossRef]
- Li, X.; Pu, C.; Chen, X.; Huang, F.; Zheng, H. Study on frequency optimization and mechanism of ultrasonic waves assisting water flooding in low-permeability reservoirs. Ultrason. Sonochem. 2021, 70, 105291. [Google Scholar] [CrossRef]
- Meribout, M. On using ultrasonic-assisted enhanced oil recovery (eor): Recent practical achievements and future prospects. IEEE Access 2018, 6, 51110–51118. [Google Scholar] [CrossRef]
- Mullakaev, M.; Abramov, O.; Abramov, V.; Gradov, O.; Pechkov, A. An ultrasonic technology for productivity restoration in low-flow boreholes. Chem. Pet. Eng. 2009, 45, 203–210. [Google Scholar] [CrossRef]
- Otumudia, E.; Hamidi, H.; Jadhawar, P.; Wu, K. Effects of reservoir rock pore geometries and ultrasonic parameters on the removal of asphaltene deposition under ultrasonic waves. Ultrason. Sonochem. 2022, 83, 105949. [Google Scholar] [CrossRef]
- Rezaei, D.R.; Mohebbi, A.; Riazi, M.; Niakousari, M. Experimental investigation on the effect of ultrasonic waves on reducing asphaltene deposition and improving oil recovery under temperature control. Ultrason. Sonochem. 2022, 45, 204–212. [Google Scholar] [CrossRef]
- Riabokon, E.; Gladkikh, E.; Turbakov, M.; Kozhevnikov, E.; Guzev, M.; Popov, N.; Kamenev, P. Effects of ultrasonic oscillations on permeability of rocks during the paraffinic oil flow. Géotechnique Lett. 2023, 13, 151–157. [Google Scholar] [CrossRef]
- Riabokon, E.; Kazantsev, A.; Gladkikh, E.; Turbakov, M. Development of an experimental set-up for studying the effect of elastic oscillations on fluid flow through rocks. IOP Conf. Ser. Earth Environ. Sci. 2022, 1021, 012016. [Google Scholar] [CrossRef]
- API. Recommended Practices for Core Analysis: Recommended Practice 40; API Publishing Services: Washington, DC, USA, 1988. [Google Scholar]
- Nikolaevsky, V.; Basniev, K.; Gorbunov, A.; Zotov, G. Mechanics of Porous Saturated Media; Nedra: Moscow, Russia, 1988. [Google Scholar]
- Riabokon, E.; Poplygin, V.; Turbakov, M.; Kozhevnikov, E.; Kobiakov, D.; Guzev, M.; Wiercigroch, M. Nonlinear young’s modulus of new red sandstone: Experimental studies. Acta Mech. Solida Sin. 2021, 34, 989–999. [Google Scholar] [CrossRef]
- Darcy, H. 1856. Henry Les Fontaines Publiques De La Ville De Dijon. Exposition Et Application Des Principes à Suivre Et Des Formules à Employer Dans Les Questions De Distribution D’eau: Ouvrage Terminé ParUn Appendice RelatifAux Fournitures D’eau De PlusieursVillesAu Filtrage Des Eaux Et à La Fabrication Des Tuyaux De Fonte, De Plomb, De Tole Et De Bitume. Editor: Dalmont, V., Paris, 647p. Available online: https://gallica.bnf.fr/ark:/12148/bpt6k624312/f1n657.pdf (accessed on 26 October 2023).
- Kozhevnikov, E.; Turbakov, M.; Gladkikh, A.; Riabokon, E.; Poplygin, V.; Guzev, M.; Qi, C.; Kunitskikh, A. Colloid migration as areason for porous sandstone permeability degradation during coreflooding. Energies 2022, 15, 2845. [Google Scholar] [CrossRef]
- Kozhevnikov, E.; Turbakov, M.; Riabokon, E.; Gladkikh, E. Apparent permeability evolution due to colloid migration under cyclic confining pressure: On the example of porous limestone. Transp. Porous Media 2023, 1–24. [Google Scholar] [CrossRef]
- Leontaritis, K.; Amaefule, J.; Charles, R. A systematic approach for the prevention and treatment of formation damage caused by asphaltene deposition. SPE Prod Fac. 1994, 9, 157–164. [Google Scholar] [CrossRef]
- Warth, A. The Chemistry and Technology of Waxes, 2nd ed.; Reinhold Publishing: New York, NY, USA, 1956. [Google Scholar]


| Mineral | Share on X-ray Diffraction | Share on Microscopic Analysis |
|---|---|---|
| Quartz | 91.8% | 92% |
| Potassium feldspar | 6.6% | 3% |
| Quartzite debris | - | 4% |
| Kaolinite | 1.6% | 1% |
| Parameter | 224-24-14 | 224-14-14 | 224-3-14 |
|---|---|---|---|
| Lithology | Sandstone | Sandstone | Sandstone |
| Permeability, mD | 117 | 606 | 35 |
| Porosity, % | 16.9 | 17.5 | 16.7 |
| Pore volume, cm3 | 3.7 | 3.8 | 3.6 |
| Plug size, mm | ⌀30 l30 | ⌀30 l30 | ⌀30 l30 |
| ω, kHz | tan β | angle β | k0, mD | Δk, mD | % |
|---|---|---|---|---|---|
| 40 | 0.87 | 41 | 24 | 2.2 | 8.4 |
| 20 | 0.13 | 7.4 | 24 | 1 | 4 |
| 28 | 2.22 | 65.8 | 24 | 4 | 14 |
| tb, min | kb…ka, mD | Δk, mD | ω, kHz |
|---|---|---|---|
| 9 | from 52 to 62 | 10 | 20 |
| 12 | from 48 to 61 | 13 | 20 |
| 15 | from 40 to 58 | 18 | 20 |
| tb, min | kb…ka, mD | Δk, mD | ω, kHz |
|---|---|---|---|
| 19 | from 33 to 45 | 12 | 28 |
| 4 | from 30 to 40 | 10 | 20 |
Disclaimer/Publisher’s Note: The statements, opinions and data contained in all publications are solely those of the individual author(s) and contributor(s) and not of MDPI and/or the editor(s). MDPI and/or the editor(s) disclaim responsibility for any injury to people or property resulting from any ideas, methods, instructions or products referred to in the content. |
© 2023 by the authors. Licensee MDPI, Basel, Switzerland. This article is an open access article distributed under the terms and conditions of the Creative Commons Attribution (CC BY) license (https://creativecommons.org/licenses/by/4.0/).
Share and Cite
Riabokon, E.; Gladkikh, E.; Turbakov, M.; Kozhevnikov, E.; Guzev, M.; Yin, Q. The Effect of Ultrasonic Alternating Loads on Restoration of Permeability of Sedimentary Rocks during Crude Paraffinic Oil Flow. Appl. Sci. 2023, 13, 11821. https://doi.org/10.3390/app132111821
Riabokon E, Gladkikh E, Turbakov M, Kozhevnikov E, Guzev M, Yin Q. The Effect of Ultrasonic Alternating Loads on Restoration of Permeability of Sedimentary Rocks during Crude Paraffinic Oil Flow. Applied Sciences. 2023; 13(21):11821. https://doi.org/10.3390/app132111821
Chicago/Turabian StyleRiabokon, Evgenii, Evgenii Gladkikh, Mikhail Turbakov, Evgenii Kozhevnikov, Mikhail Guzev, and Qian Yin. 2023. "The Effect of Ultrasonic Alternating Loads on Restoration of Permeability of Sedimentary Rocks during Crude Paraffinic Oil Flow" Applied Sciences 13, no. 21: 11821. https://doi.org/10.3390/app132111821
APA StyleRiabokon, E., Gladkikh, E., Turbakov, M., Kozhevnikov, E., Guzev, M., & Yin, Q. (2023). The Effect of Ultrasonic Alternating Loads on Restoration of Permeability of Sedimentary Rocks during Crude Paraffinic Oil Flow. Applied Sciences, 13(21), 11821. https://doi.org/10.3390/app132111821