Article

Reliability Evaluation Method of Multi-Voltage Levels Distribution System Considering the Influence of Sense-Control Terminal Faults

1
Power Grid Planning Center of Guangdong Power Grid Co., Ltd., Guangzhou 510000, China
2
The School of Electrical and Information Engineering, Tianjin University, Tianjin 300072, China
3
Key Laboratory of Smart Grid of Ministry of Education, Tianjin University, No. 92 Weijin Road, Tianjin 300072, China
*
Author to whom correspondence should be addressed.
Appl. Sci. 2023, 13(21), 11761; https://doi.org/10.3390/app132111761
Submission received: 24 August 2023 / Revised: 14 October 2023 / Accepted: 19 October 2023 / Published: 27 October 2023

Abstract

:
With the existing reliability evaluation methods, it is difficult to realize the overall evaluation of multi-voltage levels distribution systems, and sense-control terminal faults are not considered in the process of reliability evaluation. Therefore, a reliability evaluation method for multi-voltage levels distribution networks considering the influence of the fault of the sensing and control terminal is proposed. Firstly, based on the component reliability model, system state selection method, and reliability index, a reliability evaluation method for distribution networks considering sense-control terminal faults has been proposed. Secondly, the features of a multi-voltage levels distribution network are analyzed. The sequential Monte Carlo simulation method and the failure mode effects analysis method are combined, and a collaborative evaluation method for power supply reliability of multi-voltage levels distribution systems is proposed. Eventually, the effectiveness of the proposed method is proved by an example comparison, and the impact of the terminal fault on the reliability of distribution network is analyzed. The reliability evaluation results can provide technical support for the planning of the distribution network.

1. Introduction

The power supply reliability of the distribution network runs through the whole process of power grid planning, involvement, and operation. The power supply reliability evaluation result is an important basis for formulating the system construction and operation scheme [1]. The multi-voltage levels distribution network covers two voltage levels: medium voltage and low voltage. It is an important component of power distribution and supply to end users and has the most direct impact on users’ electricity consumption. However, due to the great difference between medium and low-voltage distribution networks in the power supply range and the grid structure, the traditional sequential evaluation method is inconvenient for analyzing the weak links of the low-voltage distribution system. Therefore, it is urgent to propose a multi-voltage levels distribution system reliability evaluation method that can accurately evaluate the power supply capacity of the low-voltage distribution system and then guide the reliability management of the distribution system.
At the same time, with improvement of informatization and automation, smart grid has become the development direction of the current distribution network step by step [2,3], and provides a new path to improve the reliability of the distribution network. By configuring sense-control terminal equipment on switch equipment, the information communication is involved in the fault processing process, which can effectively reduce the outage time of the load. However, faults of the sense-control terminal will lead to the failure of the sensing and control ability of the distribution network [4]. If the sense-control terminal malfunctions and cannot perform the normal automation functions of fault location, isolation, and load transfer in the event of primary equipment malfunction, the efficiency of fault handling will be reduced and the power outage time will be extended. Therefore, the reliability evaluation method, considering the influence of the fault of the sense-control terminal, can reflect the real situation of the reliability of the distribution network.
At present, there are few studies on the reliability evaluation of multi-voltage levels distribution networks. The existing work mainly focuses on the exploration of reliability evaluation methods for a low-voltage distribution system and the construction of an index system. Based on the load characteristics and the operation mode of the low-voltage distribution network, the reliability evaluation indices are established at the three levels of equipment, users, and system in Reference [5], so as to realize a comprehensive evaluation of the reliability. In Reference [6], the reliability index of low-voltage power users in the area to be evaluated is calculated by establishing the sub-region model of the distribution network and using probability and statistics theory to extract the power outage information of some power users. In Reference [7], a new statistical index system is established, and the statistical index formula and statistical boundary conditions are defined so as to realize the reliability analysis of low-voltage distribution networks. The literature in [8] set up an evaluation index system based on the user’s power consumption characteristics and demand. The proposed multi-voltage comparison index can reflect the difference in the reliability level of the line between medium- and low-voltage users and highlight the reason why low-voltage distribution networks affect the reliability of electricity. The above literature expands the scope of reliability statistics and statistical indicators and supplements the evaluation methods of reliability. However, few studies have proposed reliability evaluation methods that take into account multi-voltage levels.
The wireless sensor is one of the necessary pieces of equipment for building a smart grid system. Its reliability is directly related to the reliability and safety of the system. In [9], the reliability of wireless sensor networks is analyzed by considering random failures, energy consumption, and environmental randomness, and their calculation methods are provided based on the algebraic graph theory and Monte Carlo simulations. In the analysis of the influence of the sense-control terminal on reliability, we need to consider the influence of the sense-control terminal on the fault handling process. In Reference [10], by introducing the state factor of switch automation, the traditional failure mode consequence analysis method is improved, and the importance of the sense-control terminal in the improvement of the power supply reliability of the distribution network is verified by an actual example. In Reference [11], the model of an integrated distribution system is established by the fault tree method, which illustrates the impact of substations on the primary distribution system under various automation configurations. However, due to the massive distribution of low-voltage power supply stations, the reliability evaluation model is difficult to apply to the reliability analysis of low-voltage distribution networks. In Reference [12], the influence of the sense-control terminal on the fault outage time is analyzed, and the reliability calculation model considering the location time in the fault section is established. Based on the component failure rate curve, the reliability index of the distribution network is calculated under different distribution terminal configuration schemes, and the whole equipment life cycle is considered [13].
Existing research has shown that cyber system failures can have a significant impact on the reliability of distribution networks. Although relevant literature has included consideration of sense-control terminals, the impact of sensing terminal failure on the reliability of the distribution network has not been studied. At the same time, the voltage level involved in the reliability assessment of distribution networks is mostly a single voltage level; the reliability assessment of medium and low voltage levels has not been studied.
The main contributions of this paper are twofold.
(1) The impact of sensing terminal failure on reliability is considered in this paper. We analyze the influence of the fault of the sense-control terminal on the outage time and the outage range from the three stages of fault location, fault isolation, and power restoration. Meanwhile, the fault influence table of the sense-control terminal is established.
(2) Compared to the pioneer work, we present a reliability evaluation method enable to realize the overall evaluation of medium and low voltage levels. According to the features of the distribution network, the sequential Monte Carlo simulation method and the failure mode effects analysis method have been proposed.

2. Distribution Network Reliability Evaluation Method

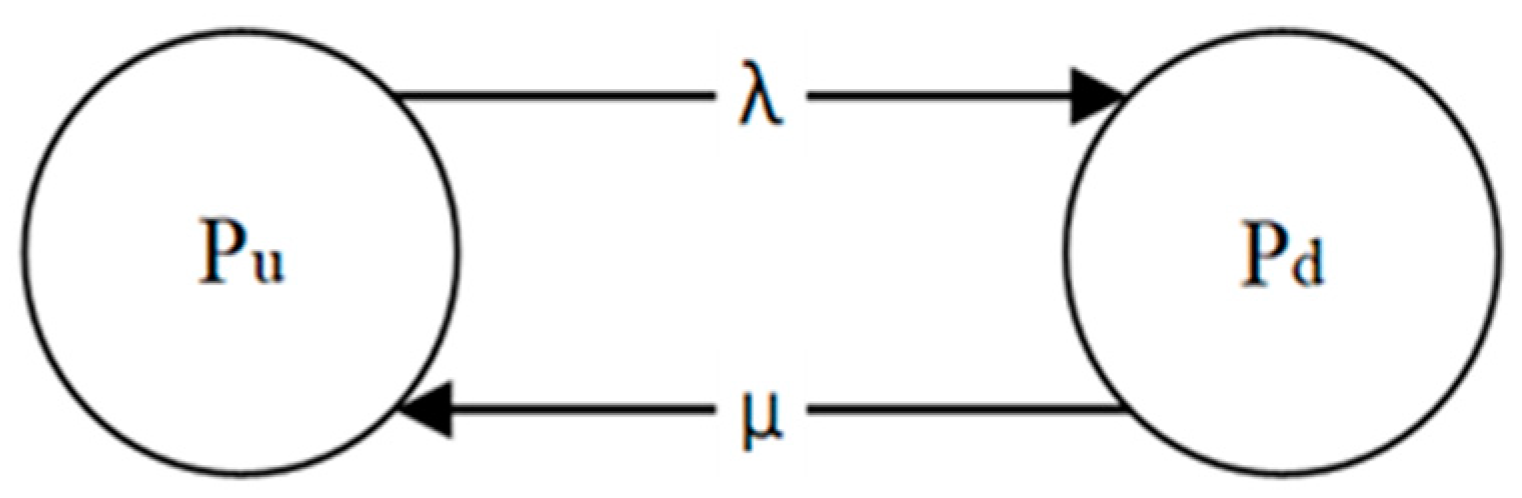
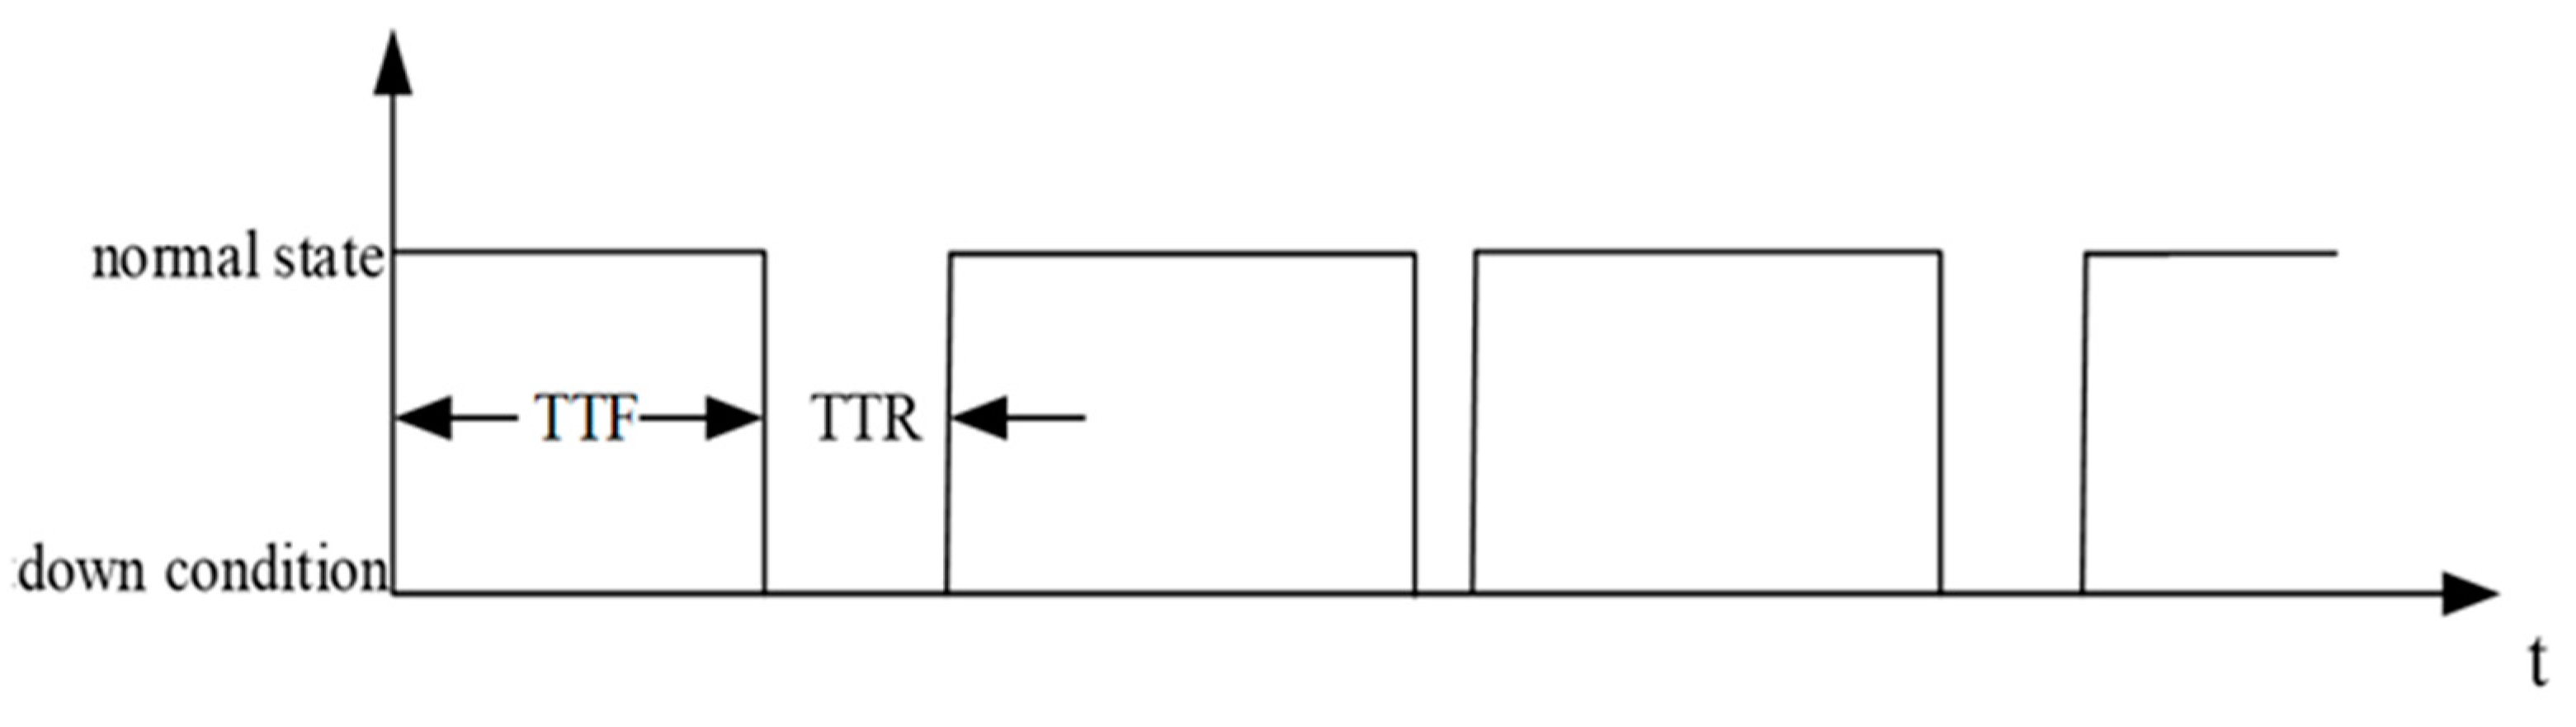
2.1. Component Modeling

(1) Information and physical component outage model
In the reliability evaluation of the distribution network considering the sense-control terminal, it is necessary to model the information element and the physical element, respectively. Among them, the information components are various inductive control terminal devices, and the physical components include feeders, switches, and distribution transformers. For the sense-control terminal components and physical components, the two-state Markov model can be used for the fault outage model of both [14]. The two states include the normal working state and the fault outage state. The failure rate of the component is λ and the repair rate is μ; the two-state model of the component is established as follows: Figure 1 shows the state probability and transition probability of the components in the two-state model.
The probability of fault repair state is:
P u = λ λ + μ
The probability of normal operating state is:
P d = μ λ + μ
(2) Load curve model
In order to consider the impact of load time series characteristics on the reliability of distribution systems, this paper introduces the time series value of load, which is more in line with the actual power outage situation in reliability analysis, making the simulation results closer to the real value. The typical load model is used to calculate real-time load Lt at fault time t by using the annual–week, weekly–day, and daily–hour load curves.
L t = L p × P w × P d × P h ( t )
In the formula, Lp is the annual peak load, Pw is the ratio of the weekly peak load to the annual peak load corresponding to the week at the fault time, Pd is the ratio of the daily peak load to the weekly peak load corresponding to the day at the fault time, and Ph(t) is the ratio of the hourly load to the daily peak load corresponding to the fault time.

2.2. System State Selection

Based on the sequential Monte Carlo simulation method [15], this paper realizes the selection of system states. The method samples the states of the components through the random numbers generated by the computer and then combines them to obtain the state of the whole system. This method has obvious advantages in solving medium and low-dimensional complex problems. When using the Monte Carlo method to evaluate the reliability, it mainly uses computers to generate random numbers to randomly sample component failure events so as to calculate the reliability index.
Based on the two-state Markov model of the component, it is assumed that both the running time and the repair time of the component are exponentially distributed [16]. The normal working time TTF and fault repair time TTR of the component are obtained as follows:
T T F = 1 λ ln R 1
T T R = 1 μ ln R 2
R1 and R2 are both random numbers between [0, 1].
By sampling the TTF and TTR of all components in the system, the system state sequence shown in Figure 2 can be obtained.

2.3. Reliability Index Calculation

Based on the system reliability index, this paper evaluates the power supply reliability of a medium and low power level distribution system. The system reliability index is as follows: SAIFI (System Average Interruption Frequency Index), SAIDI (System Average Interruption Duration Index), ASAI (Average Service Availability Index), and ENS (Energy Not Supplied) are specific as follows.
S A I F I = i λ i N i i N i
S A I D I = i N i U i i N i
A S A I = 8760 i N i i U i N i 8760 i N i
E N S = L i U i
where Ni is the number of users of load point i, and λi is the failure rate of load point i. Ui is the annual average outage time of load point i, and Li is the average load (kW) of load point i.

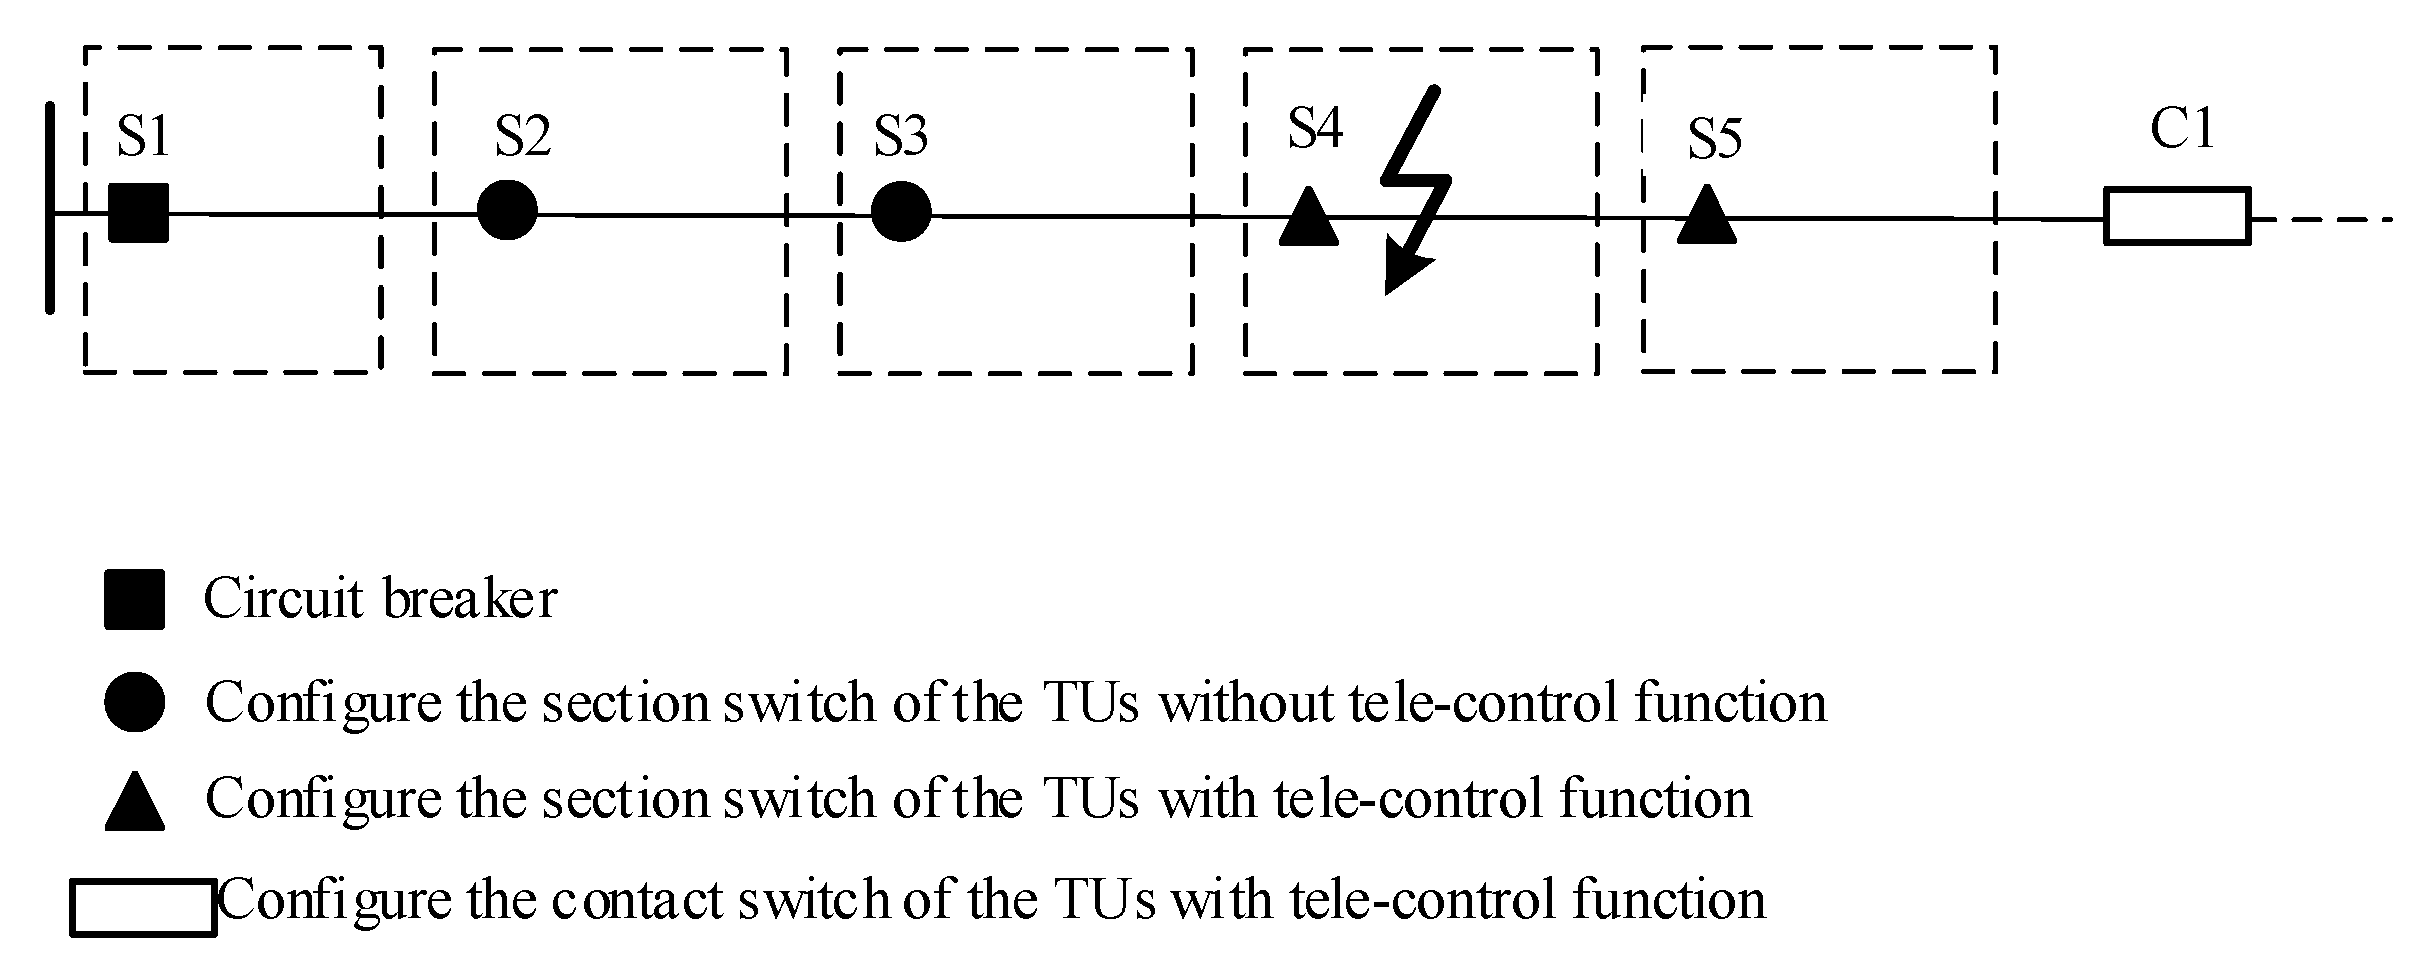
2.4. Fault Impact Analysis

The distribution automation sensing and control terminal is mainly divided into two types: TUs without tele-control function terminals and TUs with tele-control function terminals. The TUs without tele-control function distribution terminal only have the functions of telemetry and remote communication and have the functions of current telemetry and information reporting, which has little effect on the improvement of power supply reliability. The TUs with tele-control function distribution terminal have the functions of telemetry, remote communication, and remote control, which can realize the automatic control of the disconnector and then quickly isolate the fault area, effectively improving the power reliability.
Based on the three stages of fault handling (fault location, fault isolation, and power restoration), this section analyzes the consequences of the fault of the sense-control terminal. Firstly, the composition of fault handling time is defined. Secondly, based on the whole process of fault handling, the influence of sensing terminal faults on fault partition and outage time is analyzed in detail.
(1) Fault Handling Time
The fault processing time T includes fault location time t1, fault isolation time t2, load transfer time t3, and fault repair time t4, specifically:
T = t 1 + t 2 + t 3 + t 4
Fault location time t1
It includes the time when the TUs without tele-control function terminal or the TUs with tele-control function terminal upload the fault information and the time when the master station determines the fault area.
Fault isolation time t2
Including automatic isolation time t2,r and manual isolation time t2,s.
The automatic isolation time is the time for the staff to remotely control the segmented switch with the TUs with tele-control function terminal. The manual isolation time is the time when maintenance personnel arrive at the scene to manually isolate the fault.
Load transfer time t3
Including automatic transfer time t3,r and manual transfer time t3,s.
The automatic transfer time is the time when the staff remotely controls the contact switch equipped with the TUs with tele-control function terminal downstream of the fault isolation area. The manual transfer time is the time when maintenance personnel manually close the contact switch.
Fault repair time t4
Time for the maintenance personnel to repair the fault on site.
(2) Analysis of the influence of fault mode considering the fault of sense-control terminal
The application of the sense-control terminal effectively improves the automation level of the system, which is conducive to improve the safety of the distribution network’s operation and the reliability of the power supply. However, in the actual operation of the distribution network, the fault of the sense-control terminal component may lead to the wrong location of the fault area, which will lead to the expansion of the power outage area, which will not be conducive to the reliable operation of the distribution network. Therefore, it is necessary to consider the impact of terminal equipment failure on the reliability.
In the actual medium-voltage distribution network, due to the consideration of investment and construction costs, the TU with tele-control function terminal equipment is usually only installed at the important load point, while the sensing and control terminals at other load points are the TUs without tele-control function terminal equipment. Because only the TUs with tele-control function equipment have the function of automatic fault isolation, the impact of different types of terminals on the outage time is different, and the reliability evaluation of multi-voltage levels distribution network needs to be discussed separately.
This paper will discuss the influence that results after the failure of the sense-control terminal in three stages.
(1) Fault location
The current sensing terminal usually uses the differential analysis method to locate the fault and determine the fault area according to the distribution of fault current. If there is only fault current inflow but no fault current outflow in a region, the fault is determined to be located in the region. The fault current flow direction is from the power supply end to the fault point. The sensing terminal detects the fault information and reports it to the distribution master station. The master station determines the fault area according to the fault information. If the sensing terminal has a communication failure, it may lead to an error in the location of the fault area.
Taking Figure 3 as an example, when the line between switches S4 and S5 fails, switches S1, S2, S3, and S4 all flow through the fault circuit, and the sense-control terminal on the switch S5 does not detect the fault current inflow; then, the fault area can be determined to be S4 and S5. At this time, if the sensing terminal installed on the switch S4 fails and the fault information cannot be reported, the fault area will be located between S3 and S4.
(2) Fault isolation
On the basis of fault location, the feeder is divided into fault upstream area, fault downstream area, and fault area by a segmented switch. The power failure time of the upstream area of the fault depends on the type of sensing and control terminal configured by the inlet switch and the inlet switch of the fault area: if the inlet switch of the upstream area of the fault or the fault area is only configured with the TUs without tele-control function terminal, the power failure time is the manually isolated fault time t2,s; if the inlet switch of the fault upstream area and the inlet switch of the fault area are configured with the TUs with tele-control function terminal, the outage time is the automatic fault isolation time t2,r. The outage time of the downstream isolation area is related to the load transfer time, and the specific outage time is analyzed in the power restoration stage.
The range of the fault isolation area depends on the result of the fault location. If the fault location is correct, the effective isolation of the fault area can be realized, and the power outage range can be reduced. If the fault location is wrong, it will lead to the expansion of the fault outage area.
Taking Figure 4 as an example, if the sense-control terminal on the switches S4 fails, the fault area will be located between the switch S3 and S4, so the switches S3 and S4 are disconnected, and the fault feeder segment is not effectively isolated. Since the fault area and the non-fault area are still connected, when the closed contact switch C1 is used for load transfer, the sense-control terminal on the switch S5 will still detect the fault current. At this time, the switch S5 is disconnected, and the power outage area is expanded to the line range between S3 and S5. The final power restoration area is shown in Figure 5.
(3) Power restoration
During power restoration stage, it is necessary to close the contact switch to transfer the load to the downstream area of the fault. The power restoration time depends on the type of the sense-control terminal configured by the inlet switch and the contact switch in the fault downstream area. The outage time of the fault downstream area is the fault isolation time t2 and the load transfer time t3. If the contact switch is not configured with the sense-control terminal or is only configured with the TUs without tele-control function terminal, the load transfer time is the manual on-site operation load transfer time t3,s; if the inlet switch of the fault downstream area is configured with the TUs with tele-control function terminal, the load transfer time is the automatic load transfer time t3,r.
(4) Considering the reliability analysis process of sense-control terminal fault
Based on the above reliability analysis of the fault of the sense-control terminal, this paper establishes the fault influence table of the sense-control terminal Table 1. The specific values of t2, t3 and t4 in the table depend on the type of sense-control terminal configured by the sectional switch and the contact switch.
Although the outage time of the fault upstream area and the fault area is the same in both cases, the range of the fault area will expand and the range of the fault upstream area will decrease in the case of a fault location error. At the same time, due to the fault location error, two fault isolation and load transfer operations are required to isolate the fault area. Therefore, the outage time of the fault downstream area is the sum of the fault location time, the two fault isolation times, and the two load transfer times (t1 + 2t2 + 2t3).

3. Reliability Collaborative Evaluation Method of Multi-Voltage Levels Distribution Network Considering the Fault of Sense-Control Terminal

3.1. Necessity Analysis of Reliability Collaborative Evaluation of Multi-Voltage Levels Distribution Network

The traditional way to evaluate the influence of distribution system faults on the reliability of low-voltage users is to use the sequential evaluation method, that is, to evaluate the reliability of the medium-voltage distribution network first and then the reliability of the low-voltage distribution network. The specific idea is to first evaluate the network system from the 10 kV bus of the step-down substation through the medium-voltage distribution line to the low-voltage distribution transformer. Considering the failure rate and repair time of the main components of the medium-voltage distribution network, such as feeders (overhead lines, cables), circuit breakers, fuses, disconnectors, distribution transformers, etc., the failure rate, annual average outage time, and repair time of the entire medium-voltage distribution network are calculated. Then, the calculated system reliability parameters are taken as the basic information of the low-voltage distribution network structure, that is, the reliability parameters of the 10 kV low-voltage public distribution transformer in the low-voltage distribution network, and then combined with the reliability parameters of the low-voltage bus in the low-voltage distribution network, the reliability index of each low-voltage user and the reliability index of the low-voltage distribution network are calculated.
The reliability index of low-voltage distribution networks obtained by the above-mentioned sequential evaluation method of multi-voltage levels distribution networks cannot fully reflect the influence of medium-voltage distribution network faults on the reliability of low-voltage distribution networks. Because the reliability parameters input from the medium-voltage distribution network to the low-voltage distribution network are the average reliability parameters of all 10 kV low-voltage public distribution transformers, the reliability parameters of the distribution transformers at the weak links in the medium-voltage distribution network are weakened, which cannot reflect their impact on the reliability of low-voltage users, which is not conducive to the power grid company’s formulation of effective improvement measures. Therefore, it is necessary to carry out a collaborative evaluation of the power supply reliability of the multi-voltage levels distribution network. Collaborative evaluation can fully consider the impact of each 10 kV low-voltage public distribution transformer on the distribution transformer area, and the calculated average reliability index can better reflect the actual system reliability.
Additionally, with the gradual popularization of sensing terminals, the distribution network will have the ability to count the outage information of all power supply users in the region. Therefore, it is of great importance to consider the reliability evaluation of a multi-voltage levels distribution network with sensing and control terminals. At the same time, because the sense control-terminal also has the risk of failure, it is necessary to consider the impact of the sense-control terminal failure on the reliability of the distribution network so that the reliability evaluation result is closer to the actual operation.

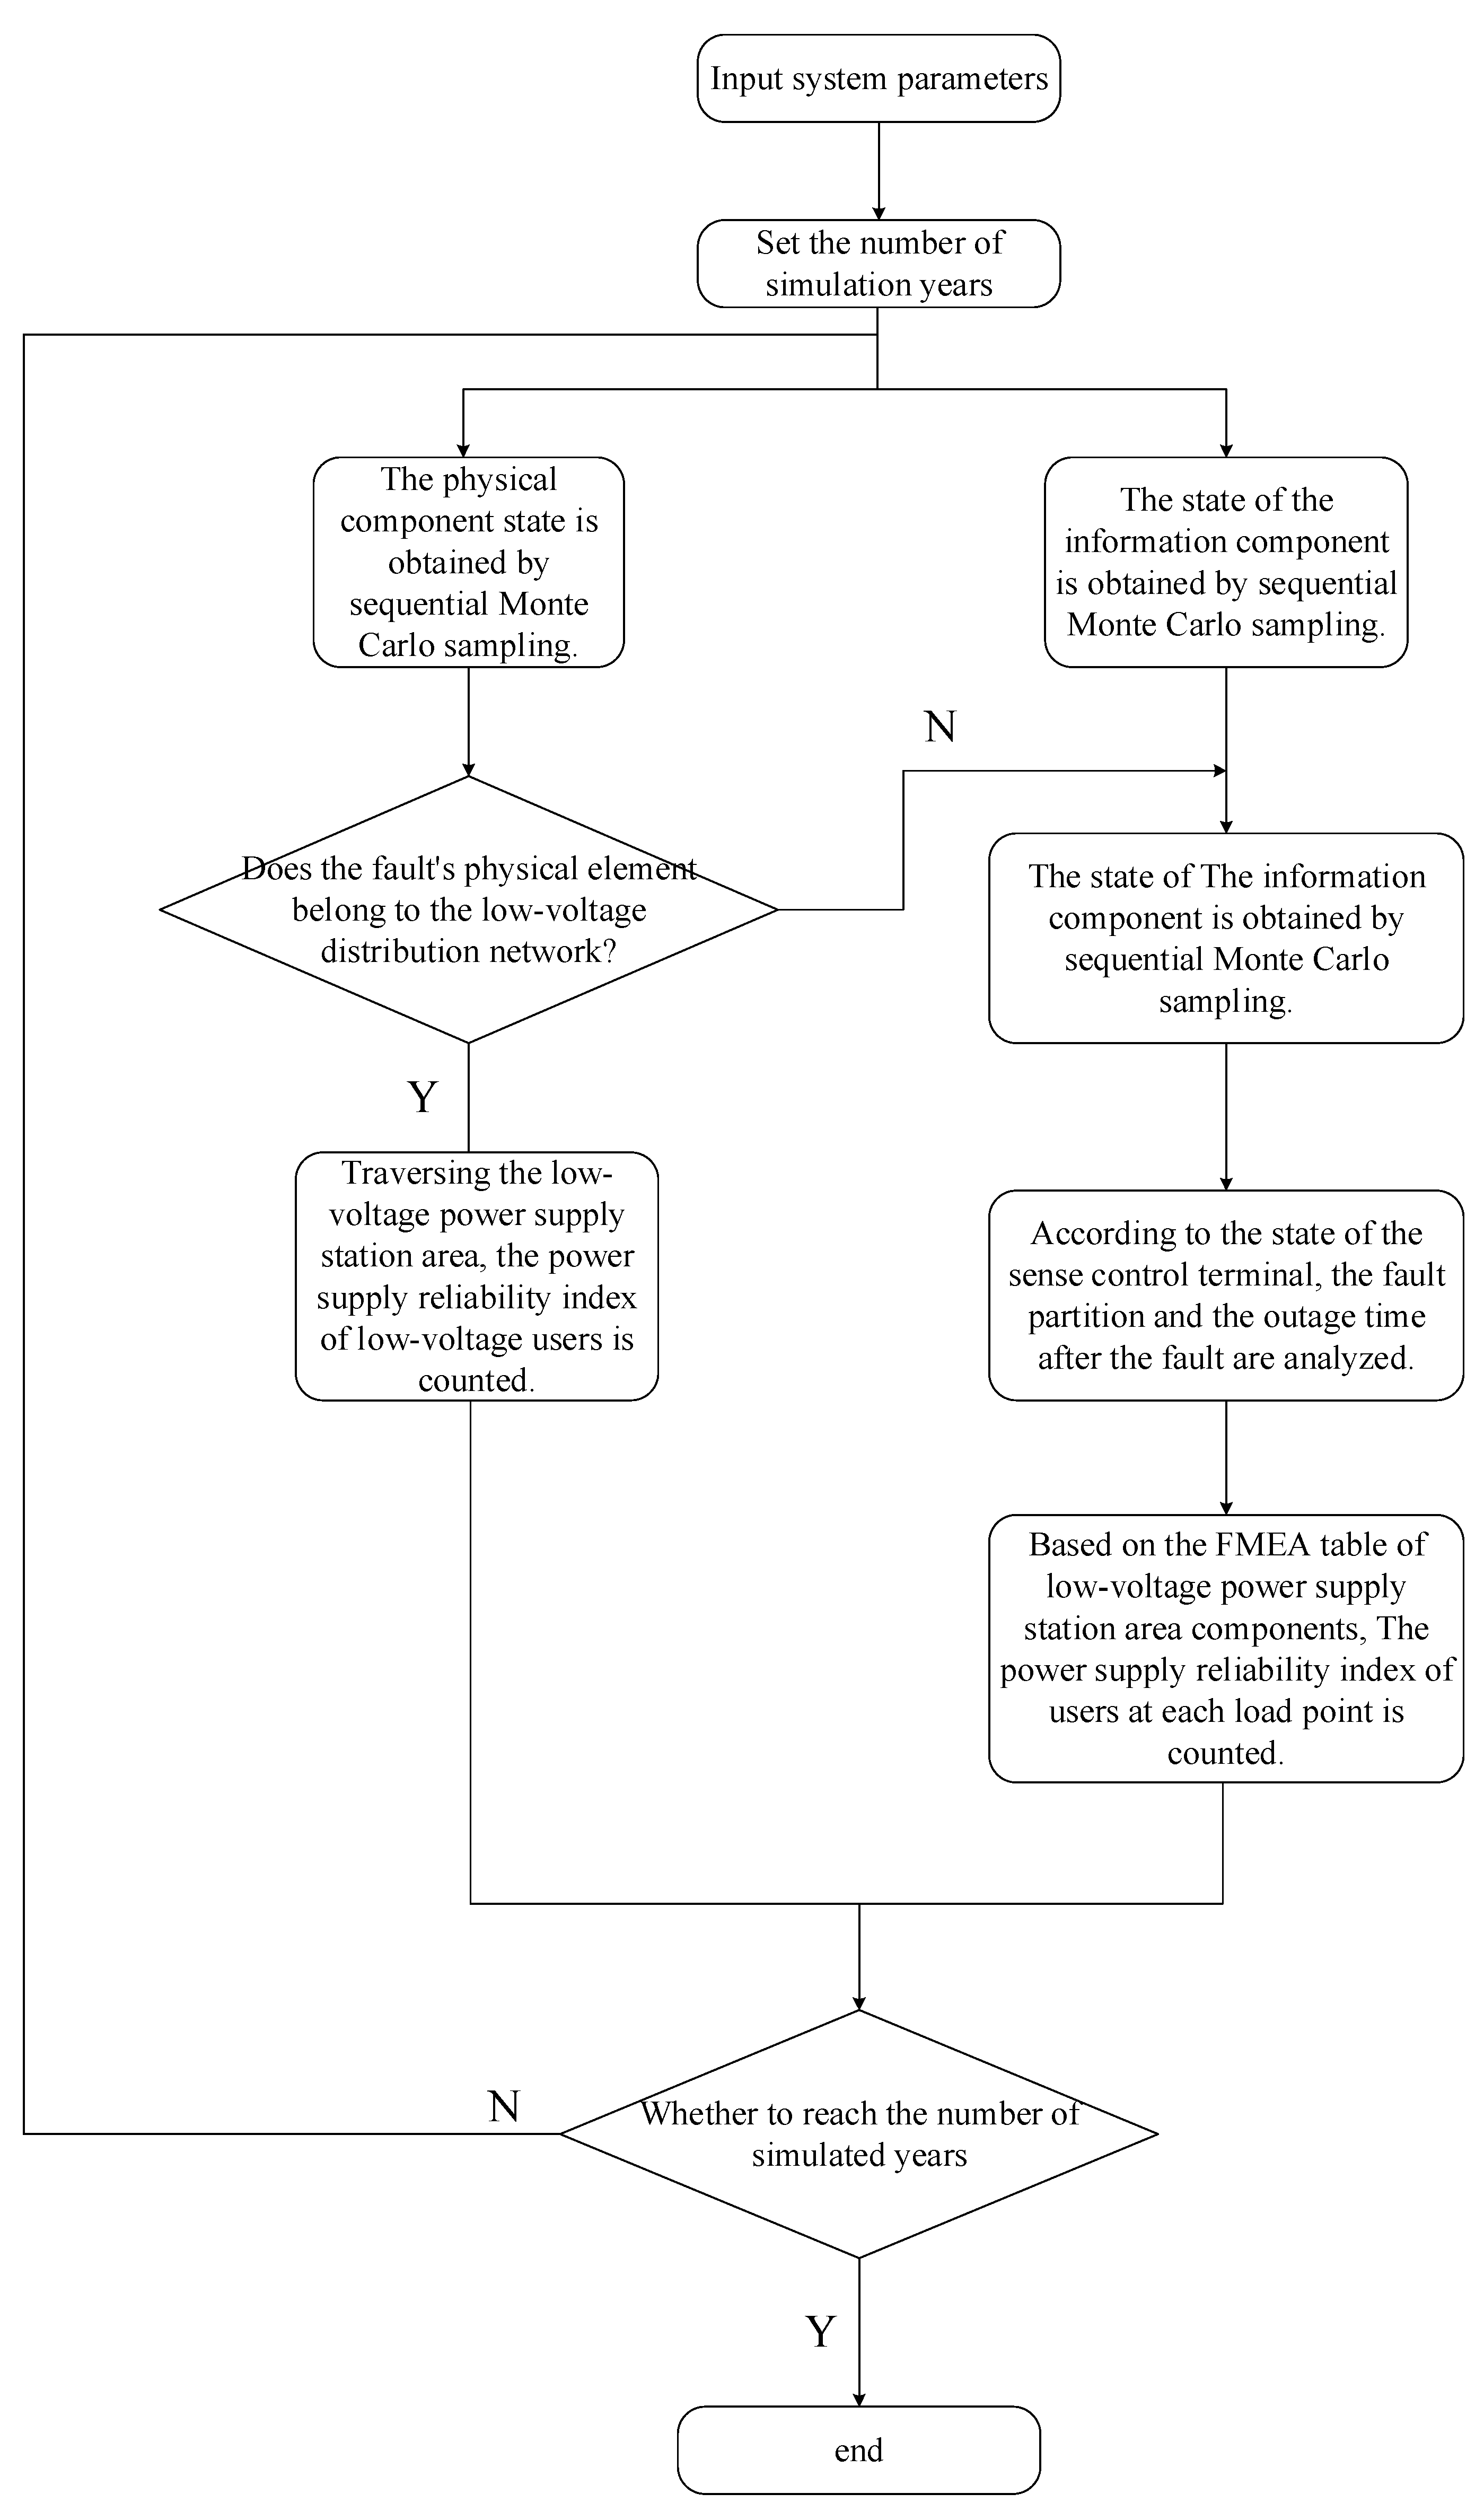
3.2. Collaborative Evaluation Method for Reliability of Multi-Voltage Levels Distribution System

The multi-voltage levels distribution system studied in this paper refers to the network structure between the outlet end of a 10 kV medium-voltage distribution line and low-voltage users, including the 10 kV medium-voltage distribution line, distribution transformer, and low-voltage distribution network. A distribution transformer is the key component connecting medium and low-voltage distribution networks. The secondary side outlet of the distribution transformer is not only the end of the power supply reliability evaluation of medium-voltage distribution networks but also the beginning of the power supply reliability evaluation of low-voltage distribution networks. Therefore, this paper divides the multi-voltage levels distribution system into the following two layers: the medium-voltage distribution system and the low-voltage distribution system [17].
The specific method of collaborative evaluation analyzes the impact of the load point caused by the failure of each component and sense-control terminal in medium-voltage distribution, substitutes the reliability parameters of the fault component, quantitatively calculates the influence results, and then counts the results to obtain a reliability index.
Then, in a low-voltage distribution system it takes the reliability index of the load point as one of the input parameters, analyzes the influence of the user power supply caused by the fault of each component, calculates the reliability index of the user power supply under each distribution transformer, makes statistics and a weighted average of the results, and then obtains the average power supply reliability index of the multi-voltage levels distribution systems.
The failure mode and effect analysis (FMEA) method is used to analyze the influence of low-voltage distribution system failure, and the failure mode and effect analysis table (FMEA table) is established to analyze the influence of component failure at different positions on the power outage time caused by load points at different positions. When the network structure is radial, the process of establishing the FMEA table for a single component fault is not complicated. At the same time, the fault mode impact analysis table can be quickly formed by combining the fault diffusion method, which makes the rapid calculation of the reliability index easier.
The reliability collaborative evaluation framework for medium and low-voltage distribution networks is shown in Figure 6. Please note that the main contribution of this paper is to propose a reliability evaluation method for multi-voltage levels distribution systems in which the influence of sense-control terminal faults is considered. The input parameters of the reliability evaluation are not the main focus of this article, and they are only boundary conditions.

4. Example Analysis

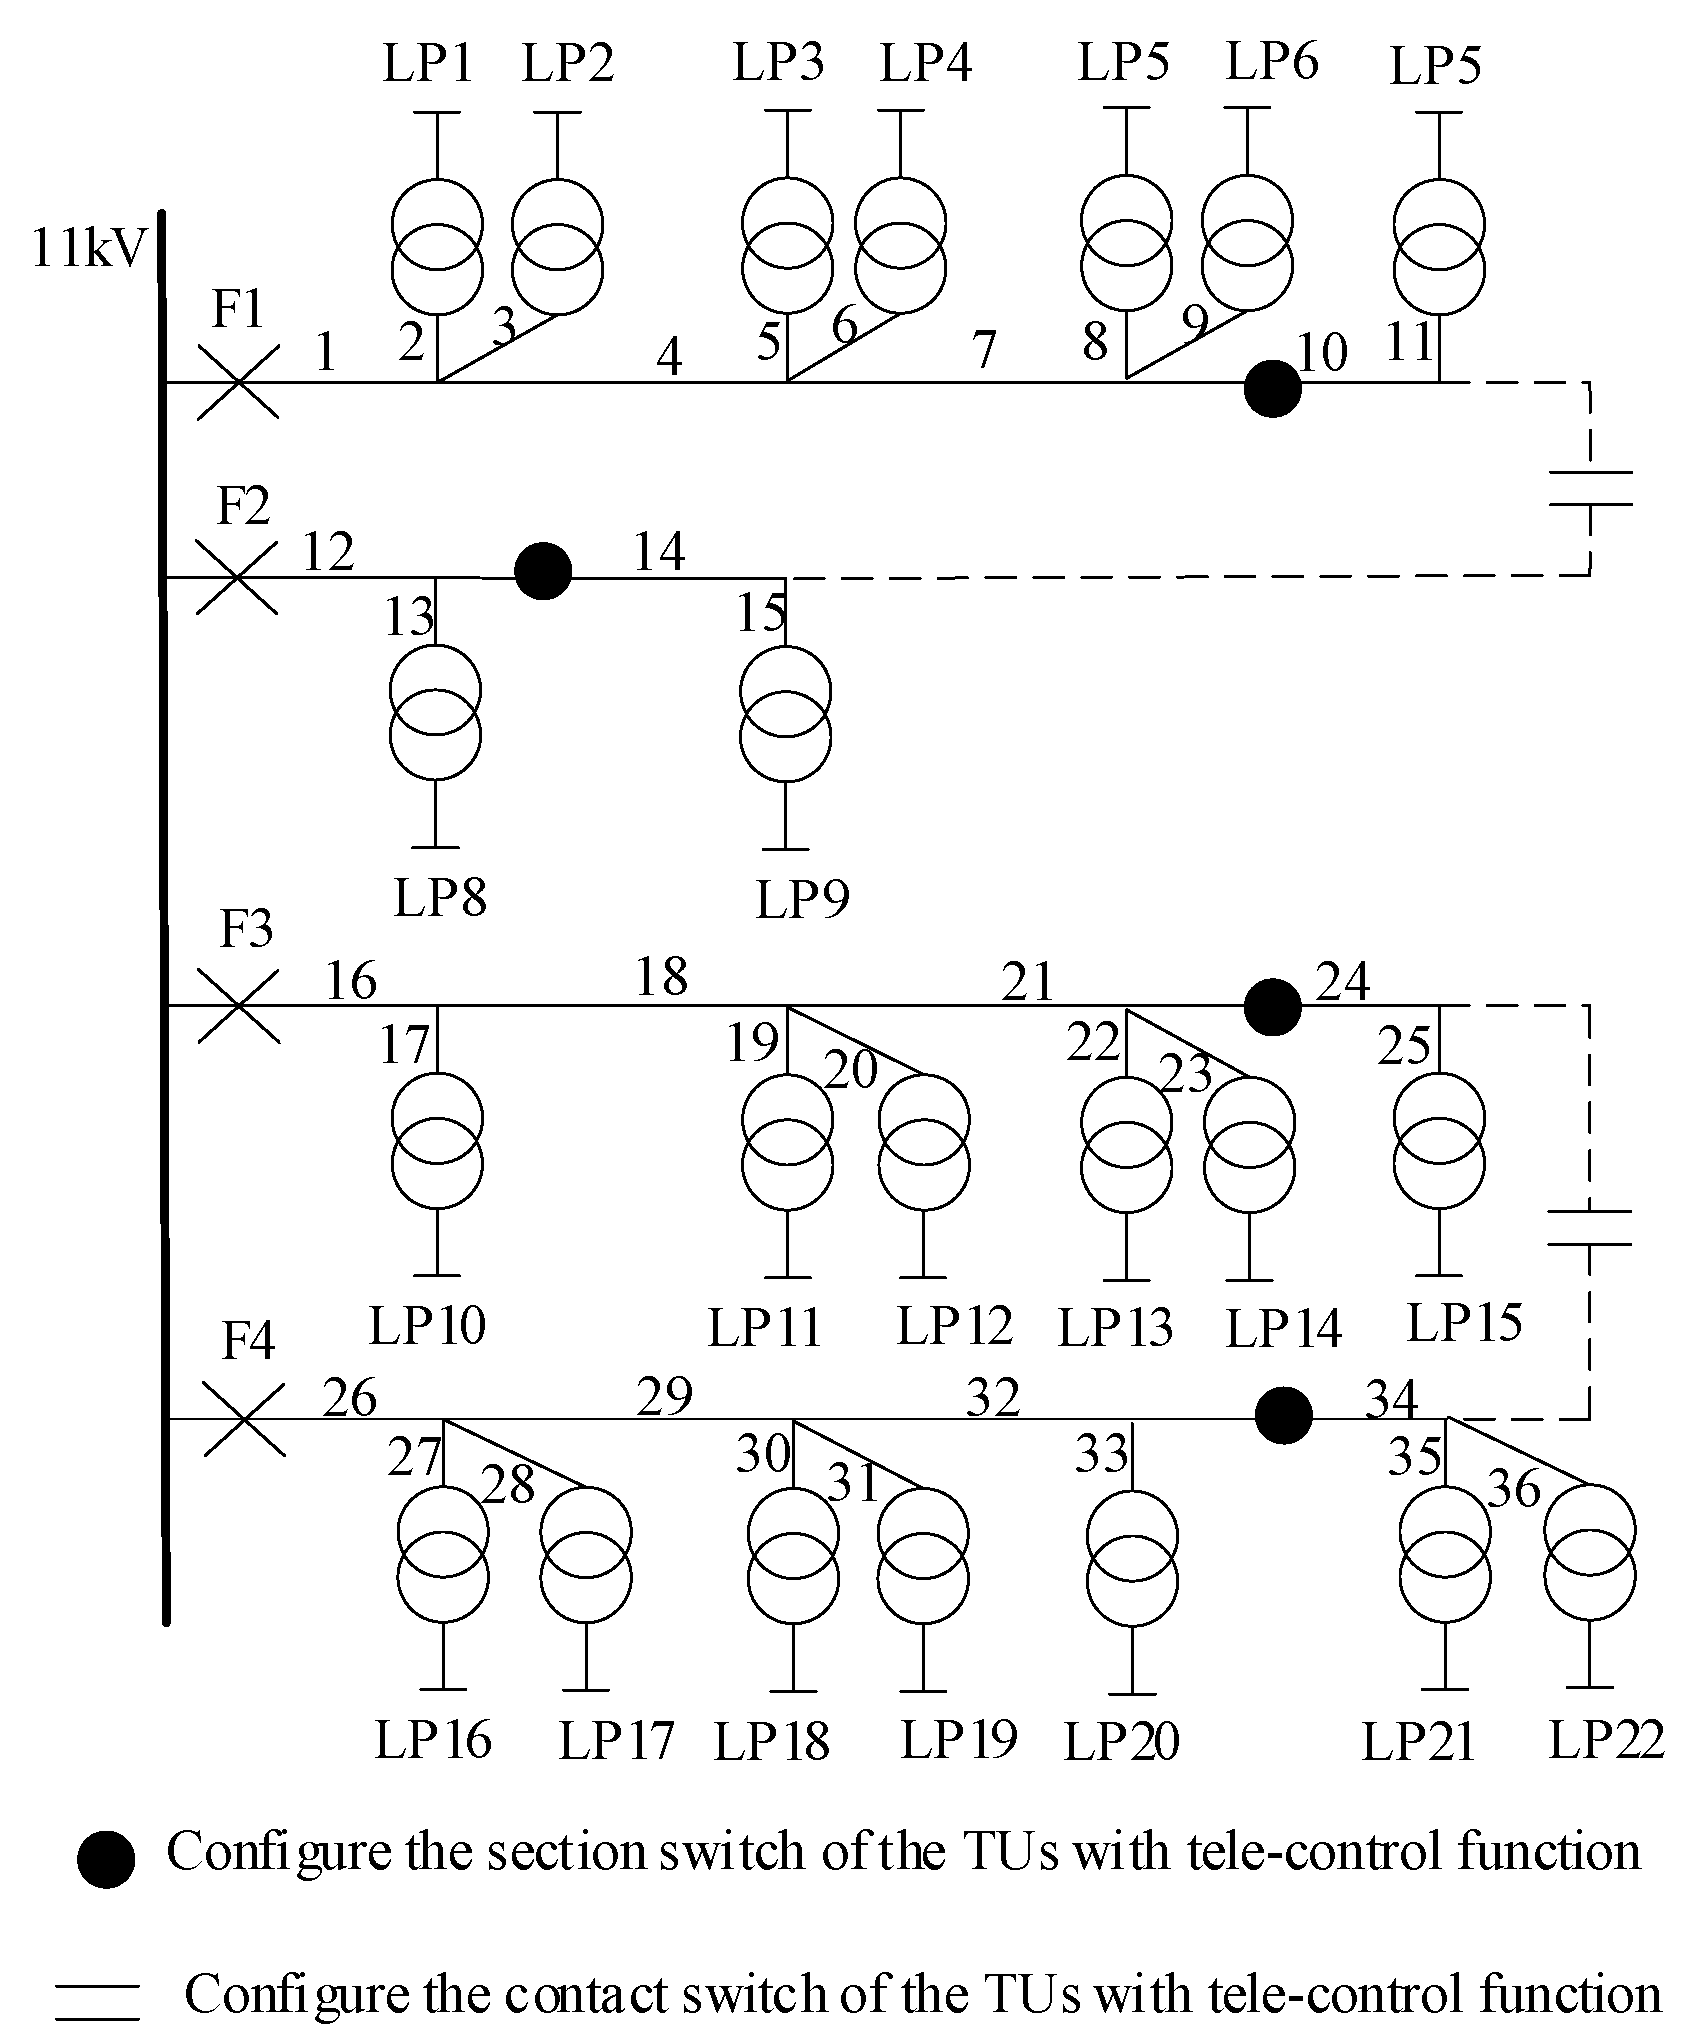
4.1. Introduction of Example System and Related Parameters

In this paper, the improved IEEE RBTS BUS-2 system is used as the medium-voltage distribution system, and the sectional switches and contact switches of each feeder are configured with the sense-control terminal, as shown in Figure 7. There are four outlets in the system, forming two groups of single-loop networks. The failure rate and average fault repair time of feeder components and main transformers are shown in Reference [18]. The failure rate of TUs without tele-control function terminal and the remote terminal is 0.06 times per year, and the average fault repair time is 12 h. The fault location time of the sense-control terminal is approximately 0 h, the automatic isolation fault time is 0.05 h, the manual isolation fault time is 1 h, the automatic load transfer time is approximately 0 h, and the manual load transfer time is 0.5 h.
The typical low-voltage distribution system structure is shown in Figure 8. The failure rate of line components is 0.5 times per year, and the average fault repair time is 0.5 h. The load data are shown in Table 2, and the operation time of the disconnector is 0.5 h. It is assumed that the distribution of users at any load point in the medium-voltage distribution network is shown in Figure 8. Based on the above description, the reliability evaluation of the multi-voltage levels distribution network considering terminal faults is completed. The IEEE RBTS BUS-2 distribution system with multiple terminals is shown in Figure 7. A typical structure of a low-voltage distribution system showed in Figure 8.

4.2. Multi-Voltage Levels Distribution Network Power Supply Reliability Evaluation Results

In order to prove the effectiveness of the collaborative evaluation method, under the condition that each section switch is equipped with a sense-control terminal and without considering the fault of the sense-control terminal, the sequential evaluation and collaborative evaluation methods are used to analyze the reliability of the medium and low-voltage distribution network. Taking the load point LP1 on the feeder F1, the load point LP12 on the feeder F3, and the load point LP18 on the feeder F4 as examples, the sequential evaluation and collaborative evaluation methods are used to analyze the power supply reliability of the low-voltage stations supplied by different load points.
The system reliability indices of specific load points and the overall reliability indices are compared.
By comparing the results of Table 3, it can be seen that the SAIDI, ASAI, and ENS of each load point calculated by the sequential evaluation method are the same, while the reliability indices calculated by the collaborative evaluation method are different. This is because in the sequential evaluation method, it is necessary to evaluate the reliability of the medium-voltage distribution system. Moreover, the evaluation indices SAIFI and SAIDI of the medium-voltage system are used as the fault frequency and outage time of the 400 V bus of the low-voltage system. Finally, the reliability evaluation of the low-voltage system is completed. The collaborative evaluation method proposed in this paper will calculate the outage frequency and outage time index of each medium-voltage load point and take them as the fault frequency and outage time of the 400 V bus in the low-voltage area of the load point, so the reliability parameters of the 400 V bus of each low-voltage system are different. Compared with the sequential evaluation method, the calculation results of the collaborative evaluation method can better reflect the differences in feeders connected to different low-voltage stations, and then targeted methods can be used to improve the weak links in the power supply. For example, the TUs with tele-control function terminals are installed in the feeder section of the low-voltage station area to improve the reliability of the power supply.
By calculating the reliability indices of all low-voltage stations and averaging the reliability indices, the final reliability evaluation results of the medium and low-voltage distribution network are shown in Table 4.
From the results of Table 4, we can find that compared with the sequential evaluation method, the SAIFI, SAIDI, and ENS calculated by the collaborative evaluation method have increased, while the ASAI has decreased by 0.0015% because the collaborative evaluation method considers the reliability of each distribution transformer area. The results can better reflect the actual operation of the distribution network, and the reliability index is also more valuable.

4.3. Reliability Evaluation of the Distribution Network Considering the Impact of Terminal Faults

In order to analyze the improvement effect of the sensing and control terminal on the operation reliability and the impact of the fault of the sensing and control terminal on the reliability, this paper designs three comparison scenarios. Scenario 1 is that each sectional switch is installed with a sense-control terminal, and it is supposed that the sense-control terminal is 100% reliable. Scenario 2 is that each section switch is installed with a sense-control terminal, and the sense-control terminal fault is taken into account. Scenario 3 is the result of the fact that each section switch is not installed with a sense-control terminal.
The reliability index of medium-voltage systems and the specific load point index in three scenarios.
The system reliability indices in the three scenarios are shown in Table 5. By comparing Scenario 1 and Scenario 3, it can be seen that after the sensor control terminal is configured on the segmented switch, the power supply reliability index of the system is significantly improved, SAIDI and ENS are greatly reduced, and ASAI is increased by 0.0153%. This is because the sense-control terminal can reduce the time of fault location and then shorten the power outage time for the user, so that the SAIDI and ENS indices of the system are reduced and the ASAI index is improved.
By comparing the indices of scenario 1 and scenario 2, it can be seen that after considering the influence of sensor terminal failure, the SAIDI and ENS of the system are increased by 11.80% and 5.34%, respectively, and the ASAI is decreased by 0.0095%. Therefore, in the process of reliability analysis of a medium and low-voltage distribution network, it is necessary to consider the influence of the faults of the sensing and control terminal components.
At the same time, the SAIFI in the three scenarios is 1.2013, which does not change with the different scenarios. This is because the index is only related to the number of power outages experienced by the user, and the operating state of the sensing and control terminal only affects the user’s power outage time. When the distribution network is in normal operation, the fault of the sensing and control terminal will not cause the user’s power outage, so the index is unchanged in the three scenarios.

4.4. Reliability Evaluation of Distribution Networks Considering the Impact of Different Planning Schemes

To analyze the impact of different distribution automation terminal planning schemes on the reliability of distribution networks, we set up three comparative scenarios in this section. Scenario 4 is to configure the section switch of the TUs without tele-control function at the circuit breaker outlet. Scenario 5 is to configure the section switch of the TUs with tele-control function at the circuit breaker outlet. Scenario 6 is to configure the section switch of the TUs with tele-control function at the end of the line. The reliability index of medium-voltage systems in the three scenarios is shown in Table 6. The scenarios 4–6 are shown in Figure 9, Figure 10 and Figure 11.
The system reliability indices in the three scenarios are shown in Table 6. By comparing Scenario 4 and Scenario 5, it can be seen that configuring different types of automation switches at the same position has different impacts on the reliability of the system. Due to the automatic power restoration function of the section switch of the TUs with tele-control function, the reliability of Scenario 4 is higher than that of Scenario 5. By comparing Scenario 4 and Scenario 6, it can be seen that even for the same type of terminal, different configuration positions will have different impacts on the reliability of the system. Therefore, it is necessary to determine the optimal access plan when configuring terminals.

4.5. Discussion on Computing Efficiency

Thanks to the simplification and the simple algebraic operation based on the FMEA, the efficiency of the reliability calculation is improved. The computation time of our method is 3.62 s, compared with 5.36 s in [19].

5. Conclusions

In this paper, a reliability evaluation method of multi-voltage levels distribution system considering the influence of sense-control terminal faults is proposed. Compared with conventional reliability evaluation methods, the advantages of the proposed method are as follows.
(1)
The reliability evaluation method proposed in this paper comprehensively considers features of the medium-voltage distribution network and the low-voltage distribution network. Based on the sequential Monte Carlo simulation method and the failure mode effect analysis method, the collaborative reliability evaluation method is realized.
(2)
The impact of sense-control terminal failure on reliability is quantified in this paper. Through case analysis, it can be seen that calculation results of the collaborative evaluation method can better reflect the impact between medium-voltage and low-voltage distribution networks. Meanwhile, we also found that the reliability of the system containing the section switch of the TUs with tele-control functions is higher than that of the section switch of the TUs without tele-control functions when considering different distribution automation
Since the position and type of automation terminal would influence the reliability of the distribution network, further research on this model for distribution automation terminal planning optimization would be worthwhile.

Author Contributions

Conceptualization, J.Z.; methodology, S.Z. (Shucan Zhou); writing—original draft preparation, Z.X. and P.C.; supervision, C.G.; software, S.Z. (Siguang Zheng). All authors have read and agreed to the published version of the manuscript.

Funding

This research was funded by Science and Technology Project of the China Southern Power Grid Company (Grant number: GDKJXM20222298).

Institutional Review Board Statement

Not applicable.

Informed Consent Statement

Not applicable.

Data Availability Statement

Not applicable.

Conflicts of Interest

Authors Jing Zuo, Shucan Zhou, Chong Gao, and Peidong Chen are employed by the company: Power Grid Planning Center of Guangdong Power Grid Co., Ltd. The remaining authors declare that the research was conducted in the absence of any commercial or financial relationships that could be construed as a potential conflict of interest.

Nomenclature

λfailure rate of the component
μrepair rate
puprobability of fault repair state
pdprobability of normal operating state
tfault time
Ltreal-time load
Lpannual peak load
Pwratio of the weekly peak load to the annual peak load corresponding to the week at the fault time
Pdratio of the daily peak load to the weekly peak load corresponding to the day at the fault time
Ph(t)ratio of the hourly load to the daily peak load corresponding to the fault time
TTFnormal working time
TTRfault repair time
R1 and R2random numbers between [0, 1]
SAIFISystem Average Interruption Frequency Index
SAIDISystem Average Interruption Duration Index
ASAIAverage Service Availability Index
ENSEnergy Not Supplied
Ninumber of users of load point i
λifailure rate of load point i.
Uiannual average outage time of load point i
Liaverage load (kW) of load point i
Tfault processing time
t1fault location time
t2fault isolation time
t3load transfer time
t4fault repair time

References

  1. Chen, Y.; Li, J.; Xu, A.; Yuan, K.; Liu, K. Reliability Evaluation for Cyber-Physical Smart Substation. Complexity 2021, 2021, 3434148. [Google Scholar] [CrossRef]
  2. Falahati, B.; Fu, Y.; Wu, L. Reliability assessment of smart grid considering direct cyber-power interdependencies. IEEE Trans. Smart Grid 2012, 3, 1515–1524. [Google Scholar] [CrossRef]
  3. Alahati, B.; Fu, Y. Reliability assessment of smart grid considering indirect cyber-power interdependencies. IEEE Trans. Smart Grid 2014, 5, 1677–1685. [Google Scholar] [CrossRef]
  4. Liu, W.; Gong, Q.; Han, H.; Wang, Z.; Wang, L. Reliability Modeling and Evaluation of Active Cyber Physical Distribution System. IEEE Trans. Power Syst. 2018, 33, 7096–7108. [Google Scholar] [CrossRef]
  5. Yi, C.; Zhou, Y. Low Voltage Distribution Network Reliability Indicator System and Risk Assessment Methodology; Panda Forum on Power and Energy: Chengdu, China, 2023; pp. 596–600. [Google Scholar]
  6. Teng, Z.; Bo, Z. Power Supply Reliability Evaluation for Consumers in Low Voltage Distribution Network Based on Probability Statistics; Power System Technology: Berd’huis, France, 2004. [Google Scholar]
  7. Tian, S.Y.; Dai, G.J.; Wang, P.S.; Li, H.Q. A Method to Evaluate Low Voltage Supply System’s Reliability. Appl. Mech. Mater. 2014, 577, 1269–1273. [Google Scholar] [CrossRef]
  8. Ouyang, S.; Liu, L. Reliability index system of distribution network for power consumer and its comprehensive assessment method. Power Syst. Technol. 2017, 41, 215–222. [Google Scholar]
  9. Xiang, S.; Yang, J. Reliability Evaluation and Reliability-Based Optimal Design for Wireless Sensor Networks. IEEE Syst. J. 2020, 14, 1752–1763. [Google Scholar] [CrossRef]
  10. Xuan, G.; Guoli, X.; Wei, W.; Yu, L.; Bin, L. The Reliability Evaluation of Power Supply Distribution System Based on Distribution Automation. J. Phys. Conf. Ser. 2020, 1585, 012034. [Google Scholar] [CrossRef]
  11. Hajian-Hoseinabadi, H.; Golshan, M.E.H.; Shayanfar, H.A. Composite automated distribution system reliability model considering various automated substations. Int. J. Electr. Power Energy Syst. 2014, 54, 211–220. [Google Scholar] [CrossRef]
  12. Cui, L.; Zhang, R.; Liu, T.; Zhang, H.; Qian, C. Reliability calculation and equipment layout planning for complex distribution automation system. Autom. Electr. Power Syst. 2017, 41, 84–91. [Google Scholar]
  13. Liu, K.; Wang, K.; Qi, X. Reliability evaluation and distribution terminal optimal configuration of power distribution system based on bathtub curve of component failure rate. Power Syst. Prot. Control 2017, 45, 49–56. [Google Scholar]
  14. Wang, C.; Zhang, T.; Luo, F.; Li, F.; Liu, Y. Impacts of cyber system on microgrid operational reliability. IEEE Trans. Smart Grid 2019, 10, 105–115. [Google Scholar] [CrossRef]
  15. Bessani, M.; Fanucchi, R.Z.; Delbem, A.C.C.; Maciel, C.D. Impact of Operators’ performance on the reliability of Cyber Physical power distribution systems. IET Gener. Transm. Distrib. 2016, 16, 07775. [Google Scholar]
  16. Nadarajah, S.; Kotz, S. The beta exponential distribution. Reliab. Eng. Syst. Saf. 2006, 91, 689–697. [Google Scholar]
  17. Wang, C.S.; Lv, Y.; Xiao, J. Medium voltage distribution system reliability calculation with the consider of high voltage distribution system and substation. In Proceedings of the Third International Conference on Electric Utility Deregulation and Restructuring and Power Technologies, Nanjing, China, 6–9 April 2008; pp. 468–473. [Google Scholar]
  18. Allan, R.N.; Billinton, R.; Sjarief, I.; Goel, L.; So, K.S. A reliability test system for educational purposes-basic distribution system data and results. IEEE Trans. Power Syst. 1991, 6, 813–820. [Google Scholar] [CrossRef]
  19. Lu, Q.; Hua, Y.; Shen, Y.; Kang, Q.; Zhang, R. Reliability evaluation of distribution network based on sequential Monte Carlo simulation. In Proceedings of the 2015 5th International Conference on Electric Utility Deregulation and Restructuring and Power Technologies (DRPT), Changsha, China, 26–29 November 2015; pp. 1170–1174. [Google Scholar]
Figure 1. Two-state Markov model.
Applsci 13 11761 g001
Figure 2. System state sequence.
Applsci 13 11761 g002
Figure 3. Fault location error diagram.
Applsci 13 11761 g003
Figure 4. Fault isolation area under fault location error.
Applsci 13 11761 g004
Figure 5. Power restoration area under fault location error.
Applsci 13 11761 g005
Figure 6. Reliability and collaborative evaluation processes of multi-voltage levels distribution networks.
Applsci 13 11761 g006
Figure 7. IEEE RBTS BUS-2 distribution system with multiple terminals.
Applsci 13 11761 g007
Figure 8. Structure of a low-voltage distribution system.
Applsci 13 11761 g008
Figure 9. IEEE RBTS BUS-2 distribution system with the section switch of the TUs without tele-control function configuration scenario 4.
Applsci 13 11761 g009
Figure 10. IEEE RBTS BUS-2 distribution system with the section switch of the TUs with tele-control function configuration scenario 5.
Applsci 13 11761 g010
Figure 11. IEEE RBTS BUS-2 distribution system with the section switch of the TUs with tele-control function configuration scenario 6.
Applsci 13 11761 g011
Table 1. Fault impact table of the sense-control terminal.
Upstream Fault ZoneFault DomainFault Downstream Area
The fault location is correctt1 + t2t1 + t2 + t4t1 + t2 + t3
Fault location errort1 + t2t1 + t2 + t4t1 + 2t2 + 2t3
Table 2. User basic parameters.
Box NumberThe Number of UsersAverage User Load/kW
1107.5
2107.5
3157.4
4257.6
5307.6
6207.5
7207.6
Table 3. Comparison of reliability indices of low-voltage station areas with load points.
Load PointsSAIDI (h/Household·Year)ASAI (%)ASAI (kWh/Year)
Collaborative AssessmentSequential EvaluationCollaborative Assessment Sequential Evaluation Collaborative Assessment Sequential Evaluation
LP13.53213.012799.953399.9631288.14205.73
LP123.37593.012799.958299.9631279.31205.73
LP183.13623.012799.961699.9631243.95205.73
Table 4. Calculation results of the system reliability index.
MethodSAIFI
(Times/Household·Year)
SAIDI
(h/Household·Year)
ASAI
(%)
ENS
(kWh/Year)
Collaborative assessment1.20133.264799.96164615.43
Sequential evaluation1.17653.012799.96314526.06
Table 5. Calculation results of the system reliability index.
MethodSAIFI
(Times/Household·Year)
SAIDI
(h/Household·Year)
ASAI
(%)
ENS
(kWh/Year)
Scene 11.20133.264799.96164615.43
Scene 21.20133.650299.95214862.31
Scene 31.20135.221499.94635788.24
Table 6. Calculation results of the system reliability index.
MethodSAIDI (h/Household·Year)ASAI (%)
Scene 43.7199.958
Scene 55.1099.942
Scene 64.0599.954
Disclaimer/Publisher’s Note: The statements, opinions and data contained in all publications are solely those of the individual author(s) and contributor(s) and not of MDPI and/or the editor(s). MDPI and/or the editor(s) disclaim responsibility for any injury to people or property resulting from any ideas, methods, instructions or products referred to in the content.

