Abstract
Mechanical action can damage physical objects, such as building structures. The transfer of energy to the ground through the falling mass, forming a crater, can cause kinematic forces in the soil medium. An effect of these forces, connected with the technology of geotechnical machines, is vibrations of the ground and building structures. When finding the energy impact on the object is difficult or even impossible, vibration monitoring and indirect estimation of the negative energy impact effects is possible. Commercial off-the-shelf solutions exist for vibration monitoring and recording, but they are dedicated to one application type and are relatively expensive. This paper presents a proprietary system for monitoring and recording vibrations of building objects transmitted through the ground. This allows for local registration and remote administration and presentation of data via a computer network. Vibrations can be analysed according to the requirements of developers and clients. The developed system shows that creating an effective approach for collecting data on building vibrations using components from different suppliers is possible. The waveforms collected using the system confirm the effectiveness and flexibility of the presented solution, providing a possibility of using the results to decide whether the vibrations are within the standard limits.
1. Introduction
Energy exchange between machine parts can cause harmful changes, being common in technology. Practically, with any real movement of the object, vibration occurrence in the environment can be expected. The source of vibrations may include vehicle traffic, rail transport, equipment operations, construction works, and mine operations [1,2]. Building structures and occupant comfort are both affected by vibrations. Historic buildings are susceptible to physical, chemical, and biological processes. Vibrations may damage elements of objects and potentially lead to a construction disaster [3]. Historical buildings in cities are subjected to long-term vibrations from public transport vehicles, which requires monitoring of the condition of the buildings over long periods of time [3].
With mechanical devices, vibration information can be used as diagnostic information. This can help to find whether the machine element works correctly or is damaged. Wind turbines can be used as an example. Turbines are structures susceptible to wear during operation. Full vibration monitoring and analysis systems allow early failure detection, reduce downtime, and maximise efficiency [4]. The turbine blade monitoring system is based on dynamic properties of the blade and depends on the blade’s material (stiffness and damping). Vibration monitoring can detect a reduction in blade stiffness caused by a damaged blade [5].
Coal mills are another exemplary group of devices, whose health can be monitored by recording vibrations. Incorrect loading and vibration of the mill can disrupt the coal pulverisation process. The regrinding efficiency cannot then be guaranteed, which has a negative effect on the entire pulverisation system. When monitoring the correct operation of the mill, vibration and load signals are first collected, corresponding to typical damage to a coal mill. Based on them, models of the mill’s operation are built on various scales. The models are compared with those obtained during the mill operation. By analysing these vibration characteristics and estimating the coal level in the mill, various operational problems, such as overload and lack of carbon, are identified [6].
Bearings are an element commonly used in machines. The analysis of vibration signals is so advanced that signal modelling is used by analysing combined signals from a physical object and a material model based on physical properties [7]. Vibration monitoring allows for early detection and replacement of the damaged element.
Explosions and controlled explosions are processes that release large amounts of energy. An example is rock breaking, where an effective part of the blast energy crushes the rock. Energy is transferred to the atmosphere as air movement, thermal energy, and ground vibrations. Ground vibrations are transmitted to buildings and other structures, causing movements. Explosions started in mines have a direct impact on mine office buildings, industrial structures, and surrounding residential buildings, power lines, and pipelines. Vibration monitoring detects the level of vibrations threatening the condition of objects surrounding the mine [8,9].
The problem of vibration monitoring includes both small free-standing objects and large structures. A unique structure is the Large Hadron Collider (LHC) on the border of France and Switzerland. In order to reduce the influence of external factors on the research results, the LHC was built underground. Due to specialised research, it is necessary to conduct ongoing monitoring of the vibrations’ impact, including seismic vibrations. Research on vibration monitoring considers both the measurement systems’ construction and implementing new methods of signal processing [10,11]. In [11], the researchers confirmed a practical possibility of using the Probabilistic Power Spectral Density analysis of signals from seismic stations in determining the long-term ground vibrations.
As mentioned before, a significant source of long-term vibrations is public transport. Rail transport is often analysed as a source of vibrations. Scientists do not limit themselves to modelling building vibrations. The generated noise and noise reduction efficiency are also considered [12]. Variants of rail traffic are modelled: general rail traffic [13], high-speed surface railway [12], and underground railway networks [14].
The methods for measuring vibrations in building objects are not limited to using classic accelerometers. Modern non-contact methods that do not require any interference with the tested object are successfully used. Such methods include tests using laser vibrometers, often used in dynamic tests of machines [15]. Microwave interferometers are becoming more popular in construction [16,17,18]. Measurements using interferometers are characterised by a high measurement accuracy (sensitivity of 0.01–0.02 mm) and a sampling frequency of 200 Hz [18]. Taking measurements using the IBIS-S (IBISFS) system allows simultaneous determination of structure movements at many points. Detailed and complete information about structure movements during dynamic deformations is available. Non-contact measurements have proven successful in studying large structures, such as tall buildings, towers, chimneys, and skyscrapers [15,19,20]. They can be used to study linear infrastructure objects such as bridges [16,17]. However, interferometers require ensuring the stability of the ground, which is the base point. This limits the scope of measurements to systems in which there are no significant movements of the ground (e.g., due to the operation of the pile driver).
1.1. The Difficulty of Estimating the Parameters of the Waves
Scientists analysing the influence of the impact energy on the vibrations of the ground and objects use properties in the amplitude’s form of the propagating wave, its frequency, or the speed of movement of soil particles. The Bornitz equation, describing the damping of vibrations at selected points of the ground, is commonly used [21,22,23,24,25,26]:
where —vibration amplitudes at distances from the source of the vibration, —attenuation coefficient depending on the ground type and vibration frequency, and —geometric attenuation coefficient, which depends on the type of wave and the position and size of the wave source.
Exact analytical determination of wave or vibration properties under real conditions seems to be impossible. The two coefficients in the Bornitz equation handle this.
The attenuation coefficient, , handles the attenuation of the wave in the medium, such as the ground. Its precise determination would be possible only with homogeneous soil. This situation practically does not occur, because the soil is combined with many layers, such as sand, silt, clay, and rock [26,27]. The components of the layers may have different granulation, the thickness of the layers may be varied, and there may be layers combining various components. As a result, the attenuation coefficient, , for soil with known components and for selected frequencies is presented as ranges (e.g., for hard soil, for a frequency equal to 5 Hz, the value of the attenuation coefficient, , is between ) [25].
The geometric attenuation coefficient, , is the attenuation due to wave damping. Attenuation varies based on wave type, position, and source size [25]. With soil vibration analysis, there may be several parallel types of waves. With construction techniques, a common process is piling (pile driving) (Figure 1).
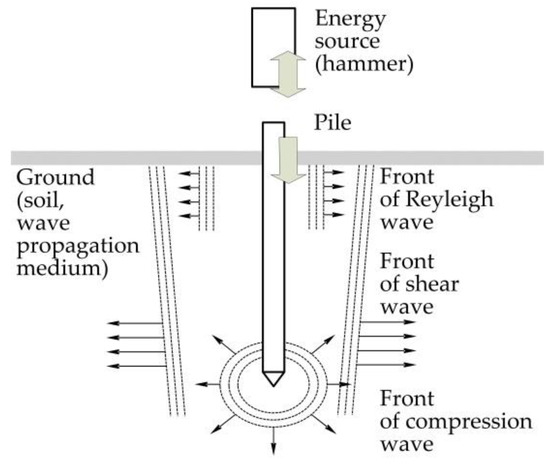
Figure 1.
Schematic illustration of the generation of different wave types during piling [28].
During the pile setting, the hammer’s energy is transferred to the shaft and tip of the pile or casing pipe. Driving a pile into the ground is accompanied by the displacement of soil particles and shear and compression waves’ generation in the ground by the pile tip. The waves radiate in all directions. Another shear wave is generated by the moving soil particles due to friction between the pile and the soil particles. In practice, the wave front is assumed cylindrical. When the compression and shear waves reach the ground, some transform into a Rayleigh wave. The rest is reflected to the ground. Rayleigh waves propagate parallel to the ground surface [1,21]. The influence of several types of waves on the geometric attenuation coefficient, , makes it difficult to determine the coefficient precisely. Researchers are trying to determine it experimentally for different values of the shapes and sizes of the wave source [29].
1.2. Directions of Research Work
Despite difficulties with precise analytical determination of the relationship between the energy of the source of vibrations and the vibrations of the tested object, work is underway to create mathematical models for vibration analysis and the design of new types of sensors. Long-term measurements in real conditions allow for a more exact assessment of the impact of vibrations transmitted through the ground on buildings.
The analysis of online values that were collected or monitored earlier is primarily conducted for the dependable prediction and detection of future problems and failures. In the exemplary vibration monitoring system of a single coal mill, researchers rely on the kernel extreme learning machine model based on feature extraction. The model reduces information redundancy, reduces computing costs, and provides a new idea for the fault diagnosis of a coal mill based on feature extraction [6].
Another approach to vibration monitoring is predicting object vibrations based on the vibration properties of its selected elements. In [30], only the vibration data at certain points of the structure were selected for analysis. A random forest regression model for predicting any location of the structure, amplitude, and frequency of the force was used [30].
During construction works, it seems necessary to obtain reliable values of the predicted ground vibrations. Research shows that, in special conditions, forecasting is possible using the Lagrangian–Eulerian (ALE) adaptive mesh method [28,31]. These simulations were performed to simulate the pile penetration in the continuous piling process. The term continuous piling describes the piling process from the ground surface to the final penetration depth. The simulations showed that the numerical model could efficiently calculate the velocity of the front of waves of various types in a homogeneous soil [31].
Some scientists go further and try to implement heterogeneous soil in the model. In [32], the finite element method in time domain (FEM-TD) is employed for predicting pile-driving-induced vibrations. A soil model with four layers of different thickness was used in the simulations. Layer thickness and properties were determined using actual measurements. The obtained values of the soil layer properties were used in the model. The results of the simulation were compared with the results of the low-strain test performed with a handheld impact hammer. The results of the simulation and practical test confirmed that the developed numerical model is highly consistent with in situ measurements [32].
Another interesting research direction is developing vibration sensors without an external power source. Papers on mechanical vibration sensors with an integrated energy collection function with a piezoelectric transducer are published. Typical generators for generating mechanical energy are equipped with a movable lever (cantilever) made of piezoelectric material. The piezoelectric lever generator may be a self-powered sensor that detects the state of vibration of the support. With a known resonant frequency of the lever, it is possible to determine the vibrations based on the damping of the signal coming from the lever [33]. The physical feasibility of building such a sensor has been proven, and the current work concerns estimating potential errors [34]. This makes it possible to build self-powered vibration sensors based on a unique phenomenon. Another type of generator is a nano-generator that uses a combination of the triboelectric and electrostatic effects. The source of energy is flexible nanofibers, fabricated by electrospinning with a strong dielectric compound and the relatively negative triboelectric material polyvinylidene fluoride. This type of sensor can be an efficient, self-powered nanofiber vibration sensor (SNVS) for the safety detection of rail fastener tightness [35]. The lack of an external power supply allows for mobile work of the sensor. Mobility can be further increased by introducing a wireless communication module into the sensor. It has been shown that the obtained electricity allows the sensor to work and suffices to meet the needs of the wireless communication module [36].
Apart from the research directions mentioned above, currently, the most widespread research is in the propagation and damping of vibrations accompanying rail transport, dynamic compaction, explosions, and pile-driving foundations [22].
The vibration monitoring system presented in this publication combines elements from different suppliers to work together smoothly and provide reliable measurement data. A significant difference from commercial systems available on the international market is the flexible structure of the measurement system, adapted to the requirements of the [37], with the possibility of easy adaptation to other standard requirements. International corporations producing vibration-recording systems have no business interest in creating systems that qualify vibration values under locally applicable standards. Introducing an international standard in a small country is easier than getting support from an international hardware and software manufacturer for the local standard. The data presentation has two levels—system administrator- and user-level access to measurement data. The obtained measurements instantly provide the user with information on the vibration classification (SWD range) and its potential impact on the structure (Section 3). Remote access with limited user privileges is provided. This type of data access is rare in commercial solutions. Commercial research systems are typically designed to be operated by qualified employees with extensive permissions. The cost of the presented, dedicated monitoring system (consisting of sensors, a data acquisition card, and software) is much lower than the cost of a closed system provided by recognised suppliers of this type of solution (e.g., Brüel and Kjær, Svantek).
2. The Measuring System for Monitoring Vibrations of Building Structures
When determining the effects of energy on building structures, attempts are made to estimate and model vibrations theoretically, as mentioned. An inability to find the real impact of energy on buildings analytically and precisely is due to the heterogeneous medium between the vibration source and the building. The medium comprises layers, such as sand, silt, and clay. The layers are characterised by variable thickness, and other disturbances are caused by underground structures, such as pipelines or foundations of structures other than the tested one. The impact on the object can only be precisely determined by measuring the tested object (Figure 2).
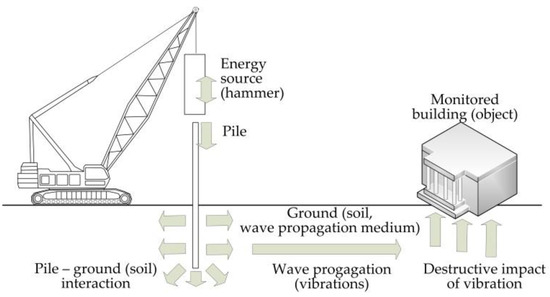
Figure 2.
Block diagram of the wave generation and the vibration transfer during pile driving.
Complete commercial solutions dedicated to vibration measurement are available. Their disadvantage is the high purchase costs and the ability to carry out measurements only to the extent provided by the software from the manufacturer. The discussed system for measuring and recording the kinematic impact on building structures is an open-access system. The system characteristics include:
- Possibility to modify the code regarding the collected data,
- Remote access to online data with different access levels, i.e., administrator (possibility to modify the code and presentation method) and user (viewing current data and data from a selected period),
- Generation of results, allowing immediate confirmation of whether the vibration value is allowed by the standard.
The presented original vibration-recording and analysis system has a classic structure, which is presented in Figure 3. The measurement signal is generated by a vibration sensor (accelerometer) installed directly on the tested object (Figure 4, Table 1). The accelerometer output signal is delivered to the measurement card dedicated to dynamic measurements (Figure 3 and Figure 4, Table 1 and Table 2).
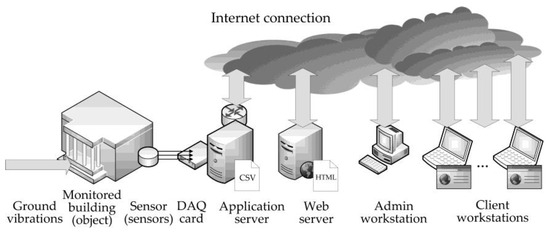
Figure 3.
Block diagram of the system for monitoring kinematic impacts on building structures.
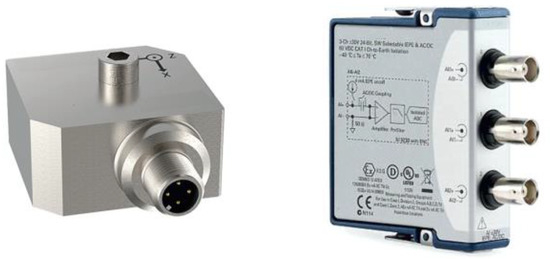
Figure 4.
General view of the vibration sensor (on the left) and data acquisition card (on the right).

Table 1.
Selected parameters of the vibration sensor.
Table 2.
Selected parameters of the data acquisition card.
It can be found in the literature that most damage to buildings resulting from human activity occurs at impacts in the frequency range from 1 to 150 Hz [1]. This frequency range is covered by the Swiss standard [38]. The German [39], Swiss [38], Italian [40], or Polish [37] standards refer to the more typical frequency range from 1 to 100 Hz [41,42].
Both the accelerometer and the measurement card allow for correct signal processing in the required range of 1–100 Hz. The accelerometer has a flat (3 dB) processing characteristic between 0.2 and 3700 Hz. The measurement card also has a flat processing characteristic (3 dB) from 0.1 Hz. Additionally, the [37] recommends using accelerometers with a minimal sensitivity of 1000 mV·g−1. The accelerometer included in the system has the required sensitivity (Table 1).
The acquisition card processing data from three channels of the vibration sensor must be placed in a housing unit. The dedicated acquisition card housing unit is presented in Figure 5. A one-slot NI cDAQ-9171 chassis was used. This kind of housing is designed for use with C Series modules. The housing provides power to the acquisition card and supports data transmission in accordance with the Hi-Speed USB 2.0 standard. The measurement system software is dedicated to the Windows environment. In the described case, the measurement system was run on a reinforced (“rugged line”) tablet from Dell (Figure 5). Devices in industrial applications cannot be expected to operate in sterile conditions. They may be at risk, among others, from the negative effects of dust, temperature, and humidity. Therefore, a device from the “rugged” line was used. The manufacturer has declared that the equipment is capable of functioning within a temperature range of (−29) to (+63) degrees Celsius. The tablet is dustproof and resistant to low-pressure water jets directed at any angle. The right side of Figure 5 shows the housing unit in which the system is placed for the duration of the measurements. It provides additional protection against external influences and interference by unauthorised persons.
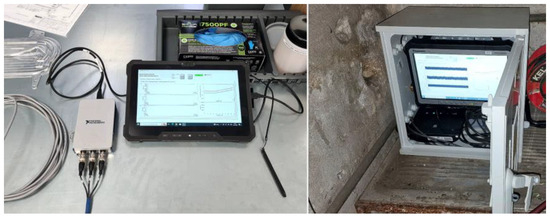
Figure 5.
View of the card and the computer unit before and after mounting in the housing.
Vibration measurements during construction work usually take a long time. They cover the entire period of work that may have a negative impact on buildings. In order to improve the reliability of measurement recording, preliminary tests of data collection, registration, transmission, and remote access are first carried out (Figure 6). During measurements, all elements of the measuring system are closed in a housing unit. The housing unit meets the basic requirements of standards for protection against ingress of solid objects (IP4X), ingress of water (IPX4), impacts (IK10), and exposure to fire (UL 94 V-0) (Figure 6, right side). The housing prevents objects larger than 1 mm in diameter, such as larger insects, from gaining access to the interior. The housing provides protection against water being sprayed from any direction. The upper part of the housing unit should withstand the impact of an object weighing 5 kg dropped from a height of 40 cm. With a direct flame impact on the housing unit, the burning process should stop within 10 s and the housing material does not generate flaming drips. The housing is locked to protect the measurement system from accidental interference.
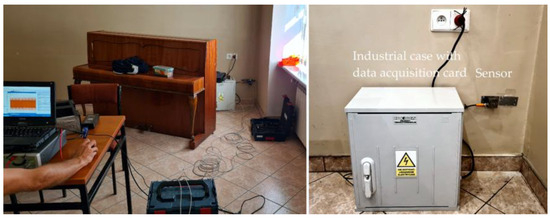
Figure 6.
View of the apparatus during preparation for tests.
In order to ensure reliable data, the system has been checked and will be checked periodically for errors. The sensor (accelerometer) was calibrated in an accredited calibration laboratory, No. AP 006 (Main Mining Institute, National Research Institute, Research and Calibration Laboratory Team, Katowice, Poland). The parameters of the sensor have been confirmed by the calibration certificate No. 6128 of 10 February 2022. The error estimator is the standard deviation expressed in %. The standard deviation values for the transducer output signal in the x, y, and z planes is between (−2.23) and 3.36% (Figure 7). The obtained values were confirmed by the information provided by the manufacturer in the sensor data sheet (Table 1).
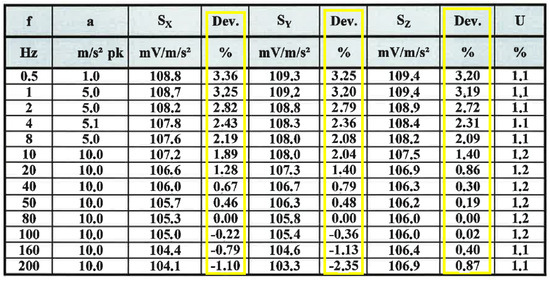
Figure 7.
Fragment of the accelerometer calibration certificate (the error estimate is marked in yellow).
The measurement system was validated through an interlaboratory comparison to meet the requirements for accurate measurement. The standard [43] indicates the possibility of performing validation using one of the following methods:
- Calibration or evaluation of bias and precision using reference standards or reference materials,
- Systematic assessment of the factors influencing the result,
- Testing method robustness through variation of controlled parameters, such as incubator temperature volume dispensed,
- Comparison of results achieved with other validated methods,
- Interlaboratory comparisons,
- Evaluation of measurement uncertainty of the results based on an understanding of the theoretical principles of the method and practical experience of the performance of the sampling or test method.
The results of the developed measurement system were compared with the results obtained by an accredited laboratory. Accredited laboratories maintain metrological traceability of their measurement results by means of a documented unbroken chain of calibrations, linking them to an appropriate reference. The interlaboratory comparison was carried out together with the accredited research laboratory No. AB 1407 (Silesian University of Technology, Field Research Team, Gliwice, Poland) in October 2022. The interlaboratory comparison was performed in three locations (buildings), with three series of measurements in each location. An artificial source of vibrations was used, which was a diesel soil compactor. Measurements were carried out for two vibration planes. Peak acceleration was recorded. The results were compared using the En indicator in accordance with the standard [44]. The obtained value of the En indicator should be interpreted as follows:
- |En| ≤ 1—comparison result “satisfactory”, no additional action is required.
- |En| > 1—result of the comparison is “unsatisfactory”, corrective action should be taken.
The maximum value of the En indicator for measurements obtained from the described measurement system, after comparing with the values of an accredited testing laboratory, did not exceed 0.32 (|En| ≤ 0.32). Examples of selected En values for one sample in one location from the interlaboratory comparison are presented in Table 3.
Table 3.
Exemplary, selected En values for one sample in one location from an interlaboratory comparison.
The measurement system was developed in the LabVIEW (National Instruments) development environment. LabVIEW is a graphical development environment (Figure 8). Its biggest advantage is the easy integration of input/output devices, such as measurement cards, devices compatible with the GPIB, PXI, and IMAQ standard, and PLC controllers. LabVIEW environments provide tools for controlling and retrieving data from hardware. Input data can be entered directly by the user, come from data stored on the disk, come from control and measurement equipment, from network sources based on standard communication protocols (TCP/IP, FTP, etc.), and from internal environment protocols (e.g., data socket). Data processing in the basic version is limited to implementing algebraic, logical, and trigonometric functions. More advanced environment distributions have predefined groups of subroutines, allowing to use more complex functions to do more or less complex calculations: filtering, spectral analysis, FFT transform, and Hilbert transform. Communication with the equipment can be carried out using devices connected locally by cable or wireless, and devices with a network interface or using the http protocol and websites.
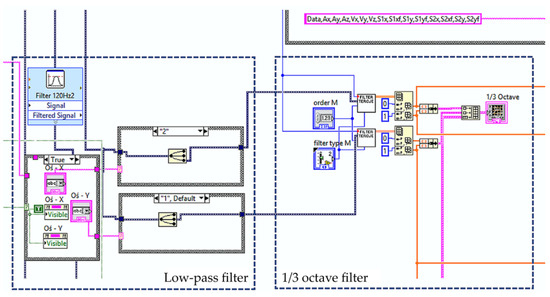
Figure 8.
A sample part of the code of the data acquisition and processing system developed in the LabVIEW environment.
The measurement system developed in the LabVIEW version 2019 is dedicated to work in MS Windows 10 and newer operating systems. The following stages can be distinguished in the system (Figure 9):
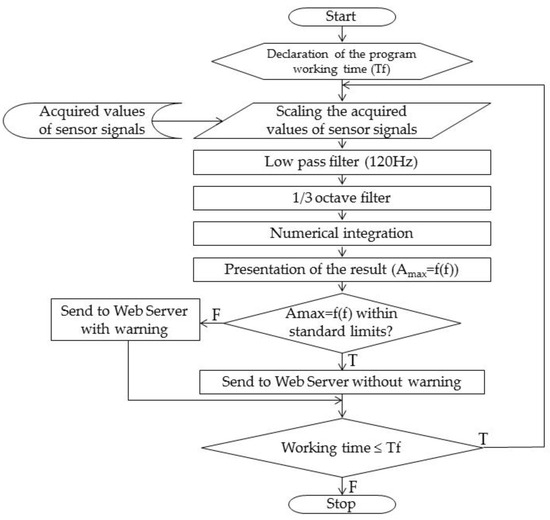
Figure 9.
Simplified algorithm of the basic part of the LabVIEW data acquisition system.
- Initial declaration of the program’s working time (e.g., 1 week),
- Parallel readout of measurement values from 3 accelerometer channels,
- Filtering the signal with a low-pass filter,
- Filter data with 1/3 octave filter,
- Numerical integration,
- Generating the dependence (maximal amplitude of acceleration versus frequency),
- Comparison of the characteristics of with the values permitted by the standard [37],
- Data export as a CSV file (comma-separated values) to a webserver,
- Data formatting according to the template applied on the webserver,
- Presentation of data to the user.
For the end user, a panel created on a public webserver is tested. The panel will be accessible via web browsers, as shown in Figure 10. Access to the panel is protected by a password. After logging in, the user has access to dedicated measurement systems.
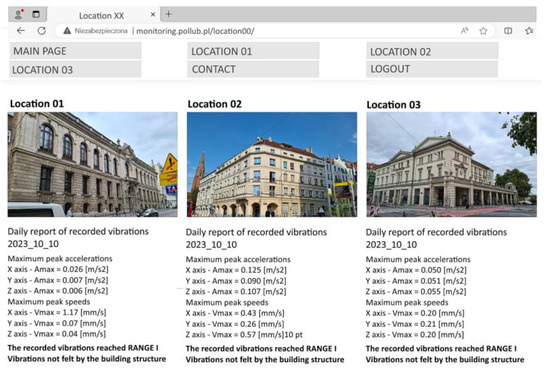
Figure 10.
Start screen of the end user (after successful login).
After selecting a specific location of the measurement system, six groups of data are made available:
- -
- “Current data—Description”—daily summary of data on the maximum values of accelerations in three axes, maximum values of speeds in three axes, maximum values of the normative WODB index, and a summary in the form of qualifying vibrations to one of the normative vibration impact zones on the object (Figure 11).
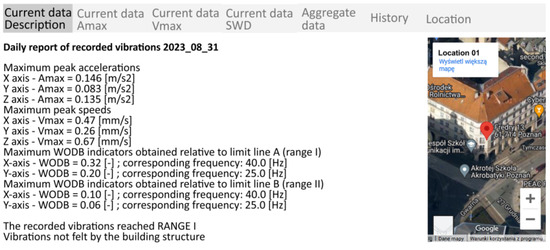 Figure 11. “Current data—Description” window.
- -
- “Current data—Amax”—graphical presentation of the peak acceleration values, A (m/s2), of vibrations in three directions recorded on the current day. It is possible to select a specific point with the mouse pointer and read the acceleration values at the indicated point in time (Figure 12).
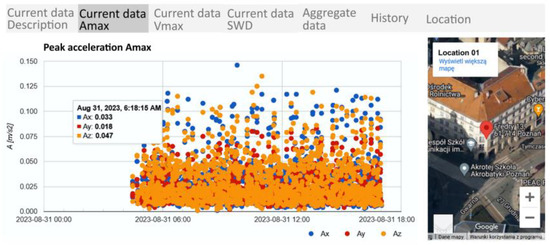 Figure 12. “Current data—Amax” window (bottom of the browser window).
- -
- “Current data—Vmax”—graphical presentation of the peak values of the velocity, V (m/s), of vibrations in three directions recorded on the current day. It is possible to select a specific point with the mouse pointer and read the acceleration values at the indicated point in time (Figure 13).
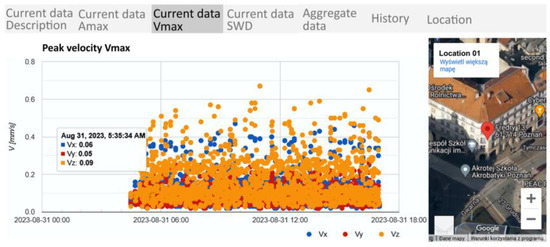 Figure 13. “Current data—Vmax” window (bottom of the browser window).
- -
- “Current data—SWD”—graphical presentation of WODB index values recorded on the current day. The indicators are presented on the SWD scale in order to later qualify the vibrations to one of the impact zones (Figure 14). Qualification for impact zones is carried out in accordance with the guidelines of the standard [37].
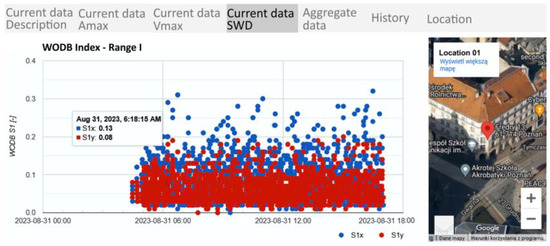 Figure 14. “Current data—SWD” window (bottom of the browser window).
- -
- “Aggregate data”—graphical presentation of the peak acceleration values, A (m/s2), of vibrations in three directions recorded since the start of the system operation (Figure 15).
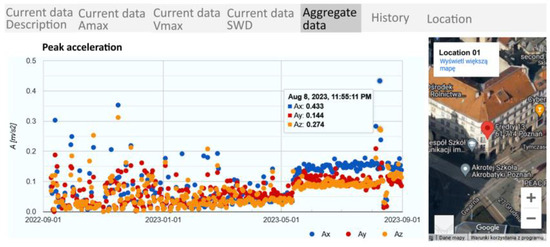 Figure 15. “Aggregate data” window (bottom of the browser window).
- -
- “History”—presentation of historical time courses of peak acceleration values and presentation of WODB index values recorded on the date indicated by the user (Figure 16).
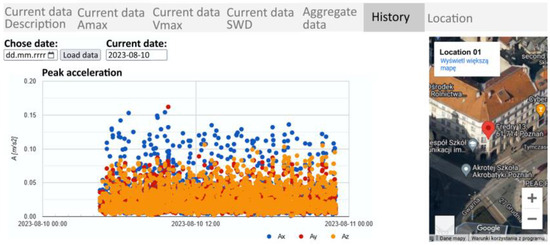 Figure 16. “History” window (bottom of the browser window).
The main task performed by the user’s panel is the ability to become acquainted with the current values of accelerations and vibration velocities, as well as the WODB index values. The key for the end user is the information about in which period the highest vibrations occur and to which zones of impact on the building (SWD) they should be classified. The end user receives this most important information directly after selecting the measurement system in the “Current data—Description” tab (Figure 11). Work is underway to improve the quality of information presentation, i.e., to introduce the function of enlarging time courses and selecting any time range of the presented data.
3. Results
The included results were recorded during the construction of the S19 expressway in Poland. The FRANKI technology was used in the piling process.
The FRANKI technology piles are made using a dynamic method, using a reusable guide pipe. In phase one, the guide tube is filled with concrete or gravel, then compacted using a freely falling compactor. This causes the pipe to sink into the ground. The number of blows per meter of pipe depth (pipe feed) determines the work, which reflects the bearing capacity of the soil. The process of making piles has a low noise level. However, it causes vibrations in the ground, propagating to the neighbouring building structures. To prevent negative impacts, the contractor applies optimisation by pre-drilling to a depth of 12 m in the place where the steel pipe is being driven (Figure 17).
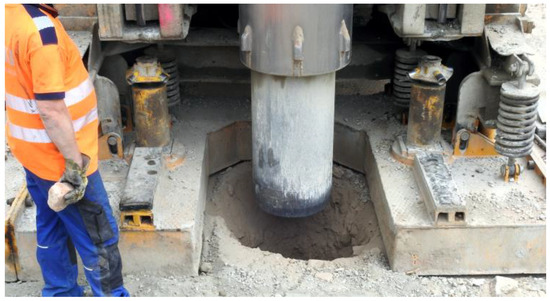
Figure 17.
Preliminary hole for pile placement.
Unfortunately, the end part of the pile (about 5 m), together with the widened foot, must be hammered. Thus, vibrations of nearby objects must be monitored. In the described case, monitoring concerned one building (Figure 18).
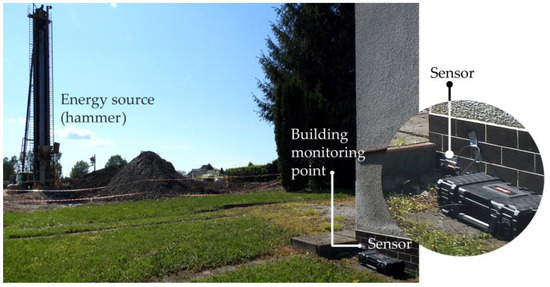
Figure 18.
The view of the piling machine and the monitored building.
In the described case, the kinetic energy transferred to the substrate is constant (about 290 kJ), due to the constant drop height of the rammer (h = 6.5 m) and the rammer mass (4500 kg). The key element influencing the magnitude of dynamic interactions is the value of the force drive (force impulse) [45]. The power drive depends on the duration of contact with the soil substrate, during which the maximal speed of the compactor decreases to zero (full plasticisation of the soil substrate). The duration decreases as the stiffness of the subsoil increases. During the pile’s construction, the pile certificate is documented, in which the number of strokes per 1 m of pile immersion is counted (Figure 19). Considering the average time between individual shots, amounting to 8 s, a graph was drawn, showing the number of strokes as a function of the time needed to perform all strokes (Figure 20).
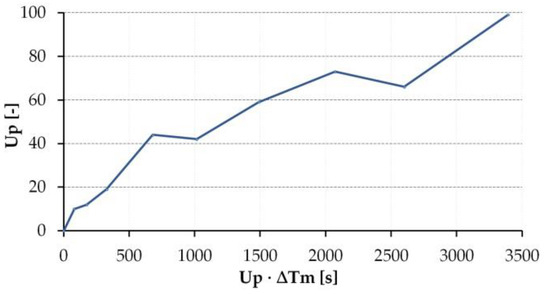
Figure 19.
Time plot of the number of strokes during pile driving (ΔTm—Figure 20).
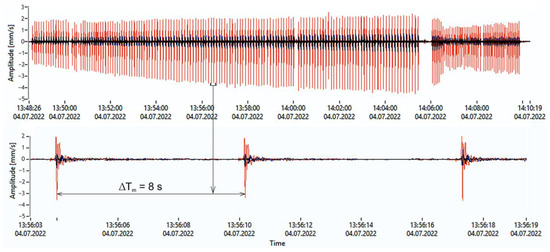
Figure 20.
Time plot of the peak velocity values (X axis—blue waveform, Y axis—black waveform, Z axis—red waveform).
Using continuous vibration monitoring can make it possible to evaluate the propagated energy of each pile being performed. Figure 19 shows the actual comparison of the impulse number index per meter of pile depth as a function of time regarding the impulse duration. The course of the procedure concerns the depression of a single pile.
In the current data stream, peaks are searched and recorded (Figure 20). Such raw data are then compiled into daily summaries that allow for an overview of disturbances throughout the construction works (Figure 21). In the final phase, the current data are used to develop a graph of the tertiary analysis of peak accelerations and compare it with the graph of values allowed by the standard (Figure 22).
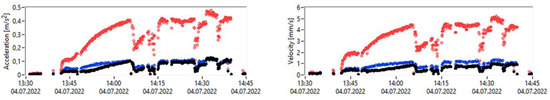
Figure 21.
Part of a daily plot of the acceleration and velocity values (X axis—blue point, Y axis—black point, Z axis—red point).
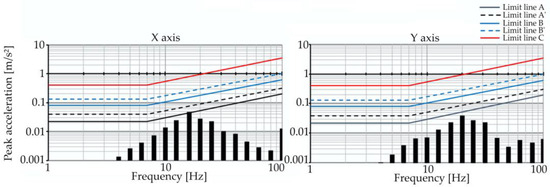
Figure 22.
Graph of the maximum vibration accelerations of the central frequencies 1/3 octave with the limit lines of the standard [37].
Vibration monitoring assesses the impact of ground-transmitted vibrations on the building. The selected key parameters recorded with the described monitoring system (peak of acceleration and velocity, WODB index) are presented in Figure 22. Under the standard [37] in force in Poland, the final assessment of the harmfulness of vibrations can be performed by comparing the long-term measurements of the peak values of acceleration or vibration velocity and determining the WODB index on their basis (WODB—vibration perception index by buildings) [37]. The values of the WOBD index are presented as bars in Figure 22.
The values of the designated WODB indicators are compared with the limit values corresponding to the so-called SWD dynamic impact scale. The dynamic impact scale line classifies the vibrations into the following vibration zones: I—negligible, II—harmless, III—harmful, IV—highly harmful, and V—causing damage.
Figure 22 presents the actual values of the WODB indexes obtained by the described measurement system, together with the lines of the SWD dynamic impact scale determined by the standard [37]. The results of the assessment of the impact of vibrations on the building structure allow the conclusion that the vibrations of the building resulting from the construction works carried out during the entire monitoring period oscillated around the boundary line A′, i.e., the vibrations were negligible in the impact assessment of vibrations on the building. Building inspection before and after monitoring confirmed the vibration’s lack of harm. The control also included inventories of internal and external damage to the building under study. No new or spread damage was observed. Indirect confirmation of the effectiveness of the vibration measurement and recording system becomes possible through this method.
The described monitoring system (in various stages of development) has been tested in terms of continuity of operation during construction works of various types. It was used to monitor vibrations of objects during the construction projects described in Table 4.
Table 4.
Summary of selected information on construction works monitored by the developed system.
4. Conclusions
Practical vibration tests are related to rail transport, dynamic soil compaction, explosions, and constructing pile foundations. This paper presented the characteristics of a measurement system that allows for kinematic monitoring of the building structures, which may be damaged because of construction works. The vibration monitoring and reporting system has been repeatedly tested in real conditions, including during piling processes. The example presented at the end of this study proves that the measurement system allows for quick, real control of the vibration values of objects with normative values. The information included here allows to characterise the kinematic impact monitoring system in the following way:
- Data can be accessed in a form recorded directly by the sensors, but the user receives practical information about the compliance of the vibration values with the normative requirements (Figure 22).
- The system user has local and remote access to the recorded results (Figure 3).
- The measurement system combines elements from different suppliers and allows for their smooth cooperation.
- The total cost of the original system (sensors, a data acquisition card, and software) is significantly less than the cost of a closed system provided by recognised vendors of such solutions (e.g., Brüel and Kjær, Svantek).
- The system provides reliable data (confirmed during interlaboratory comparisons) while maintaining high reliability (no downtime tested in applications during field tests).
Author Contributions
Conceptualisation, A.S. and M.H.; methodology, M.H.; software, M.H.; validation, M.H. and M.B.; formal analysis, M.B.; investigation, M.H.; resources, A.S.; data curation, M.H.; writing—original draft preparation, A.S. and B.K.; writing—review and editing, A.S. and B.K.; visualisation, A.S. and M.H.; supervision, B.K.; project administration, M.H. All authors have read and agreed to the published version of the manuscript.
Funding
The research was conducted at the Lublin University of Technology and supported under the FD-20/EE-02/802, FD-20/EE-02/402, FN-5/2023/KMB WBiA, and FN-14 Lublin University of Technology grants.
Institutional Review Board Statement
Not applicable.
Informed Consent Statement
Not applicable.
Data Availability Statement
Not applicable.
Conflicts of Interest
The authors declare no conflict of interest. The funders had no role in the design of the study; in the collection, analyses, or interpretation of data; in the writing of the manuscript, or in the decision to publish the results.
References
- Rahman, N.A.A.; Musir, A.A.; Dahalan, N.H.; Ghani, A.N.A.; Khalil, M.K.A. Review of Vibration Effect during Piling Installation to Adjacent Structure. AIP Conf. Proc. 2017, 1901, 110009. [Google Scholar] [CrossRef]
- Crispino, M.; D’Apuzzo, M. Measurement and Prediction of Traffic-Induced Vibrations in a Heritage Building. J. Sound Vib. 2001, 246, 319–335. [Google Scholar] [CrossRef]
- Hester, J.; Prabhu, S.; Atamturktur, S.; Sorber, J. Remote and Wireless Long-term Vibration Monitoring of Historic Monuments. Procedia Eng. 2017, 199, 3302–3307. [Google Scholar] [CrossRef]
- Pacheco, J.; Oliveira, G.; Magalhães, F.; Moutinho, C.; Cunha, Á. Vibration-Based Monitoring of Wind Turbines: Influence of Layout and Noise of Sensors. Energies 2021, 14, 441. [Google Scholar] [CrossRef]
- Wang, W.; Xue, Y.; He, C.; Zhao, Y. Review of the Typical Damage and Damage-Detection Methods of Large Wind Turbine Blades. Energies 2022, 15, 5672. [Google Scholar] [CrossRef]
- Zhang, H.; Pan, C.; Wang, Y.; Xu, M.; Zhou, F.; Yang, X.; Zhu, L.; Zhao, C.; Song, Y.; Chen, H. Fault Diagnosis of Coal Mill Based on Kernel Extreme Learning Machine with Variational Model Feature Extraction. Energies 2022, 15, 5385. [Google Scholar] [CrossRef]
- Jablonski, A. Hybrid Model of Rolling-Element Bearing Vibration Signal. Energies 2022, 15, 4819. [Google Scholar] [CrossRef]
- Scislo, L. High Activity Earthquake Swarm Event Monitoring and Impact Analysis on Underground High Energy Physics Research Facilities. Energies 2022, 15, 3705. [Google Scholar] [CrossRef]
- Stagg, M.S.; Siskind, D.E. Effects of Blast Vibration on Construction Material Cracking in Residential Structures. J. Perform. Constr. Facil. 2005, 19, 222–228. [Google Scholar]
- Ścisło, Ł.; Guinchard, M. Source Based Measurements and Monitoring of Ground Motion Conditions during Civil Engineering Works for High Luminosity Upgrade of the LHC. In Proceedings of the ICSV26 Proceedings, Montreal, QC, Canada, 7–11 July 2019; pp. 1–9. [Google Scholar]
- Łacny, Ł.; Ścisło, Ł.; Guinchard, M. Application of Probabilistic Power Spectral Density Technique to Monitoring the Long-Term Vibrational Behaviour of CERN Seismic Network Stations. Vib. Phys. Syst. 2020, 31, 2020311. [Google Scholar] [CrossRef]
- Fiala, P.; Degrande, G.; Augusztinovicz, F. Numerical Modelling of Ground-Borne Noise and Vibration in Buildings Due to Surface Rail Traffic. J. Sound Vib. 2007, 301, 718–738. [Google Scholar] [CrossRef]
- Colaço, A.; Costa, P.A.; Amado-Mendes, P.; Godinho, L.; Calçada, R. Mitigation of Vibrations and Re-Radiated Noise in Buildings Generated by Railway Traffic: A Parametric Study. Procedia Eng. 2017, 199, 2627–2632. [Google Scholar] [CrossRef]
- Nagy, A.B.; Fiala, P.; Márki, F.; Augusztinovicz, F.; Degrande, G.; Jacobs, S.; Brassenx, D. Prediction of Interior Noise in Buildings Generated by Underground Rail Traffic. J. Sound Vib. 2006, 293, 680–690. [Google Scholar] [CrossRef]
- Chiliński, B.; Zawisza, M. Analysis of Bending and Angular Vibration of the Crankshaft with a Torsional Vibrations Damper. J. Vibroeng. 2016, 18, 5353–5363. [Google Scholar] [CrossRef][Green Version]
- Kafle, B.; Zhang, L.; Mendis, P.; Herath, N.; Maizuar, M.; Duffield, C.; Thompson, R.G. Monitoring the Dynamic Behavior of The Merlynston Creek Bridge Using Interferometric Radar Sensors and Finite Element Modeling. Int. J. Appl. Mech. 2017, 9, 1750003. [Google Scholar] [CrossRef]
- Nasim Khan Raja, B.; Miramini, S.; Duffield, C.; Chen, S.; Zhang, L. A Simplified Methodology for Condition Assessment of Bridge Bearings Using Vibration Based Structural Health Monitoring Techniques. Int. J. Str. Stab. Dyn. 2021, 21, 2150133. [Google Scholar] [CrossRef]
- Calcina, S.V.; Piroddi, L.; Ranieri, G. Fast Dynamic Control of Damaged Historical Buildings: A New Useful Approach for Structural Health Monitoring after an Earthquake. ISRN Civ. Eng. 2013, 2013, 527604. [Google Scholar] [CrossRef]
- Luzi, G.; Monserrat, O.; Crosetto, M. Real Aperture Radar Interferometry as a Tool for Buildings Vibration Monitoring: Limits and Potentials from an Experimental Study; Ancona. AIP Conf. Proc. 2012, 1457, 309–317. [Google Scholar] [CrossRef]
- Talich, M. Monitoring of Horizontal Movements of High-Rise Buildings and Tower Transmitters by Means of Ground-Based Interferometric Radar. In Proceedings of the International Archives of the Photogrammetry Remote Sensing and Spatial Information Sciences Proceedings of the GeoInformation for Disaster Management (Gi4DM), Istanbul, Turkey, 18–21 March 2018; Volume XLII-3/W4, pp. 499–504. [Google Scholar] [CrossRef]
- Deckner, F.; Viking, K.; Hintze, S. Ground Vibrations Due to Pile and Sheet Pile Driving—Prediction Models of Today; SGF Rapport; Victoria Svahn and Tara Wood: Gothenburg, Sweden, 2012; pp. 107–112. [Google Scholar]
- Chen, A.; Cheng, F.; Wu, D.; Tang, X. Ground Vibration Propagation and Attenuation of Vibrating Compaction. J. Vibroeng. 2019, 21, 1342–1352. [Google Scholar] [CrossRef]
- Athanasopoulos, G.A.; Pelekis, P.C. Ground Vibrations from Sheetpile Driving in Urban Environment: Measurements, Analysis and Effects on Buildings and Occupants. Soil Dyn. Earthq. Eng. 2000, 19, 371–387. [Google Scholar] [CrossRef]
- Richart, F.E.; Hall, J.R.; Woods, R.D. Vibrations of Soils and Foundations. In Prentice-Hall International Series in Theoretical and Applied Mechanics; Prentice-Hall: Englewood Cliffs, NJ, USA, 1970. [Google Scholar]
- Sreekala, R.; Lakshmanan, N.; Muthumani, K.; Gopalakrishnan, N.; Sathishkumar, K. Potential of Vibration Studies in the Soil Characterization Around Power Plants—A Case Study; Missouri University of Science and Technology: Arlington, TX, USA, 2008; p. 8. [Google Scholar]
- Qin, Z.; Chen, L.; Song, C.; Sun, L. Field Tests to Investigate the Penetration Rate of Piles Driven by Vibratory Installation. Shock. Vib. 2017, 2017, 7236956. [Google Scholar] [CrossRef]
- Deckner, F.; Viking, K.; Hintze, S. Wave Patterns in the Ground: Case Studies Related to Vibratory Sheet Pile Driving. Geotech. Geol. Eng. 2017, 35, 2863–2878. [Google Scholar] [CrossRef]
- Homayoun Rooz, A.F.; Hamidi, A. A Numerical Model for Continuous Impact Pile Driving Using ALE Adaptive Mesh Method. Soil Dyn. Earthq. Eng. 2019, 118, 134–143. [Google Scholar] [CrossRef]
- Kim, D.S.; Lee, J. Source and Attenuation Characteristics of Various Ground Vibrations. In Geotechnical Earthquake Engineering and Soil Dynamics III; Amer Society of Civil Engineers: Reston, VA, USA, 1998; pp. 1507–1517. [Google Scholar]
- do Nascimento Setúbal, F.A.; de Souza Custódio Filho, S.; Soeiro, N.S.; Mesquita, A.L.A.; Nunes, M.V.A. Force Identification from Vibration Data by Response Surface and Random Forest Regression Algorithms. Energies 2022, 15, 3786. [Google Scholar] [CrossRef]
- Khoubani, A.; Ahmadi, M.M. Numerical Study of Ground Vibration Due to Impact Pile Driving. Proc. Inst. Civ. Eng.-Geotech. Eng. 2014, 167, 28–39. [Google Scholar] [CrossRef]
- Sofiste, T.V.; Godinho, L.; Costa, P.A.; Soares, D.; Colaço, A. Numerical Modelling for Prediction of Ground-Borne Vibrations Induced by Pile Driving. Eng. Struct. 2021, 242, 112533. [Google Scholar] [CrossRef]
- Yu, A.; Jiang, P.; Lin Wang, Z. Nanogenerator as Self-Powered Vibration Sensor. Nano Energy 2012, 1, 418–423. [Google Scholar] [CrossRef]
- Andò, B.; Baglio, S.; Bulsara, A.R.; Marletta, V. Toward a Self-Powered Vibration Sensor: The Signal Processing Strategy. Energies 2021, 14, 754. [Google Scholar] [CrossRef]
- Meng, Y.; Yang, J.; Liu, S.; Xu, W.; Chen, G.; Niu, Z.; Wang, M.; Deng, T.; Qin, Y.; Han, M.; et al. Nano-Fiber Based Self-Powered Flexible Vibration Sensor for Rail Fasteners Tightness Safety Detection. Nano Energy 2022, 102, 107667. [Google Scholar] [CrossRef]
- Rubes, O.; Chalupa, J.; Ksica, F.; Hadas, Z. Development and Experimental Validation of Self-Powered Wireless Vibration Sensor Node Using Vibration Energy Harvester. Mech. Syst. Signal Process. 2021, 160, 107890. [Google Scholar] [CrossRef]
- PN-B-02170; Ocena Szkodliwości Drgań Przekazywanych Przez Podłoże Budynku. Polski Komitet Normalizacyjny: Warsaw, Poland, 2016.
- SN 640312:2013; Vibrations—Vibration Effects in Buildings. Swiss Standards: Zürich, Switzerland, 2014.
- DIN 4150-3Vibrations in Buildings—Part 3: Effects on Structures, German Institute for Standardisation: Berlin, Germany, 2016.
- UNI 9916:2014; Criteria for the Measurement of Vibrations and the Assessment of Their Effects on Buildings. Italian National Standards Body: Rome, Italy, 2014.
- Monti, G.; Fumagalli, F.; Marano, G.C.; Quaranta, G.; Rea, R.; Nazzaro, B. Effects of Ambient Vibrations on Heritage Buildings: Overview and Wireless Dynamic Monitoring Application; L’Aquila University: Rome, Italy, 2015; Volume 1, pp. 217–229. [Google Scholar]
- Massarsch, K.R.; Fellenius, B.H. Ground vibrations from pile and sheet pile driving. In Proceedings of the International Conference on Piling and Deep Foundations, Stockholm, Sweden, 21–23 May 2014; Volume 1, pp. 131–139. [Google Scholar]
- ISO/IEC 17025:2017; General Requirements for the Competence of Testing and Calibration Laboratories. International Organization for Standarization: Geneva, Switzerland, 2017.
- PN-EN ISO/IEC 17043:2011; Ocena Zgodności—Ogólne Wymagania Dotyczące Badania Biegłości. Polski Komitet Normalizacyjny: Warsaw, Poland, 2011.
- Szcześniak, W.; Ataman, M. Płaskie struktury przegubowe obciążone impulsem siły. Autobusy Tech. Eksploat. Syst. Transp. 2013, 14, 1457–1464. [Google Scholar]


Disclaimer/Publisher’s Note: The statements, opinions and data contained in all publications are solely those of the individual author(s) and contributor(s) and not of MDPI and/or the editor(s). MDPI and/or the editor(s) disclaim responsibility for any injury to people or property resulting from any ideas, methods, instructions or products referred to in the content. |
© 2023 by the authors. Licensee MDPI, Basel, Switzerland. This article is an open access article distributed under the terms and conditions of the Creative Commons Attribution (CC BY) license (https://creativecommons.org/licenses/by/4.0/).