Article

Examining Commercial Crime Call Determinants in Alley Commercial Districts before and after COVID-19: A Machine Learning-Based SHAP Approach

1
Department of Urban Policy and Administration, Incheon National University, 119 Academy-ro, Yeonsu-gu, Incheon 22012, Republic of Korea
2
Urban Science Institute, Incheon National University, Incheon 22012, Republic of Korea
3
Department of Urban Planning and Policy Studies, Incheon National University, 119 Academy-ro, Yeonsu-gu, Incheon 22012, Republic of Korea
*
Author to whom correspondence should be addressed.
Appl. Sci. 2023, 13(21), 11714; https://doi.org/10.3390/app132111714
Submission received: 7 September 2023 / Revised: 6 October 2023 / Accepted: 24 October 2023 / Published: 26 October 2023
(This article belongs to the Special Issue Application of Machine Learning in Data Analysis and Process)

Abstract

:
Although several previous studies have examined factors influencing crime at a specific point in time, limited research has assessed how factors influencing crime change in response to social disasters such as COVID-19. This study examines factors, along with their relative importance and trends over time, and their influence on 112 commercial crime reports (illegal street vendors, dining and dashing, minor quarrels, theft, drunkenness, assault, vagrancy and disturbing the peace) in Seoul’s alley commercial districts between 2019 and 2021. Variables that may affect the number of commercial crime reports are classified into four characteristics (socioeconomic, neighborhood, park/greenery and commercial district attributes), explored using machine learning regression-based modeling and analyzed through the use of Shapley Additive exPlanations to determine the importance of each factor on crime reports. The Partial Dependence Plot is used to understand linear/non-linear relationships between key independent variables and crime reports. Among several machine learning models, the Extra Trees Regressor, which has the highest performance, is selected for the analysis. The results show a mixture of linear and non-linear relationships with the increasing crime rates, finding that store density, dawn sales ratio, the number of gathering facilities, perceived urban decline score, green view index and land appraisal value may play a crucial role in the number of commercial crimes reported, regardless of social trends. The findings of this study may be used as a basis for building a safe commercial district that can respond resiliently to social disasters.

1. Introduction

After the outbreak and unprecedented spread of COVID-19, governments implemented various response policies, and the fear of infection led to structural changes across society, such as suspending inter-city public traffic, closing schools, canceling mass events and encouraging working from home [1,2]. Particularly, several studies have identified a relationship between decreased crime rates and government policies, such as social distancing, globally [3,4,5]. True crime data also speak to this trend, with the average number of crimes decreasing by 5.48% at the end of 2020 compared to 2019 (the year before the outbreak) in Korea. Additionally, crimes in commercial districts decreased by 13.1%, suggesting that the lifestyle changes brought by COVID-19 may have had a direct impact on commercial area crime.
The significance of crime in commercial districts is highlighted by the fact that 55.98% of crimes from 2016 to the end of 2020 were committed in commercial areas [6]. Thus, it is important to study these areas to better understand the factors that influence crime rates and how they change in response to new policies and societal shifts. This is especially important in alley commercial districts, as they are the closest to daily life.
There have been a range of studies investigating and analyzing the causes of crime in commercial districts while considering various factors. Particularly, urban built environment factors (e.g., the number of CCTVs, parks and streetlights, building age), urban greenery characteristics (e.g., the number and size of parks/green spaces) and demographic features (e.g., population density, percentage of foreign residents, elderly population, living population) have been commonly explored as potential crime-influencing factors [7,8,9,10,11,12,13].
Despite the extensive body of work investigating the drivers of urban crime, there are notable gaps in the Korean literature. The first is the study of crime factors at a micro level, such as individual market areas studied through granular crime reports that are able to give a detailed picture of market-specific crime frequency. Most existing research in Korea has predominantly concentrated on examining factors at the administrative district level or larger. Additionally, the specific focus on commercial crime, which constitutes a significant proportion of overall urban crime activity, is largely absent in the current literature. Furthermore, recent variables related to social policies precipitated by the COVID-19 pandemic, which have substantially impacted daily life, are yet to be thoroughly explored as influential factors in the context of commercial district crime.
Therefore, this study aims to examine the factors affecting the number of 112 crime report calls, defined as the number of verified reports officially received at the “112 Emergency Number” reporting center (hereafter, commercial crime reports) before the outbreak (2019), after the outbreak (2020) and after the implementation of strict social distancing rules (2021) in Seoul alley commercial districts to understand the changes in the importance and influence of variables over time. Across the sampled dataset, there were 451,478 total crimes reported in 2019, 542,068 in 2020 and 538,031 in 2021. The crime reports are valuable big data, as they show the interaction between citizens and police at a micro scale and reflect the trend of crime over time. The number of reported calls (crime reports), which has rarely been used in prior studies in Korea, make up our dependent variable [14]. In addition, regression-based machine learning models, as opposed to classification-based models, were employed to identify the importance and non-linear relationship between a diverse set of factors and our dependent variable. We chose to frame our research as a regression problem due to our dependent variable being a continuous variable, making it unsuitable for classification modeling. The findings of this research could be utilized to develop an alternative framework for resilient and more secure commercial districts.

2. Literature Review

2.1. Crime Influencers

The number of crimes has increased rapidly with urbanization, with the phenomenon being more concentrated in urban areas. Previous research has discovered factors that influence crime rates by examining various elements. With regard to socioeconomic aspects, resident/living population, population density, age, the number of foreign residents, income level and land appraisal value have often been used to derive influencing factors [7,11,15,16,17]. Considering resident populations, population density, as well as the number of foreign residents (those holding a resident visa, indicating their intent to remain in Korea for more than 6 months), was analyzed and associated with urban crime in the Seoul metropolitan area, finding that these two variables are positively correlated with violent crimes (murder, robbery, rape, violence and theft) [16]. In a similar study in Korea, which sought to identify the factors that contribute to crime in neighborhood parks, used population features such as population density, the percentage of foreign residents and elderly population [7]. Their results showed that the proportion of foreign residents had a positive relationship with park crime, and the proportion of elderly people had a negative relationship. They further suggested that, as the population becomes larger and more diverse, the violent crime rate becomes lower. Another study used youth, elderly and foreign resident population percentages as demographic characteristics to analyze crime rates, and only the percentage of the elderly population was found to be a significant variable [15].
In the case of studies that utilized land appraisal values to reflect the economic level of an area, they utilized living population and land appraisal value as socioeconomic characteristics and found that land appraisal value was negatively associated with crime [11]. Other researchers found the opposite result for these characteristics, while also finding that nightlife population, defined as floating populations between midnight and 5:00 a.m., was positively related to crime rates [17].
For neighborhood characteristics, studies have often used land use features (e.g., commercial building gross floor area, commercial land use ratio and land use mix index) to identify relationships with crime rates [18,19,20,21], finding that, in particular, commercial floor area had a complex relationship. One study found an insignificant relationship between the proportion of commercial floor area and crime rates [21], whereas another study identified it as a factor that increased the number of crimes [18]. The fear of crime also tends to increase when the land use mix ratio is high [21]. The fear of crime and perceptions are critical when considering crime report rates and frequencies, as they have a strong indirect effect on reports [22,23,24,25].
Studies using parks and greenery characteristics have primarily used per capita park area, neighborhood park area, the percentage of green space and street cleanliness [7,21,26,27,28]. For instance, the orderliness of the street environment and the percentage of greenery were negatively associated with the fear of crime [21,28], potentially having an indirect influence on decreasing reported crime. On the other hand, in the case of studies that utilized park area per capita to identify factors, crimes were likely to decrease as parks and green spaces increased [7,26].
The characteristics of the commercial area were also considered in analyzing factors affecting crime in the areas, but studies that have examined this relationship are quite limited [28,29]. While examining the correlation between the fear of street crime and the physical characteristics of commercial districts, they found that the number of vacant stores and entertainment venues increased the fear of crime [29], potentially increasing the rates of reported crime indirectly. In another study, using the percentage of stores open at night and the percentage of ground floor vacancies, researchers investigated the influence that these variables had on influencing the fear of crime in commercial streets and discovered that both variables had a positive relationship [28].
Recent studies have examined the relationship between urban attributes, zones and crime, contributing to a nuanced understanding of the subject. Ref. [30] investigated the impact of mixed land use on violence and property crime in neighborhood block groups, focusing on the presence of criminogenic facilities and sociodemographic conditions. The study found that mixed land use could reduce property crime, whereas violent crime was influenced by mixed land use in adjacent areas. On a different note, ref. [31] explored the spatiotemporal influence of urban features on crime risk by proposing a distance-aware risk signal function. Their approach aimed to improve the accuracy of spatial influence analysis by considering the actual distance between crime events and urban features in an area. They identified a relative change in risk intensity and strength around certain urban features, such as gas stations, particularly in disadvantaged areas during late-night hours and weekends. Last, another study, ref. [32], introduced a novel method to analyze crime incident data, which are characterized by high spatial and temporal resolutions, to identify spatiotemporal crime patterns across Greater Manchester in 2016. This methodological advancement aimed to address challenges posed by unidirectional temporal effects in spatial data pooled over time.
These studies emphasize the significance of exploring crime in commercial districts, particularly in light of the societal changes induced by the COVID-19 pandemic. The findings from these studies may provide insightful references, as this research endeavors to examine micro-level crime-influencing factors in Seoul’s alley commercial districts, especially across different temporal phases of the pandemic. Through employing advanced regression-based machine learning models, this research aims to identify the importance of and non-linear relationship between diverse factors and crime, offering a more granular understanding of crime dynamics in commercial districts.

2.2. Distinction of This Research

Most previous studies on crime in Korea have focused on the physical aspects of the city as a whole. The majority of research has found similar results for factors influencing crime/the fear of crime by utilizing demographic and built environment factors, such as population density, foreign/elderly populations, income level and park features. However, existing studies have generally conducted their analyses only on a specific period (e.g., a certain year in which an accident occurred), and thus, there is a lack of research on how factors influencing crime have changed in response to social disasters such as COVID-19. Furthermore, as noted in existing theories of criminal behavior (such as the broken window theory), criminal behavior is influenced by the perceived degree of spatial awareness, yet there is a lack of research assessing the perceived aspects of crime in the literature. Therefore, the distinction of this study is as follows.
First, we sought to identify changes in crime impact factors over time, focusing on the period of the COVID-19 outbreak and the implementation of social distancing policies. Unlike previous studies that analyzed factors only at a specific point in time, this study has novelty in that it divides the analysis into three periods: before and after COVID-19 (2019, 2020) and after the implementation of social distancing measures (2021) to understand the changes affecting crime according to social trends.
Second, compared to prior research that primarily considered the physical aspect of commercial areas, this study examines the factors affecting the occurrence of crime by considering the green view index (GVI), representing the perception level of visitors, and the Mu-score, an alternative approach to show the degree of perceived urban decay.
Third, because eight types of commercial crime reports (112 Emergency Number reported crime call data; illegal street vendors, dining and dashing, minor quarrels, theft, drunkenness, assault, vagrancy and disturbing the peace) were used rather than the five major violent crimes (murder, robbery, rape, assault and theft) used in most studies of crime factors, it was possible to analyze crime that is more specifically related to commercial areas, which is largely composed of misdemeanors and not included in the main datasets (i.e., five major violent crimes data). In addition, commercial crime report data may more specifically identify/count the location of crimes and reflect more detailed crime types. As such, although prior studies have focused on the borough and administrative district level, this study’s data are better able to look at the commercial district level, giving a more granular view of trends.
Finally, unlike previous studies that used basic regression analysis to identify influencing factors, this study adopts more advanced regression-based machine learning models to assist in identifying the importance of influencing factors. Simple regression analyses are limited in their ability to suggest the importance of influencers that should be prioritized for crime prevention. Thus, the importance of crime-influencing factors, as well as the non-linear relationships between diverse variables and crime, can be identified through this study.

3. Research Methodology
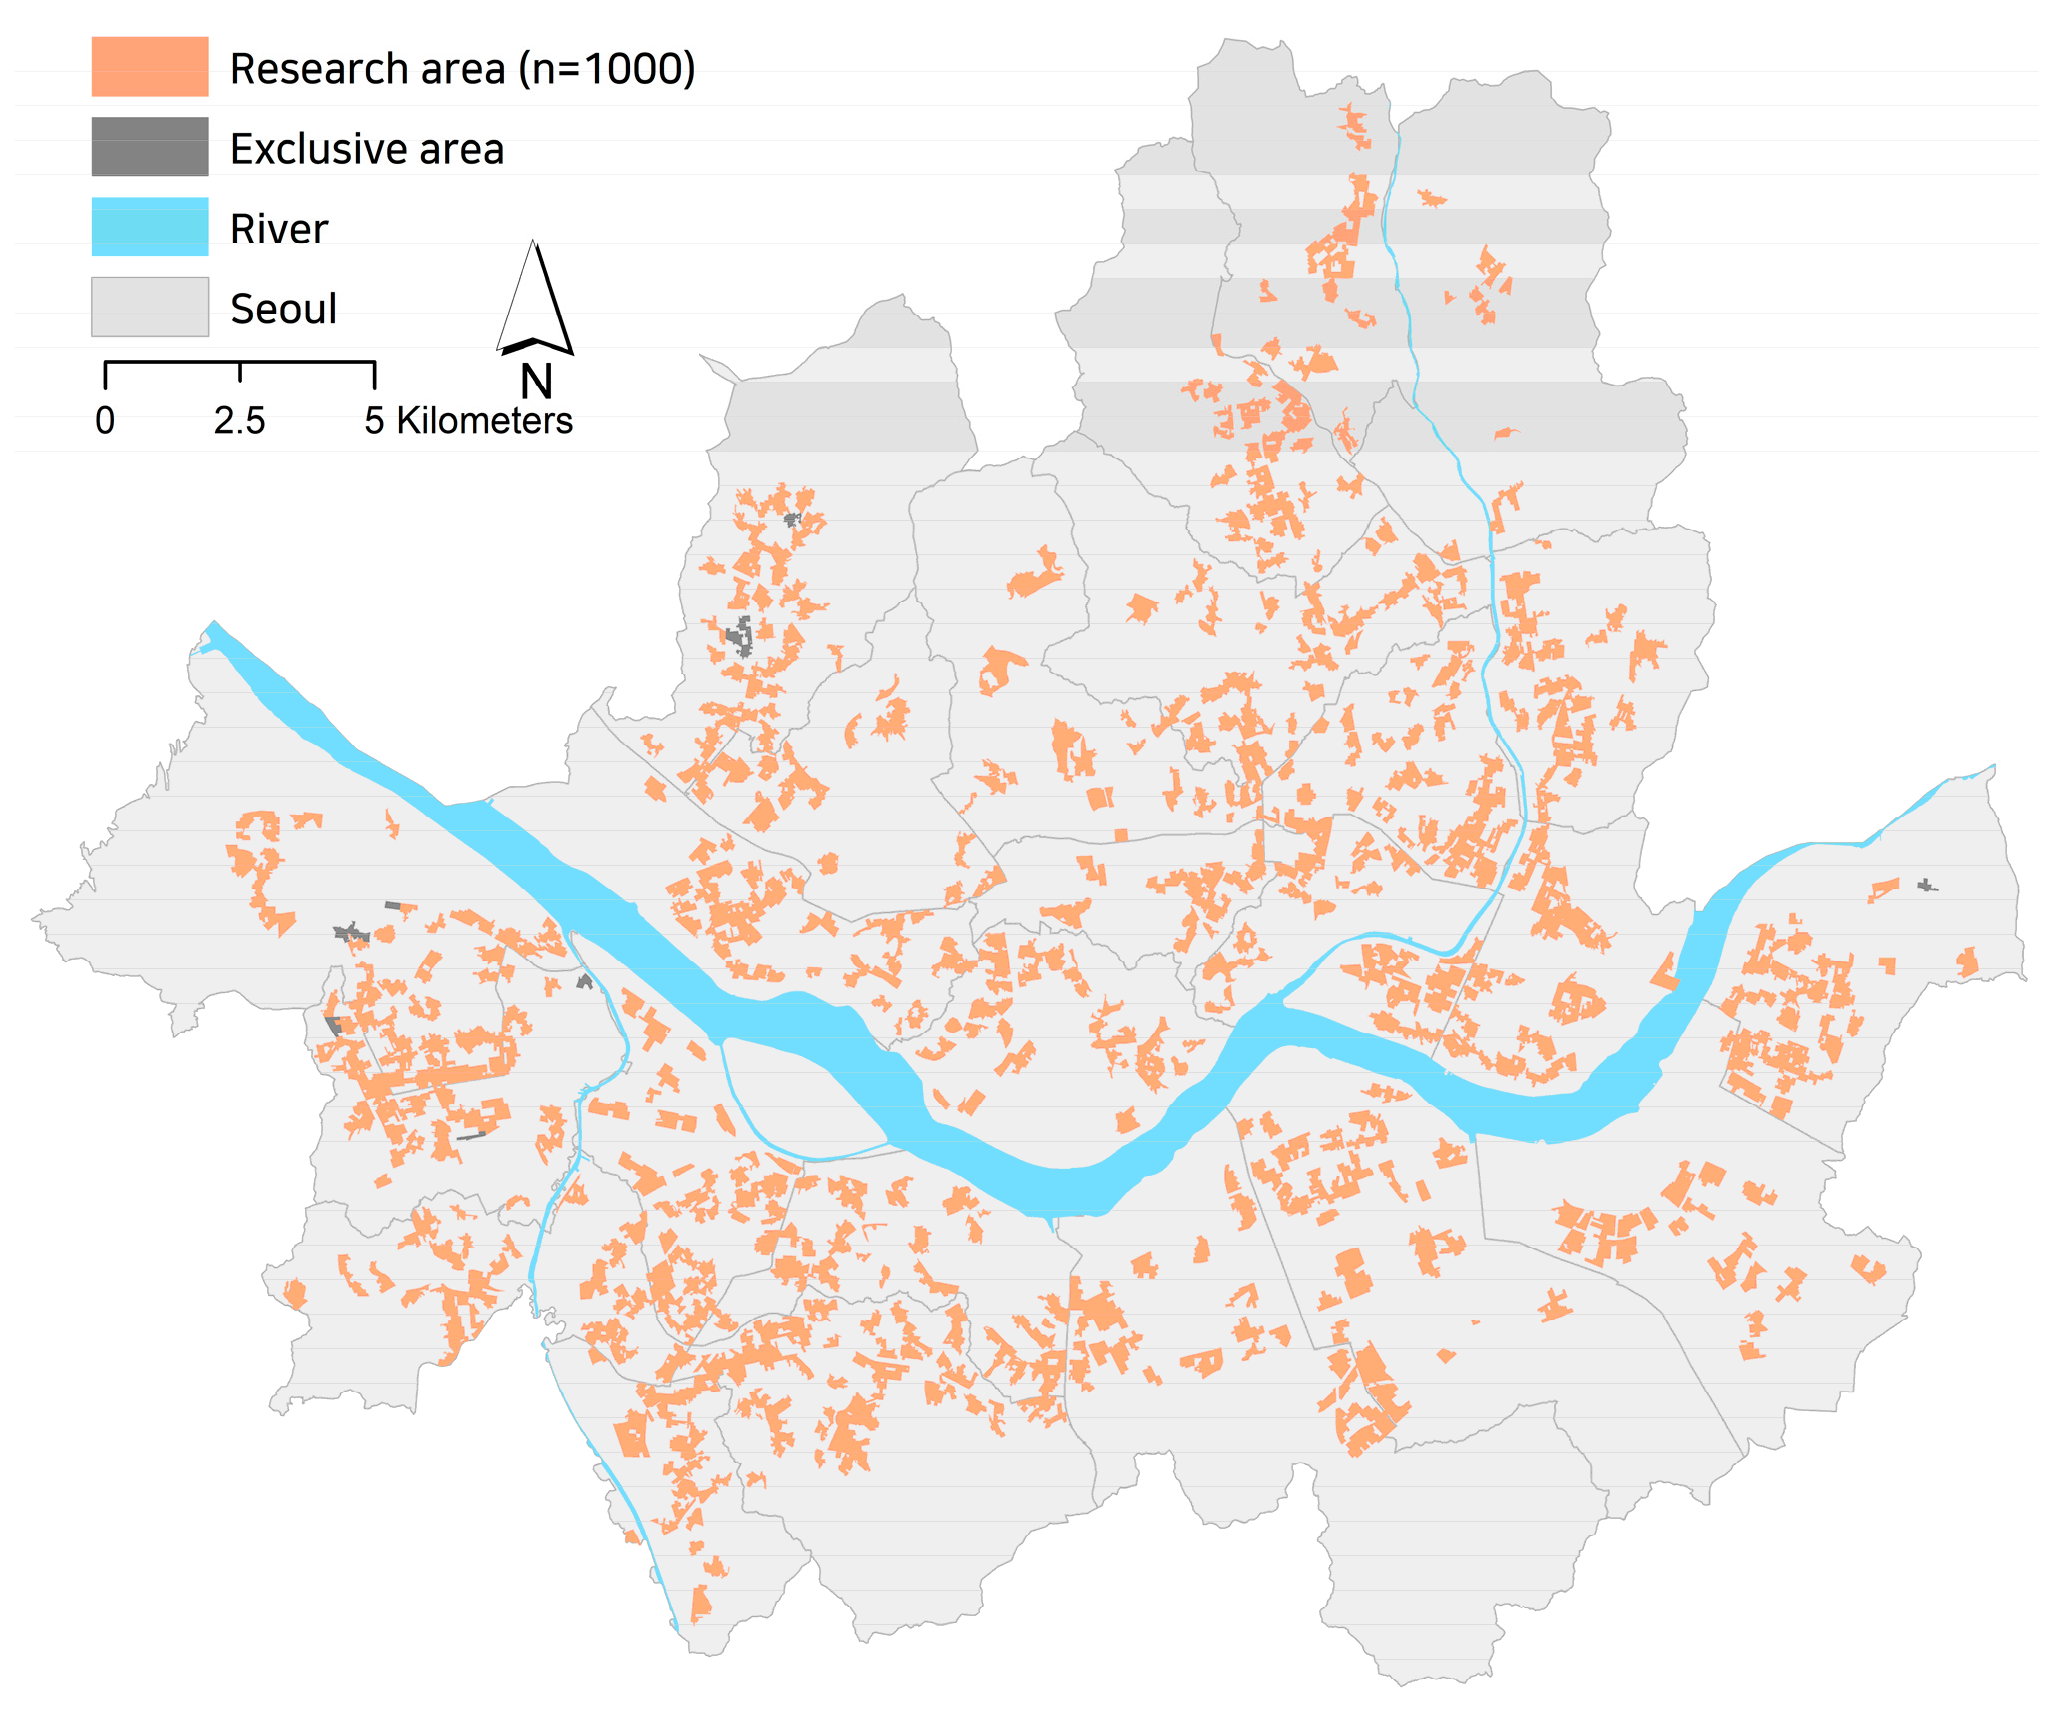
3.1. Study Area

The temporal context of this study is divided into three periods: 2019 (before the COVID-19 outbreak), 2020 (right after the outbreak) and 2021 (after the implementation of social distancing). Although commercial districts in Seoul have been classified into four types (developed, alley, traditional and tourist-oriented commercial districts), this study uses alley commercial districts as a study sample since they often represent the conditions of the local economy.
Developed commercial districts are characterized by expensive rents and large floating populations compared to other types of commercial districts and are occasionally used as an indicator of the regional economic level. On the other hand, alley commercial districts are densely packed with housing and life-oriented businesses, which are closely related to the local economy. Thus, 1010 alley commercial districts in Seoul, which account for the largest proportion of all commercial districts and show different consumption patterns due to their nature locational characteristic that is closely connected to the commercial hinterland, are selected as our target study area [33]. Although the commercial crime report density (number of 112 Emergency Number reports per commercial district area (m2)) is used as the dependent variable, 10 commercial districts had missing data, making them unsuitable for analysis, and were consequently dropped from the dataset, leaving a total of 1000 alley commercial districts selected as the final sample (Figure 1).

3.2. Data Collection
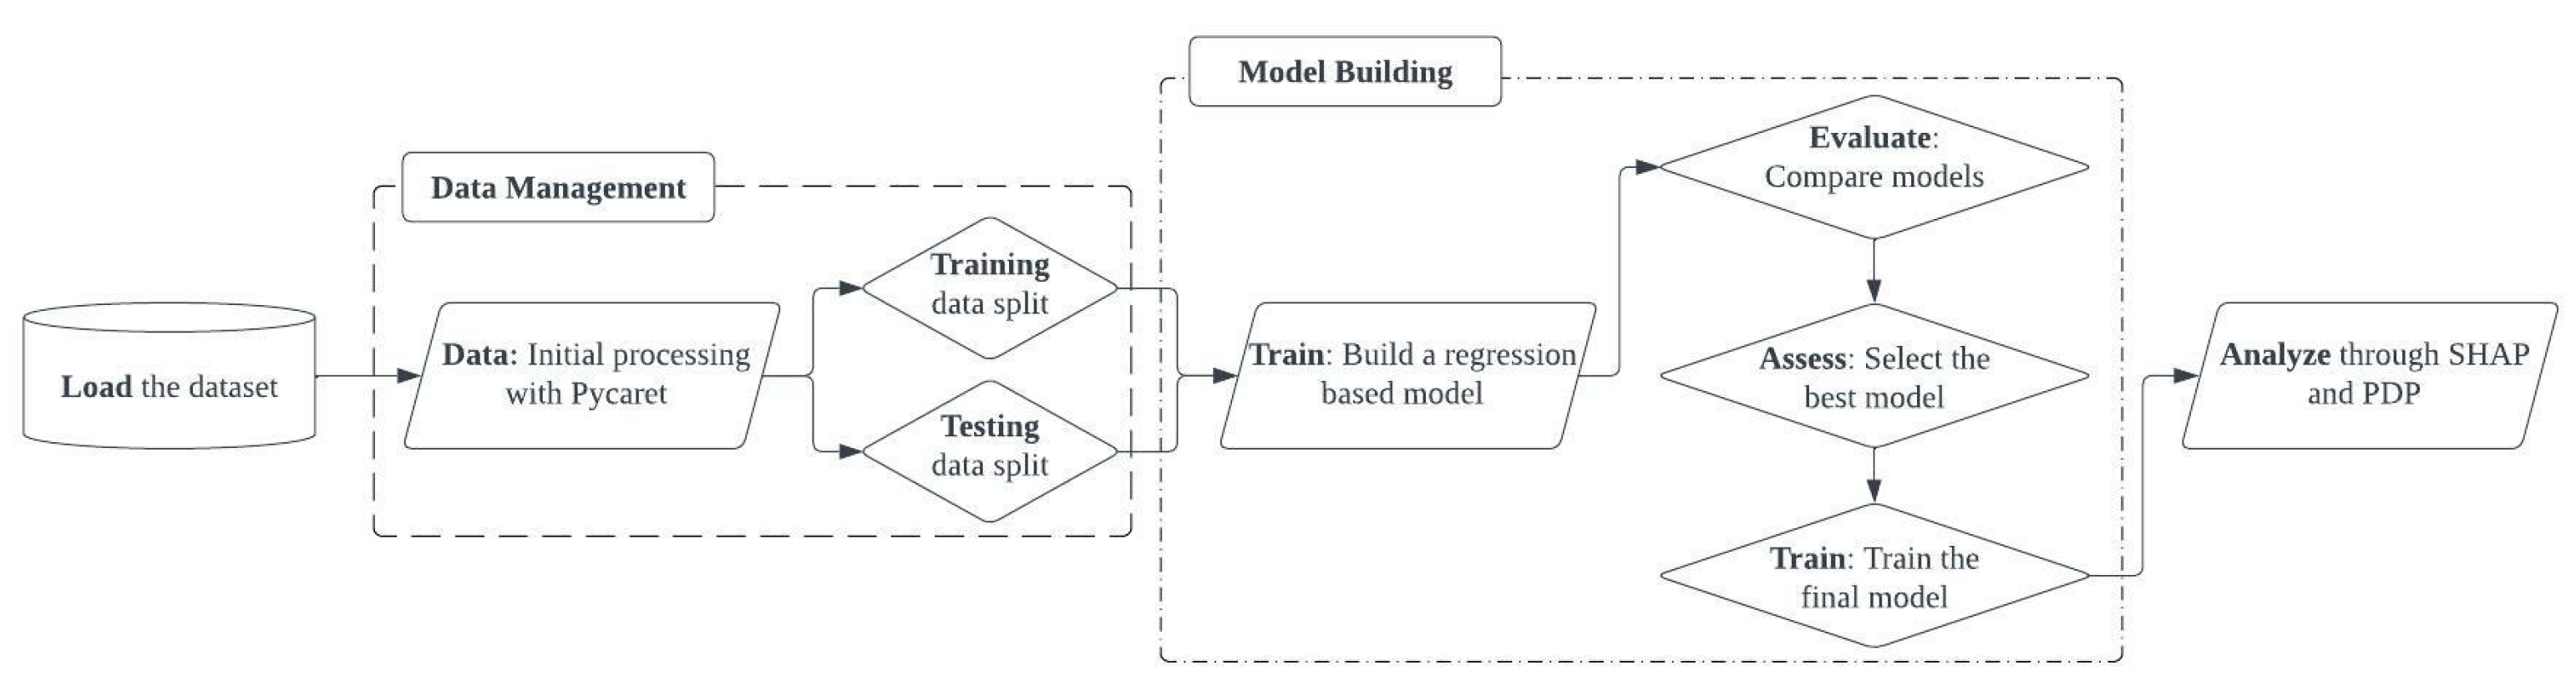
The dependent variable, commercial crime report density, is the number of commercial crime reports from each year divided by the area of their respective commercial districts. This normalization is performed in order to account for the variations in size among the commercial districts. These data were obtained from the Korean National Police Agency’s Smart Policing Big Data Platform. While collecting the data, we excluded crimes deemed insufficiently related to commercial areas, as well as murder, voice phishing, economic crimes and suicide, for which the type of occurrence could not be specified. By considering prior studies, eight types of crimes (illegal street vendors, dining and dashing, minor quarrels, theft, drunkenness, assault, vagrancy and disturbing the peace) are categorized and considered commercial-related crimes [33,34].
Commercial crime report data are different from the real crime statistics provided by the National Police Agency, predominantly focusing on five major crimes, and are more suitable for identifying trends in commercial crime, mainly consisting of minor crimes [35]. In addition, commercial crime report data are useful in examining changing patterns of crime occurrences over the course of a year in detail, and the actual crime statistics data are published only as the total number of crimes that occurred during the year.
Independent variables were collected based on the features of each variable, which were classified into four characteristics that can affect the crime, and a total of 18 variables were utilized. For socioeconomic features, living population, youth sales ratio, middle-aged sales ratio, elderly sales ratio and land appraisal value were considered. Living population is a concept that encompasses resident and floating populations, including not only those who live within the commercial district but also those who visit the area for daily activities, such as education, work and other activities that generate administrative demand [36]. Living population data were collected and estimated based on the SK Telecom annual averages [37]. Based on a study that identified that the number of crimes may be impacted by different age usage, we employed three different age groups’ average sales ratios [15]. Age groups are defined as 20–30 s (youth), 40–50 s (middle-age) and over 60s (elderly). Land appraisal value represents the economic level of a specific commercial district, and the data were obtained from the Individual Land Appraisal Value by using the median value of each commercial district.
Neighborhood features include the commercial land ratio, land use mix index, commercial-to-housing ratio and the number of gathering facilities. The land use mix index was calculated by dividing the natural logarithm of the sum of four land use area ratios (residential, commercial, industrial and green spaces) by the total number of land uses. For example, when the area is fully covered by residential areas (100%), the value is 0. If an area has equal proportions of all land uses, the value is 1. Thus, a higher index indicates an area with more complex land uses. The commercial-to-housing ratio was derived by dividing the percentage of commercial building areas by residential building areas. Gathering facilities are the number of theaters and educational institutions within a commercial district, which induce the floating population to increment in shopping areas.
Regarding park/greenery features, the number of neighborhood parks, children’s parks and small parks within 400 m of each commercial district were used. Moreover, the green view index (GVI), representing the greenness rate of an area, was considered one of the park/greenery features. The GVI was calculated by using the Treepedia model, an object recognition computer vision technique, to measure the amount of street greenery in the image. For each commercial district, Google Street View (GSV) images were taken for every 20 m of road, and the average greenery percentage of all images was quantified as a value between 0 and 100. As the value increases, the percentage of greenery that is cognitively perceived by visitors in the commercial district also increases [38,39]. However, since the GVI simply derives the percentage of greenery in the image, we also considered the number of parks in the hinterland of the commercial district to be included in the level of park greenery in the commercial district.
Finally, commercial district features include store density, closure rate, commercial district size, dawn sales ratio and Mu-score. Variables were utilized to identify changes in crime opportunities in commercial areas, reflecting the changing nature of commercial districts due to COVID-19 and social distancing. In particular, the dawn sales ratio was used because crimes are mostly reported from midnight to the early morning. The Mu-score represents the degree of perceived deterioration, measured according to how much citizens recognize an area. It was measured by utilizing the results of a perceived decline survey of 3000 urban residents through GSV images. A deep learning model was trained using the survey scores, and the final predictive score (Mu-score) was derived using the average image score for each commercial district to build the perceived urban decline level.

3.3. Data Analysis

The modeling methodology of this study is separated into four main stages, applied individually to datasets for the years 2019, 2020 and 2021 (Figure 2). The process begins with loading the specific year’s dataset and standardizing the dependent variable, representing crime reports, by the market district’s size. The data are then processed using the PyCaret library [40] and split into training and testing subsets at a 70/30 ratio, laying the groundwork for the subsequent model-building phase.
PyCaret is an open-source machine learning library in Python used to streamline the modeling process. PyCaret offers an efficient and easy-to-use environment for carrying out various tasks in the data analytics pipeline, including data preprocessing, feature selection, model selection and hyperparameter tuning, among others. Its automated workflows save computational time and resources, allowing for a more robust and comprehensive exploration of the model space. Furthermore, PyCaret’s compatibility with multiple machine learning algorithms and its seamless integration with other Python libraries, such as scikit-learn, XGBoost and LightGBM, offer a high level of flexibility and customization, as demonstrated in previous research [41].
In the model-building stage, the model is trained, compared, assessed and finalized using PyCaret, selecting the model that best reflects the underlying data patterns. The concluding analysis of the model’s results employs SHAP plots to visualize feature contributions and PDP plots to examine target response relationships. By applying this pipeline to each year’s dataset, the study achieves a consistent and methodical approach that aligns with the research objectives. This robust framework provides a replicable and insightful understanding of the data’s complexities.

3.4. ML Model Building and Selection

Several studies have adopted various ML approaches to identify and diagnose the impact of COVID-19 [42,43]. To understand the factors impacting crime reports, we employed regression-based machine learning models. These models utilized our selected 18 variables to predict the density of crimes reported. To accomplish this task, PyCaret, an open-source Auto ML tool, was used as the modeling platform [40]. A significant advantage of PyCaret is its capability to generate a broad spectrum of models, enabling us to identify the one with the most robust performance.
To compare the differences in features across three years (2019, 2020 and 2021), the dataset and model-building process were separated by each year. Below is a breakdown of the PyCaret model setup, conducted for each year.
setup(dataset, target = ‘commercial crime reports density’, session_id = 123)
In this configuration, the dataset, comprising our dependent and independent variables, is input. The target is specified as our dependent variable (“commercial crime reports density”), and a session_id is passed to ensure replicability.
Following the construction of the models, we executed the PyCaret function below to assess the models’ performances.
best_model = compare_models()
This produced 18 distinct models for each year, with each accompanied by goodness-of-fit metrics. For presentation purposes, only the top five highest performing models are presented by considering the R-squared (R2), Root-Mean-Square Error (RMSE) and Mean Absolute Percentage Error (MAPE).

4. Results and Discussion

4.1. Descriptive Statistics

Across the sampled dataset, there were 451,478 total crimes reported in 2019, 542,068 in 2020 and 538,031 in 2021. The dependent variable, commercial crime report density, was calculated as the reported 112 calls per commercial area (m2). We chose to find the density of 112 calls in commercial areas in order to better control variations in the size of the market areas. As shown in Table 1, the average (mean) commercial crime report density across all sampled commercial market districts (n = 1000) of the pre-COVID-19 era (2019) was 0.00134, and the post-COVID-19 (2020) average was 0.00137, indicating that crime calls increased right after the outbreak. However, when social distancing was tightened, the average of 2021 reduced to 0.00130.
Among the socioeconomic features, the average living population across all commercial districts continuously decreased from about 2.84 million (2019) to 2.74 million (2021). This can be explained by the implementation of social distancing, which accelerated telecommuting, virtual classes and remote working. For land appraisal value, the average of the median value of each commercial district was used, and the growth of the real estate market led to consistent increments over time.
Regarding neighborhood features, the land use mix index was 0.13 for all years, and the average number of gathering facilities was 12.28 until 2020 but decreased to 9.58 in 2021. The commercial-to-housing ratio was about 86.83% in 2019, and it slightly decreased in 2020 (83.28%) and rebounded to 88.01% in 2021.
In terms of park/greenery features, alley commercial districts tend to be closer to children’s park rather than neighborhood and small parks. The average GVI was approximately 17.47%. Considering that the maximum value is 100%, we may capture that the study area’s street greenery rate is relatively low.
With respect to commercial district features, store density within the study area seems to be quite low, with a value of 0.13. The closure rate ranged from 2.34 to 2.80, indicating that stores within the alley commercial district did not close significantly during the study period. The dawn sales ratio, however, diminished constantly from 6.15 to 2.49, with a substantial decrease in 2021. Finally, the Mu-score, a variable that specifies the degree of urban decline from a perceptual point of view, indicates that, as the value increases, the number of visitors who perceive the commercial district as decayed also increases. The study area’s Mu-score was about 7.74, indicating a relatively high degree of perceived urban decline.

4.2. Machine Learning Models
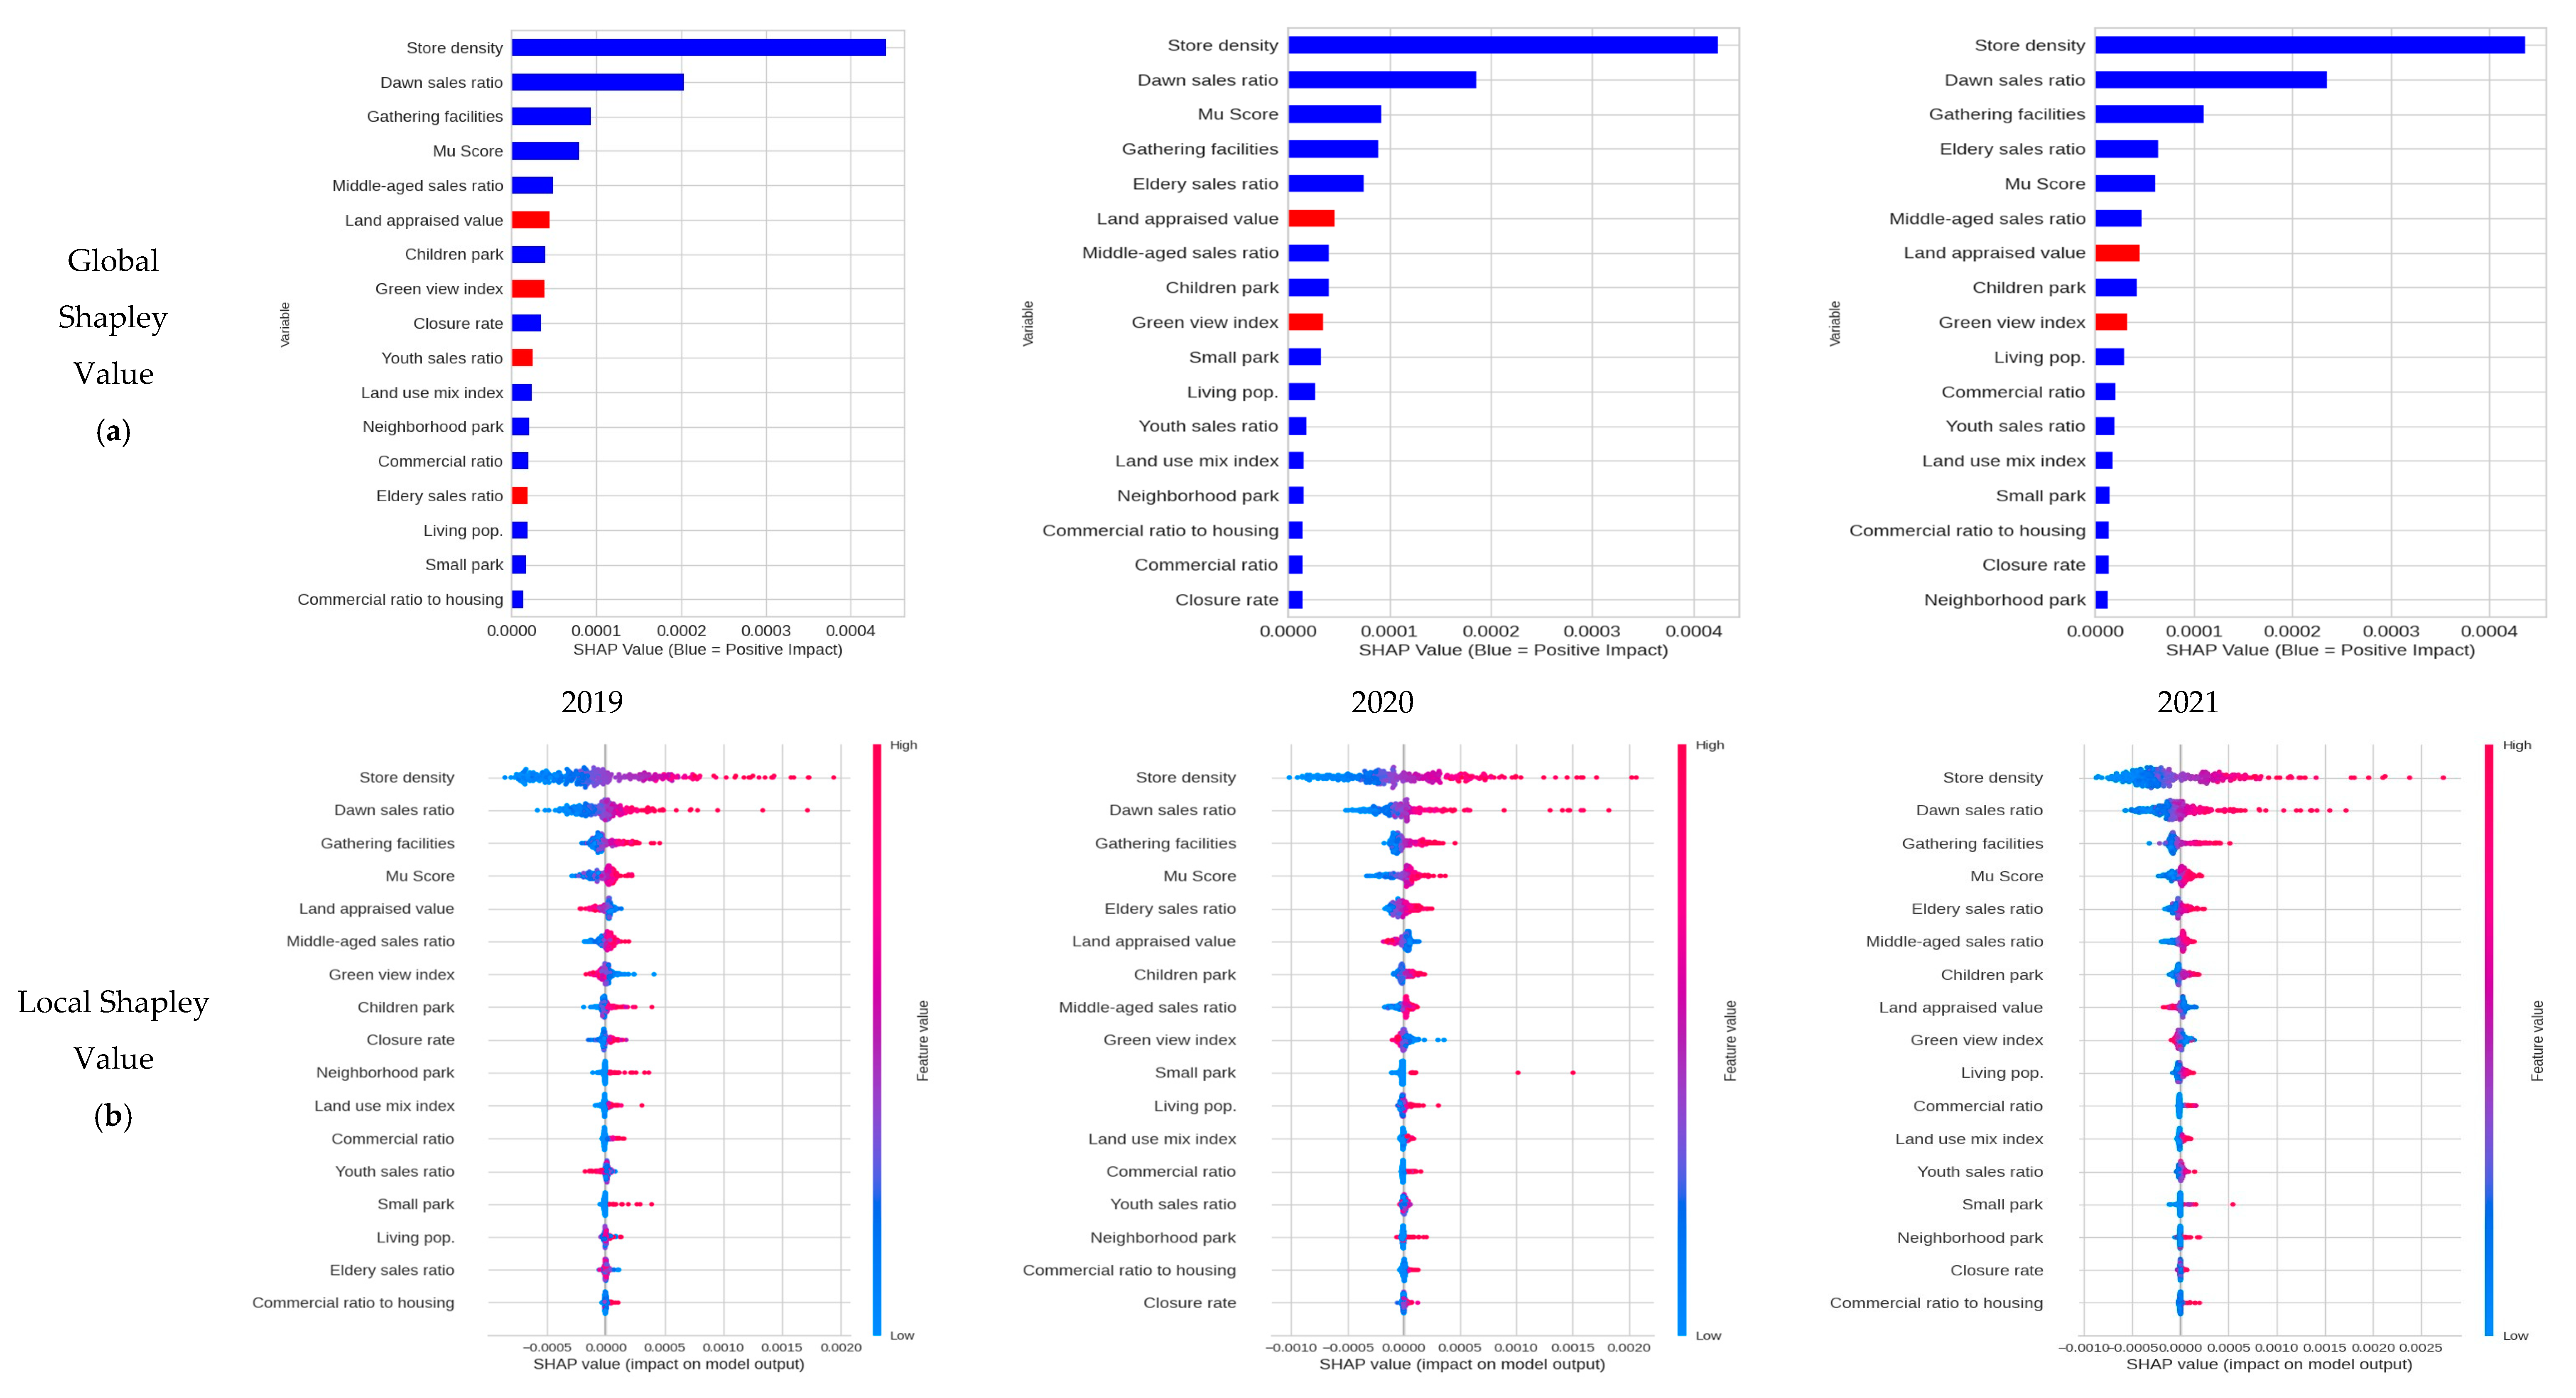
The training dataset for the ML model used in this study consisted of 70% (n = 700) of the 1000 total commercial districts, and 30% (n = 300) were employed as the testing dataset. The training data were then used to model three different years. From the derived model, the dependent variable, the number of crime reports per commercial area, of the test dataset was predicted. As mentioned in Section 3.3, the best-performing model was selected for our final model. Among several ML models assessed, the top five highest-performing models, along with our benchmark model (linear regression), are shown in Table 2.
The training results show that the Extra Trees Regressor had the highest performance among the five models in 2019, with an R2 of 0.4626. The difference in RMSE, a measure of how close each model’s predictions are to the true value, was negligible for all models. Although the MAPE, which describes the performance of the regression model, indicated that the Random Forest Regressor performed the best, the difference was minimal compared with the Extra Trees Regressor. Since the Extra Trees Regressor had a relatively high explanatory power, this model was chosen.
The 2020 model training results also demonstrate that the Extra Trees Regressor had the highest explanatory power of 43.61%. RMSE values were the same for all models, and Bayesian Ridge had the lowest MAPE with a value of 0.4421, even though the difference from other models was not significant. Thus, the model that had the highest R2 (Extra Trees Regressor) was adopted for this year.
The Extra Trees Regressor’s R2 was also the highest in the 2021 model training results, whereas no differences exist for RMSE. In MAPE, every model received a value lower than 0.5, but the Random Forest Regressor yielded the lowest value of 0.4273.
Overall, the optimal model for 2019 and 2020 was the Extra Trees Regressor, and the Random Forest Regressor was the optimal model for 2021. However, using a different model for 2021 alone would likely reduce the reliability of year-to-year comparisons. The Extra Trees Regressor model, which continuously performed well across all years, is an extreme randomized machine learning method that is constructed on similar principles to the Random Forest Regressor but is comparatively superior in terms of speed and model performance [44]. Therefore, we selected it as our final model to better compare three different years.

4.3. SHAP

The Global Shapley Value (GSV) and Local Shapley Value (LSV), derived from the Extra Trees Regressor model, were used to determine the importance of each variable for the crime calls. In the subsequent visualization, mean absolute SHAP values (GSV) are used to delve deeper into the influence of each feature. As depicted in Figure 3a, the mean absolute SHAP value for every feature is presented and ranked by impact. Additionally, the average trend that each feature has on the outcome is indicated, with blue signifying an increase in the number of crimes reported and red denoting a decrease. For the interpretation of LSV, a position of 0.0 on the x-axis implies no substantial link between the outcome variable and the features. Data points to the left of this mark negatively influence the prediction, whereas those to the right enhance it [45].
The GSV results depict that all variables had a smaller impact on crime reports as we move into 2021, although their influence varied significantly (Figure 3a). Specific variables emerged as highly influential in predictions from 2019 to 2021. In particular, store density exhibited the most significant impact, followed by the dawn sales ratio, number of gathering facilities, Mu-score, elderly sales ratio and land appraisal value. Upon considering the most influential factors for each year, the order and direction of influential factors are slightly changed. The elderly sales ratio had a negative relationship with crime in 2019 but turned positive after 2020. In addition, the significance of the Mu-score slightly dropped in 2021 (from third place to fifth place). The importance of the middle-aged sales ratio also scarcely increased in 2021 by flipping positions with the land appraisal value. Moreover, land appraisal value and elderly/youth sales ratios had a negative influence in 2019, and only GVI and land appraisal value showed negative and moderate influences on crime report dynamics after 2020.
When delving into each feature, the living population under the socioeconomic characteristics continuously had a positive association with the commercial crime report density. This is consistent with earlier research that suggests that crime is related with population contact, with more crowded places having higher crime rates owing to increased interpersonal contact [46]. The result, however, differs from the findings of [33], which suggest that an excessive floating population leads to a surveillance effect that causes multiple people to monitor their surroundings. This disparity may be attributable to the unit of population employed in this study. The living population here includes both floating and resident populations. Interestingly, the importance of the living population increased after the outbreak, but its magnitude has not significantly changed over time. Although the LSV results are more evenly distributed over each year, the red dots are more scattered on the right, indicating a positive and linear association with crime reports. As mentioned above, the elderly sales ratio turned positive after the outbreak of COVID-19. From this result, we may assume that elderly visitors acted as natural surveillants and diminished crimes before the pandemic [15]. However, as the outings of vulnerable elderlies reduced significantly after the outbreak, small alley commercial districts became emptier and more susceptible to crimes. The LSV of the elderly sales ratio seemed to have a more positive and linear relationship with crime, whereas the youth sales ratio appeared to have a non-linear association.
Neighborhood features tended to have lower importance on crime, with the number of gathering facilities found to be noteworthy, and continuing to grow over the years with a standardized SHAP value near 0.0001. Despite the fact that the implementation of social distancing limited the usage of these sites, crimes are likely to occur near commercial districts where inhabitants congregate. A high degree of mixed color for the LSV exhibits that a non-linear relationship exists with the dependent variable.
Among park/green space characteristics, the GVI consistently showed a negative impact on crime, implying that areas with more green street views negatively influenced crime reports. This result complies with previous studies that have found that urban green spaces play a facilitating role in minimizing crime [47,48]. In addition, the LSVs depicted a negative linear relationship. Regardless of the type of park, the number of parks near the commercial districts was positively associated with crime reports, and children’s parks had the highest influence. Their impact, however, was minimal compared to other variables.
Regarding commercial district elements, the Mu-score was found to have a significant positive effect over the study area, which follows prior research that has shown that the occurrence of crime is related to the level of commercial district deterioration [49]. This is also consistent with the broken window theory, by which decayed commercial districts cause visitors’ moral laxity. Furthermore, because the impact of the Mu-score intensified after the epidemic, regulating the street and surrounding landscape environment may be considered one of the main priorities in developing crime-free commercial districts. The LSV result showed a fairly clear linear relationship with crime. Store density, which was found to have a substantial influence in all years, had the greatest total impact, as expected, because more stores offered more possibilities for crime. The dawn sales ratio also showed a significant relationship with crime. Since this is the time of day when visitors’ natural surveillance efficiency is diminished, this fact seems to be reflected in the model’s performance. In the case of the closure rate, the importance decreased sharply after 2020. This can be deduced from the fact that the average number of stores closing down due to the economic impact of COVID-19 decreased the overall vitality of alley commercial districts.

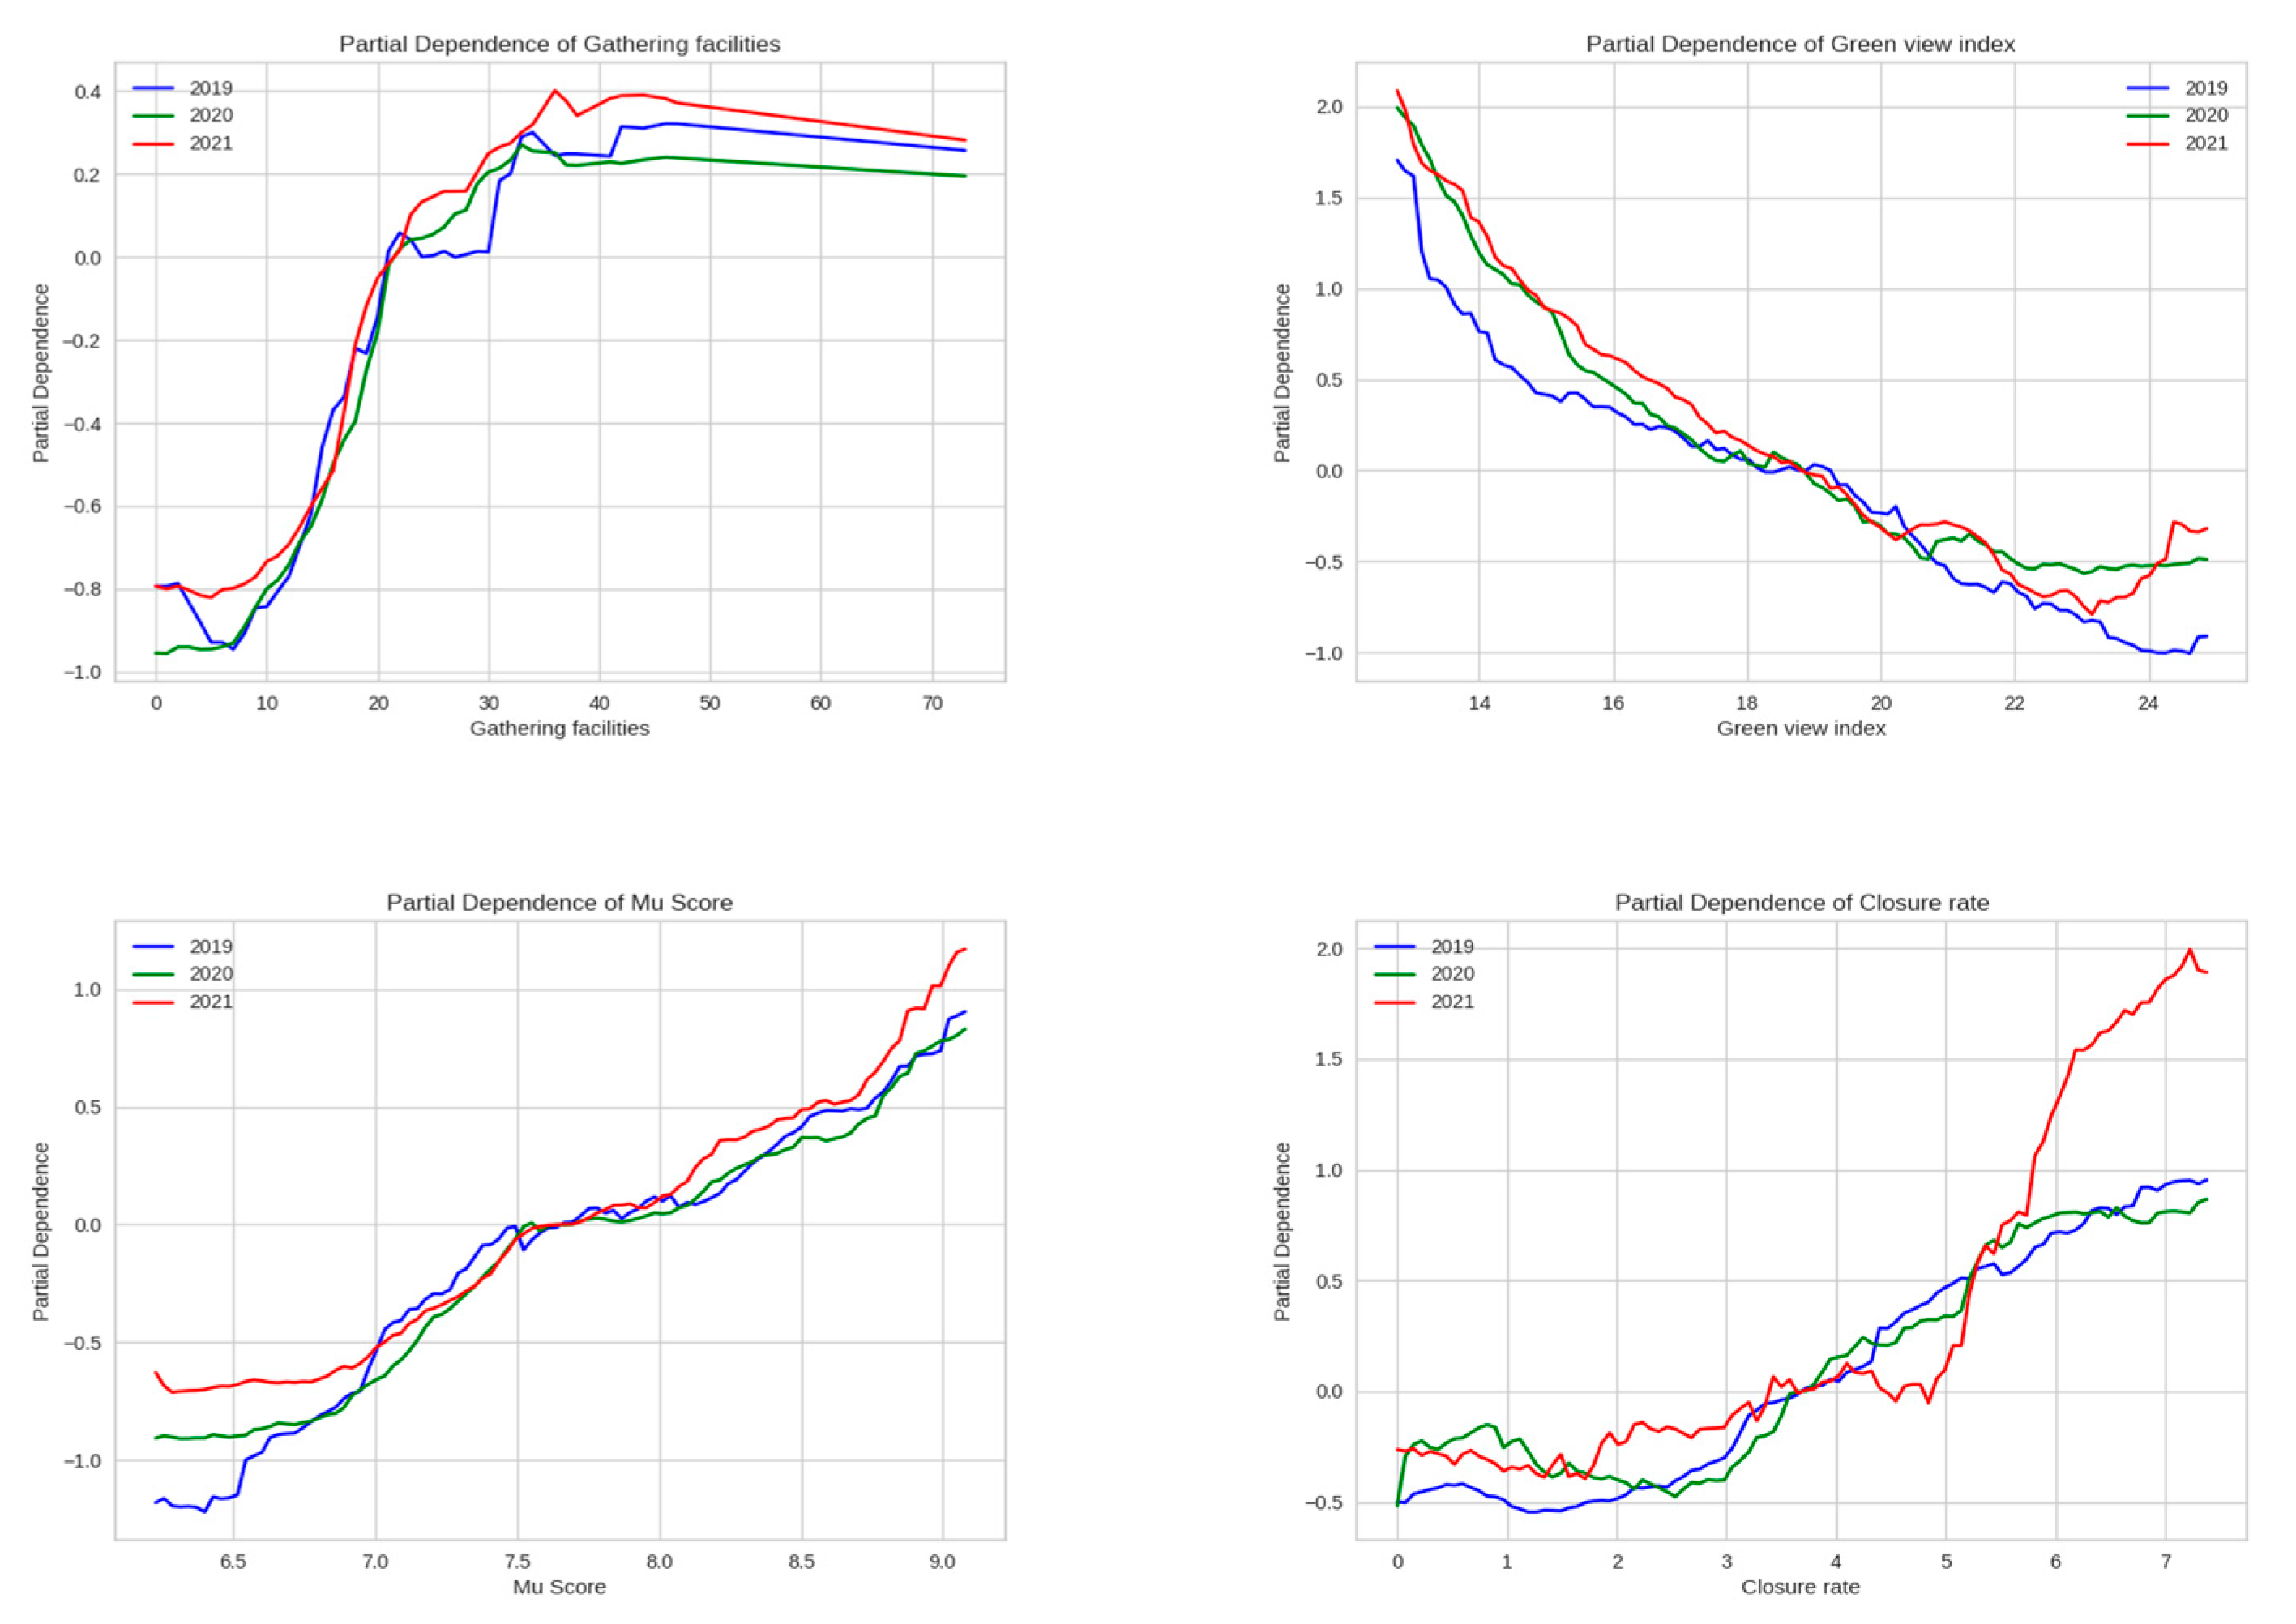
4.4. Partial Dependence Plot

PDPs were employed to elucidate the effect of individual predictors on the dependent variable by using the Extra Trees Regressor (Figure 4). The x-axis displays the value of independent variables, and the y-axis represents the normalized value of the number of crime reports per area. The PDPs in this study were generated based on the LSV results, which had a mixture of colors near 0, meaning that a non-linear relationships may exist between the selected predictors and the outcome.
Within the socioeconomic features, the living population and youth sales ratio showed relatively high importance. The living population mostly showed a linear relationship with the number of crime reports per area over the years. In 2019, there was a downward trend in crime calls until the living population surpassed two million. However, it continued to expand after that, with a significant increase when it exceeded four million. After the COVID-19 breakout in 2020, the growth slope became relatively mild, and crime calls almost fell to half of that in 2019 in 2021. This finding leads us to the conclusion that safety measures should be presented in each commercial district in accordance with the living population, as opposed to uniform options from the central government. On the other hand, the youth sales ratio had a clear non-linear relationship with crime calls. For all three years, crime reports reduced to 30% and sharply increased, reaching up to about 42%. After that, crime reports rapidly decreased, and the dropping rate was relatively small in 2021. This tells us that crimes are positively correlated, particularly when the youth sales ratio is between 30 and 42%. Thus, preventative policies are suggested for certain commercial districts for those that frequently exhibit similar youth sales patterns. Although the PDP was not shown for the land appraisal value due to its obvious linear association with crime, crime reports decreased as the land appraisal value grew over all years. This is in line with earlier research, which showed that crime rises with wealth disparity, suggesting that more affluent communities are less likely to experience property crimes such as burglary and carjacking [50].
Among neighborhood characteristics, all three years of the commercial-to-housing ratio showed a similar trend. Crime calls increased as the ratio exceeded 150%. Particularly, relatively fewer crime calls were reported when the commercial-to-housing ratio was around 25% or less in 2020, and this indicates that crimes decreased in commercial districts with a high residential proportion after COVID-19. The social atmosphere of refraining from going outside due to the fear of infection after the outbreak made commercial districts with a higher proportion of housing have fewer visitors and may have reduced the crime occurrence. In 2021, there was an increase in trips to commercial districts near residential neighborhoods for purchasing fundamental necessities, which led to an increase in crime reports where the commercial-to-housing ratio was low. This finding corresponds to [18], suggesting that an area is safer when the proportion of dwellings is higher and recommending that we should prepare prevention policies by separating into “residential-oriented commercial districts” and “market-oriented commercial districts”. Furthermore, commercial districts that have more than a 150% commercial-to-housing ratio should be more cautiously managed by police to flexibly respond to the next pandemic.
The land use mix index appeared to show a relatively linear relationship with crime: the frequency of crime reports per area rose as the land use mix index increased, especially when the value was greater than 0.3. This result implies that a lower land use mix has a positive effect on crime reduction. Gathering facilities revealed a non-linear relationship, with a rapid rise in crime calls up to around 35 facilities and subsequent maintenance after that level. Additionally, crime reports rarely appeared up to 20 facilities, meaning that fewer crimes occurred in commercial districts with a small number of gathering places. Therefore, rather than expanding and attracting indiscriminate gathering facilities to revitalize alley commercial districts, localities should manage security in commercial areas by limiting the number of gathering facilities or redesigning district boundaries to take into account the number of gathering facilities.
In terms of park/greenery attributes, the GVI showed a negative linear trend with crime calls. Specifically, crime calls became negative from the point where the GVI was about 16%. All three years’ graphs indicate that street vegetation played a crucial role in enhancing commercial attractiveness and creating a sense of safety. However, maintaining street vegetation at roughly 20–24% should be an appropriate level for a resilient commercial zone, given that crime reports marginally rose or were maintained after over 24%.
Finally, two factors (Mu-score and closure rate) of commercial district features are shown as PDPs. The trend lines for all three years for the Mu-score increased linearly, indicating that crime reports rose as the perceived urban decline increased. This finding corresponds to prior studies’ results that suggest that urban decadence may contribute to the fear of crime and crime incidence [49,51]. Crime reports started to become positive around a score of 7.5, so we can conclude that commercial districts above this level are more likely to be exposed to crime. Because crime reports were the highest in 2021, we may determine that declining commercial districts were more likely to be impacted by the diminished natural surveillance efficiency, since social distancing decreased the number of shoppers. Thus, preventative strategies should first be offered to improve the perception of urban spaces, such as improving the aesthetics of streets/buildings and built environments. A non-linear trend was detected for the closure rate, and some variations have existed over the years. Crime reports steadily increased before reaching 3% with some fluctuations, and they continued to rise as the closure rate increased in 2019 and 2020. However, a noticeable increase was shown in 2021 after the closure rate surpassed 5%. On average, crime reports tended to rise as the closure rate started to exceed 4%. The closure rate is a common physical indicator that represents the deterioration of commercial districts, and a decaying region leads to moral slackness, which breeds criminality. Small companies reported closing more frequently as a result of COVID-19’s economic effects, particularly in 2021 when social distancing was in effect, reducing both the number of customers and operating hours. As a result, it appears that there were more crimes and closures this year.

5. Conclusions

This study examines the importance and trends of factors influencing commercial crime report density in Seoul’s alley commercial districts between 2019 and 2021. Machine learning approaches are employed to assess the significance of variables affecting the crime reports per commercial area and to identify the patterns of these factors. The results suggest that the shift in lifestyle brought on by COVID-19 had a significant impact on crime reporting, since social distancing significantly decreased the significance of crime influencers, and their importance was altered considerably. The following conclusions and implications can be drawn from the findings of this study.
First, it is demonstrated that store density, dawn sales ratio and the number of gathering facilities are the predominant factors influencing crime reports. As these variables’ values increase, the number of crime calls likewise tends to rise every year. This implies that the likelihood of crime increases when more facilities and amenities that might draw more visitors to a commercial district are introduced. Thus, it is vital to classify commercial districts for police actions according to the degree of criminal opportunities in order to create safer market places.
Second, the Mu-score, which measures a commercial district’s level of perceived decline, produced consistent findings for every year, with the number of reports rising as the level of deterioration increased. It can be seen that commercial districts with higher perceived decline created a landscape image of being unsafe and increased criminal impulses, which is consistent with earlier studies that have found that decayed commercial districts can harm visitors morally and contribute to the occurrence of crime. The increasing tendency became more pronounced in 2021, which is likely related to the loss in business activity brought on by social estrangement. Based on these findings, we may conclude that a safe commercial district could be created by improving the visual environment from a perception standpoint.
Third, a persistent negative linear association between the GVI and crime reports was observed. However, since crime reports were maintained after a specific street greenery level (22–24%), commercial districts are recommended to set adequate amounts of green space rather than overplanting street trees and vegetation.
Although the findings of this study may provide greater insight into the factors that drive crime, there are still certain limitations that need to be considered in future research. Since this study utilized 112 Emergency Number reported crime call data, normalized to our dependent variable as commercial crime report density, there is the possibility of overestimating crime numbers due to duplicate reports and missing incidents reported by the police. Thus, future studies should attempt to use actual crime data for more accurate estimation. Moreover, restrictions remain in describing how crime reporting affects overall commercial areas because the unit of study was restricted to alley commercial districts. Future research should thus pinpoint the variables influencing crime reports by examining different types of commercial districts. Finally, the measurement of perceived urban decay was based on the survey results of GSV images, but images cannot be captured every study year due to data availability. The size of alley commercial districts is relatively small, and only images that were not changed during the study period were used in this study. Therefore, future researchers should conduct surveys for different images for the same place each year to increase internal reliability.

Author Contributions

Conceptualization, H.W.K. and M.J.; methodology, H.W.K. and M.J.; software, M.J. and D.M.; validation, H.W.K., D.M. and M.J.; formal analysis, M.J.; investigation, H.W.K.; resources, H.W.K. and M.J.; data curation, D.M. and M.J.; writing—original draft preparation, H.W.K. and M.J.; writing—review and editing, H.W.K. and D.M.; visualization, D.M. and M.J.; supervision, H.W.K.; project administration, H.W.K.; funding acquisition, H.W.K. All authors have read and agreed to the published version of the manuscript.

Funding

This research was funded by the National Research Foundation of Korea (NRF-2022R1C1C1010848).

Informed Consent Statement

Not applicable.

Data Availability Statement

Not applicable.

Acknowledgments

This study was conducted through data cooperation with the Seoul Credit Guarantee Foundation and the National Police University (Smart Security Big Data Platform https://www.bigdata-policing.kr/ (accessed on 15 December 2022)).

Conflicts of Interest

The authors declare no conflict of interest.

References

  1. Mu, X.; Zhang, X.; Anthony Gar-On Yeh; Yu, Y.; Wang, J. Structural Changes in Human Mobility Under the Zero-COVID Strategy in China. Environ. Plan. B Urban Anal. City Sci. 2023. [Google Scholar] [CrossRef]
  2. Mu, X.; Yeh, A.G.-O.; Zhang, X. The Interplay of Spatial Spread of COVID-19 and Human Mobility in the Urban System of China During the Chinese New Year. Environ. Plan. B Urban Anal. City Sci. 2021, 48, 1955–1971. [Google Scholar] [CrossRef]
  3. Baumann, F.; Buchwald, A.; Friehe, T.; Hottenrott, H.; Mechtel, M. The Effect of a Ban on Late-night Off-premise Alcohol Sales on Violent Crime: Evidence from Germany. Int. Rev. L. Econ. 2019, 60, 105850. [Google Scholar] [CrossRef]
  4. Nivette, A.E.; Zahnow, R.; Aguilar, R.; Ahven, A.; Amram, S.; Ariel, B.; Burbano, M.J.A.; Astolfi, R.; Baier, D.; Bark, H.; et al. A Global Analysis of the Impact of COVID-19 Stay-at-home Restrictions on Crime. Nat. Hum. Behav. 2021, 5, 868–877. [Google Scholar] [CrossRef]
  5. Guo, X.; Tu, X.; Huang, G.; Fang, X.; Kong, L.; Wu, J. Urban Greenspace Helps Ameliorate People’s Negative Sentiments during the COVID-19 Pandemic: The case of Beijing. Build Environ. 2022, 223, 109449. [Google Scholar] [CrossRef]
  6. Korean National Police Agency Police Statistical Yearbook. Available online: https://www.police.go.kr/user/bbs/BD_selectBbsList.do?q_bbsCode=1117 (accessed on 8 August 2022).
  7. Yi, K.P.; Kim, D.W. Crime Analyses of Urban Parks in Seoul Focusing on Spatial Analysis. JCSSED 2015, 6, 64–86. Available online: http://www.riss.kr/link?id=A103120974 (accessed on 21 July 2023).
  8. Lee, K.H.; Kang, K.Y. Analysis of Crime Risk Based on Environmental Features of Commercial Area. JCSSED 2015, 6, 71–104. Available online: https://www.kci.go.kr/kciportal/ci/sereArticleSearch/ciSereArtiView.kci?sereArticleSearchBean.artiId=ART002171764 (accessed on 21 July 2023).
  9. De Nadai, M.; Xu, Y.; Letouzé, E.; González, M.C.; Lepri, B. Socio-economic, Built Environment, and Mobility Conditions Associated with Crime: A Study of Multiple Cities. Sci. Rep. 2020, 10, 13871. [Google Scholar] [CrossRef]
  10. Hong, H. Research on Creating Direction of a Safe Commercial District through the Establishment of a Commercial District Safety Index in Seoul; Seoul Credit Guarantee Foundation Small Business Policy Research Center: Seoul, Republic of Korea, 2021; pp. 27–40. [Google Scholar]
  11. Kim, S.J.; Cao, Y.; Lee, S.G. Analysis of the Association between Urban Environmental Characteristics and Crime Incidence—Using Urban Big Data and Spatial Durbin Model. J. Urban Des. Inst. Korea 2022, 23, 143–162. Available online: http://www.riss.kr/link?id=A108183843 (accessed on 19 July 2023). [CrossRef]
  12. Park, H.J.; Park, S. Crime Prevention and Environmental Design in Residential Areas (CPTED) Environmental Analysis of Province Settlement Conditions by CPTED Principles—Focused on CPTED Project in Namsan Village, Hongseong. J. Urban Des. 2022, 4, 66–74. Available online: http://www.riss.kr/link?id=A108448825 (accessed on 21 July 2023).
  13. Kim, Y.; Wo, J.C. The Time-Varying Effects of Physical Environment for Walkability on Neighborhood Crime. Cities 2023, 142, 104530. Available online: https://www.sciencedirect.com/science/article/pii/S0264275123003426 (accessed on 26 August 2023). [CrossRef]
  14. Jung, J.Y. Big Data Analysis on 112 Report Data: Focusing on the EDA Technique. Korean Secur. J. 2021, 66, 71–92. [Google Scholar]
  15. Kim, H.J.; Choi, Y. A Study on the Influence of the Space Syntax and the Urban Characteristics on the Incidence of Crime Using Negative Binomial Regression. KSCE J. Civ. Eng. 2016, 36, 333–340. Available online: http://www.riss.kr/link?id=A103547301 (accessed on 29 June 2023).
  16. Jung, D.H. A Study on the Influencing Factors of Crime Occurrence in Metropolitan Cities. Ph.D. Dissertation, Graduate School, Kwangwoon University, Seoul, Republic of Korea, 2018. [Google Scholar]
  17. Lee, H.W. A Study on the Factors Affecting Crime in the Street Environment of Residential Areas: Based on CPTED Theory. Master’s Thesis, The University of Seoul, Seoul, Republic of Korea, 2021. [Google Scholar]
  18. Kim, D.K.; Yoon, Y.J.; Ahn, K.H. A Study on Urban Crime in Relation to Land Use Patterns. J. Korea Plan. 2007, 42, 155–168. Available online: http://www.dbpia.co.kr/journal/articleDetail?nodeId=NODE00937696 (accessed on 10 July 2023).
  19. Michael, S.E.; Bruce Hull, R.; Zahm, D.L. Environmental Factors Influencing Auto Burglary. Environ. Behav. 2001, 33, 368–388. [Google Scholar] [CrossRef]
  20. Sadeek, S.N.; Minhuz Uddin Ahmed, A.J.M.; Hossain, M.; Hanaoka, S. Effect of Land Use on Crime Considering Exposure and Accessibility. Habitat Int. 2019, 89, 102003. Available online: https://www.sciencedirect.com/science/article/pii/S0197397518302340 (accessed on 10 July 2023). [CrossRef]
  21. Jang, Y.J.; Lee, S.G. Analysis of Neighborhood Environment Factors Influencing Fear of Crime: Focusing on CPTED Elements. J. Korea Plan. 2022, 57, 25–39. Available online: http://www.riss.kr/link?id=A108333090 (accessed on 10 July 2023).
  22. Kim, J.; Noh, H. Impact of the Perceived Crime at the Local and National Levels. J. Int. Crim. Justice 2020, 2, 1–29. Available online: http://www.dbpia.co.kr/journal/articleDetail?nodeId=NODE10482669 (accessed on 5 July 2023). [CrossRef]
  23. Rees-Punia, E.; Hathaway, E.D.; Gay, J.L. Crime, Perceived Safety, and Physical Activity: A Meta-Analysis. Prev. Med. 2018, 111, 307–313. [Google Scholar] [CrossRef]
  24. Zhang, F.; Fan, Z.; Kang, Y.; Hu, Y.; Ratti, C. “Perception Bias”: Deciphering a Mismatch Between Urban Crime and Perception of Safety. Landscape Urban Plan. 2021, 207, 104003. Available online: https://www.sciencedirect.com/science/article/pii/S0169204620314870 (accessed on 29 June 2023). [CrossRef]
  25. Ogneva-Himmelberger, Y.; Ross, L.; Caywood, T.; Khananayev, M.; Starr, C. Analyzing the Relationship between Perception of Safety and Reported Crime in an Urban Neighborhood Using GIS and Sketch Maps. ISPRS Int. J. Geoinf. 2019, 8, 531. [Google Scholar] [CrossRef]
  26. Kang, J.M.; Kim, H.J. The Effect of the Green Space on the Crime in the City. J. Korean Soc. Civ. Eng. D 2007, 27, 117–129. Available online: https://www.kci.go.kr/kciportal/ci/sereArticleSearch/ciSereArtiView.kci?sereArticleSearchBean.artiId=ART001038551 (accessed on 19 July 2023).
  27. Sadler, R.C.; Pizarro, J.; Turchan, B.; Gasteyer, S.P.; McGarrell, E.F. Exploring the Spatial-temporal Relationships between a Community Greening Program and Neighborhood Rates of Crime. Appl. Geogr. 2017, 83, 13–26. Available online: https://www.sciencedirect.com/science/article/pii/S0143622816305707 (accessed on 23 August 2023). [CrossRef]
  28. Hong, H.G. A Study on Physical Environmental Factors Affecting the Fear of Crime in Street Space of the Commercial Area. Master’s Thesis, Korea University, Seoul, Republic of Korea, 2023. [Google Scholar]
  29. Seo, M.J.; Lee, S.G.; Kang, S.J. An Analysis of the Relationship between the Physical Characteristics of Commercial Streets and Street Crime—Focused on the Old Downtown Commercial Street. Aut. Ann. Conf. AIK 2021, 1, 238–241. [Google Scholar]
  30. Zahnow, R. Mixed Land Use: Implications for Violence and Property Crime. City Community 2018, 17, 1119–1142. [Google Scholar] [CrossRef]
  31. Hakyemez, T.C.; Badur, B. Crime Risk Stations: Examining Spatiotemporal Influence of Urban Features through Distance-Aware Risk Signal Functions. ISPRS Int. J. Geoinf. 2021, 10, 472. [Google Scholar] [CrossRef]
  32. Li, L.; Cheng, J.; Bannister, J.; Mai, X. Geographically and Temporally Weighted Co-location Quotient: An Analysis of Spatiotemporal Crime Patterns in Greater Manchester. Int. J. Geogr. Inf. Sci. 2022, 36, 918–942. [Google Scholar] [CrossRef]
  33. Lee, J.; Lee, D. The Crime-Reducing Effects of Gentrification; Korea Research Institute for Human Settlements: Seoul, Republic of Korea, 2022. [Google Scholar]
  34. Kim, J.S.; Gang, T.G.; Choo, J.H.; Roh, S.H. Korean Crime Victim Survey (VI): Commercial Victimization Survey. Korean Inst. Criminol. 2016, 6, 1–686. Available online: http://www.dbpia.co.kr/journal/articleDetail?nodeId=NODE07157782 (accessed on 19 July 2023).
  35. Bark, H.M.; Jang, K.H.; Lim, W.S. Korean Institute of Criminology and Justice Changes in Crime Patterns after the COVID-19 Pandemic; Korean Institute of Criminology and Justice: Seoul, Republic of Korea, 2021. [Google Scholar]
  36. Seoul Open Data Market. Available online: https://data.seoul.go.kr/ (accessed on 30 May 2023).
  37. Yu, H.J. Analysis of the Relationship between the Living Population and Land-Use Characteristics: Focused on the Seoul Area. J. Korean Geogr. Soc. 2022, 25, 67–85. Available online: http://www.riss.kr/link?id=A108400278 (accessed on 23 August 2023).
  38. Treepedia. Available online: http://senseable.mit.edu/treepedia (accessed on 3 March 2022).
  39. Venter, Z.S.; Shackleton, C.; Faull, A.; Lancaster, L.; Breetzke, G.; Edelstein, I. Is Green Space Associated with Reduced Crime? A National-Scale Study from the Global South. Sci. Total Environ. 2022, 825, 154005. Available online: https://www.sciencedirect.com/science/article/pii/S004896972201097X (accessed on 23 August 2023). [CrossRef]
  40. Ali, M.N.D. PyCaret: An Open Source, Low-Code Machine Learning Library in Python; PyCaret Version. 2020. Available online: https://www.marktechpost.com/2020/04/18/pycaret-an-open-source-low-code-machine-learning-library-in-python/ (accessed on 3 March 2022).
  41. Kim, M.; Kim, D.; Jin, D.; Kim, G. Application of Explainable Artificial Intelligence (XAI) in Urban Growth Modeling: A Case Study of Seoul Metropolitan Area, Korea. Land 2023, 12, 420. [Google Scholar] [CrossRef]
  42. Ghaderzadeh, M.; Asadi, F.; Jafari, R.; Bashash, D.; Abolghasemi, H.; Aria, M. Deep Convolutional Neural Net-work-Based Computer-Aided Detection System for COVID-19 Using Multiple Lung Scans: Design and Implemen-tation Study. J. Med. Internet Res. 2021, 23, e27468. [Google Scholar] [CrossRef] [PubMed]
  43. Ghaderzadeh, M.; Aria, M. Management of COVID-19 Detection Using Artificial Intelligence in 2020 Pandemic. In Proceedings of the 5th International Conference on Medical and Health Informatics, Kyoto, Japan, 14–16 May 2021; Available online: https://api.semanticscholar.org/CorpusID:239890137 (accessed on 23 August 2023).
  44. Saeed, U.; Jan, S.U.; Lee, Y.; Koo, I. Fault Diagnosis based on Extremely Randomized Trees in Wireless Sensor Networks. Reliab. Eng. Syst. Saf. 2021, 205, 107284. Available online: https://www.sciencedirect.com/science/article/pii/S095183202030781X (accessed on 11 August 2023). [CrossRef]
  45. Seo, J.B.; Kang, N.H. Exploration of Factors on Pre-service Science Teachers’ Major Satisfaction and Academic Satisfaction Using Machine Learning and Explainable AI SHAP. J. Sci. Edu. 2023, 47, 37–51. Available online: http://www.riss.kr/link?id=A108574943 (accessed on 1 September 2023).
  46. Mayhew, B.H.; Levinger, R.L. Size and the Density of Interaction in Human Aggregates. Am. J. Sociol. 1976, 82, 86–110. [Google Scholar] [CrossRef]
  47. Branas, C.C.; Cheney, R.A.; MacDonald, J.M.; Tam, V.W.; Jackson, T.D.; Ten Have, T.R. A Difference-in-differences Analysis of Health, Safety, and Greening Vacant Urban Space. Am. J. Epidem. 2011, 174, 1296–1306. [Google Scholar] [CrossRef]
  48. Bogar, S.; Beyer, K.M. Green Space, Violence, and Crime: A Systematic Review. Trauma Violence Abuse 2016, 17, 160–171. [Google Scholar] [CrossRef] [PubMed]
  49. Hwang, J.A.; Kang, J.Y. Relationship between the Spatial Distribution of Crime-prone Areas and the Characteristics of Urban Decline—Focusing on Crime Risk Indicators Using GIS-based Spatial Statistics. KIEAE J. 2021, 21, 87–94. Available online: http://www.dbpia.co.kr/journal/articleDetail?nodeId=NODE10755730 (accessed on 21 July 2023). [CrossRef]
  50. Jang, J.W.; Cho, S.H. A Study on Inequality and Crime -Focusing on Income Inequality. Korean Assoc. Public Saf. Crim. Just. 2019, 28, 419–448. Available online: https://www.kci.go.kr/kciportal/ci/sereArticleSearch/ciSereArtiView.kci?sereArticleSearchBean.artiId=ART002514513 (accessed on 21 July 2023). [CrossRef]
  51. Kang, S.J. Impact of Spatial Disorder on Fear of Crime. Master’s Thesis, Chung-Ang University, Seoul, Republic of Korea, 2017. [Google Scholar]
Figure 1. Study area.
Applsci 13 11714 g001
Figure 2. Analytical flowchart.
Applsci 13 11714 g002
Figure 3. SHAP GSV (Absolute Mean) and LSV (Beeswarm) plots.
Applsci 13 11714 g003
Figure 4. PDP results of standardized commercial crime report density.
Applsci 13 11714 g004aApplsci 13 11714 g004b
Table 1. Descriptive statistics.
VariablesMeanS.D.Min.Max.
201920202021201920202021201920202021201920202021
Dependent
variable
Commercial crime report density0.001340.001370.001300.001120.001120.00110.000040.0000500.011960.1270.0111
Socio-
economic
features
Living population2,814,9142,819,7682,742,4501,538,7671,585,3611,631,70685,95060,59756,40816,900,00018,800,00021,800,000
Youth sales ratio37.55 36.91 35.5 10.59 10.77 10.61 0.76 0 0 78.40 79.65 78.62
Middle-aged sales ratio40.98 41.14 41.0 8.05 8.14 7.78 12.74 0 0 64.59 65.84 64.98
Elderly sales ratio40.32 13.01 14.59 6.64 4.99 5.46 14.32 0 0 66.14 37.17 39.77
Land appraisal value3,637,3663,896,6384,365,6452,337,8802,525,7392,855,645158,100163,400184,70022,700,00024,300,00027,500,000
Neighbor-hood
features
Commercial ratio5.17 5.17 5.14 15.62 15.62 15.60 0 0 0 99.98 99.98 99.98
Land use mix index0.13 0.13 0.13 0.20 0.20 0.20 0 0 0 0.84 0.84 0.84
Commercial-to-housing ratio86.83 83.28 88.01 330.91 265.04 297.61 0 0 0 7365.20 4935.10 5105.10
Gathering facilities 12.28 12.28 9.58 7.87 7.87 6.52 0 0 0 73 73 39
Park/
greenery
features
Neighborhood park0.25 0.25 0.25 0.58 0.58 0.58 0 0 0 4 4 4
Children’s park2.86 2.86 2.86 2.37 2.37 2.37 0 0 0 14 14 14
Small park0.09 0.09 0.09 0.39 0.39 0.39 0 0 0 5 5 5
GVI17.47 17.47 17.47 3.72 3.72 3.72 9.70 9.70 9.70 38 38 38
Commercial
district features
Store density0.13 0.13 0.13 0.08 0.08 0.08 0.01 0.01 0.01 0.75 0.78 0.83
Closure rate2.76 2.34 2.80 2.81 2.56 3.13 0 0 0 23.05 19.70 20
Commercial area74,591.4630,266.9910,579.18387,983.2
Mu-score7.74 7.74 7.74 0.87 0.87 0.87 3.76 3.76 3.76 10.25 10.25 10.25
Dawn sales ratio6.15 5.33 2.49 3.63 3.10 1.82 0 0 0 27.87 21.70 12.65
Table 2. Top five best-performing ML models.
Model201920202021
R2RMSEMAPER2RMSEMAPER2RMSEMAPE
Extra Trees Regressor0.46260.00080.47150.43610.00080.4790.47140.00080.4658
Random Forest Regressor0.41120.00080.45970.40330.00080.46750.4640.00080.4273
Light Gradient Boosting Machine0.40910.00080.460.39160.00080.55910.45860.00080.4853
Ridge Regression0.38960.00090.52360.39130.00080.56440.45370.00080.4743
Bayesian Ridge0.38860.00090.51150.39020.00080.44210.45260.00080.4377
Linear Regression (benchmark)0.38310.00090.51560.38830.00080.55740.38120.00080.5671
Disclaimer/Publisher’s Note: The statements, opinions and data contained in all publications are solely those of the individual author(s) and contributor(s) and not of MDPI and/or the editor(s). MDPI and/or the editor(s) disclaim responsibility for any injury to people or property resulting from any ideas, methods, instructions or products referred to in the content.

