Abstract
The aim of the research in the Poleski National Park was to determine the concentration of radionuclides and heavy metals in the soil and to evaluate the absorbed dose and the average annual effective dose as a result of external exposure to ground-based radiation sources. The spread of anthropogenic radionuclide concentration in the Poleski National Park was the highest. This is a first-of-its-kind study in Poland. The annual effective dose calculated for the Poleski National Park was over three times higher than the average worldwide value. Soil samples were subjected to mineralization using a TITAN MPS with a rotor. Subsequently, the metals in the obtained solutions were determined using the atomic absorption spectrometry method with flame atomization (AAS FM). The content of copper Cu, nickel Ni, lead Pb, cadmium Cd, and chromium Cr did exceed the average content neither in Europe nor around the world. The soils of the Poleski National Park are characterized by pollution with the tested heavy metals, especially cadmium Cd.
1. Introduction
Soil is generally considered to be the environmental component that is the most exposed to the accumulation of pollutants of various origins. Its ability to accumulate metals is related to the type of soil, its physical and chemical properties, and the nature of heavy metals [1]. Whether the soil becomes a threat to humans or not depends on the concentration of radionuclides. Their concentration depends mainly on local geology and climate (geographic location) [2,3]. There are the so-called High Radiation Background Areas (HBNRAs), where the dose of radiation, due to natural background, is 55–200 times higher than the doses that occur in Normal Background Radiation Areas (NBRAs) [4,5]. Some of the world’s HBNRAs are found in Yangjiang (China), Kerala (India), Gurapari (Brazil), Central Bohemia (Czech Republic), Campania (Italy), Podcetrtek (Slovenia), and Tessin (Switzerland) [2,6].
The presence of uranium 238U, thorium 232Th, and radium 226Ra in soil and rocks results from the natural radiation and includes cosmic radiation and terrestrial radiation from natural radioactive elements. Furthermore, there are artificial radionuclides originating from human activity, most due to their common application in industrial, scientific, and military activities; in medicine; industrial production processes; mining, nuclear power plants; or nuclear weapons [7,8,9].
According to reports published by The United Nations Scientific Committee on the Effects of Atomic Radiation [2], the annual average per caput dose from natural sources of radiation is 2.4 mSvy−1, whereas from anthropogenic sources of radiation, it is 0.6 mSvy−1 [2,10,11]. That makes the radiation of natural radionuclides the source that affects human health the most. As a matter of fact, a large part of the dose comes from gaseous radon 222Rn and its progenies (from the uranium 238U series).
Soil radiation is mainly caused by the upper layer of the soil [10]. Ionizing radiation is mainly due to gamma-emitting radionuclides, such as uranium 238U, thorium 232Th, and their decay products, as well as potassium 40K and radon 222Rn, which are usually the largest natural source of radiation [2]. Those radionuclides are of particular interest for radiation protection. There are worldwide studies focusing on the measurements of radionuclides in the soil [7]. Researchers present information about background exposure levels in different countries. The available maps concerning concentrations of radionuclides in soils include GEMAS and FOREGS. Nevertheless, radiological data were not collected with sufficient density to perform local statistics, and the same kind of interpolation has to be performed [12].
In the presented research, radionuclides coming from natural and anthropogenic sources have been studied. The following natural radionuclides are included: potassium 40K, radium 226Ra, and actinium 228Ac. The significant decay product in the uranium 238U series is radium 226Ra and in the thorium 232Th series is actinium 228Ac. For this reason, the series was given the name radium 226Ra and actinium 228Ac decay, respectively. The potassium 40K isotope is of a naturally radioactive origin. On the other hand, the isotopes of radium 226Ra and actinium 228Ac are the main representatives of the radium 226Ra and actinium 228Ac series [13].
An artificial radionuclide which concentration was assessed was cesium 137Cs. In the environment, it occurs as a remnant of nuclear power plant failures, for example, that of the Chernobyl Nuclear Power Plant in 1986 [14,15]. Its occurrence in environmental components is related to radioactive fallout, which traveled over Poland along with clouds [16,17]. It is worth mentioning that over the years, radioactive cesium 137Cs migrated deep into the soil [18,19]. In the case of cesium 137Cs, the deposition, i.e., the surface concentration, was also calculated. This enabled the estimation of exposure to ionizing radiation, i.e., the determination of the annual effective dose for people staying in the PPN and the surrounding population.
Information about the behaviors and distributions of radionuclides occurring in soils can be useful for epidemiological, geological, and soil quality management studies [3]. Moreover, it may be valuable to estimate the limitations and potentials of soils for many special uses [20,21]. That is why radiological studies of environment components (e.g., soil, water, air) are crucial.
Heavy metals are present in the environment as a result of natural soil formation processes, which are regulated by site and environmental influences, as well as from anthropogenic sources. The most important natural sources are mineral weathering, erosion, and volcanic activity. Bedrock, which is the main natural source of metals in the soil, provides a varied content of metals depending on their type, mineralogical composition, and origin. Main anthropogenic sources of heavy metals in the environment, such as mining and metallurgy, petrochemical and chemical plants, industrial and municipal waste, transport and agricultural phosphorus fertilizers and pesticides, waste (e.g., manure, composts, and municipal sewage sludge), and atmospheric deposition, depend on human activity [22,23,24,25,26,27].
Heavy metals become contaminants due to over-processing. They transfer from mine areas to other places, discharging high concentrations of metal waste, depending on the industry. This converts metals to forms with greater bioavailability, resulting in greater exposure to humans. The human disruption of the slowly occurring geochemical cycle of metals in nature results in the accumulation of one or more heavy metals in the soil and waters above natural levels. This may be sufficient to pose a risk to human, plant, animal, and aquatic health [28]. Metals are highly stable in the environment and do not biodegrade or leach [29]. This is the result of the ion exchange process taking place in the soil, where metals migrate to soil colloids. There is an exchange of ions that balance the surface charge of soil colloids with ions from the soil solution. The degree to which the soil components can perform the role of ion exchangers is determined by the cation exchange capacity of the soil (CEC) measured in mol/kg (milliequivalents/100 g) [30]. Metals present in soils in the form of micronutrients are necessary for plants (iron Fe, copper Cu, boron B, zinc Zn, manganese Mn, molybdenum Mo, nickel Ni) and for animals (iron Fe, copper Cu zinc Zn, manganese Mn, cobalt Cl, iodine I, molybdenum Mo, selenium Se, fluorine F, and chromium Cr). However, no physiological role of highly toxic metals, such as lead Pb, cadmium Cd, mercury Hg or thallium Tl, was found. All heavy metals, present in high concentrations, are potentially toxic to microflora, macroflora, plants and animals, as well as humans [31,32].
The problem of the presence of metals in Polish soils occurs only locally, in places of their emission, e.g., from steel mills or in cases of direct contamination with substances rich in metals [1,32]. In connection with human activity, non-industrial areas should be distinguished, which include forest and agricultural areas, as well as urban and industrial areas. Such areas seem particularly important due to their impact on the earth’s surface. The risk that is particularly important for the protection of the earth’s surface results from the collection of waste, discharge of industrial wastewater and other substances in such areas. The assessment of the condition and degree of soil contamination with heavy metals requires taking into account both their total content and mobile forms in the soil environment [32].
According to the Polish law, the degree of soil contamination is assessed in relation to the ordinance of the Minister of the Environment of 1 September 2016 on the method of assessing soil contamination. Annex 1 to this regulation contains substances that pose a risk that is particularly important for the protection of the earth’s surface. The given limit values for the metal content are very diverse, depending on the type of soil, and have been established for 11 metals (barium Ba, chromium Cr, selenium Sn, zinc Zn, cadmium Cd, cobalt Co, copper Cu, molybdenum Mo, nickel Ni, lead Pb, and mercury Hg) and arsenic As.
The research covered the soils of the Poleski National Park. The aim was to determine the concentration of radionuclides and heavy metals in the soil and to evaluate the absorbed dose and the average annual effective dose as a result of the external exposure to ground-based radiation sources. On the basis of the obtained research, the degree of soil load with heavy metals was assessed. Information on the level of heavy metals and human exposure to terrestrial radiation in this area is unknown. This is the first such study in Poland.
2. Material and Methods
2.1. Study Area
Poleski National Park (PNP) is located in Poleski in the Lublin Province. The establishment of the park dates back to May 1st, 1990. Forest complexes with a rich flora and fauna are located on the Łęczyńsko-Włodawska Plain. The PNP is strictly protected by the Ramsar Convention as an important wetland area. It is the tenth-largest National Park in Poland, and its area, according to the Regulation of the Council of Ministers on the Poleski National Park of 23 November 2017, amounts to 9760.2864 ha, and its buffer zone is 13,702.77 ha [2].
The terrain of the park is flat and strongly wet. The formation of river valleys was not noticeable there. The dominant part of the PNP is swamps, peat bogs, and numerous karst lakes and it is mostly covered with peat plains. The exception is the area around Wola Wereszczyńska, where there is a low, flat limestone hump. In the southern part, a small hump of chalky substrate is visible, separating the central part of the protected area from the Uściwierskie Lakes basin. In the north, the park is limited by a series of moraines from the Central Polish Glaciation. There is a substitute for tundra or forest-tundra in the park. Moreover, it is the furthest south-west in Europe. Swamp ecosystems occurring in the area of the PPN are areas that have developed without human interference since the end of the last glaciation [33,34].
2.2. Sampling and Processing
As part of the research work in 2017–2018, 21 soil samples were collected from the Poleski National Park. In order to obtain a homogeneous measurement grid, the points were chosen to be distributed at similar distances. Most of the points were located in accessible places, close to landmarks or tourist routes. Figure 1 shows an illustrative map of the PNP along with the names and locations of soil sampling points. On the other hand, the geographical coordinates of the measurement points are presented in Table 1.
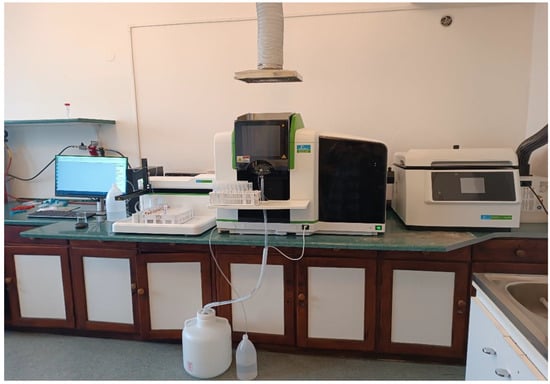
Figure 1.
Laboratory equipment.

Table 1.
Geographical coordinates recorded of the sampling points in the Poleski National Park.
Sampling was performed in accordance with the methodology used by the Central Laboratory for Radiological Protection (CLOR) for the needs of radiological monitoring of soils in Poland. The methodology was approved by the president of the National Atomic Energy Agency and the Inspectorate for Environmental Protection. Samples were taken from the topsoil (0–10 cm). For this purpose, steel dies with cylinder geometry and diameter d ≈ 7 cm were used. At each measurement point, 7 portions of the soil were collected: 1 portion from the center and 6 from the circumference of a circle 2 m in diameter, equally spaced from each other (forming a regular hexagon). Then, the portions were poured into one bag for each collection point. The bags were labeled (name of the point, geographical coordinates, date and time of collection) and then transported to the CLOR Dosimetry Department [35].
Soil samples were prepared in stages for radiation and heavy metal studies. The first stage consisted of pouring the soil onto the sheets and removing plant fragments, roots, and stones. Then, the soil was ground and labeled. The next stage was thermal drying in an accredited laboratory dryer at a temperature of about 105 °C. The dried sample was cooled, the total weight was determined, and then the comminuted soil was poured through a sieve (grain size less than 2 mm) into Marinelli containers with a volume of 0.5 dm3. The last stage of sample preparation consisted in determining the mass of the soil in the container, closing it tightly (additionally secured with an insulating tape) and describing it [35]. After that, samples were placed in Marinelli containers and stored for two weeks to reach the equilibrium of lead 214Pb and bismuth 214Bi with radon 222Rn. The samples for the tests of individual metals were prepared according to the reference methodologies for determining the total metal content in accordance with PN-ISO 11466 [36]. Metals in soils were determined by the method of atomic absorption spectrometry with flame atomization (Figure 1). According to the ordinance, the investigated area, based on the type of use, was classified as group III of land, i.e., forests, wooded, and bushy land. For these areas, the limit value for metals causing the risk was defined for: chromium Cr—500 mg/kg, cadmium Cd—10 mg/kg, copper Cu—300 mg/kg, nickel Ni—300 mg/kg, and lead Pb—500 mg/kg.
In the analyses, chemical reagents designed for laboratory analyses with a specified degree of purity of the main component and correspondingly low levels of impurities, referred to as “A.C.S.”, were used. Analytical measurements were carried out using instruments suitable for ensuring the consistency of the obtained results. Uncertainty assessments of the measurement results were made, and reference materials were utilized.
2.3. Laboratory Research
2.3.1. Radiation Research
The activities of natural and artificial radionuclides were measured in soil samples. For research, a gamma-spectrometry machine was used. One of the main elements of the device is the spectrometric track consisting of a multichannel analyzer (MCA). The analyzer works with a germanium semiconductor detector (high-purity germanium (HPGe) with an efficiency of 25% and a resolution of 1.8 keV for the second cobalt 60Co line (energy of 1332 [keV]). The input voltage at the detector was 4000 V. The spectrometer was calibrated for energy by acquiring a spectrum from radioactive standard sources of known energies like cobalt 60Co (1332 keV, 1773 keV) and cesium 137Cs (662 keV). A soil sample was placed on the HPGe detector, so the measurement could begin. The measurement time for a single sample was 80,000 [s], that is about 22.5 h.
After the series of measurements was completed, the results of the tests were statistically analyzed. The results of the activity of the natural potassium 40K, radium 226Ra, and actinium 228Ac radionuclides and of artificial origin—cesium 137Cs in the soil were converted into a mass unit and the radionuclide concentrations were determined. The activity concentrations of actinium 228Ac, potassium 40K, radium 226Ra and cesium 137Cs were determined using a single peaks of 583.19 keV (intensity 84.5%), 1461 keV (intensity 10.72%), 186 keV (intensity 96.1%), and 661.7 keV (intensity 90.1%), respectively. The following equation was used to calculate activity concentrations of radionuclides in Bqkg−1 [11,37]:
where:
- CEi—total count of a peak at energy E,
- Ceff—detection efficiency at energy E,
- γ—the percentage of gamma emission probability of the radionuclide i for a transition at energy E,
- m—mass of measured samples (kg),
- t—counting time (s).
The content of anthropogenic radionuclides in the soil is often provided on the surface area in kBqm−2. Such a quantity is called a deposition. The deposition of cesium 137Cs is described by the following equation:
where:
- Dep—surface concentration in kBq/m2 (deposition),
- —is a field the surface from which the soil is taken using a die with a diameter of D.
In the study, the absorbed dose rate and the annual effective dose rate have been calculated. The absorbed dose rate in the air at 1 m above the ground is associated with a specific activity of uranium 238U (or radium 226Ra), thorium 232Th (or actinium 228Ac), and potassium 40K. It indicates the effects of gamma radiation and is estimated using the following equation [38,39]:
where: ARa, AAc, AK are the concentration of radium 226Ra, actinium 228Ac, and potassium 40K in Bqkg−1, respectively.
While annual effective dose, ED, represents the effective dose to a population from terrestrial gamma radiation. It is calculated as follows:
where:
- T—the time to convert from year to hour (8760 hy−1),
- Q—dose conversion factor (Q = 0.7 SvGy−1),
- D—absorbed dose rate in the air (nGyh−1).
In the case of calculating the annual effective dose to the population from terrestrial gamma radiation occurring in the Poleski National Park (according to the principle of pessimism in radiological protection), the highest value of the absorbed dose rate in air is taken.
2.3.2. Heavy Metals Research
The samples for the tests of individual metals were prepared according to the reference methodologies for determining the total metal content in accordance with PN-ISO 11466. Metals in soils were determined by the method of atomic absorption spectrometry with flame atomization. Determination of trace metals was performed after soil mineralization with a mixture of concentrated acids: nitric and perchloric (3:1). The mineralization was carried out with the use of a microwave system, in accordance with the EPA 3052 method. Then, quantitative analyses of the metals: chromium Cr, nickel Ni, copper Cu, cadmium Cd, and lead Pb were carried out by the method of atomic absorption spectrometry with flame atomization (in accordance with the PN ISO 11047 method [40]) using the AAS-F device (AAS PinAAcle 900F PerkinElmer, Kraków, Poland). A 100 mm burner was used and was fed with a stoichiometric mixture of medical air and acetylene. The flame temperature was 2100—2300 °C. Hollow cathode lamps were used as the radiation source. All reagents used were of analytical grade. Precision and accuracy have been verified using certified soil reference materials (PACS-3 and MESS-4; National Research Council Canada, NRCC). Recovery of chromium Cr, nickel Ni, copper Cu, cadmium Cd, and lead Pb ranged from 84.0 to 118.5%. For the determined elements, the quantitative limits were: lead Pb = 0.05 mg/kg; cadmium Cd = 0.03 mg/kg; chromium Cr = 0.5 mg/kg; nickel Ni, copper Cu = 0.3 mg/kg. To assess the levels that may be trace metals and Igeo anthropogenic influences on the information system in geoaccumulation indices (Igeo) [41,42].
The Igeo index originally developed by Muller [43] is used to quantify the level of soil metal contamination resulting from both natural events and/or human activities. The geoaccumulation index is calculated according to the equation:
where Cn is the metal concentration (n) in the sample, and Bn is the geochemical compound, the background value of the same element. The constant k = 1.5 is used as a correction factor for natural fluctuations in the background value as well as for very small anthropogenic influences. The scale for metal contamination is graded at seven levels:
- Igeo ≤ 0 Uncontaminated
- 0 < Igeo ≤ 1 Uncontaminated to moderately
- 1 < Igeo ≤ 2 Moderately contaminated
- 2 < Igeo ≤ 3 Moderately to highly contaminated
- 3 < Igeo ≤ 4 Highly contaminated
- 4 < Igeo ≤ 5 Highly to extremely contaminated
- Igeo > 5 Extremely contaminated
3. Results
3.1. Radiation Research
Concentration values of natural and anthropogenic radionuclides in the soil for each site are presented in Table 2. In the case of cesium 137Cs, its deposition was also determined. Moreover, average values and standard deviations have been calculated (Figure 2). Graphic interpretation of concentration of radionuclides in the soil is presented in Figure 1. The colors indicate, respectively: blue—radium 226Ra, green—actinium 228Ac, red—potassium 40K, purple—cesium 137Cs.
Table 2.
Concentration values of radionuclides in the soil for each site.
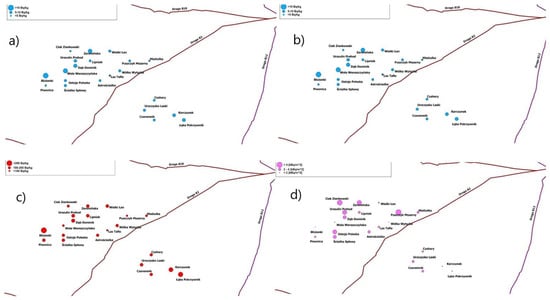
Figure 2.
The hypsometric map of concentrations: (a) radium 226Ra, (b) actinium 228Ac, (c) potassium 40K, (d) cesium 137Cs in Bqkg−1 in soil samples of individual sampling points in the Poleski National Park.
Concentrations of radionuclides in the soil vary. The lowest mean value was obtained for actinium 228Ac and the highest for potassium 40K. The anthropogenic radionuclides concentration is higher than radium 226Ra or actinium 228Ac and lower than potassium 40K concentrations. The values of particular radionuclide at each site differ. The highest variation is observed for the anthropogenic radionuclide. The coefficient of variation equals 69%. It means that values of anthropogenic radionuclides concentration in the soil are largely spread. The similar dependence is seen in the case of deposition of cesium 137Cs. The coefficient of variation is 65%. The variations of natural radionuclides are not that large but are significant. The coefficient of variation ranges from 28 to 33%.
A large region characterized by low values of natural radionuclides concentration is clearly visible (Figure 2). The place is located along the road no. 82. Moreover, there are some sites such as Ciek Zienkowski and Piwonica where the values are minor. One site shows where concentrations of the natural radionuclides are: very significant—Blizionki, and high—Zeremińska. In detail, there are two regions characterized by a low concentration of the radionuclide (the area of Karczunek and Łąka Pokrzywnik, the area of Blizionki and Piwonica). In two sites, a low concentration of the anthropogenic radionuclide was observed (Wielki Łan, Wólka Wytycka). The only regions of high concentration, are the areas of Zeremińska, Urszulin Prehod and Ciek Zienkowski. In two sites, the concentration is high—Ostoja Poleska and Puszczyk Mszarny. In general, regarding anthropogenic radionuclide, the southern regions are characterized by a lower concentration than the northern regions.
The results of the research were used to estimate the absorbed dose for humans from each sampling site (Figure 3 and Figure 4). The average value for the Poleski National Park is 47 nGyh−1. The minimal and maximal values are, respectively 40 nGyh–1 (Las Tafle) and 58 nGyh−1 (Blizionki). The values for the Park were lower than the average worldwide value, which is 59 nGyh−1 (SRS 19, 2001). Figure 2 shows the data for the absorbed dose values for each site and the red line shows the average worldwide value. The results of the research were also used to estimate the annual effective dose for all sites (Figure 4). The average value of annual effective dose for the Poleski National Park is 0.12 mSvy−1. The minimal and maximal values are 0.06 mSvy−1 (Las Tafle) and 0.22 mSvy–1 (Blizionki), respectively. The values for the Park are mainly higher than the average worldwide value of 0.07 mSvy−1. Additionally, the annual effective dose to which a person in the park is exposed in accordance with the principle of pessimism adopted in radiological protection was calculated. The annual effective dose was estimated at 0.22 mSvy−1. It is over three times higher than the world average value.
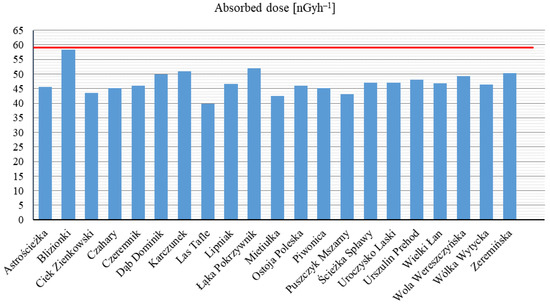
Figure 3.
Values of the absorbed dose for each measurement points. The red line represents the world average value.
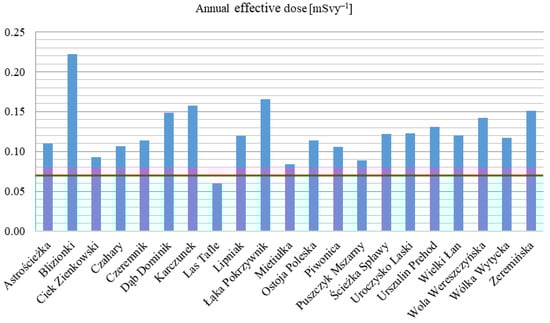
Figure 4.
Values of the annual effective dose for individual measurement points. The red line represents the world average value.
3.2. Heavy Metals Research
The full set of data and descriptive statistics for the tested heavy metals are summarized in Table 3. The obtained values indicate a slight variation in metal concentrations at all sites, which was confirmed by the similar mean and median values. Four of the analyzed metals (chromium Cr, copper Cu, nickel Ni, and lead Pb) were present at low concentrations with large differentiation of concentrations. The ranges of the determined metals were: 0.77–12.83 mg chromium Cr/kg, 0.74–20.74 mg copper Cu/kg, 0.57–56.14 mg nickel Ni/kg, and 5.81–20.43 mg lead Pb/kg. The cadmium Cd values ranged from 0.6 to 1.86 mg/kg of soil, indicating high contamination of the soils with this metal. Also, the degree of contamination of the soils with cadmium Cd was the highest compared to other metals. The studies showed an average of 13% of the cadmium Cd load on the soils in relation to the limit value causing the risk (10 mg/kg). The remaining heavy metals can be ranked in the following order of the soil percentage with respect to the risk limit: lead Pb (2.38%) > copper Cu (1.14%) > nickel Ni (1.04%) > chromium Cr (0.72%). The conducted research has shown that the tested soils pose the greatest threat due to the known content of the most toxic metals, i.e., cadmium Cd and lead Pb.
Table 3.
Geochemical analysis results and uncertainty in the soil of the Poleski National Park [mg/kg].
The soils showed low contents, but were characterized by spatial differentiation in the presence of trace metals (Figure 4). The sites of Astrościeżka, Las Tafle, Lipniak, Mietiułka, Ostoja Poleska, Ścieżka Spławy, Urszulin Premod, Wola Wereszczyńska, and Zeremińska showed higher concentrations compared to other locations. Chromium Cr obtained the highest values at the positions of Lipniak (11.90 mg/kg) and Mietiułka (12.83 mg/kg). Comparably, the highest values of cadmium Cd, in the range of 1.73–1.74 mg/kg, were found in the soil at the sites of Mietiułka, Ostoja Poleska, and Urszulin Premod, with the maximum value (1.86 mg/kg) at the site of Zeremińska. The highest concentrations of copper Cu were found at the sites of Astrościeżka (20.74 mg/kg), Ostoja Poleska (17.87 mg/kg), and Wola Wiereszczyńska (10.85 mg/kg). The highest concentration of nickel Ni (56.71 mg/kg) was found at the Las Tafle site. It was the highest concentration value for all metals. Apart from this position, nickel Ni achieved much lower concentrations in the remaining positions. The nickel Ni content in the soil at the sites of Astrościezka and Zeremińska was 11.47 g/kg and 10.84 mg/kg, respectively. Increased lead Pb concentrations in the soil were also recorded at these sites, reaching 16.17 mg/kg and 20.43 mg/kg, respectively. Apart from these two sites, higher concentrations of lead Pb were found at the Ścieżka Spławy site, amounting to 17.36 mg/kg. The different content of metals in the soils is likely to be due to the different grain size distribution. Greater accumulation can be observed in fine-grained materials (Figure 5).
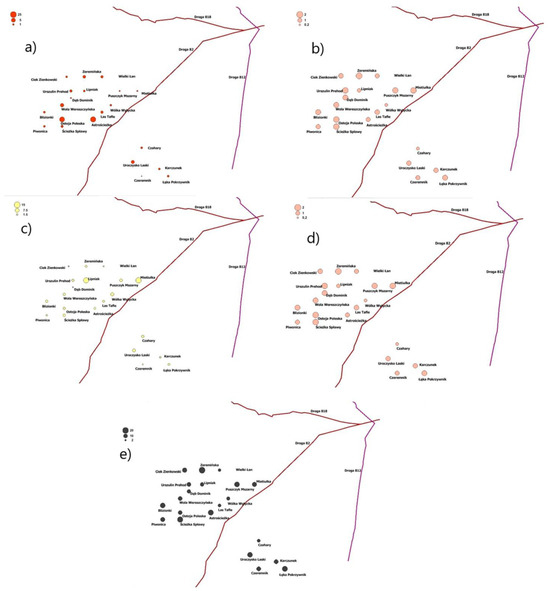
Figure 5.
The hypsometric map of concentrations: (a) copper Cu, (b) cadmium Cd, (c) chromium Cr, (d) nickel Ni, and (e) lead Pb in mgkg−1 in soil samples of individual sampling points in the Poleski National Park.
The results of the determination of the metal content in the soils of the Poleski National Park are shown in Figure 6. The highest concentrations for the sum of the analyzed metals were found at the sites of Artościezka, Las Tafle, and Żeremiska. On the other hand, the sum of metal concentrations in the soils was the lowest in the area of the Czachary, Czeremnik, Dąb Dominik, and Wielki Łan sites. The soils with the strongest and the weakest metal loads were not nearby, which does not indicate an unambiguous source of metals. Such a diversity proves the heterogeneous origin of metals in the soil material. Attention is drawn to the fact that metals are present in increased concentrations at similar sites or there is a certain correlation between the concentrations of metals at the sites.
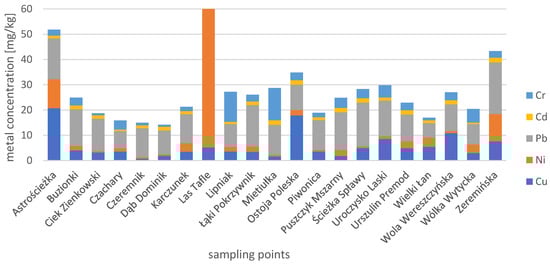
Figure 6.
The concentration of metals for individual measurement points in the Poleski National Park (mg/kg).
The Igeo values presented in Figure 7 show that all sites can be classified as “uncontaminated” for the four investigated trace metals: copper Cu, nickel Ni, lead Pb, and chromium Cr. Only for cadmium Cd, the studied soils obtained the geoaccumulation index value from −0.3 to 1.2. This indicates that the soils are moderately to heavily contaminated with cadmium Cd.
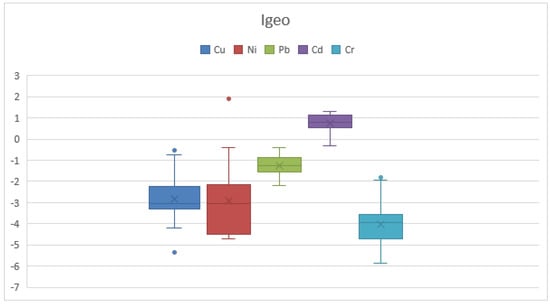
Figure 7.
The index of geoaccumulation of metals in soil samples of individual sampling points in the Poleski National Park.
4. Discussion
The average values of natural radionuclides concentration obtained in the study are significantly lower than the values obtained for Poland (Table 2). More specifically, they are close to the minimum values obtained for Poland, which are: 4.20 Bqkg−1 for radium 226Ra, 370 Bqkg−1 for thorium 232Th, and 123 Bqkg−1 for potassium 40K [2]. Concentrations of natural radionuclides in the soils in Europe and worldwide average are, respectively from 3 to 5 times and from 3 to 7 times higher than concentrations of radionuclides in the Poleski National Park (Table 4). According to the other research conducted in Bosnia and Herzegovina, Croatia, and Republic of Serbia, natural radionuclides concentrations in the soils were mainly higher than the values obtained for the Poleski National Park and worldwide average. The content of natural radionuclides in the soil similar to the study was obtained by Hrabovskyy et al. [44] in Shatsk National Natural Park in Ukraine. Such concentrations of natural radionuclides are influenced by the geochemical structure of the soil. Moreover, isotopes such as potassium 40K are long-lived and others are in a radioactive equilibrium with the other members of the appropriate radioactive series (Hrabovskyy et al., 2004 [44]). It should be highlighted that contents of radium 226Ra/uranium238U are mainly similar to actinium 228Ac/thorium 232Th. According to some studies, there is a strong correlation between the radionuclides since the decay series occurs together in nature [45,46].
Table 4.
Comparison of current results of natural radionuclides concentrations with data available in the literature.
Among anthropogenic radionuclides prevalent in the environment, cesium 137Cs and plutonium Pu isotopes are of great concern [52]. Those radionuclides occur in the environment due to the nuclear weapon tests, accidents at nuclear reactors, and discharges of radioactive waste from nuclear installations [51,53,54]. In Poland, anthropogenic radionuclides are mainly due to the Chernobyl accident which contributed to the spread of many fission products mainly in the northern hemisphere [55]. The concentration of cesium 137Cs in Poland depends on several factors. Firstly, it is determined by the pathway of the cloud with radioactive products resulting from the Chernobyl accident. Secondly, it is influenced by the type of the soil. Moreover, the concentration of cesium depends on migration processes that occur in the soil and causes a movement of radionuclides among its layers.
The average concentration of cesium 137Cs in the soil in the study was 10.59 Bqkg−1 with standard deviation equal to 7.34 Bqkg−1 (Table 2). The variation is significant. What is more, the southern regions are characterized by lower concentrations of anthropogenic radionuclides than the northern regions. It confirms the influences of pathway, type of the soil, and migration processes on cesium 137Cs concentration in the soil.
In order to assess the radiological risk, the possible impact of natural radiation on a human, besides radionuclide concentration in the soil, among others, the absorbed dose and annual effective dose, can be used [56]. It should be noted that the indicator, which is the most commonly used to assess the potential biological effects associated with exposure to ionizing radiation in humans and in radiation protection, is the effective dose rate [51]. The calculated values of absorbed gamma dose rates in the Poleski National Park are close to values noted in Poland but are lower than those in East Europe and worldwide average (Table 4). In studies conducted in the Czech Republic, Switzerland, Republic of Serbia, and Bosnia and Herzegovina, the average absorbed doses were higher from about 40 to 66% than the values obtained for the Poleski Park Narodowy. Only in parks in Lithuania, the value was lower by about 48%. It looks different in the case of annual effective dose (Table 5). The annual effective dose calculated for the Poleski Park Narodowy is significantly higher than the worldwide value (250%) and the values calculated for the Republic of Serbia, parks in Lithuania, Czech Republic, Bosnia and Herzegovina (from 30 to 333%). Only in Switzerland, the value was significantly higher.
Table 5.
Comparison of current results of the average absorbed dose and annual effective dose with data available in the literature.
The degree of soil degradation due to contamination with heavy metals largely depends on the properties of the soil. In general, trace metals in cationic forms are strongly absorbed at the surface level of the soil profile. The absolute content of a given heavy metal in the soil is a sufficient criterion to assess the degree of contamination of the soil environment with a given element. Such an assessment is often carried out on an agricultural land and is very important when assessing the amount of a toxic compound that may enter the biogeochemical cycle, and thus may reach the end consumer, which is humans. The conducted research allows evaluating the examined soils as not contaminated with chromium Cr, nickel Ni, and copper Cu. The soils of the Poleski National Park contain increased lead Pb concentrations and are highly contaminated with cadmium Cd. Cadmium Cd concentrations in the soils of the Poleski National Park are higher than in the areas more exposed to the anthropogenic impact [59].
Research has shown that protected areas such as parks are recipients of pollutants containing heavy metals that accumulate in the soils. The accumulation of heavy metals in the soil of the Poleski National Park may be related to the quality of plant communities, especially conifers, which have the ability to accumulate heavy metals in needles [60]. The obtained results were consistent with the research of other scientists [61,62,63]. Another basic source of pollution of the soils of the Poleski National Park with heavy metals are anthropogenic activities. These protected ecosystems have received pollutants in the gaseous or aerosol form, transported from long distances [64]. The emission of pollutants rich in heavy metals by aero position contributes to the contamination of National Parks [64,65,66]. Pollution in the area of parks is also the result of the impact of nearby roads with high traffic [29,67,68]. Pollution of the soil environment in protected areas may also be caused by intensive agricultural activity resulting from inadequate fertilization or the use of plant protection products [38,69,70,71,72,73]. Within National Parks, in situ activities, such as environmental overexploitation and tourism, also exert anthropogenic pressure.
5. Conclusions
The studies allow determining the concentration and spread of radionuclides in the soil in the Poleski National Park. The spread of anthropogenic radionuclides concentration in the Poleski National Park was the highest. There is a large region which is characterized by low natural radionuclides concentration and two sites with high concentration of natural radionuclides. All things considered, regarding anthropogenic radionuclides, the southern regions are characterized by their lower concentration than the northern regions. Moreover, the study enables people to assess the radiation hazard by determining the absorbed doses and the annual effective dose. The absorbed dose for humans from each sampling site was lower than the average worldwide value. While the annual effective dose obtained for each sampling site was mainly higher than the worldwide average value. Also, the annual effective dose calculated for the Poleski National Park was over three times higher than the worldwide average value. Despite the fact that the annual effective dose is higher than average worldwide value, it does not pose a threat to human health and life. There are areas where the annual effective dose is several hundred times higher, e.g., Ramsar in Iran. The soils of the Poleski National Park are characterized by pollution with the tested heavy metals, especially cadmium. The content of heavy metals does not exceed the average content of heavy metals in the sandy soils in Europe and in the world. Nevertheless, the differences between the content of these metals in the surface layers were significant for all analyzed heavy metals. Igeo values indicate cadmium contamination of the soils. The importance of this type of research for the Poleski National Park comes down to the movement and distribution of metals in the soil, which are the main problems that affect plants in the contaminated soil and their possible consumption by animals and, consequently, humans in the food chain process.
Author Contributions
Methodology, K.W. and M.D.-L.; Software, K.W.; Validation, K.W. and A.W.; Formal analysis, K.W.; Investigation, K.W.; Resources, M.W.; Data curation, K.W.; Writing—original draft, M.D.-L. and A.W.; Writing—review & editing, M.W. and M.D.-L.; Supervision, M.W.; Project administration, A.W.; Funding acquisition, M.W. All authors have read and agreed to the published version of the manuscript.
Funding
This research received no external funding.
Institutional Review Board Statement
Not applicable.
Informed Consent Statement
Not applicable.
Data Availability Statement
The data presented in this study are available on request from the corresponding author.
Conflicts of Interest
The authors declare no conflict of interest.
References
- Kabata-Pendias, A.; Szteke, B. Trace Elements in Abiotic and Biotic Environments; Taylor & Francis Group: Milton Park, UK, 2015. [Google Scholar]
- UNSCEAR 2008. United Nations Scientific Committee on the Effects of Atomic Radiation. Volume I: (Sources) Report to the General Assembly, Scientific Annexes A and B. ISBN: 978-92-1-142274-0. Available online: https://www.unscear.org/ (accessed on 4 July 2023).
- do Carmo Leal, A.L.; da Costa Lauria, D.; Ribeiro, F.C.; Viglio, E.P.; Franzen, M.; Lima, E.D.A.M. Spatial distributions of natural radionuclides in soils of the state of Pernambuco, Brazil: Influence of bedrocks, soils types and climates. J. Environ. Radioact. 2019, 211, 106046. [Google Scholar] [CrossRef] [PubMed]
- Heidari, M.H.; Porghasem, M.; Mirzaei, N.; Mohseni, J.H.; Heidari, M.; Azargashb, E.; Movafagh, A.; Heidari, R.; Molouki, A.; Larijani, L. The effect of high level natural ionizing radiation on expression of PSA, CA19-9 and CEA tumor markers in blood serum of inhabitants of Ramsar, Iran. J. Environ. Radioact. 2014, 128, 64–67. [Google Scholar] [CrossRef] [PubMed]
- Bakhtiari, E.; Monfared, A.S.; Niaki, H.A.; Borzoueisileh, S.; Niksirat, F.; Fattahi, S.; Monfared, M.K.; Gorji, K.E. The expression of MLH1 and MSH2 genes among inhabitants of high background radiation area of Ramsar, Iran. J. Environ. Radioact. 2019, 208, 106012. [Google Scholar] [CrossRef]
- Rani, A.; Mittal, S.; Mehra, R.; Ramola, R.C. Assessment of natural radionuclides in the soil samples from Marwar region of Rajasthan. India. Appl. Radiat. Isot. 2015, 101, 122–126. [Google Scholar] [CrossRef] [PubMed]
- Cinelli, G.; Tondeur, F.; Dehandschutter, B. Mapping potassium and thorium concentrations in Belgian soils. J. Environ. Radioact. 2018, 185, 127–139. [Google Scholar] [CrossRef]
- Mehra, R.; Badhan, K.; Sonkawade, R.G.; Kansal, S. Analysis of terrestrial natural radionuclides in soil samples and assessment of average effective dose. Singh Indian J. Pure Appl. Phys. 2010, 48, 805–808. [Google Scholar]
- Dudzik, P.; Sawicka-Kapusta, K.; Tybik, R.; Pacwa, K. Assessment of environmental pollution by metals, sulphure dioxide and nitrogen in Woliński National Park. Nat. Environ. Monit. 2010, 11, 37–48. [Google Scholar]
- Dhawal, S.J.; Kulkarni, G.S.; Pawar, S.H. Terrestrial background radiation studies in South Konkan, Maharashtra, India. Int. J. Radiat. Res. 2013, 11, 263–270. [Google Scholar]
- Xiao, C.; He, N.; Liu, Y.; Wang, Y.; Liu, Q. Research progress on biodosimeters of ionizing radiation damage. Radiat. Med. Prot. 2020, 1, 127–132. [Google Scholar] [CrossRef]
- Cinelli, G.; Tollefsen, T.; Bossew, P.; Gruber, V.; Bogucarskis, K.; De Felice, L.; De Cort, M. Digital version of the European Atlas of natural radiation. J. Environ. Radioact. 2019, 196, 240–252. [Google Scholar] [CrossRef]
- Rafique, M.; Rehman, H.; Malik, M.F.; Rajput, M.U.; Rahman, S.U.; Rathore, M.H. Assessment of radiological hazards due to soil and building materials used in Mirpur Azad Kashmir; Pakistan. Int. J. Radiat. Res. 2011, 9, 77–87. [Google Scholar]
- Saleh, I.H. Radioactivity of 238U, 232Th, 40K, and 137Cs and assessment of depleted uranium in soil of the Musandam Peninsula, Sultanate of Oman. Turk. J. Eng. Environ. Sci. 2012, 36, 236–248. [Google Scholar] [CrossRef]
- Matisoff, G.; Ketterer, M.E.; Rosén, K.; Mietelski, J.W.; Vitko, L.F.; Persson, H.; Lokas, E. Downward migration of Chernobyl-derived radionuclides in soils in Poland and Sweden. Appl. Geochem. 2011, 26, 105–115. [Google Scholar] [CrossRef]
- Silant’Ev, A.N.; Silant’Ev, K.A.; Shkuratova, I.G. Dose-rate change due to137Cs migration in soil. At. Energy 1997, 83, 772–774. [Google Scholar] [CrossRef]
- Alexakhin, R.M.; Sanzharova, N.I.; Fesenko, S.; Panov, A.V. Chernobyl radionuclide distribution and migration. Health Phys. 2007, 93, 418–426. [Google Scholar] [CrossRef]
- Szabó, K.Z.; Udvardi, B.; Horváth, Á.; Bakacsi, Z.; Pásztor, L.; Szabó, J.; Laczkó, L.; Szabó, C. Cesium-137 concentration of soils in Pest County, Hungary. J. Environ. Radioact. 2012, 110, 38–45. [Google Scholar] [CrossRef]
- Chibowski, S.; Zygmunt, J. The influence of the sorptive properties of organic soils on the migration rate of 137Cs. J. Environ. Radioact. 2002, 61, 213–223. [Google Scholar] [CrossRef]
- Popovic, D.; Todorovic, D.; Spasic Jokic, V.; Nikolic, J.; Ajtic, J. Contents of Radionuclides in Soils in Serbia: Dose Calculations and Environmental Risk Assessment. In Advances in Environmental Research; Daniels, J.A., Ed.; Nova Science Publishers: New York, NY, USA, 2010; Chapter 3. [Google Scholar]
- Jokic, V.S.; Zupunski, L.; Zupunski, I. Measurement uncertainty estimation of health risk from exposure to natural radionuclides in soil. Measurement 2013, 46, 2376–2383. [Google Scholar] [CrossRef]
- Szarek, Ł.; Falaciński, P.; Wojtkowska, M. Immobilization of selected heavy metals from fly ash from thermal treatment of municipal sewage sludge in hardening slurries. Arch. Civ. Eng. 2018, 64, 131–144. [Google Scholar] [CrossRef]
- Wuana, R.A.; Okieimen, F.E. Heavy Metals in Contaminated Soils: A Review of Sources, Chemistry, Risks and Best Available Strategies for Remediation. Int. Sch. Res. Netw. ISRN Ecol. 2011, 2011, 402647. [Google Scholar] [CrossRef]
- Modaihsh, A.; Ai-Swailem, M.; Mahjoub, M. Heavy Metals Content of Commercial Inorganic Fertilizers Used in the Kingdom of Saudi Arabia. J. Agric. Mar. Sci. 2004, 9, 21–25. [Google Scholar] [CrossRef]
- Chehregani, A.; Malayeri, B.E. Removal of heavy metals by native accumulator plants. Int. J. Agric. Biol. 2007, 9, 462–465. [Google Scholar]
- Fulekar, M.; Singh, A.; Bhaduri, A.M. Genetic engineering strategies for enhancing phytoremediation of heavy metals. Afr. J. Biotechnol. 2009, 8, 529–535. [Google Scholar]
- Javied, S.; Mehmood, T.; Chaudhry, M.; Tufail, M.; Irfan, N. Heavy metal pollution from phosphate rock used for the production of fertilizer in Pakistan. Microchem. J. 2009, 91, 94–99. [Google Scholar] [CrossRef]
- Liaghati, T.; Preda, M.; Cox, M. Heavy metal distribution and controlling factors within coastal plain sediments, Bells Creek catchment, southeast Queensland, Australia. Environ. Int. 2004, 29, 935–948. [Google Scholar] [CrossRef]
- Mmolawa, K.B.; Likuku, A.S.; Gaboutloeloe, G.K. Assessment of heavy metal pollution in soils along major roadside areas in Botswana. Afr. J. Environ. Sci. Technol. 2011, 3, 186–196. [Google Scholar]
- Alloway, B.J.; Ayres, D.C. Chemical Foundations of Environmental Pollution; Scientific Publishers PWN: Warszawa, Poland, 1999. [Google Scholar]
- Marchanda, C.; Allenbachb, M.; Lallier-Vergèsc, E. Relationships between heavy metals distribution and organic matter cycling in mangrove sediments (Conception Bay, New Caledonia). Geoderma 2011, 160, 444–456. [Google Scholar] [CrossRef]
- Karczewska, A. Soil Protection and Reclamation of Degraded Areas; Wydawnictwo Uniwersytet Przyrodniczy: Wrocław, Poland, 2012. [Google Scholar]
- Piotrowski, W.; Piasecka, E.; Szymański, J. Museum of the Polesie National Park. 21; PPH Zapol, Domachowski Sobczyk: Urszulin, Poland, 2005; ISBN 83-60140-11-1. [Google Scholar]
- Chmielewski, T.J. Poleski National Park. Nat. Pol. 1990, 10, 10–11. [Google Scholar]
- Isajenko, K.; Kardaś, M.; Piotrowska, B.; Kwiatkowska, I.; Stawarz, O.; Wojtkowski, K.; Kiełbasińskan, A. Ionizing Radiation Monitoring Carried out as Part of the State Environmental Monitoring, Task 3: Monitoring of 137Cs Concentration in the Soil, Annual Report on the Third Stage of Work; CLOR: Warszawa, Poland, 2018. [Google Scholar]
- PN ISO 11466; Soil Quality—Extraction Of Trace Elements Soluble in Aqua Regia. TC 191. Polish Committee for Standardization: Warsaw, Polish, 2002.
- Długosz-Lisiecka, M.; Ziomek, M. Direct determination of radionuclides in building materials with self-absorption correction for the 63 and 186 keV γ-energy lines. J. Environ. Radioact. 2015, 150, 44–48. [Google Scholar] [CrossRef]
- Inoue, K.; Fukushi, M.; Van Le, T.; Tsuruoka, H.; Kasahara, S.; Nimelan, V. Distribution of gamma radiation dose rate related with natural radionuclides in all of Vietnam and radiological risk assessment of the built-up environment. Sci. Rep. 2020, 10, 12428. [Google Scholar] [CrossRef]
- Kurnaz, A.; Küçükömeroğlu, B.; Keser, R.; Okumusoglu, N.; Korkmaz, F.; Karahan, G.; Çevik, U. Determination of radioactivity levels and hazards of soil and sediment samples in Fırtına Valley (Rize, Turkey). Appl. Radiat. Isot. 2007, 65, 1281–1289. [Google Scholar] [CrossRef]
- PN ISO 11047; Soil Quality Determination of Cadmium, Chromium, Cobalt, Copper, Lead, Manganese, Nickel and Zinc Flame and Electrothermal Atomic Absorption Spectrometric Methods. International Organization for Standardization: Geneva, Switzerland, 2001.
- Tabelin, C.B.; Silwamba, M.; Paglinawan, F.C.; Mondejar, A.J.S.; Duc, H.G.; Resabal, V.J.; Opiso, E.M.; Igarashi, T.; Tomiyama, S.; Ito, M.; et al. Solid-phase partitioning and release-retention mechanisms of copper, lead, zinc and arsenic in soils impacted by artisanal and small-scale gold mining (ASGM) activities. Chemosphere 2020, 260, 127574. [Google Scholar] [CrossRef] [PubMed]
- Bantan, R.A.; Al-Dubai, T.A.; Al-Zubieri, A.G. Geo-environmental assessment of heavy metals in the bottom sediments of the Southern Corniche of Jeddah, Saudi Arabia. Mar. Pollut. Bull. 2020, 161, 111721. [Google Scholar] [CrossRef]
- Muller, G. Index of geo-accumulation in sediments of the Rhine River. Geo. J. 1969, 2, 108–118. [Google Scholar]
- Hrabovskyy, V.; Dzendzelyuk, O.; Katerynchuk, I.; Furgala, Y. Monitoring of radionuclides contamination of soils in Shatsk National Natural Park (Volyn Region, Ukraine) during 1994–2001. J. Environ. Radioact. 2004, 72, 25–33. [Google Scholar] [CrossRef]
- Tanasković, I.; Golobocanin, D.; Miljević, N. Multivariate statistical analysis of hydrochemical and radiological data of Serbian spa waters. J. Geochem. Explor. 2012, 112, 226–234. [Google Scholar] [CrossRef]
- Avdic, S.; Demirovic, D.; Kunosic, S.; Pehlivanovic, B.; Kadic, I.; Ilic, Z. A study of daily variations of the outdoor background radiation measured in continuous mode in Federation of Bosnia and Herzegovina. J. Environ. Radioact. 2020, 217, 106212. [Google Scholar] [CrossRef]
- Janković, M.; Todorović, D.; Savanović, M. Radioactivity measurements in soil samples collected in the Republic of Srpska. Radiat. Meas. 2008, 43, 1448–1452. [Google Scholar] [CrossRef]
- Ivanić, M.; Fiket, Z.; Medunić, G.; Turk, M.F.; Marović, G.; Senčar, J.; Kniewald, G. Corrigendum to “Multi-element composition of soil, mosses and mushrooms and assessment of natural and artificial radioactivity of a pristine temperate rainforest system (Slavonia, Croatia)”. Chemosphere 2019, 234, 987–989. [Google Scholar] [CrossRef]
- Radolić, V.; Miklavčić, I.; Sovilj, M.P.; Stanić, D.; Petrinec, B.; Vuković, B. The natural radioactivity of Istria, Croatia. Radiat. Phys. Chem. 2019, 155, 332–340. [Google Scholar] [CrossRef]
- Sarap, N.B.; Rajačić, M.M.; Đalović, I.G.; Šeremešić, S.I.; Đorđević, A.R.; Janković, M.M.; Daković, M.Z. Distribution of natural and artificial radionuclides in chernozem soil/crop system from stationary experiments. Environ. Sci. Pollut. Res. 2016, 23, 17761–17773. [Google Scholar] [CrossRef] [PubMed]
- Jasaitis, D.; Klima, V.; Pečiulienė, M.; Vasiliauskienė, V.; Konstantinova, M. Comparative Assessment of Radiation Background Due to Natural and Artificial Radionuclides in Soil in Specific Areas on the Territories of State of Washington (USA) and Lithuania. Water Air Soil Pollut. 2020, 231, 347. [Google Scholar] [CrossRef]
- Marčiulionienė, D.; Lukšienė, B.; Montvydienė, D.; Jefanova, O.; Mažeika, J.; Taraškevičius, R.; Stakėnienė, R.; Petrošius, R.; Maceika, E.; Tarasiuk, N.; et al. 137Cs and plutonium isotopes accumulation/retention in bottom sediments and soil in Lithuania: A case study of the activity concentration of anthropogenic radionuclides and their provenance before the start of operation of the Belarusian Nuclear Power Plant (NPP). J. Environ. Radioact. 2017, 178, 253–264. [Google Scholar] [CrossRef] [PubMed]
- Długosz-Lisiecka, M. Public Health Decision Making in the Case of the Use of a Nuclear Weapon. Int. J. Environ. Res. Public Health 2022, 19, 12766. [Google Scholar] [CrossRef] [PubMed]
- Długosz-Lisiecka, M.; Bem, H. Aerosol residence times and changes in radioiodine-131I and radiocaesium-137Cs activity over Central Poland after the Fukushima-Daiichi nuclear reactor accident. J. Environ. Monit. 2012, 14, 1483–1489. [Google Scholar] [CrossRef]
- Koua, A.; Michel, H.; Alabdullah, J.; Barci, V.; Aka, H.; Barci-Funel, G.; Ardisson, G. First measurements of anthropogenic and natural radionuclides in surface soils (10 cm) of Côte d’Ivoire. Comptes Rendus Chim. 2009, 12, 850–853. [Google Scholar] [CrossRef]
- Devi, V.; Chauhan, R.P. Estimation of natural radionuclide and exhalation rates of environmental radioactive pollutants from the soil of northern India. Nucl. Eng. Technol. 2020, 52, 1289–1296. [Google Scholar] [CrossRef]
- Matolín, M. Verification of the radiometric map of the Czech Republic. J. Environ. Radioact. 2017, 166, 289–295. [Google Scholar] [CrossRef]
- Rybach, L.; Bächler, D.; Bucher, B.; Schwarz, G. Radiation doses of Swiss population from external sources. J. Environ. Radioact. 2002, 62, 277–286. [Google Scholar] [CrossRef]
- Chrzan, A. The content of selected heavy metals in soil and soil fauna. Proc. ECOpole 2013, 7, 295–302. [Google Scholar] [CrossRef]
- Pająk, M.; Gąsiorek, M.; Cygan, A.; Wanic, T. Concentration of Cd, Pb and Zn in top layer of soil and needles of scots pine (Pinus Sylvestris L.): A case study of two extremely different conditions of the forest environment in Poland. Fresen. Environ. Bull. 2015, 24, 71–76. [Google Scholar]
- Sienkiewicz, A. Content of selected heavy metals in autogenic soils in the Supraśl and Dojlidy forest division in the Knyszyńska Forest. Civ. Environ. Eng. 2012, 2, 91–94. [Google Scholar]
- Vrbek, B.; Buzjak, N. Contribution to Knowledge of the Content of Heavy Metals (Pb, Cu, Zn and Cd) in Speleological Objects in the Risnjak National Park (Croatia). Acta Carsologica 2004, 33, 181–188. [Google Scholar] [CrossRef]
- Tomaškin, J.; Tomaškinová, J.; Kmeťová, J.; Drimal, M. The concentration of heavy metals in grassland ecosystems of the central Slovakia National Parks. Carpathian J. Earth Environ. Sci. 2013, 8, 35–40. [Google Scholar]
- Staszewski, T.; Łukasik, W.; Kubiesa, P. Contamination of Polish national parks with heavy metals. Environ. Monit. Assess. 2011, 184, 4597–4608. [Google Scholar] [CrossRef]
- Mortazavi, S.; Ghiassi-Nejad, M.; Ikushima, T. Do the findings on the health effects of prolonged exposure to very high levels of natural radiation contradict current ultra-conservative radiation protection regulations? Int. Congr. Ser. 2002, 1236, 19–21. [Google Scholar] [CrossRef]
- Dharani, N.; Onyari, J.M.; Maina, D.M.; Mavuti, K.M. The Distribution of Cu and Pb Levels in Soils and Acacia xanthophloea Benth. from Lake Nakuru National Park Kenya. Bull. Environ. Contam. Toxicol. 2007, 79, 172–177. [Google Scholar] [CrossRef] [PubMed]
- UNSCEAR 2000. United Nations Scientific Committee on the Effects of Atomic Radiation. In Annex B. Exposures from Natural Radiation Sources; United Nations Publication: New York, NY, USA, 2000. [Google Scholar]
- Kapanadze, K.; Magalashvili, A.; Imnadze, P. Distribution of natural radionuclides in the soils and assessment of radiation hazards in the Khrami Late Variscan crystal massif (Georgia). Heliyon 2019, 5, e01377. [Google Scholar] [CrossRef]
- Tong, J.; Hei, T.K. Aging and age-related health effects of ionizing radiation. Radiat. Med. Prot. 2020, 1, 15–23. [Google Scholar] [CrossRef]
- Feng, W.; Zhang, Y.; Li, Y.; Wang, P.; Zhu, C.; Shi, L.; Hou, X.; Qie, X. Spatial distribution, risk assessment and influence factors of terrestrial gamma radiation dose in China. J. Environ. Radioact. 2020, 222, 106325. [Google Scholar] [CrossRef]
- Araromi, O.I.; Ojo, A.O.; Olaluwoye, M.O.; Odefemi, O.B. The concentration of natural radionuclides in soil samples from the practical year agricultural farmland, University of Ibadan. IOSR J. Appl. Phys. 2016, 8, 60–68. [Google Scholar] [CrossRef]
- Wei, B.; Yang, L. A review of heavy metal contaminations in urban soils, urban road dusts and agricultural soils from China. Microchem. J. 2010, 94, 99–107. [Google Scholar] [CrossRef]
- Długosz-Lisiecka, M. Comparison of two spectrometric counting modes for fast analysis of selected radionuclides activity. J. Radioanal. Nucl. Chem. 2016, 309, 941–945. [Google Scholar] [CrossRef] [PubMed][Green Version]


Disclaimer/Publisher’s Note: The statements, opinions and data contained in all publications are solely those of the individual author(s) and contributor(s) and not of MDPI and/or the editor(s). MDPI and/or the editor(s) disclaim responsibility for any injury to people or property resulting from any ideas, methods, instructions or products referred to in the content. |
© 2023 by the authors. Licensee MDPI, Basel, Switzerland. This article is an open access article distributed under the terms and conditions of the Creative Commons Attribution (CC BY) license (https://creativecommons.org/licenses/by/4.0/).