
The Influence of Spent Portable Battery Waste on the Aquatic Environment


Abstract
:1. Introduction
2. Materials and Methods
2.1. Preparation of the Experiment
2.2. Solution Analysis
2.3. Concentration of Heavy Metals
3. Results
3.1. Solution Analysis
3.1.1. Chromatic Changes in Contact Solutions
3.1.2. pH
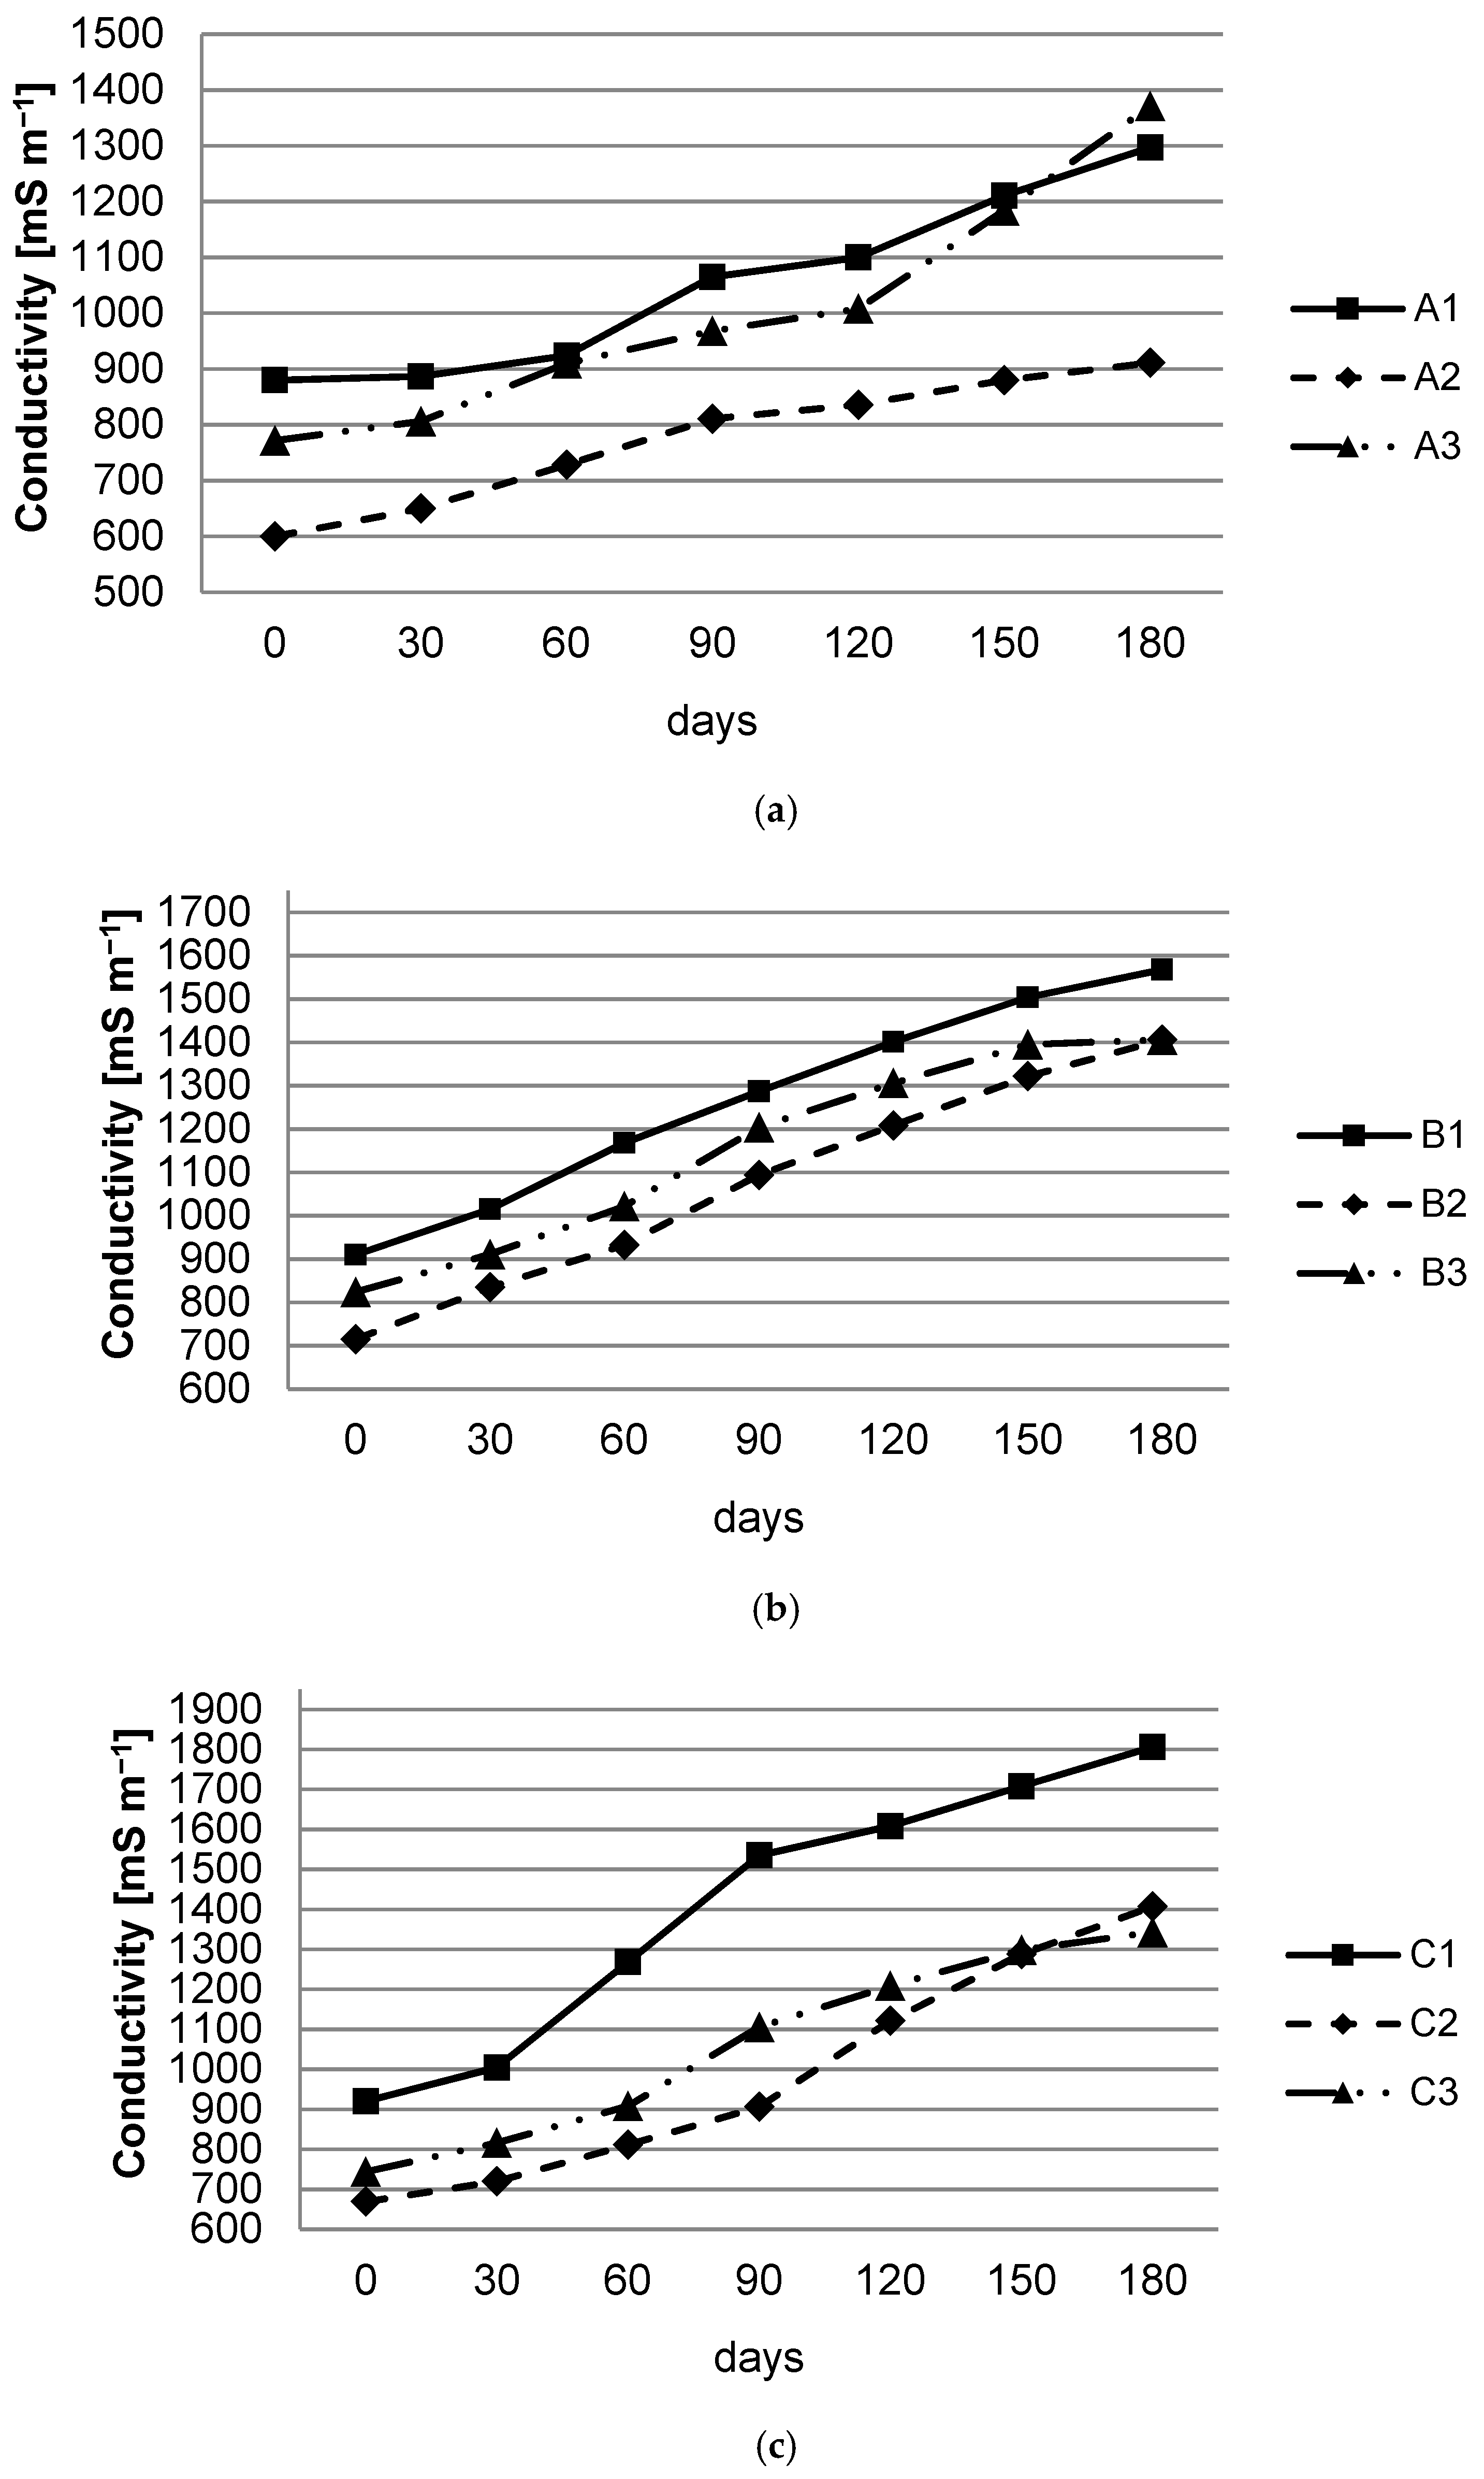
3.1.3. Conductivity
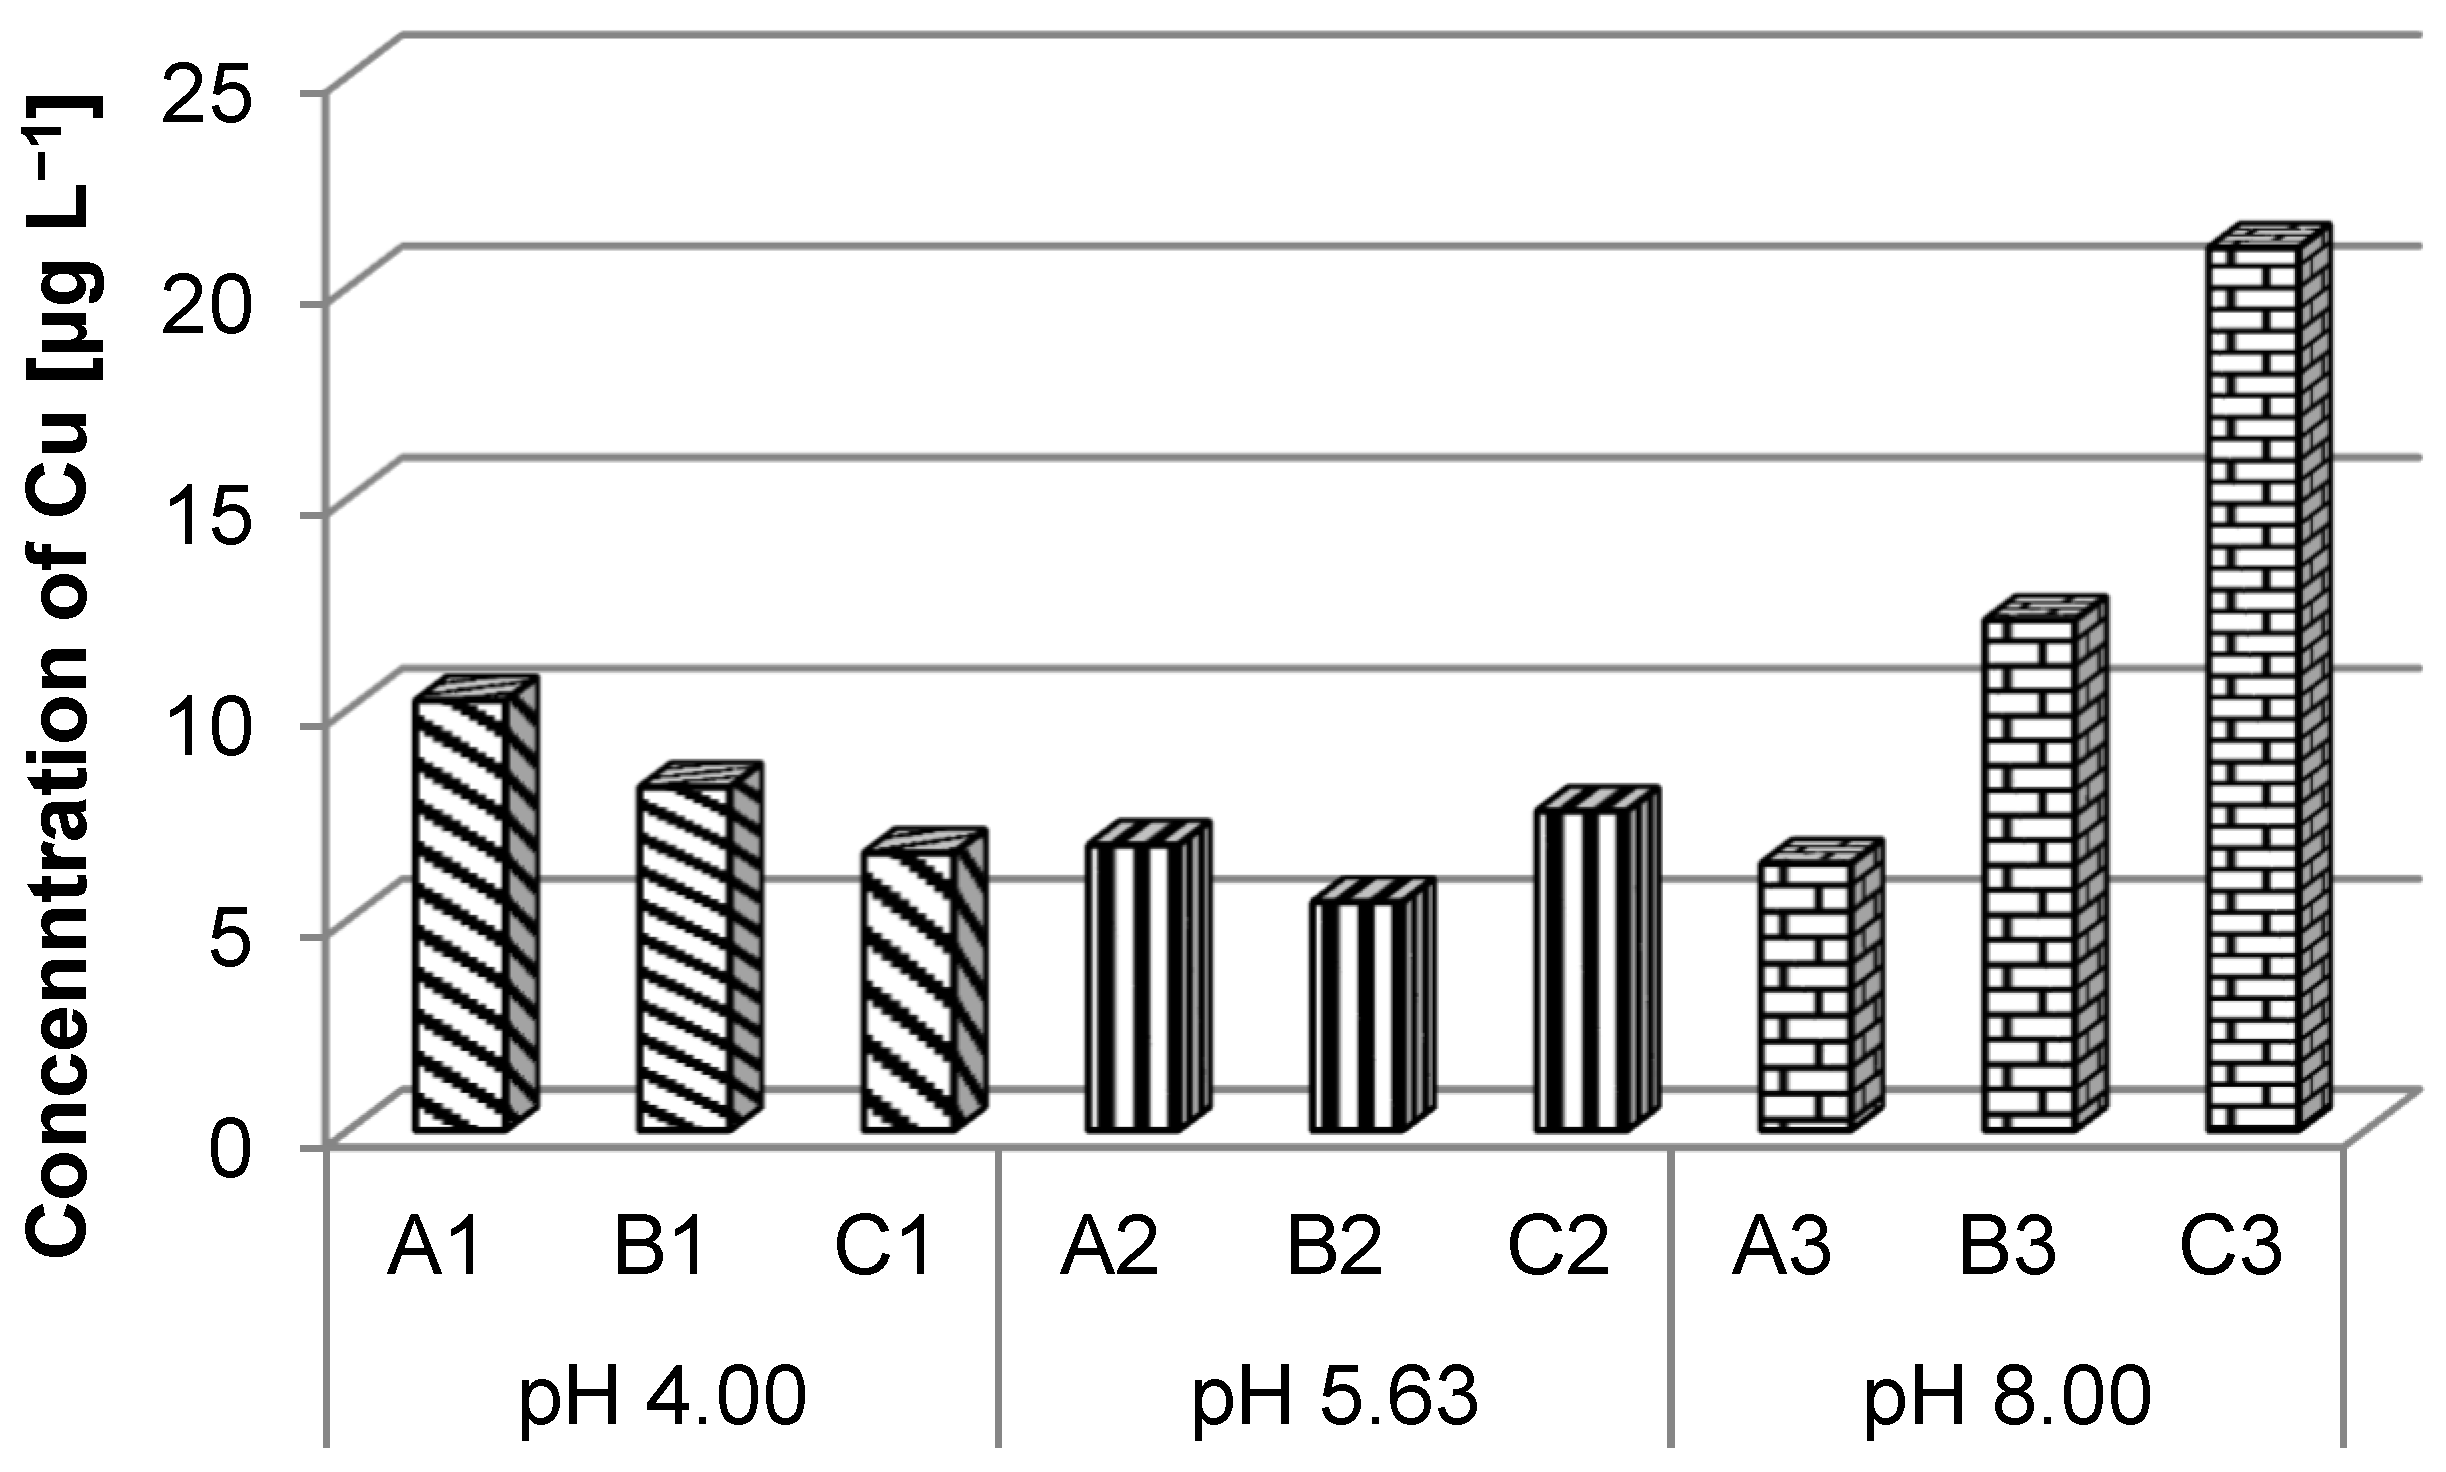
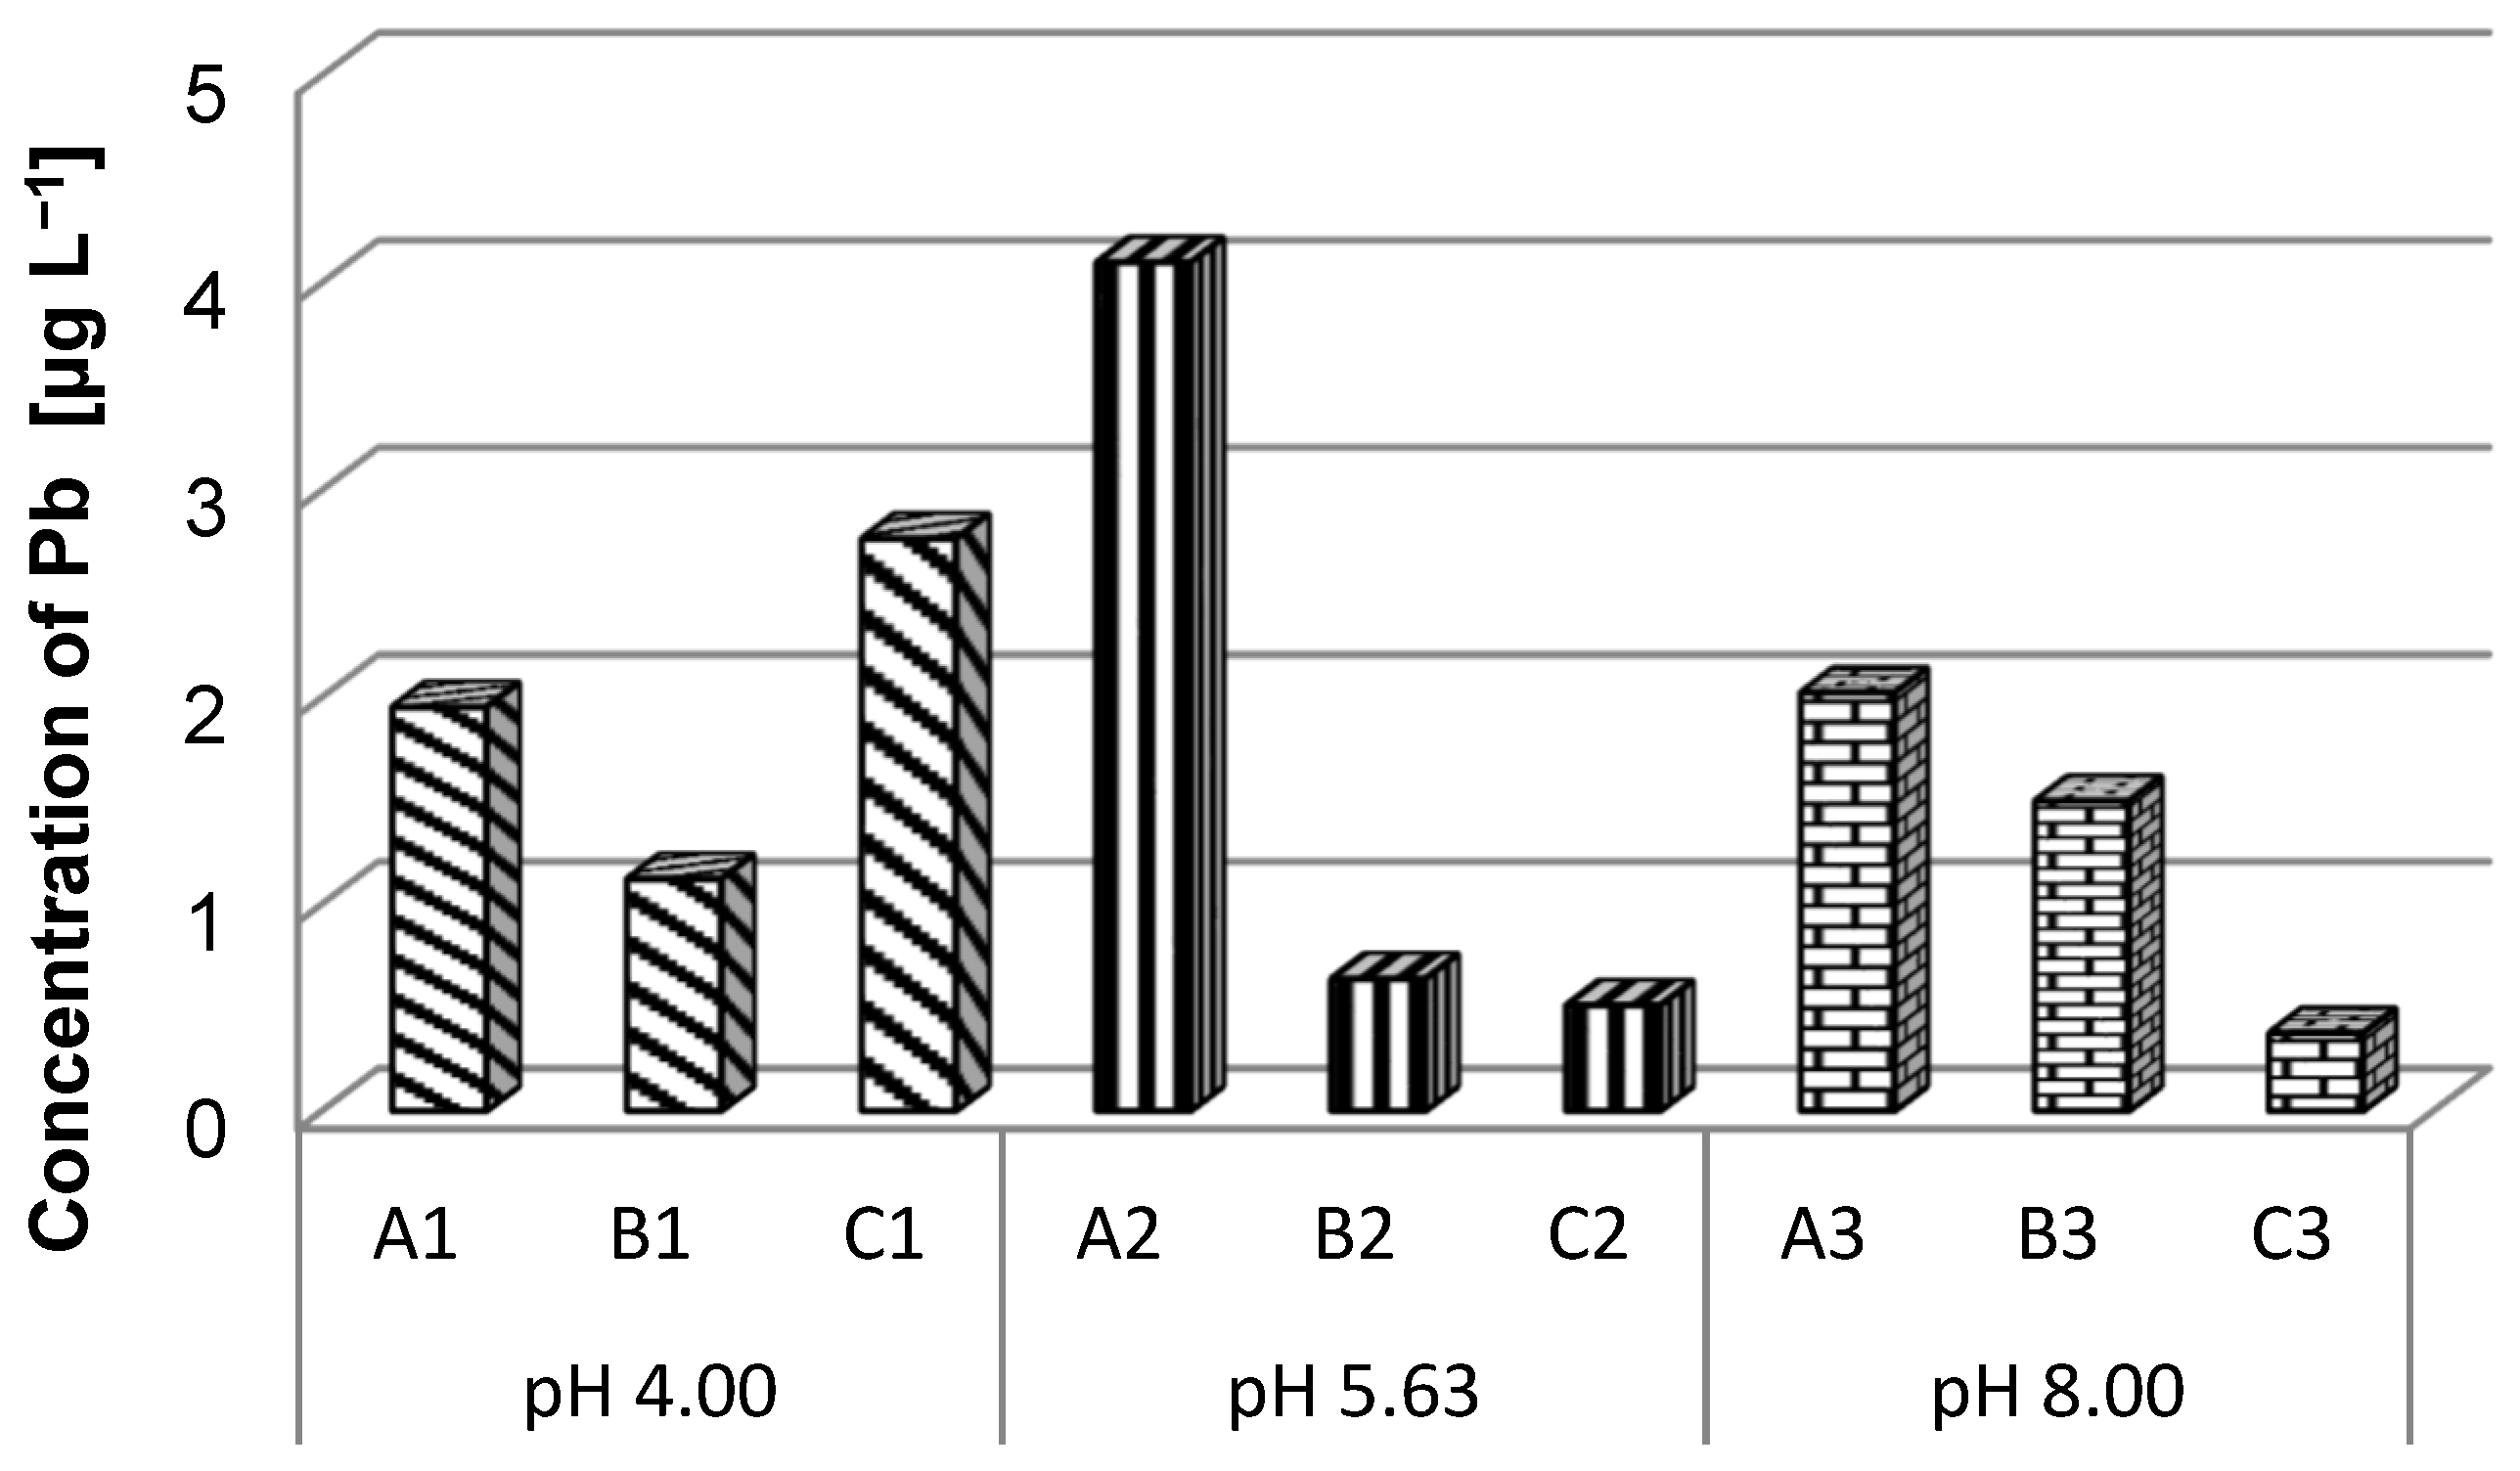
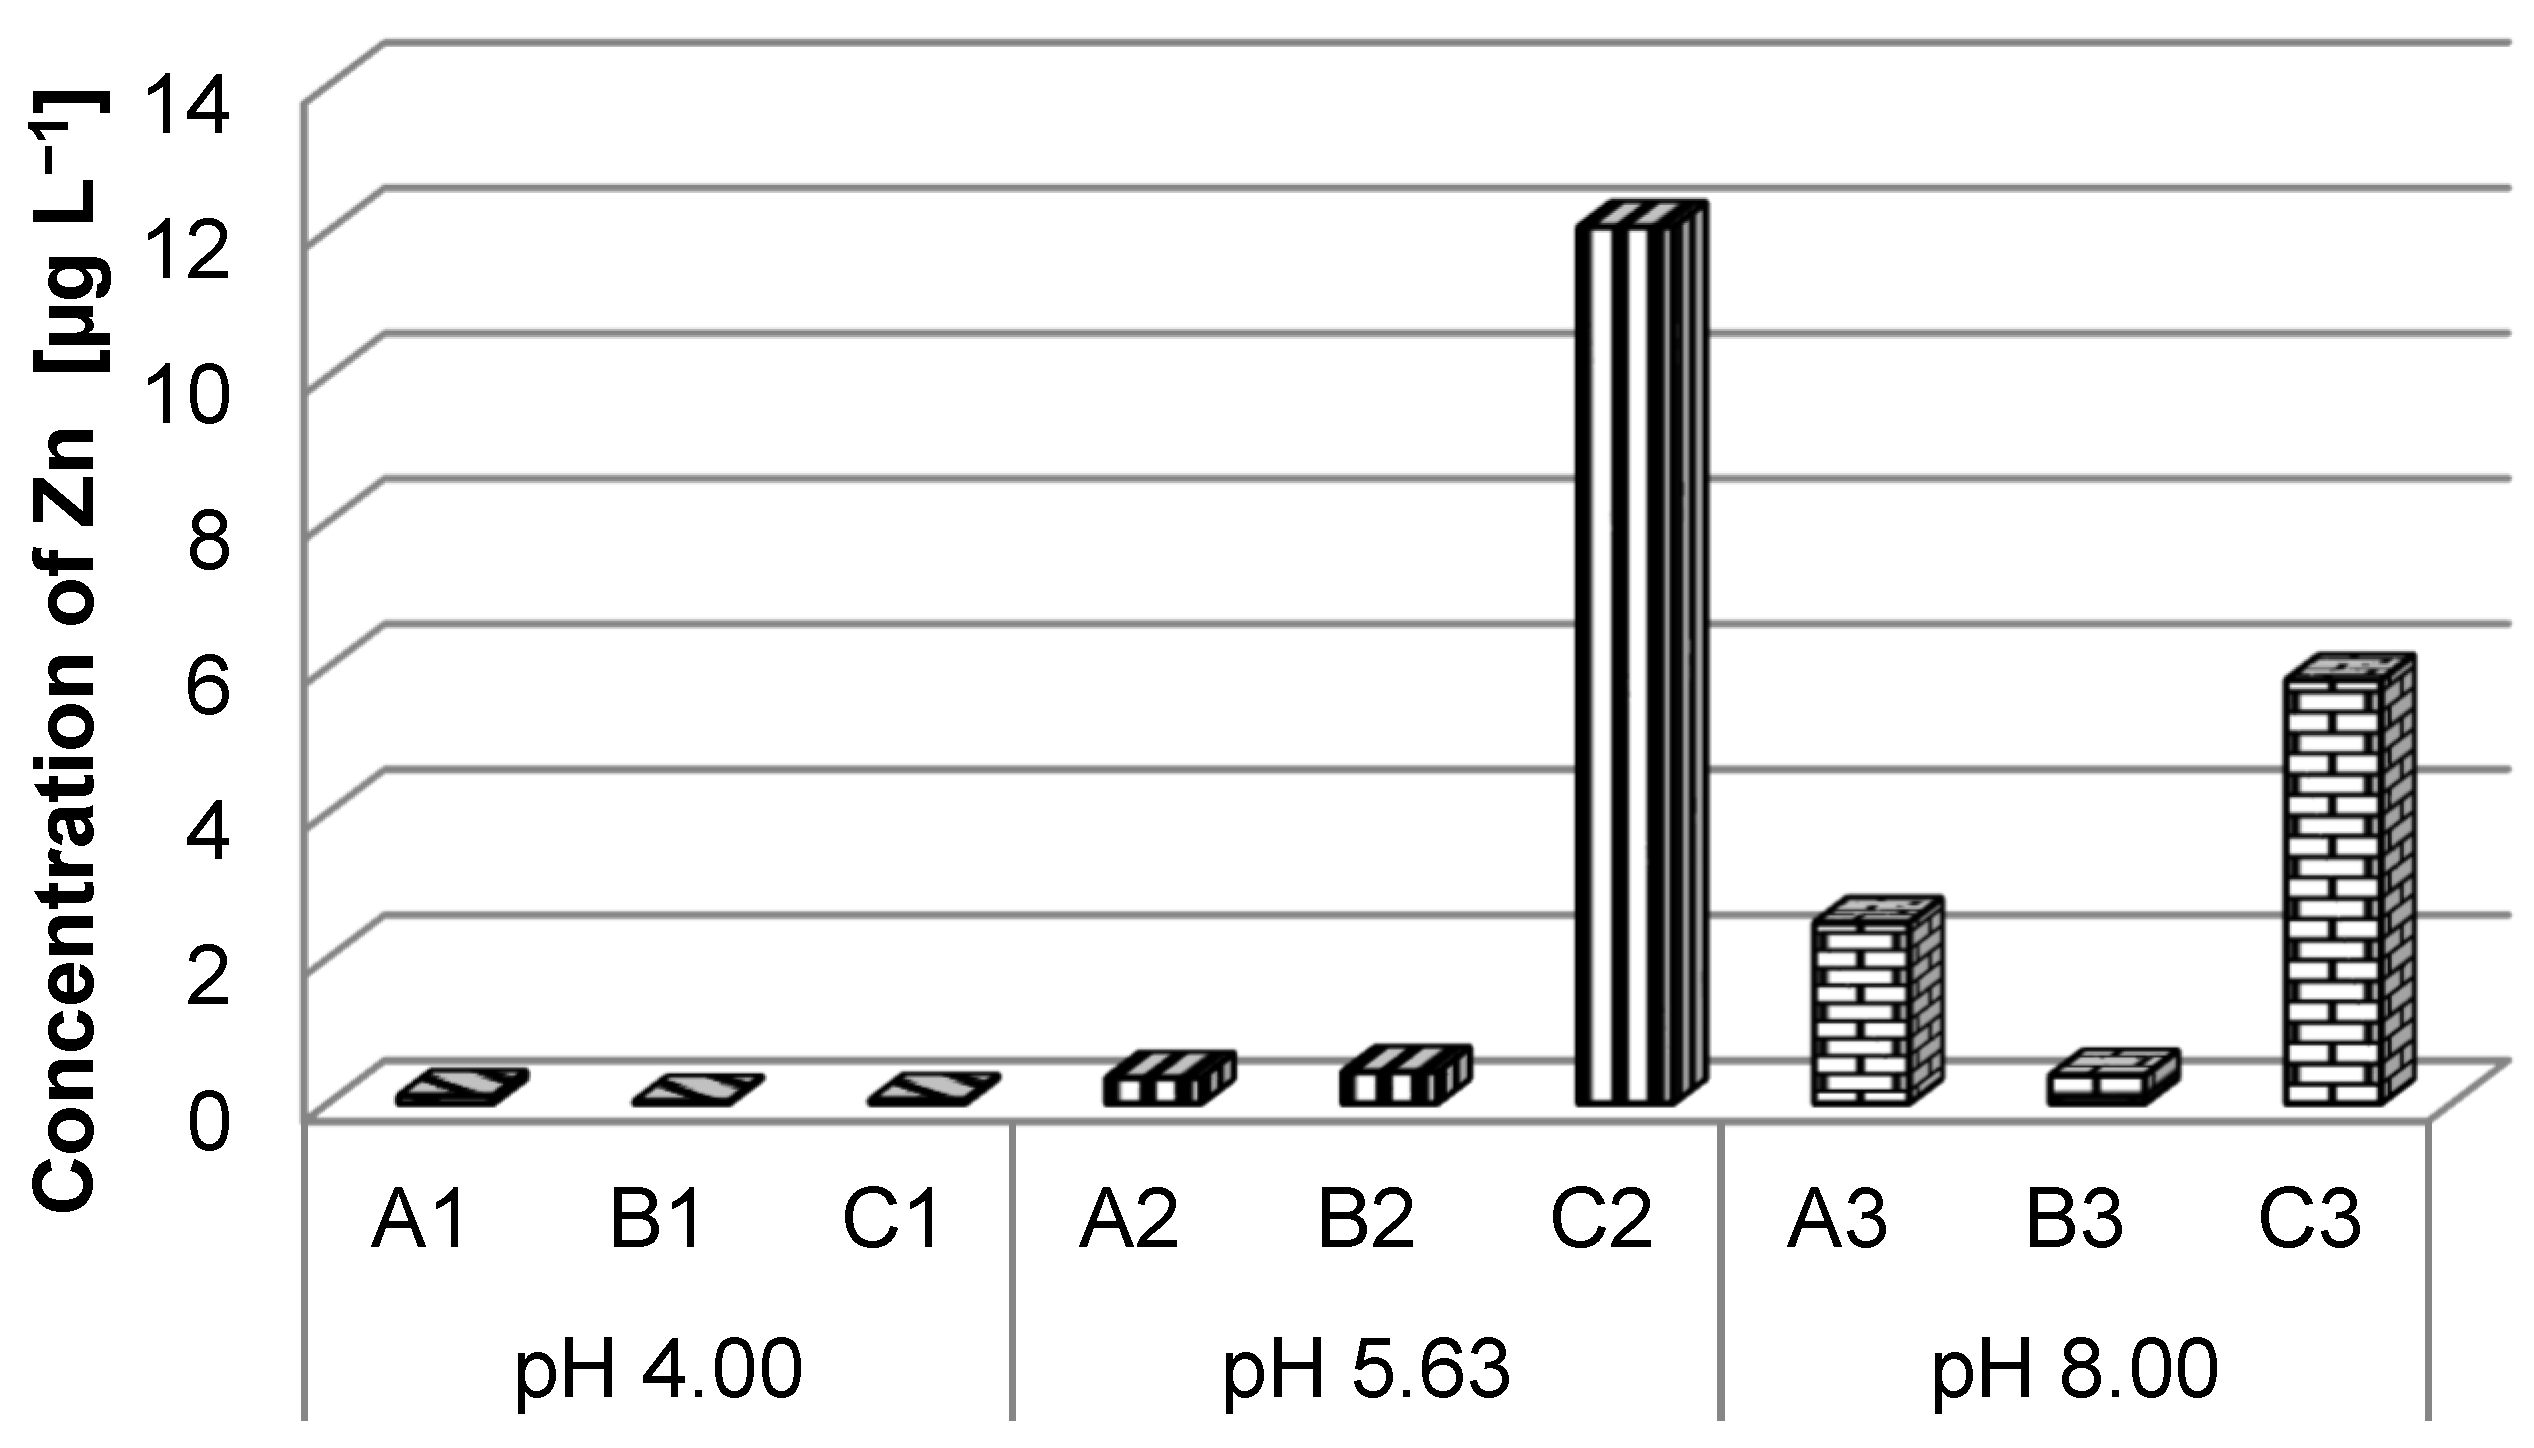
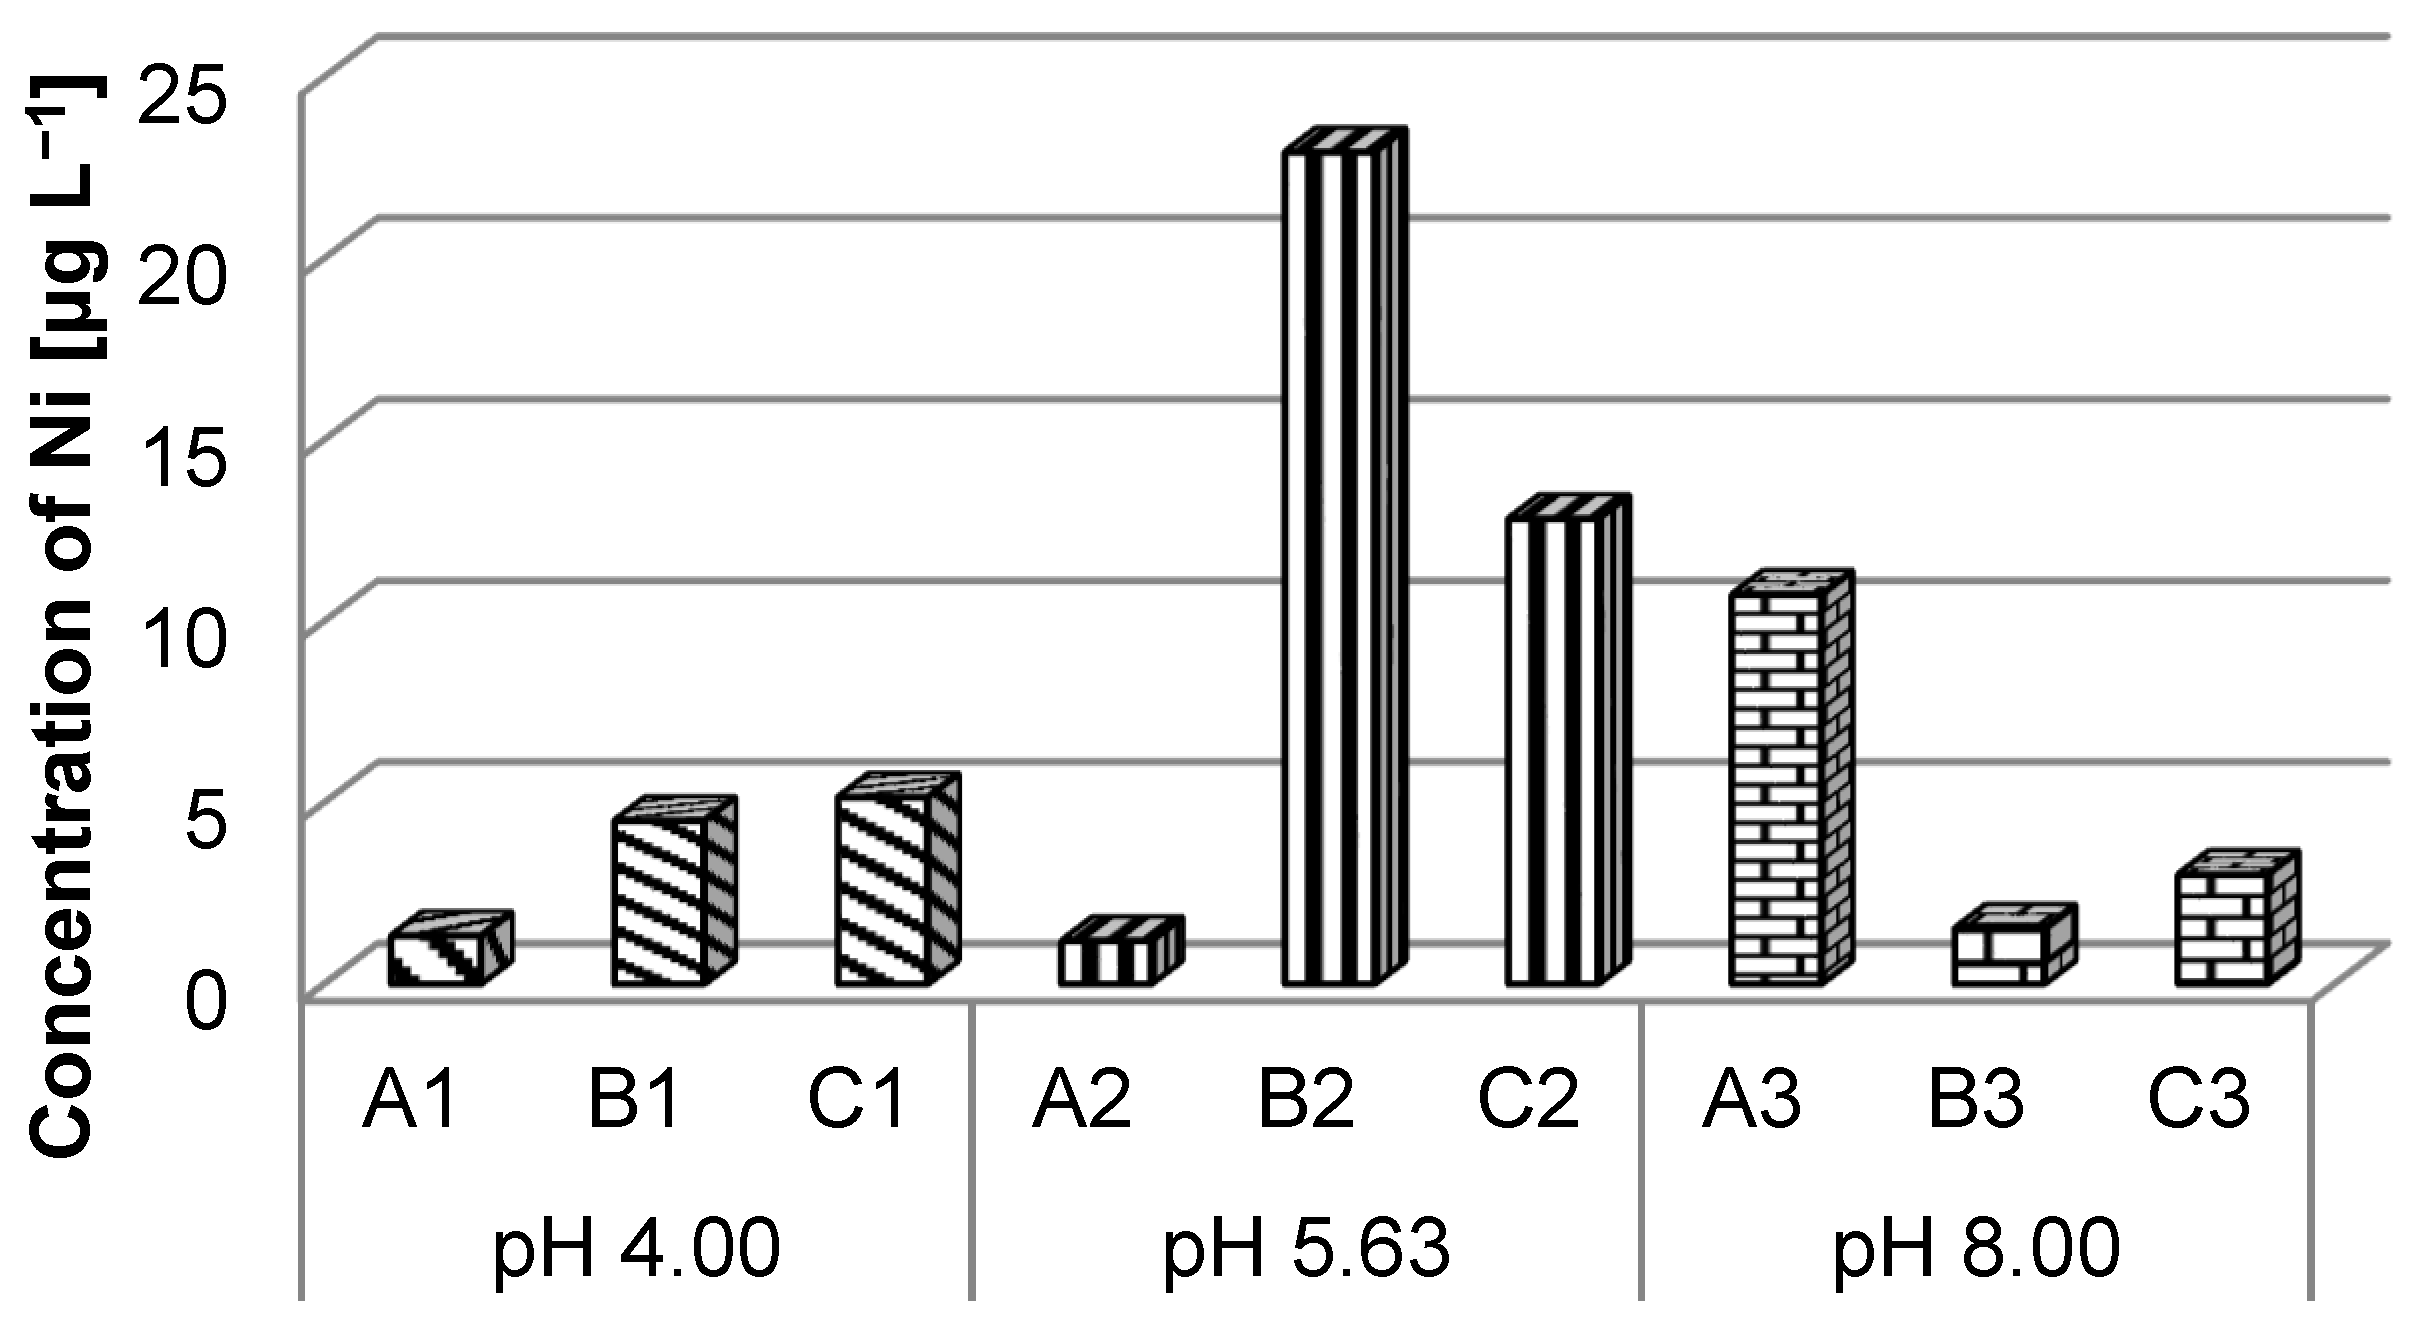
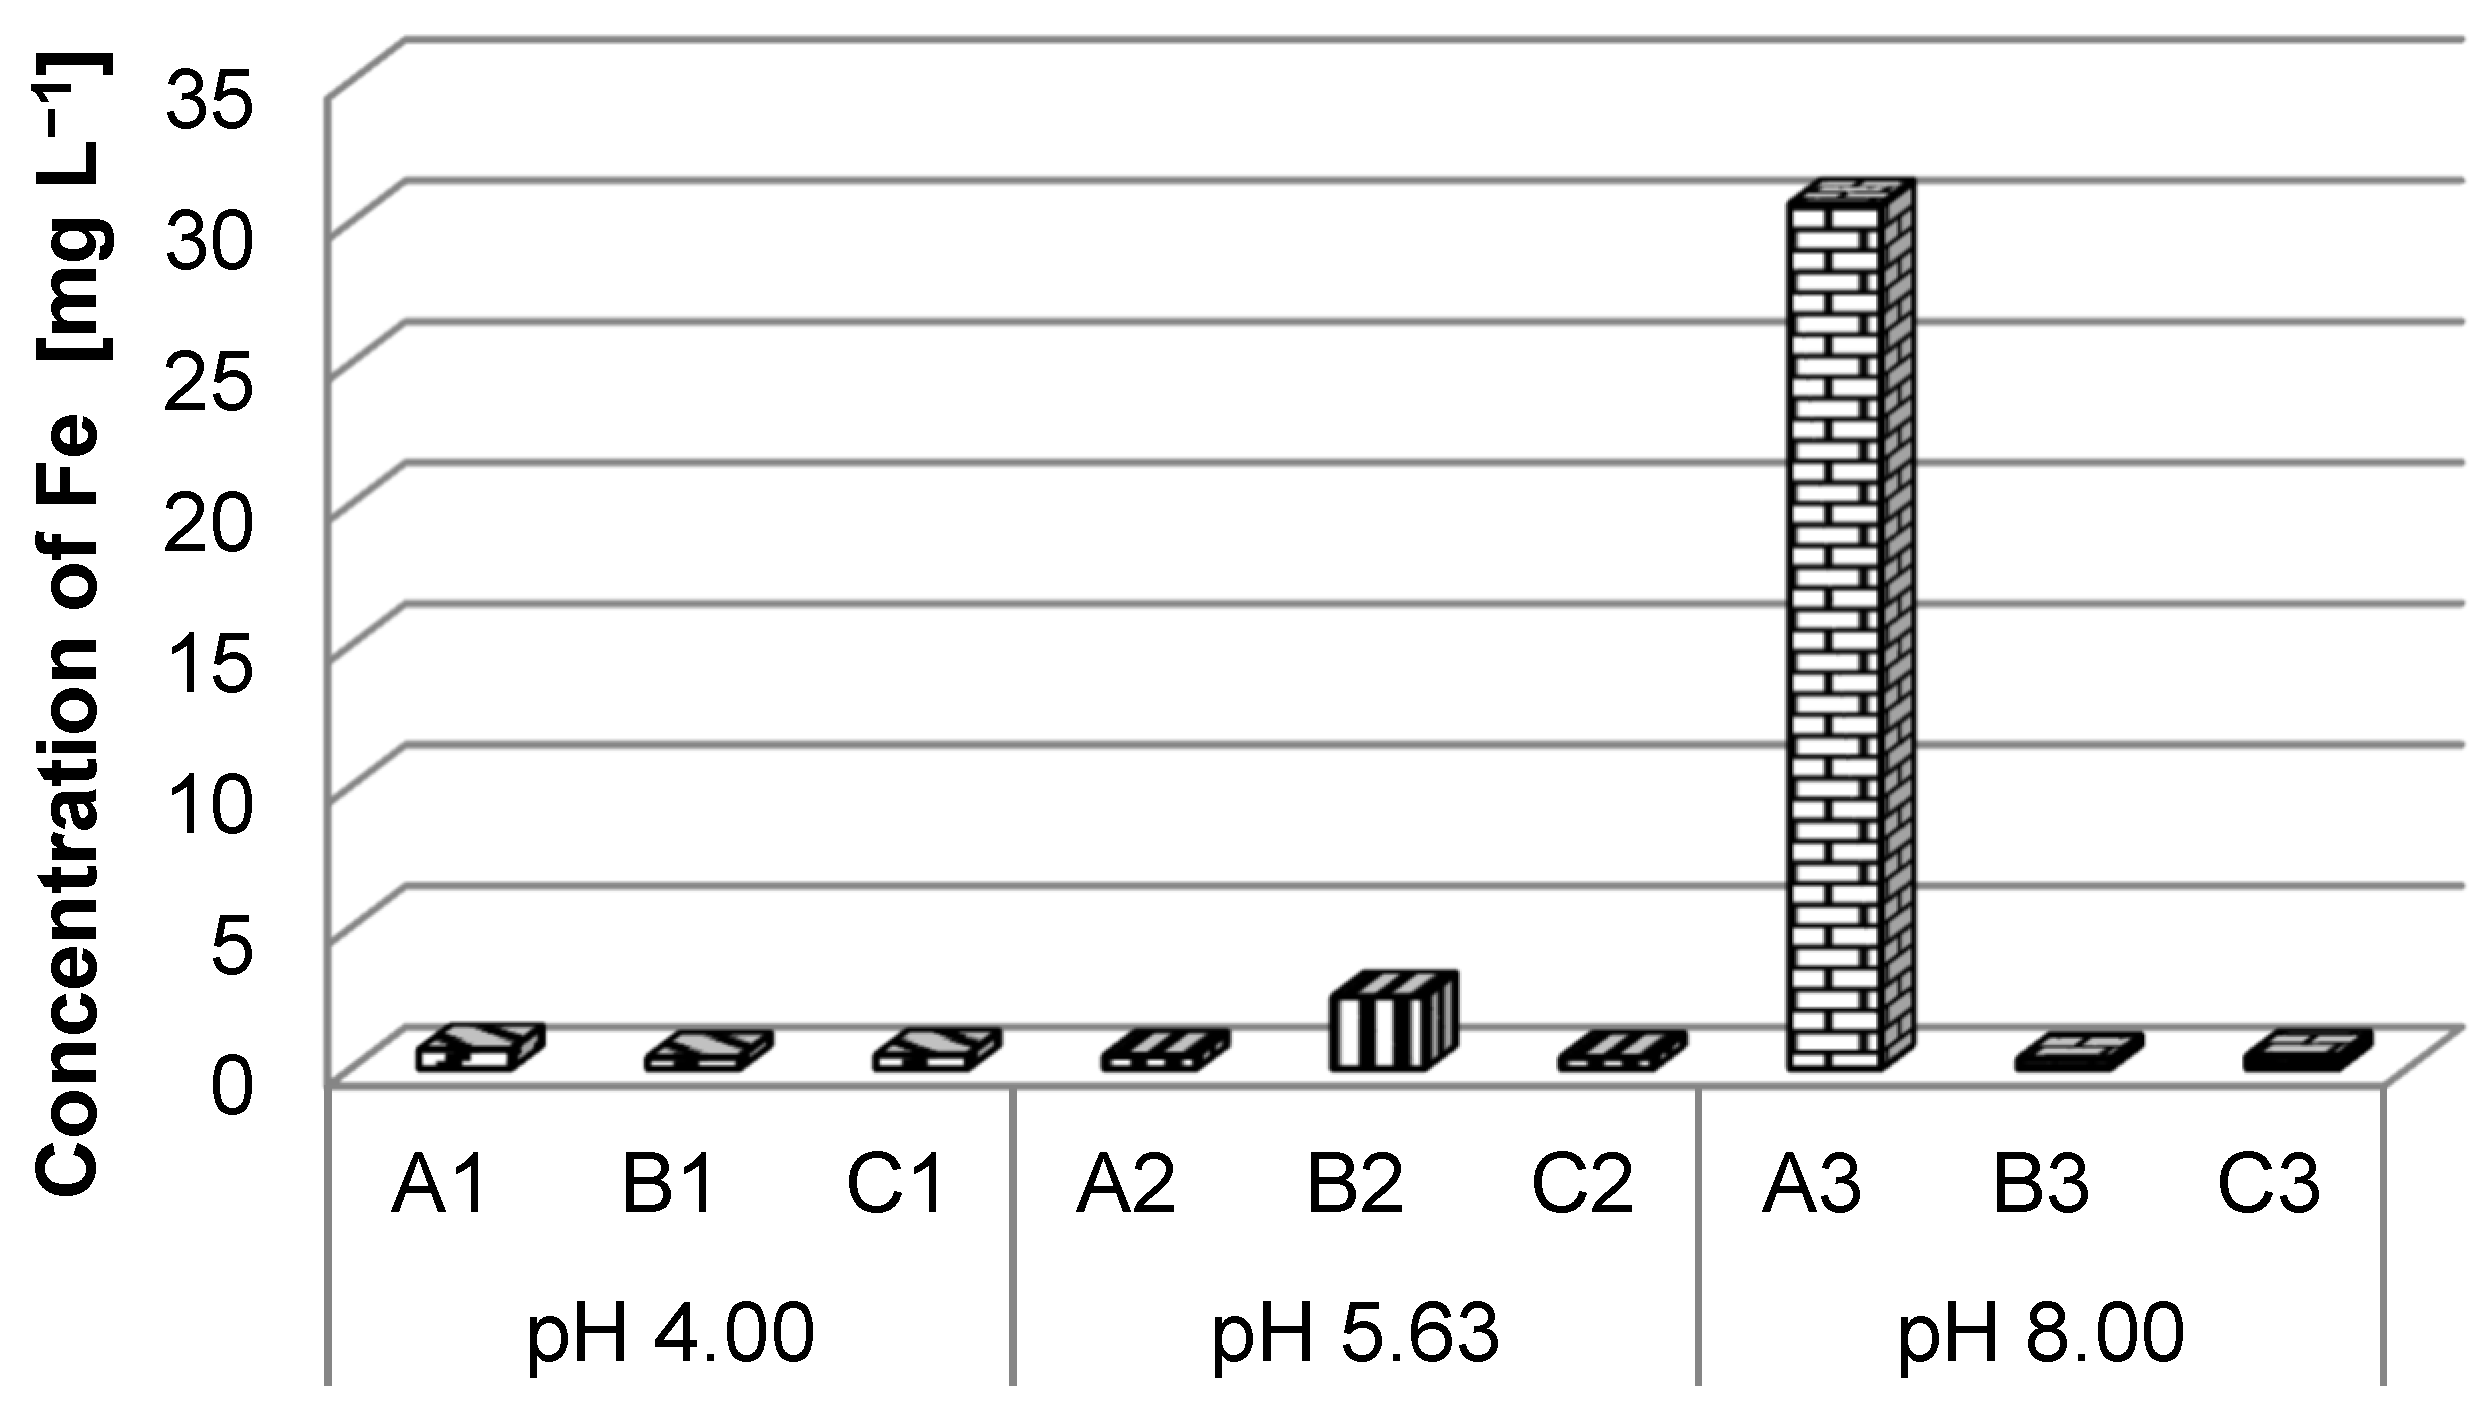
3.2. Concentration of Heavy Metals
4. Conclusions
Author Contributions
Funding
Institutional Review Board Statement
Informed Consent Statement
Data Availability Statement
Conflicts of Interest
References
- Xiao, J.; Guo, J.; Zhan, L.; Xu, Z. A cleaner approach to the discharge process of spent lithium ion batteries in different solutions. J. Clean. Prod. 2020, 255, 120064. [Google Scholar] [CrossRef]
- Kanmani, S.; Gandhimathi, R. Assessment of heavy metal contamination in soil due to leachate migration from an open dumping site. Appl. Water Sci. 2013, 3, 193–205. [Google Scholar] [CrossRef]
- Bhat, R.A.; Singh, D.V.; Qadri, H.; Dar, G.H.; Dervash, M.A.; Bhat, S.A.; Unal, B.T.; Ozturk, M.; Hakeem, K.R.; Yousaf, B. Vulnerability of municipal solid waste: An emerging threat to aquatic ecosystems. Chemosphere 2022, 287, 132223. [Google Scholar] [CrossRef] [PubMed]
- Melchor-Martínez, E.M.; Macias-Garbett, R.; Malacara-Becerra, A.; Iqbal, H.M.N.; Sosa-Hernandez, J.E.; Parra-Saldívar, R. Environmental impact of emerging contaminants from battery waste: A mini review. Case Stud. Chem. Environ. Eng. 2021, 3, 100104. [Google Scholar] [CrossRef]
- Sethurajan, M.; Gaydardzhiev, S. Bioprocessing of spent lithium ion batteries for critical metals recovery—A review. Resour. Conserv. Recycl. 2021, 165, 105225. [Google Scholar] [CrossRef]
- Ishak, A.R.; Mohamad, S.; Soo, T.K.; Hamid, F.S. Leachate and Surface Water Characterization and Heavy Metal Health Risk on Cockles in Kuala Selangor. Procedia Soc. Behav. Sci. 2016, 222, 263–271. [Google Scholar] [CrossRef]
- Beinabaj, S.M.H.; Heydariyan, H.; Aleii, H.M.; Hosseinzadeh, A. Concentration of heavy metals in leachate, soil, and plants in Tehran’s landfill: Investigation of the effect of landfill age on the intensity of pollution. Heliyon 2023, 9, e13017. [Google Scholar] [CrossRef]
- Agbeshie, A.A.; Adjei, R.; Anokye, J.; Banunle, A. Municipal waste dumpsite: Impact on soil properties and heavy metal concentrations, Sunyani, Ghana. Sci. Afr. 2020, 8, e00390. [Google Scholar] [CrossRef]
- Guo, X.; Song, Y.; Nan, J. Flow evaluation of the leaching hazardous materials from spent nickel-cadmium batteries discarded in different water surroundings. Environ. Sci. Pollut. Res. 2018, 25, 5514–5520. [Google Scholar] [CrossRef]
- Grover, S.; Sibi, G. Metal Leachate from Alkaline Battery Litters: A threat to Aquatic Organisms. Int. J. Microbiol. Curr. Res. 2019, 1, 26–28. [Google Scholar] [CrossRef]
- Mrozik, W.; Rajaeifar, M.A.; Heidrich, O.; Christensen, P. Environmental impacts, pollution sources and pathways of spent lithium-ion batteries. Energy Environ. Sci. 2021, 14, 6099–6612. [Google Scholar] [CrossRef]
- Rajesh, R.; Kanakadhurga, D.; Prabaharan, N. Electronic waste: A critical assessment on the unimaginable growing pollutant, legislations and environmental impacts. Environ. Chall. 2022, 7, 100507. [Google Scholar] [CrossRef]
- Borjac, L.; El Joumaa, M.; Kawach, R.; Youssef, L.; Blake, D.A. Heavy metals and organic compounds contamination in leachates collected from Deir Kanoun Ras El Ain dump and its adjacent canal in South Lebanon. Heliyon 2019, 5, e02212. [Google Scholar] [CrossRef] [PubMed]
- Ordoñez, J.; Gago, E.J.; Girard, A. Processes and technologies for the recycling and recovery of spent lithium-ion batteries. Renew. Sustain. Energy Rev. 2016, 60, 195–205. [Google Scholar] [CrossRef]
- Lee, J.-C.; Pandey, B.D. Bio-processing of solid wastes and secondary resources for metal extraction—A review. Waste Manag. 2012, 32, 3–18. [Google Scholar] [CrossRef] [PubMed]
- Bae, H.; Kim, Y. Technologies of lithium recycling from waste lithium ion batteries: A review. Mater. Adv. 2021, 2, 3234–3250. [Google Scholar] [CrossRef]
- Thompson, D.L.; Hartley, J.M.; Lambert, S.M.; Shiref, M.; Harper, G.D.J.; Kendrick, E.; Anderson, P.; Ryder, K.S.; Gaines, L.; Abbott, A.P. The importance of design in lithium ion battery recycling—A critical review. Green Chem. 2020, 22, 7585–7603. [Google Scholar] [CrossRef]
- Dobó, Z.; Dinh, T.; Kulcsár, T. A review on recycling of spent lithium-ion batteries. Energy Rep. 2023, 9, 6362–6395. [Google Scholar] [CrossRef]
- Almeida, M.F.; Xara, S.M.; Delgado, J.; Costa, C.A. Characterization of spent AA household alkaline batteries. Waste Manag. 2006, 26, 466–476. [Google Scholar] [CrossRef]
- He, K.; Zhang, Z.Y.; Alai, L.; Zhang, F.S. A green process for exfoliating electrode materials and simultaneously extracting electrolyte from spent lithium-ion batteries. J. Hazard. Mater. 2019, 375, 43–51. [Google Scholar] [CrossRef]
- Hurd, J.D.; Muchnick, D.M.; Schedler, M.F.; Mele, T. Recycling of Consumer Dry Cell Batteries (Pollution Technology Review), 1st ed.; William Andrew: Norwich, NY, USA, 1993; p. 288. [Google Scholar]
- Kosaraju, S. A Review of the Importance of Recycling Lithium-ion Batteries for Lithium, in View of Impending Electric Vehicle Industry. Industrial Materials Recycling. 2012. SE-412. Available online: https://publications.lib.chalmers.se/records/fulltext/165368.pdf (accessed on 12 August 2023).
- Sethurajan, M.; Van Hullebusch, E.D.; Fontana, D.; Akcil, A.; Deveci, H.; Batinic, B.; Leal, J.P.; Gasche, T.A.; Ali Kucuker, M.; Kuchta, K.; et al. Recent advances on hydrometallurgical recovery of critical and precious elements from end of life electronic wastes—A review. Critic. Rev. Environ. Sci. Technol. 2019, 49, 212–275. [Google Scholar] [CrossRef]
- Eurostat Statistics Explained. Waste Statistics-Recycling of Batteries and Accumulators. 2020. Available online: https://ec.europa.eu/eurostat/statistics-explained/index.php?title=Waste_statistics_-_recycling_of_batteries_and_accumulators (accessed on 12 August 2023).
- Xu, J.; Thomas, H.R.; Francis, R.W.; Lum, K.R.; Wang, J.; Liang, B. A review of processes and technologies for the recycling of lithium-ion secondary batteries. J. Power Sources 2008, 177, 512–527. [Google Scholar] [CrossRef]
- Kang, D.H.P.; Chen, M.; Ogunseitan, O.A. Potential environmental and human health impacts of rechargeable lithium batteries in electronic waste. Environ. Sci. Technol. 2013, 47, 5495–5503. [Google Scholar] [CrossRef] [PubMed]
- Horeh, N.B.; Mousavi, S.M.; Baniasadi, M. Use of adapted metal tolerant Aspergillus niger to enhance bioleaching efficiency of valuable metals from spent lithium-ion mobile phone batteries. J. Clean. Prod. 2018, 197, 1546–1557. [Google Scholar] [CrossRef]
- Twagirayezu, G.; Irumva, O.; Huang, K.; Xia, H.; Uwimana, A.; Nizeyimana, J.C.; Manzi, H.P.; Nambajemariya, F.; Itangishaka, A.C. Environmental Effects of Electrical and Electronic Waste on Water and Soil: A Review. Pol. J. Environ. Stud. 2022, 31, 2507–2525. [Google Scholar] [CrossRef]
- Kuchhal, P.; Sharma, U.C. Battery waste management. In Environmental Science and Engineering; Vol. 5 Solid Waste Management; Gurjar, B.R., Sharma, U.C., Singh, N., Eds.; Studium Press LLC: Houston, TX, USA, 2017; pp. 141–155. [Google Scholar]
- Karnchanawong, S.; Limpiteeprakanb, P. Evaluation of heavy metal leaching from spent household batteries disposed in municipal solid waste. Waste Manag. 2009, 29, 550–558. [Google Scholar] [CrossRef]
- Shekhar, A.R.; Parekh, M.H.; Pol, V.G. Worldwide ubiquitous utilization of lithium-ion batteries: What we have done, are doing, and could do safely once they are dead? J. Power Sources 2022, 523, 231015. [Google Scholar] [CrossRef]
- Vimmerstedt, L.J.; Ring, S.; Hammel, C.J. Current Status of Environmental, Health, and Safety Issues of Lithium Ion Electric Vehicle Batteries. 1995; NREL/TP-463-7673, UC Category 1501, DE95009295. Available online: https://www.nrel.gov/docs/legosti/old/7673.pdf (accessed on 12 August 2023).
- Casimir, A.; Zhang, H.; Ogoke, O.; Amine, J.C.; Lu, J.; Wu, G. Silicon-based anodes for lithium-ion batteries: Effectiveness of materials synthesis and electrode preparation. Nano Energy 2016, 27, 359–376. [Google Scholar] [CrossRef]
- Zhang, G.; He, Y.; Feng, Y.; Wang, H.; Zhang, T.; Xie, W.; Zhu, X. Enhancement in liberation of electrode materials derived from spent lithium-ion battery by pyrolysis. J. Clean. Prod. 2018, 199, 62–68. [Google Scholar] [CrossRef]
- Zhang, Y.; Yin, X.-Y.; Yan, F.-Y. Tribocorrosion behaviour of type S31254 steel in seawater: Identification of corrosion–wear components and effect of potential. Mater. Chem. Phys. 2016, 179, 273–281. [Google Scholar] [CrossRef]
- Xará, S.M.; Delgado, J.N.; Almeida, M.F.; Costa, C.A. Laboratory study on the leaching potential of spent alkaline batteries. Waste Manag. 2009, 29, 2121–2131. [Google Scholar] [CrossRef] [PubMed]
- Maiti, S.K.; De, S.; Hazra, T.; Debsarkar, A.; Dutta, A. Characterization of Leachate and Its Impact on Surface and Groundwater Quality of a Closed Dumpsite—A Case Study at Dhapa, Kolkata, India. Procedia Environ. Sci. 2016, 35, 391–399. [Google Scholar] [CrossRef]
- Toshiba Batteries (TB). Technical Characteristics, Heavy Duty AA BP-4. 2021. Available online: https://www.toshiba-lifestyle.com/jp/living/batteries/files/carbon-zinc_9V_en.pdf (accessed on 12 August 2023).
- Duracell. Product Safety Data Sheet (PSDS). 2012. Available online: http://sds.staples.com/msds/818693.pdf (accessed on 12 August 2023).
- Product Information Sheet (PIS). Panasonic Batteries, Panasonic Industrial Company. 2020. Available online: https://assets.omron.eu/downloads/msds/en/v1/panasonic_cr-series_button_cells_msds_document_en.pdf (accessed on 12 August 2023).
- ISO 15586:2003; Water Quality—Determination of Trace Elements Using Atomic Absorption Spectrometry with Graphite Furnace. International Organization for Standardization: Geneva, Switzerland, 2003.
- ISO 8288:1986; Water Quality—Determination of Cobalt, Nickel, Copper, Zinc, Cadmium and Lead—Flame Atomic Absorption Spectrometric Methods. International Organization for Standardization: Geneva, Switzerland, 1986.
- ORDER no. 161 from October 13, 2016 for the Approval of the Norm Regarding the Classification of Surface Water Quality in Order to Establish the Ecological Status of Water Bodies. Available online: http://www.monitoruljuridic.ro/act/ordin-nr-161-din-13-octombrie-2016-privind-aprobarea-planului-integrat-de-ac-iune-pentru-gestionarea-unei-situa-ii-de-criz-n-domeniul-imigra-iei-emitent-185101.html (accessed on 10 August 2023). (In Romanian).
- Takahashi, T.; Ishizuka, K.; Kawanishi, K. Properties of Nickel-Coated Steel Sheets for Battery Case, Nippon Steel & Sumitomo Metal Technical Report, 2015 No. 108, UDC 669. 14-408. 2:669. 248. 7. Available online: https://www.nipponsteel.com/en/tech/report/nssmc/pdf/108-16.pdf (accessed on 15 October 2023).


| Characteristics | Zinc–Carbon Battery [38] Batteries A | Lithium Manganese Dioxide Battery [39] Batteries B | Zinc–Manganese Alloy Battery [40] Batteries C |
|---|---|---|---|
| Size | AA | AA | AA |
| Tensione | 1.5 V | 1.5 V | 1.5 V |
| Diameter | 14.5 mm | 14.5 mm | 14.5 mm |
| Overall height | 50.5 mm | 50.5 mm | 50.5 mm |
| Weight | 18.0 g | 24 g | 23.1 g |
| Shell | steel | steel | steel |
| Cathode: | MnO2 | MnO2 and conductive agents | MnO2 |
| Anode | Zn | pure lithium metal | Zn powder in the shape of a mixed gel |
| Electrolyte | ZnC12 | organic solvent mixture with a dissolved alkali metal salt | KOH solution |
| Constituent name and content (%) | MnO2: 15–40% | MnO2: 15–45% | MnO2: 30–46% |
| Zn: 30–60% | 1.2 dimethoxyethane: 5–10% | Zn: 10–17% | |
| Fe: 15–40% | Propylene carbonate (C4H6O3): 1–10% | KOH: 4–7% | |
| Carbon black: 15–40% | Carbon black: 0–5% | Water: 7–13% | |
| ZnCl2: 5–10% | Graphite: 0–5% | Graphite: 2–4% | |
| Paper: 1–5% | Lithium (Li): 1–5% | Steel: 12–34% | |
| NH4Cl: 0.1–1% | Lithium trifluoromethane sulfonate (LiOTf): 0–5% | Plastic: 3–11% | |
| Pb: 0.1–0.16% | Ethylene carbonate C3H4O3: 0–5% |
| Solution pH | Battery A | Battery B | Battery C |
|---|---|---|---|
| pH 4.00 | A1 | B1 | C1 |
| pH 5.63 | A2 | B2 | C2 |
| pH 8.00 | A3 | B3 | C3 |
| Measured Elements | Wavelength, nm | Slit Width, nm | Laboratory-Calibrated Working Range | Correlation Coefficient of the Calibration Curve, R2 |
|---|---|---|---|---|
| Cu | 324.75 | 0.7 | 3.0–30.0 µg L−1 | 0.9986 |
| Pb | 283.30 | 0.7 | 3.0–39.0 µg L−1 | 0.9993 |
| Zn | 213.90 | 0.7 | 0.05–2.00 mg L−1 | 0.9997 |
| Ni | 232.00 | 0.7 | 2.5–40.0 µg L−1 | 0.9996 |
| Fe | 248.30 | 0.2 | 0.10–2.00 mg L−1 | 0.9995 |
| Mn | 279.50 | 0.2 | 0.075–2.00 mg L−1 | 0.9993 |
| Cd | 228.80 | 0.7 | 0.20–4.00 µg L−1 | 0.9992 |
| Heavy Metals | Unit of Measurement | Quality Classes * | ||||
|---|---|---|---|---|---|---|
| Class I | Class II | Class III | Class IV | Class V | ||
| Cu | µg L−1 | 20 | 30 | 50 | 100 | ˃100 |
| Pb | µg L−1 | 5 | 10 | 25 | 50 | ˃50 |
| Zn | µg L−1 | 100 | 200 | 500 | 1000 | ˃1000 |
| Ni | µg L−1 | 10 | 25 | 50 | 100 | ˃100 |
| Fe | mg L−1 | 0.3 | 0.5 | 1 | 2 | ˃2 |
| Mn | mg L−1 | 0.05 | 0.1 | 0.3 | 1 | ˃1 |
| Cd | µg L−1 | 0.5 | 1 | 2 | 5 | ˃5 |
Disclaimer/Publisher’s Note: The statements, opinions and data contained in all publications are solely those of the individual author(s) and contributor(s) and not of MDPI and/or the editor(s). MDPI and/or the editor(s) disclaim responsibility for any injury to people or property resulting from any ideas, methods, instructions or products referred to in the content. |
© 2023 by the authors. Licensee MDPI, Basel, Switzerland. This article is an open access article distributed under the terms and conditions of the Creative Commons Attribution (CC BY) license (https://creativecommons.org/licenses/by/4.0/).
Share and Cite
Smical, I.; Muntean, A.; Micle, V.; Sur, I.M. The Influence of Spent Portable Battery Waste on the Aquatic Environment. Appl. Sci. 2023, 13, 11658. https://doi.org/10.3390/app132111658
Smical I, Muntean A, Micle V, Sur IM. The Influence of Spent Portable Battery Waste on the Aquatic Environment. Applied Sciences. 2023; 13(21):11658. https://doi.org/10.3390/app132111658
Chicago/Turabian StyleSmical, Irina, Adriana Muntean, Valer Micle, and Ioana Monica Sur. 2023. "The Influence of Spent Portable Battery Waste on the Aquatic Environment" Applied Sciences 13, no. 21: 11658. https://doi.org/10.3390/app132111658
APA StyleSmical, I., Muntean, A., Micle, V., & Sur, I. M. (2023). The Influence of Spent Portable Battery Waste on the Aquatic Environment. Applied Sciences, 13(21), 11658. https://doi.org/10.3390/app132111658