Abstract
This research aims to investigate steering feel by analyzing a steering system and an electric power steering logic. First, steering feel is defined based on previous research, and methods for evaluating it are discussed. Second, a sensitivity analysis is conducted by modeling our developed vehicle and that of a competitor known for its excellent steering feel via a multi-body simulation. We then propose a straightforward method to determine the parameters associated with steering feel to achieve the desired steering characteristics. Last, by modifying the electric power steering control system, we achieve a steering feel in our vehicle that matches the desired steering characteristics.
1. Introduction
When a vehicle is driven in a nominally straight line but encounters large-radius bends at high speeds and low lateral accelerations (≤0.2 g), the handling characteristic perceived by the driver is known as on-center steering feel. According to [1,2], the majority of drivers operate their vehicles within the on-center steering area. Therefore, in general, the steering feel experienced in the on-center region significantly influences the daily driving experience of drivers.
Steering feedback in the on-center driving scenario is influenced by various factors. In [3,4,5], researchers analyzed the effects of steering mechanism characteristics, nonlinearity of assist torque, friction, and vehicle lateral response. In another study [6], additional analyses were conducted on factors such as the steering ratio, caster angle, steering system stiffness, and tire characteristics. Furthermore, refs. [7,8] focused on analyzing the influence of friction and the angle of the universal joint on the steering mechanism. The aforementioned studies confirmed that steering feedback is influenced by various factors. This implies that even with modifications in the vehicle design based on an analysis of these influencing factors, achieving the desired steering feel may be difficult due to trade-offs with other factors. Studies [9] indicate that design modifications can improve steering feedback. However, changing the design typically incurs a greater expense than software adjustments. Additionally, beyond certain stages of development, implementing design changes can become challenging. Consequently, achieving the desired steering feel requires significant cost and time investments in the design phase.
To expedite the development process and reduce costs, researchers have made various attempts to build a reliable simulation model for analyzing steering characteristics. In [4,8,10], steering systems were implemented and analyzed through mathematical modeling. This approach is relatively simple to implement and suitable for parameter studies. However, it cannot precisely replicate nonlinearities in a real vehicle. In [11,12], nonlinear elements were additionally considered. Moreover, a vehicle model capable of representing the lateral characteristics of the vehicle was implemented, allowing for an interpretation from the perspective of the entire vehicle, rather than one limited to the steering system. However, according to [2], the elasticity of vehicle components influences handling characteristics. Especially in the on-center area, where factors such as the steering column and friction and chassis elasticity have an impact on the steering characteristics, considering these factors in the simulation environment is crucial in establishing reliable simulation models.
In [13], a notable study, the authors implemented a full vehicle model in a multi-body simulation environment and conducted model validation to ensure the reliability of both the vehicle and steering system model. Using the validated model, the electric power steering (EPS) control system was tuned to achieve the same level of steering feel as the target vehicle. However, they did not analyze the target vehicle. This means that they could not suggest which component should be modified in the next stage, as the desired steering feel could not be achieved through EPS controller tuning. Moreover, they did not mention which features of the EPS controller were tuned and how this was performed. Therefore, we extend these previous works, including the one mentioned above, by analyzing the reasons for the differences in steering feel between our vehicle and a competitor’s vehicle. Based on this analysis, we suggest a method to design the EPS controller so that its steering feel matches that of the target vehicle. Additionally, by identifying the individual impact of major factors affecting steering feel, we provide various options for modifying the steering feel.
Steering feel refers to the sensation experienced by a driver when performing steering actions. It is subjective and dependent on the driver’s preferences. In [12], subjective expressions of steering feel were defined. Specifically, the factors contributing to a trained driver negatively perceiving “inertia feel” remain unclear. Even if engineers identify the factors, how they can be improved and to what extent remain unclear. Therefore, steering feel should be quantified and defined, which will serve as the criteria for setting improvement methods and goals.
In 1984, Kenneth D. Norman proposed experimental evaluation standards [14], known as the steering feeling index for the on-center handling area, by measuring the steering wheel angle, steering torque, and lateral acceleration. The measured values were obtained by inputting steering angles at a frequency of 0.2 Hz, which resulted in a lateral acceleration of approximately 0.2 g. Thereafter, other studies expanded on Norman’s proposal by introducing refined indices, as listed in Table 1.

Table 1.
Steering feel evaluation indices and maneuvers.
In [15], the authors aimed to quantify vehicle handling by utilizing the time lag between steering angle and yaw rate. However, this approach was not widely adopted in subsequent studies. It was more common to use lateral acceleration to evaluate vehicle response. In [16], the authors interpreted the impact of roll rate on steering feel by considering changes caused by vehicle motion. This consideration was for the interpretation of time lag, and as mentioned in the conclusions of the paper, it did not exhibit a strong correlation. In [17], two novel evaluation methods were introduced. The first was the flick test, where a sharp steering angle is inputted quickly, followed by releasing the steering wheel. This test was performed to verify returnability and assess the torque perceived by the driver during emergency maneuvers. The second method was applied to assess torque/angle in the frequency domain to evaluate vehicle response. In [18], various steering input patterns were presented. While many previous studies derived steering feel indices using sinusoidal steering input, the authors here utilized sine steer but with a more detailed breakdown to effectively examine on-center steering characteristics. Moreover, step steer, which, after sine steer, is another commonly used input pattern, was presented.
Lastly, [19] conducted a correlation analysis to derive indices that exhibit a high correlation with the driver’s subjective evaluation from among indices defined by different manufacturers and organizations. This correlation analysis established criteria for assessing whether the steering characteristics of the vehicle under development have been successfully implemented according to the design. Recent studies, [20,21] that utilized driver-in-the-loop simulations still performed evaluations using the indices and maneuvers mentioned in [19] and Table 1. In this study, based on the findings from various research, we define the steering feel indices in Section 2.1 and Section 2.2.
This study aimed to evaluate steering feel performance by analyzing our vehicle and a competitor’s vehicle, known for its excellent steering feel, using a multi-body simulation model. Constructing a full vehicle model in the simulation environment enables an independent analysis of the various factors that influence steering feel, making it essential for a comprehensive interpretation of steering feel. While previous studies focused on analyzing the individual elements that affect steering feel, we approached the analysis from a component perspective to identify the most efficient direction to modify the steering feel of our vehicle. For example, if achieving the desired steering feel through the least costly method, such as tuning the EPS control system, is not possible, the analysis becomes even more important. It then becomes necessary to consider whether developing a new control system or conducting a suspension design revision with the tuned existing control system would be more effective in achieving the desired steering feel. However, in situations where the influence of the control system alone cannot resolve the issue, the aforementioned choices may be initially unsuitable. Therefore, in this study, we conducted a sensitivity analysis using our vehicle and a target vehicle to determine how to modify the factors and derive the most efficient combination when modifying a single factor does not yield the desired objectives. These benefits outweigh the costs associated with reverse engineering. Based on the aforementioned background, our initial focus was on establishing objective indices for steering feel through subjective–objective correlation studies. Subsequently, we reverse-engineered the competitor vehicles. Lastly, we proposed a design method to overcome the trade-off relationship between reducing initial torque due to friction and increasing stability by damping, enabling us to emulate the desirable steering feel of the reference vehicle.
2. Identifying Steering Feel Factors
2.1. Steering Feel Performance Index
In this study, we utilized the indices commonly selected in previous research defining steering feel. All the indices were measured by the driver or a steering robot while inputting the steering angle. First, two indices could be observed when the steering angle was used as the input, and the corresponding steering torque was measured. As depicted in Figure 1a, the steering torque at a 0° steering angle represents an important aspect related to perceived differences and the change in steering torque with respect to the steering angle. Additionally, the slope of the steering torque at 0° was defined as the stiffness.
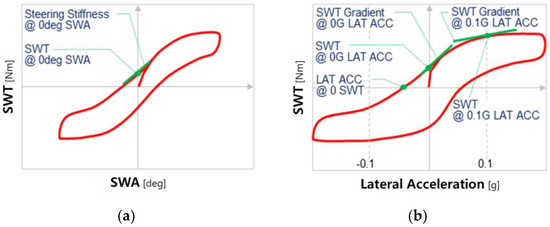
Figure 1.
(a) Steering feel performance indices in steering wheel angle and torque graph; (b) steering feel performance indices in lateral acceleration and steering wheel torque graph.
Second, by considering the relationship between steering torque and lateral acceleration, multiple indices can be examined, including steering returnability, off-center steering effort, and torque build-up linearity, as shown in Figure 1b. In [15], lateral acceleration and yaw velocity were defined as representing the responsiveness of the vehicle, as illustrated in Figure 2. However, most researchers consistently consider lateral acceleration, but only a few studies take yaw rate into account. According to [19], all the information obtainable from the yaw rate can also be derived from lateral acceleration. Consequently, to verify the reliability of our simulation model and assess any improvements in steering feel, we employed steering angle, steering torque, and lateral acceleration.
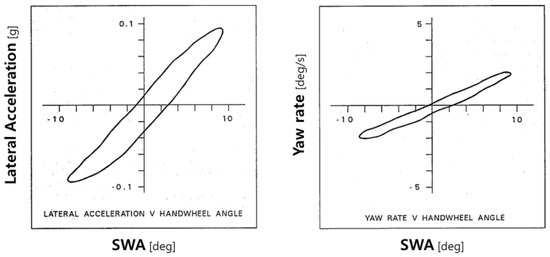
Figure 2.
Steering response performance factors (Farrer [15], 1993).
2.2. Test Method of On-Center Handling Performance
The test scenarios to obtain the defined steering performance indices were as follows. One scenario was the weave test, which involves applying a sinusoidal steering angle input of 0.2 Hz at a high vehicle speed (100 km/h) to generate a lateral acceleration of 0.2 g, as shown in Figure 3. Under these conditions, the vehicle reaches a steady state after one cycle, and the quantitative indices can be obtained using the values of the steering angle and steering torque at a specific lateral acceleration. This test scenario is defined in ISO 13674-1 [22].
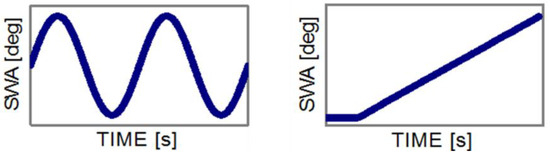
Figure 3.
Steering feeling test methods (ISO 13674-1, 2).
The other scenario was the transition test, which involves providing a ramp steering wheel input of 5°/s at a high vehicle speed (100 km/h). Unlike the weave test, this test focuses on capturing the transient response during the early stage of steering and primarily reveals the steady-state response. This test scenario is also defined in ISO 13674-2 [23].
In this study, we classified the handling as on-center and off-center based on the knee point of the transition test result curve. In the on-center section, when the steering angle is inputted, the steering torque response is sharply increased, and when the steering torque is inputted, the steering angle response is slowly increased due to the steering friction. Therefore, the response curves of the on-center section are highly nonlinear as compared to those of the off-center section. The two test scenarios defined by ISO were utilized to verify the abovementioned steering characteristics.
2.3. Analysis of the Steering Feel Mechanism
In this section, the free-body diagrams from the steering wheel to the tire are presented as three frames. We utilized them to analyze the factors affecting steering feel and in what direction our vehicle should be designed to achieve the steering feel of the target vehicle [24,25]. Figure 4 shows the components from the steering wheel to the pinion.
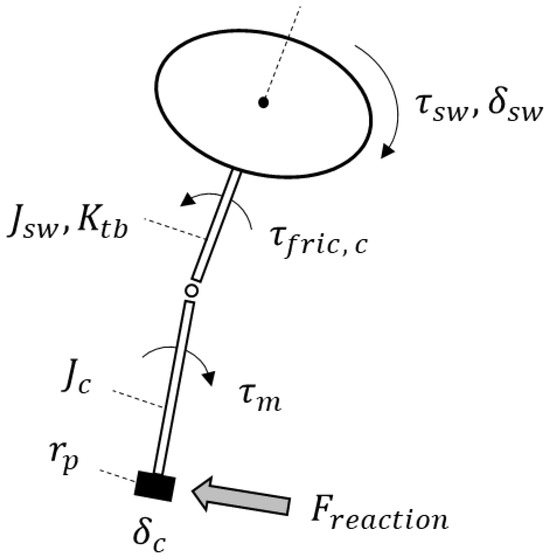
Figure 4.
Free-body diagram: from the steering wheel to the pinion.
The equation of the upper steering system is presented in Equation (1), which comprises the driver torque input , steering wheel inertia , torsion bar stiffness , and steering wheel and column angles . Assume that the column damping is negligible. The reaction force from the rack to the pinion affects the pinion, as shown in Equation (2). The motor torque applied at the lower column assists the driver’s steering intention in conjunction with the EPS control system. are the friction torque at the column and the radius of the pinion gear, respectively.
Second, the relationship between the pinion and tie rod is shown in Figure 5. As shown in Equation (3), the reaction force applied to the rack results in the movement of the rack against friction and inertia from the rack and wheel.
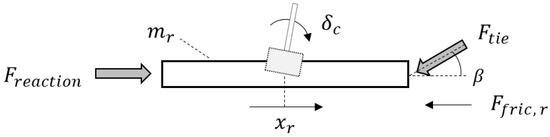
Figure 5.
Free-body diagram: from the pinion to the tie rod.
Lastly, the tie rod to the tire is shown in Figure 6. The axis of steering in the tire is mainly determined by the caster angle, which is presented as a red dot in the figure. The point of application of the tie rod and the angle between the wheel rotation axis and tie rod are presented as a blue dot and , respectively. Equation (4) represents the force from the tie rod to the tire lateral force . are the inertia of the wheel and the friction at the suspension, respectively. is the effective arm length, which denotes the distance between the steering axis and the tie rod application point. is the trail arm that indicates the distance between the steering axis and the point of action of tire lateral force.
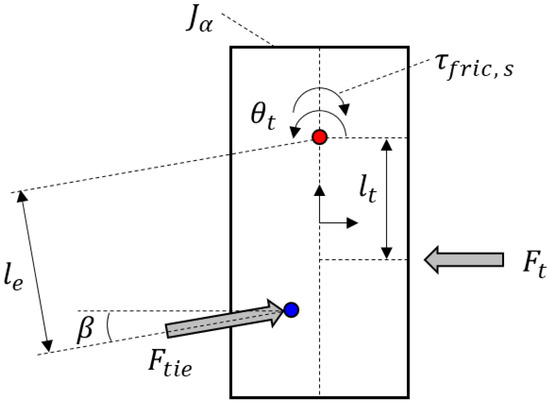
Figure 6.
Free-body diagram: from the tie rod to the tire.
Equation (5) can be obtained from Equations (1)–(4). Combining the three aforementioned frames, we can derive an equation for the mechanism of constructing the driver’s steering torque.
Assuming that the angular acceleration of the steering wheel and column are the same, Equation (6) can be established.
As shown in Equation (6), the linearity of the tire lateral force significantly affects the steering feel. Additionally, designing minimal friction at the column, rack, and suspension contributes toward a linear steering feel. This finding aligns with the results of previous studies, which emphasize the influence of friction occurring at various locations in the steering system on the handling characteristics [7]. Particularly, in on-center handling situations with small steering angles, the role of friction cannot be ignored [2]. If friction cannot be minimized, the EPS control system can compensate for the friction elements to improve on-center handling. Furthermore, the angular acceleration term of the steering wheel can be used to derive the characteristics of steering feel during transient steering. A smaller steering gear ratio and caster trail can enhance the clarity of on-center handling. Specifically, an ideal solution for obtaining appropriate steering feedback in the on-center area is utilizing a variable steering gear ratio, as demonstrated in [26].
Based on the above conclusion, we conducted a sensitivity analysis by modifying the chassis and suspension, and we analyzed the effects of variations in key tire parameters. Lastly, we developed a method to improve our EPS logic to achieve a steering feel similar to that of the target vehicle.
3. Simulation Environment for Steering Feel Performance Prediction
3.1. Implementation of Integrated Vehicle Model
We aimed to improve the steering characteristics of our vehicle so that they were similar to those of the target vehicle by utilizing a simulation environment. To achieve this, a reliable virtual vehicle model is essential. As mentioned earlier, the inertia, damping, and stiffness of the steering system, as well as friction and chassis elasticity, among other factors, influence the handling characteristics of the vehicle. Therefore, all these factors should be considered in the simulation environment to obtain a reliable vehicle model as shown in Figure 7.
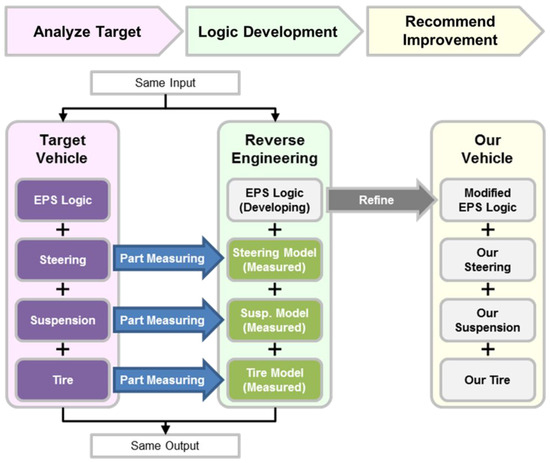
Figure 7.
Reverse engineering of control logic through implementing the same input and output.
Accordingly, we modeled our vehicle in a multi-body simulation environment and modeled a separate EPS system to incorporate the steering system characteristics. To enhance the reliability of the steering characteristics, we applied the friction model shown in Figure 8, which includes various components, such as rack gear operation friction and damping, motor gear interlocking friction and damping, the stiffness characteristics of the steering force transmission members, and motor rotation dynamics’ characteristics.
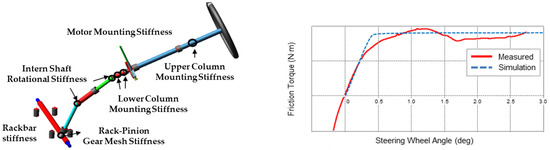
Figure 8.
Steering system model and microsection elastic deformation characteristics friction model.
The EPS control system has various functions to compensate for factors such as inertia and friction. The basic EPS control system includes a power assist, friction compensation, inertia compensation, and damping [27,28]. These functions help reduce the nonlinear effects, especially in the on-center handling area, where they can have a significant impact on the test results. Furthermore, recent research has focused on developing control systems that are robust to disturbances [29,30,31,32]. The steering feel and vehicle handling characteristics can be adjusted depending on the performance of the control system. Therefore, for reliable vehicle handling characteristics, the EPS control system should be integrated into the simulation environment, as depicted in Figure 9.
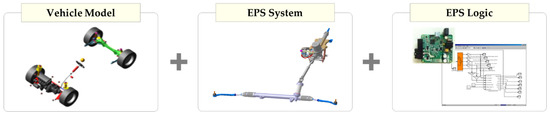
Figure 9.
Model for vehicle and control system integration characteristics.
Lastly, to validate the integrated vehicle model, the two aforementioned test methods were performed. As shown in Figure 10 and Figure 11, not only the steering response but also the handling characteristics of our vehicle were accurately captured. Therefore, the integrated vehicle model can also capture the characteristics of the target vehicle. In Section 3.2, we describe the construction process of the target vehicle in the simulation environment.
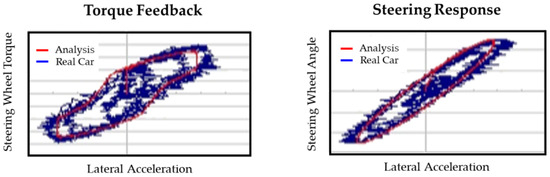
Figure 10.
Reliability of steering evaluation at weave test.
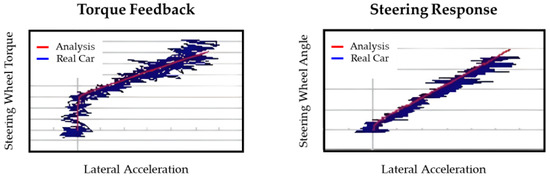
Figure 11.
Reliability of steering evaluation at transition test.
3.2. Construction of Target Vehicle Model
In Section 3.1, we described the implementation of our vehicle in a simulation environment and the verification of its reliability. Using a similar approach, we reverse-engineered the parts of the target vehicle and implemented them in the simulation environment.
In modeling the competitor vehicle, we obtained data through testing on a test bench to incorporate the characteristics of the chassis elasticity, friction, and steering system via a similar modeling process as that of our vehicle. To validate the implementation results, the lateral response of the actual competitor vehicle was compared with that of the simulated vehicle, as shown in Figure 12. This validation was performed for the vehicle model while excluding the EPS control system. The steering feel is implemented in Section 3.3 based on the reliable competitor vehicle model obtained.
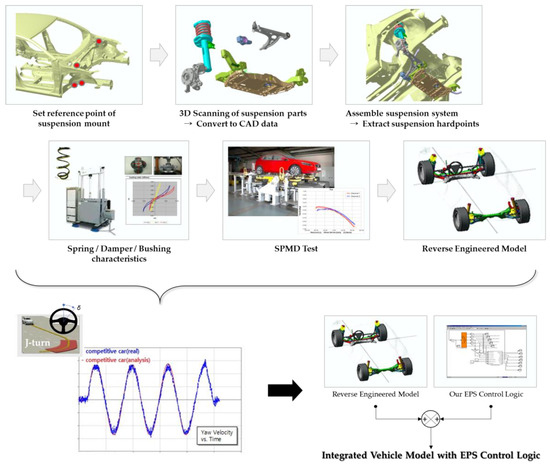
Figure 12.
Competitor vehicle modeling by reserve engineering and reliability result.
3.3. Extraction of EPS Control Logic Characteristics of Target Competitor Vehicle
The EPS logic in the target vehicle cannot be directly measured as a separate component, unlike the chassis. Therefore, we performed reverse engineering based on the EPS control system in our vehicle to extract the logic factors. As expected, when applying the EPS control system of our vehicle to the target vehicle, differences in steering feel performance were observed. Therefore, the control system was fine-tuned to achieve the same characteristics as the real car data of the target vehicle. However, only tuning the EPS control system could not achieve the desired outcome. Thus, we modified our EPS control system with regard to the function of damping.
Regarding the transient steering characteristics, the initial steering torque gradient caused by friction is not properly offset, unlike in the measurement data, as shown in Figure 13b. This difference is primarily attributed to friction. To accurately implement the steering characteristics of the competitor vehicle, friction compensation should be enhanced. When significant steering torque is required at the initial steering stage due to friction, one approach is to increase the proportional gain to the high-frequency component generated by applying a high-pass filter to the torque sensor signal, as illustrated by the blue line in Figure 13b. However, too large a high-frequency assist distorts the torque response to a sinusoidal steering input, as shown in Figure 14a. This leads to an overly reduced damping characteristic and diminished friction feel. Additionally, in such cases, the steering wheel becomes more susceptible to disturbances and loses stability, as depicted in Figure 14b. To achieve stability and damping feel, the damping gain should be increased. However, increasing the damping also offsets the enlarged high-frequency assist. Thus, a significant trade-off between these factors exists, making it challenging to set the logic factors to match the steering feel characteristics of the competitor vehicle using high-frequency assist.
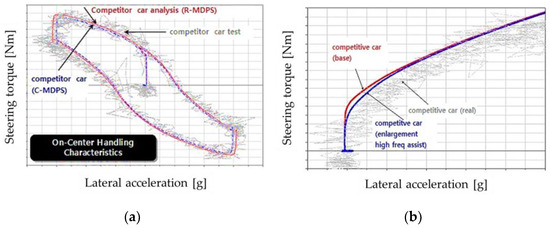
Figure 13.
(a) Comparison of weave test; (b) comparison of transition test.
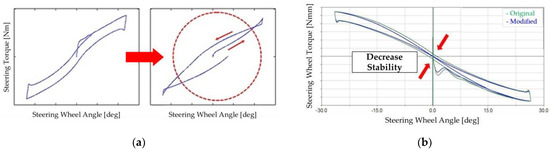
Figure 14.
(a) Steering torque route twist; (b) decreasing stability under high-frequency assist.
To solve this problem, we proposed increasing the high-frequency assist with variable damping gain. First, the high-frequency assist gain was increased to improve the offset in the transition test. Then, to fix the torque route twist problem, we modified the damping gain that could be set by steering angular velocity. The detailed parameter settings are as follows:
As shown in Figure 15, the damping parameters were set by dividing the steering angular velocity into three sections. Unlike the conventional spec that defined only one gain regardless of the steering angular velocity, increasing the high-frequency assist gain did not cause the previously defined problem. Before setting up the configurations for each section, the damping gain in Section2 (0.1–0.3 rev/s) was increased to improve the damping feel and route twist that had been degraded by the increase in the high-frequency assist gain. The following section-specific configurations were then implemented.
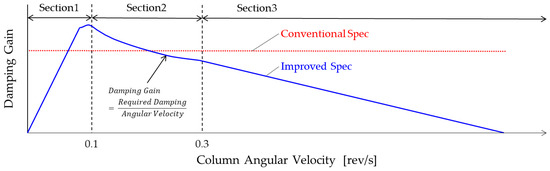
Figure 15.
Damping gain setting concept with respect to angular velocity.
- Section1: Set a minimum level of resistance for the initial steering input and small-angle returnability (0–0.1 rev/s).
When setting the damping gain to satisfy damping feel and stability, the level of resistance to driver steering increased, resulting in a delay in the initial response to rapid steering, such as step steer. However, applying the proposed method, the required torque at the initial steering phase was reduced, leading to the tire steering angle increasing, as shown in Figure 16a. In addition, the effect of damping on returnability was observed in hands-off situations, and improved returnability could be confirmed through the proposed methods, as shown in Figure 16b.
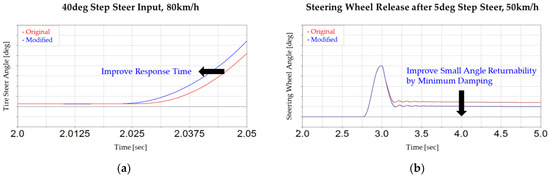
Figure 16.
(a) Improvement in initial response; (b) improvement in steering returnability.
- Section2: Set a consistent damping feel independent of angular velocity in sinusoidal steering (0.1–0.3 rev/s).
The damping gain was set as the required damping divided by the steering angular velocity to achieve a damping feel independent of the input angular velocity. The required damping was set to satisfy the route twist problem and stability, as mentioned earlier, consequently offsetting the effects of the increase in high-frequency assist, as shown in Figure 17.
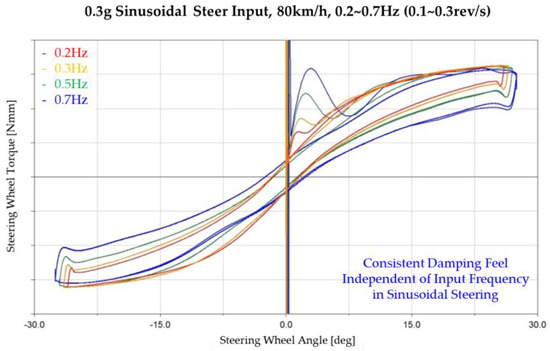
Figure 17.
Steering performance at various steering angular velocities.
- Section3: Set the minimum resistance for urgent steering and returnability (~0.3 rev/s).
By reducing the gain in the remaining sections, we enhanced the steering response and returnability, as shown in the blue trajectory in Figure 18. Consequently, we successfully achieved the desired steering performance across various scenarios.
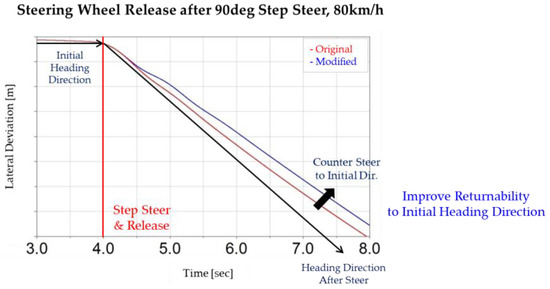
Figure 18.
Comparison of steering returnability during high-speed maneuver.
4. Sensitivity Analysis for Improving Steering Feel
4.1. Difference Analysis between the Competitor Vehicle Model and Our Vehicle Model
After obtaining the simulation model for predicting the performance of the competitor vehicle, the factors affecting the steering feeling performance could be analyzed through a sensitivity analysis with respect to the difference between our vehicle and the competitor’s. We analyzed the effects of the difference between the two vehicles with respect to the steering system, suspension, and tire (Figure 19).
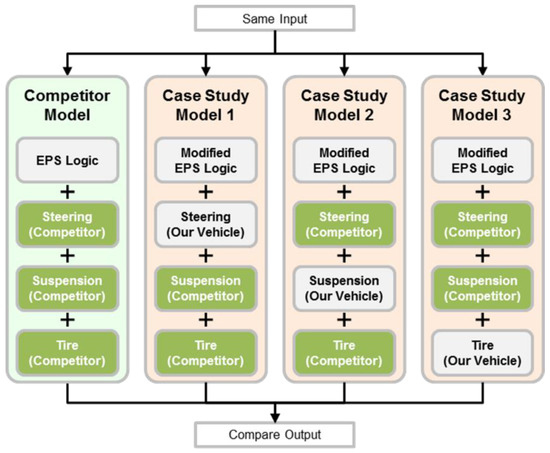
Figure 19.
Effect analysis of vehicle characteristic factors.
For reference, the lateral acceleration level appears different in Figure 20, which is the result of the same steering angle input, due to a change in the understeer characteristics.
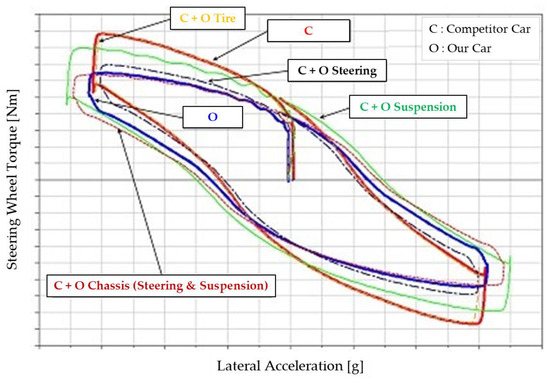
Figure 20.
Effect analysis of factors compared between two vehicles.
- Case Study Model 1: Steering
Applying the steering system of our vehicle to the target vehicle (Figure 20, red line vs. black line) revealed an overall decrease in steering torque due to excessive power assist. In addition, a decrease in the gradient was observed in the off-center region, which did not provide proper feedback to the driver.
- Case Study Model 2: Suspension
When applying the suspension (Figure 20, red line vs. green line) and our chassis (including the steering system and suspension) to the target vehicle (Figure 20, red line vs. dotted red line), the steering wheel torque in the off-center area was reduced. This is because the caster trail ( in Figure 6) of our development vehicle is smaller, which can be compensated for to a certain extent by reducing the assist torque of the steering system. Moreover, passing through the on-center section, the hysteresis width of the steering wheel torque increased. This is attributable to the friction and damping of the suspension increasing, and compensation to some extent being achieved by changing the damping logic of the steering system.
- Case Study Model 3: Tire
Applying the tire of our vehicle to the target vehicle (Figure 20, red line vs. yellow line) yielded almost the same result. This is because tire cornering stiffness is a factor that determines the lateral acceleration response characteristics by the steering angle input and, thus, has little effect on the steering wheel torque characteristics for lateral acceleration. Therefore, to determine the influence of tire cornering stiffness changes, the lateral acceleration response according to the steering angle input and the resulting steering wheel torque response must be analyzed by accounting for the complexity involved, which will be covered separately in the next section.
4.2. Effect Analysis of the Design Parameters of Tires
The tire characteristics are important in that they can be modified to improve the performance of a vehicle without changing the suspension. Therefore, we conducted a sensitivity analysis on the main parameters of the tires. First, as shown in the lateral acceleration vs. steering angle graph in Figure 21a, an increase in the cornering stiffness of the tire simultaneously results in improved steering sensitivity and maximum lateral acceleration. Furthermore, it decreases the width of the hysteresis curve, improving the initial response characteristics and reducing the lateral acceleration lag time. Second, as the lateral acceleration lag time decreases, the build-up characteristic, as shown in Figure 21b, increases, and the steering wheel torque loss in the on-center section decreases. Lastly, as the pneumatic trail intensified, and the build-up characteristic under the returnability effect, on-center steering wheel torque loss, and lateral acceleration lag increased.
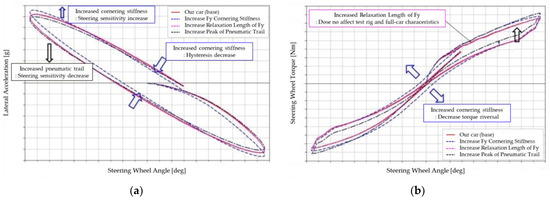
Figure 21.
(a) Sinusoidal sensitivity according to tire characteristics; (b) sinusoidal torque build-up according to tire characteristics.
As the pneumatic trail intensified, the build-up characteristic, as shown in Figure 22, also intensified due to restoration effects, known as the aligning moment. This is the same principle as increasing the caster trail. Tire cornering stiffness determines the lateral acceleration response characteristics under the steering angle input and, therefore, has little effect on the steering wheel torque characteristics under lateral acceleration.
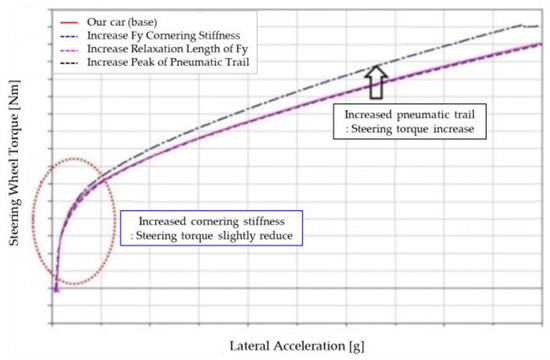
Figure 22.
Transition characteristic according to tire characteristics.
4.3. Realization of Steering Feel Performance Improvement by Logic Tuning
If the steering feel performance improves solely through changes in the EPS logic, it should be achieved with minimal costs while minimally affecting other aspects of performance. EPS logic tuning methods to realize the steering feel of the competitor vehicle are the same as the methods in Section 3.3. In this section, based on the previously described methods and the test results of our adjusted vehicle, we demonstrate the outcomes of our proposed approach to improve the steering feel.
Initially, as the transition test result shows (Figure 23, Table 2), we increased the high-frequency gain to decrease the initial torque, which was demonstrated at very low lateral acceleration, by differentiating the torque sensor signal. Our adjusted car exhibited 78% of the initial torque, which was close to that of the competitor car (73%). Additionally, the gradient of the competitor’s car was 38% higher than that of our car. Our adjusted car achieved a gradient enhancement of 35%, and it closely mirrored that of the competitor car. In essence, we resolved the lack of a linear increase in the steering torque of our car with increasing lateral acceleration. Meanwhile, we reduced the initial torque so that drivers perceive less friction.
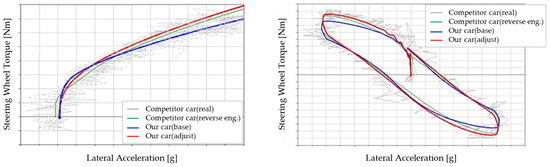
Figure 23.
Realizing the sinusoidal characteristic of the competitor vehicle via logic tuning.
Table 2.
Steering feel performance improvement results from transition test.
Second, as can be seen in the sinusoidal steering graph and Table 3, we reduced the excessive power assist to increase the steering torque at the off-center area. We increased the peak torque of our car by 14%, aligning it closely with the peak torque of the competitor car. Moreover, the torque damping feel, the distance of the steering wheel torque at 0 g, remained unchanged. This means that we managed to maintain stability by applying variable damping gain. As a result, both a decrease in the friction feel in the early stages of steering and an increase in the damping feel during repeated steering, which share a trade-off relationship, were simultaneously achieved.
Table 3.
Steering feel performance improvement results from weave test.
5. Conclusions
The handling characteristic perceived by a driver is referred to as the on-center steering feel, which is determined by the nonlinear characteristics of the steering system, the EPS control system, and the lateral force generation characteristics of the tire. To improve this, we analyzed the steering mechanism to identify the key factors affecting steering feel. A target vehicle with good steering feel was then implemented in a multi-body simulation environment. From this, we conducted a sensitivity analysis to determine the important factors influencing steering feeling via systematic approaches. Afterward, we explored ways to improve the steering feel of our vehicle based on changes in the key factors identified in the analysis of the mechanism.
We confirmed that the multi-body simulation environment can capture the steering feeling of the vehicle. Based on this, we constructed a reliable vehicle model by reverse-engineering the steering system, chassis, and tires of the target vehicle without EPS control logic. To achieve the steering feel of the target vehicle, we refined the damping coefficient of our EPS logic by dividing it into three sections. Accordingly, we were able to conduct a sensitivity analysis by applying the components of our vehicle to the target vehicle. Finally, to overcome the differences between our vehicle and the target vehicle, we modified our EPS logic at the lowest possible cost. As a result, we were able to achieve steering characteristics similar to those of the target vehicle.
This study granted us insights into the design of the EPS logic, which are crucial for achieving the desired steering feel. After obtaining these insights, we applied the knowledge to our production vehicle. As a result, our production vehicle exhibited the desired steering feel. Furthermore, as we considered the correlation between subjective and objective assessment, the subjective testers provided positive feedback on the steering feel. The testers’ feedback reinforced the validity and reliability of our study.
In future work, we will integrate an actuator, such as a brake system, in a steering system similar to that which was separately modeled. The integrated simulation model will facilitate the analysis of steering feel during interventions from systems other than the steering system. Furthermore, we aim to develop a closed-loop EPS control system to prevent the degradation of steering feel due to interferences from other systems. Through this system, we anticipate a decrease in tuning time, improved disturbance rejection, and an assurance of robust performance.
Author Contributions
Conceptualization, S.W.; methodology, S.W., M.-O.J. and J.-M.L.; software, S.W.; validation, S.W. and J.-M.L.; formal analysis, J.-M.L.; investigation, C.H., M.-O.J. and J.-M.L.; resources, S.W.; data curation, M.-O.J. and J.-M.L.; writing—original draft preparation, C.H. and M.-O.J.; writing—review and editing, S.W. and C.H.; visualization, C.H. and M.-O.J.; supervision, S.W.; project administration, S.W.; funding acquisition, S.W. All authors have read and agreed to the published version of the manuscript.
Funding
This work was supported by the Technology Innovation Program (or Industrial Strategic Technology Development Program—Development of the Core System Technology for Hyper-safe Driving Platform) (20015831, Development of Hyper-safe Driving Platform based on Cooperative Domain Control) funded by the Ministry of Trade, Industry and Energy (MOTIE, Republic of Korea).
Institutional Review Board Statement
Not applicable.
Informed Consent Statement
Not applicable.
Data Availability Statement
Not applicable.
Conflicts of Interest
The authors declare no conflict of interest.
References
- Harrer, M. Characterisation of Steering Feel. Ph.D. Thesis, University of Bath, Bath, UK, 2007. [Google Scholar]
- Ende, K.V.; Kallmeyer, F.; Nippold, C.; Henze, R.; Küçükay, F. Analysis of steering system elasticities and their impact on on-centre handling. Int. J. Veh. Des. 2016, 70, 211–233. [Google Scholar] [CrossRef]
- Peppler, S.A.; Johnson, J.R.; Williams, D.E. Steering system effects on on-center handling and performance. SAE Trans. 1999, 108, 682–687. [Google Scholar]
- Kushiro, I.; Yamomoto, M. Vehicle behavior under the influence of steering dynamics by means of low frequency torque input. Tech. Rep. SAE Tech. Pap. 2006-01-0557 2006. [Google Scholar] [CrossRef]
- Pfeffer, P.E.; Harrer, M.; Johnston, D. Interaction of vehicle and steering system regarding on-centre handling. Veh. Syst. Dyn. 2008, 46, 413–428. [Google Scholar] [CrossRef]
- Zheng, H.; Deng, W.; Zhang, S.; Jiang, Y. Studies on the impacts of steering system parameters on steering feel characteristics. In Proceedings of the 2015 IEEE International Conference on Systems, Man, and Cybernetics, Hong Kong, 9–12 October 2015; IEEE: Piscataway, NJ, USA, 2015; pp. 486–491. [Google Scholar]
- Li, Y.; Shim, T.; Wang, D.; Offerle, T. Investigation of factors affecting steering feel of column assist electric power steering. In Proceedings of the Dynamic Systems and Control Conference, Minneapolis, MN, USA, 12–14 October 2016; Volume 50701, p. V002T31A005. [Google Scholar]
- Gao, J.; Qi, X. Handling performance analysis and optimization of a vehicle with considering the influence of steering shaft parameters. J. Mech. Sci. Technol. 2023, 37, 569–582. [Google Scholar] [CrossRef]
- Choi, J.H.; Nam, K.; Oh, S. Steering feel improvement by mathematical modeling of the Electric Power Steering system. Mechatronics 2021, 78, 102629. [Google Scholar] [CrossRef]
- Lee, D.; Kim, K.S.; Han, M. Model-based analysis of the hysteresis curve of an electric power steering system. In Proceedings of the 2020 20th International Conference on Control, Automation and Systems (ICCAS), Busan, Republic of Korea, 13–16 October 2020; IEEE: Piscataway, NJ, USA, 2020; pp. 490–495. [Google Scholar]
- Tao, W.; Gao, B.; Chu, H.; Tian, M.; Chen, H. Studies on steering feeling feedback system based on nonlinear vehicle model. Tech. Rep. SAE Tech. Pap. 2017-01-1494 2017. [Google Scholar] [CrossRef]
- Nakano, S.; Hayama, R. Strategy for transfer elemental designing, employing physical characteristic modeling of steering maneuver. Third Rep. Eval. Method Transf. Charact. Using Steer Wire Syst. Trans. Jpn. Soc. Mech. Eng. Ser. C 2013, 79, 3830–3838. [Google Scholar] [CrossRef][Green Version]
- Camuffo, I.; Caviasso, G.; Pascali, L.; Pesce, M.; Alviano, E. Simulation tools and evaluation criteria for steering wheel feel improvement of an electric power steering system. Tech. Rep. SAE Tech. Pap. 2002-01-1593 2002. [Google Scholar] [CrossRef]
- Norman, K.D. Objective evaluation of on-center handling performance. SAE Trans. 1984, 93, 380–392. [Google Scholar]
- Farrer, D.G. An objective measurement technique for the quantification of on-centre handling quality. Tech. Rep. SAE Tech. Pap. 930827 1993. [Google Scholar] [CrossRef]
- Higuchi, A.; Sakai, H. Objective evaluation method of on-center handling characteristics. Tech. Rep. SAE Tech. Pap. 2001-01-0481 2001. [Google Scholar] [CrossRef]
- Salaani, M.K.; Heydinger, G.J.; Grygier, P.A. Experimental steering feel performance measures. SAE Trans. 2004, 113, 665–679. [Google Scholar]
- Heathershaw, A. Developments in on-centre steering evaluation and testing. SAE Trans. 2006, 115, 721–728. [Google Scholar]
- Zong, C.; Zhang, Z.; Mai, L.; Wang, C.; Wu, Z. Study on objective evaluation index system of on-center handling for passenger car. Tech. Rep. SAE Tech. Pap. 2013-01-0714 2013. [Google Scholar] [CrossRef]
- Guan, X.; Zhang, Y.N.; Duan, C.G.; Yong, W.L.; Lu, P.P. Study on decomposition and calculation method of EPS assist characteristic curve. Proc. Inst. Mech. Eng. Part D J. Automob. Eng. 2021, 235, 2166–2175. [Google Scholar] [CrossRef]
- Asperti, M.; Vignati, M.; Sabbioni, E. Driver-in-the-Loop Simulation to Assess Steering Torque Feeling due to Torque Vectoring Control. In Proceedings of the 2022 IEEE Vehicle Power and Propulsion Conference (VPPC), Merced, CA, USA, 1–4 November 2022; IEEE: Piscataway, NJ, USA, 2022; pp. 1–6. [Google Scholar]
- ISO 13674-1; Road Vehicles—Test Method for the Quantification of On-Centre Handling–Part 1: Weave Test. ISO (International Organization for Standardization): Geneva, Switzerland, 2010.
- ISO 13674-2; Road Vehicles—Test Method for the Quantification of On-Centre Handling—Part 2: Transition Test. ISO (International Organization for Standardization): Geneva, Switzerland, 2016.
- Düsterloh, D.; Uselmann, A.; Scherhaufer, J.; Bittner, C.; Schramm, D. Objectification of the feedback behavior of the suspension and steering system. In Proceedings of the 9th International Munich Chassis Symposium 2018: Chassis, Tech Plus, Munich, Germany, 12–13 June 2018; Springer: Berlin/Heidelberg, Germany; pp. 505–526. [Google Scholar]
- Cianetti, F.; Fabellini, L.; Formica, V.; Ambrogi, F. Development and validation of a simplified automotive steering dynamic model. Proc. Inst. Mech. Eng. Part D J. Automob. Eng. 2021, 235, 2188–2199. [Google Scholar] [CrossRef]
- Heathershaw, A. Optimizing variable ratio steering for improved on-centre sensitivity and cornering control. SAE Trans. 2000, 109, 1140–1151. [Google Scholar]
- Würges, M. New electrical power steering systems. Encycl. Automot. Eng. 2013, 1–17. [Google Scholar] [CrossRef]
- Harrer, M.; Pfeffer, P. Steering Handbook; Springer: Berlin/Heidelberg, Germany, 2017; Volume 163. [Google Scholar]
- Groll, M.V.; Mueller, S.; Meister, T.; Tracht, R. Disturbance compensation with a torque controllable steering system. Veh. Syst. Dyn. 2006, 44, 327–338. [Google Scholar] [CrossRef]
- Mehrabi, N.; Azad, N.L.; McPhee, J. Optimal disturbance rejection control design for electric power steering systems. In Proceedings of the 2011 50th IEEE Conference on Decision and Control and European Control Conference, Orlando, FL, USA, 12–15 December 2011; IEEE: Piscataway, NJ, USA, 2011; pp. 6584–6589. [Google Scholar]
- Marouf, A.; Djemai, M.; Sentouh, C.; Pudlo, P. A new control strategy of an electric-power-assisted steering system. IEEE Trans. Veh. Technol. 2012, 61, 3574–3589. [Google Scholar] [CrossRef]
- Na, S.; Li, Z.; Qiu, F.; Zhang, C. Torque control of electric power steering systems based on improved active disturbance rejection control. Math. Probl. Eng. 2020, 2020, 6509607. [Google Scholar] [CrossRef]
Disclaimer/Publisher’s Note: The statements, opinions and data contained in all publications are solely those of the individual author(s) and contributor(s) and not of MDPI and/or the editor(s). MDPI and/or the editor(s) disclaim responsibility for any injury to people or property resulting from any ideas, methods, instructions or products referred to in the content. |
© 2023 by the authors. Licensee MDPI, Basel, Switzerland. This article is an open access article distributed under the terms and conditions of the Creative Commons Attribution (CC BY) license (https://creativecommons.org/licenses/by/4.0/).