Abstract
PM10 samples were collected at the Kraków air quality traffic monitoring station during two periods: February–May 2018 and February–June 2020. The PM10 concentrations dropped by 50% from 74 ± 29 µg/m3 to 37 ± 13 µg/m3 in 2018 and 2020, respectively. The elemental concentrations were determined by the energy-dispersive X-ray fluorescence (EDXRF) method, and the ion concentrations were determined by ion chromatography (IC). The concentration ratios in 2018 to 2020 were greater than 1.7 for the following elements: S, Cl, K, Zn, Br, and the ions SO42−, Na+, and NH4+. Similar concentrations were observed in 2018 and 2020 for the following chemical species: Ca, Ti, Mn, Ni, Rb, Sr, K+, Mg2+, Ca2+, and PO43−. The Cr concentration was higher in 2020 compared to 2018. Four source profiles were obtained from the PMF (Positive Matrix Factorization) modelling. The following sources were attributed to this: solid fuel combustion, secondary inorganic aerosols, traffic/industry/construction work, and soil. The contributions of solid fuel combustion and secondary inorganic aerosols (SIA) were significantly lower in February and March 2020 than in February and March 2018. The relative differences were in the range 70–98%. Traffic/industry/construction work contributions were 6% and 36% lower in March and May 2020 compared to the same months in 2018, respectively. Two factors affected the characteristics of PM10: one was the ban of using coal and wood for heating purposes introduced in Krakow in September 2019, observed mainly in February and March, and the COVID-19 pandemic that was observed mainly in April and May.
1. Introduction
Public awareness of the air quality around the world is increasing. Many actions are being taken to increase environmental awareness. Local authorities around the world make decisions to reduce the levels of air particulate matter (APM). The environmental protection agencies prepared regulations according to the limit values of chemical substances in the atmosphere. The regulation is applicable to the European Union in accordance with the Directive 2008/50/EC [1]. However, in many cities, these limit values are still exceeded [1,2,3]. The influence of particulate matter on human health and the environment requires knowledge of the chemical content and size distribution of APM. Many studies have researched the characterization of particulate matter [4,5,6,7]. Some of them also include the health effects of APM [8,9]. APM can cause cardiovascular and respiratory diseases and cancer. APM is associated with millions of premature deaths worldwide and with cardiovascular and respiratory diseases every year [10,11,12,13]. Atmospheric PM varies in size and composition and consists of a mixture of primary pollutants (emitted directly from anthropogenic and natural sources) and secondary pollutants (formed in the atmosphere through reactions of primary pollutants) [14]. The chemical composition of particulate matter, as well as other characteristics of PM, can vary within wide limits in different areas, depending on the main emission sources, dispersion conditions, and chemical reactions that take place in the atmosphere, as well as the influence of the air masses transported from both neighboring and remote areas [14]. The contribution of sources is evaluated by different methods, such as receptor modelling. One such method is positive matrix factorization (PMF) [6,7,15,16]. In some papers, SA methods have been described [16,17,18,19,20]. The main sources of PM determined by receptor modelling (108 European SA analysis) are the following: sea salt, soil, traffic exhaust, traffic non-exhaust, industry, secondary inorganic aerosols, solid fuel combustion (biomass burning and coal combustion) and other non-identified sources [15,16]. A review of SA techniques conducted by Johnson et al. [21] identified 11 common PM source categories in 18 developing countries of Asia, Africa, and Latin America, grouped into four main types: (1) dust emissions, including road dust, soil dust, resuspension, fugitive dust, and construction; (2) transport (gasoline and diesel); (3) industrial activities, including coal and oil burning, brick kilns and power plants; as well as (4) nonurban, including biomass burning, long-range transport and marine sources. As a result, the chemistry, size distribution, or reactivity of PM vary widely from location to location and season to season, which induces large changes in health impacts depending on all of these parameters [22].
Krakow was one of the most polluted cities in Poland and Europe. Now, the situation is much better [23]; local authorities have taken many actions to reduce pollution in the city. In southern Poland, along the Vistula valley, the compact buildings and the location of Krakow in a concave form of land, isolated from the south by the mountain area, hinder the natural ventilation of the city via horizontal ventilation, i.e., the movement of pollutants by the emission wind from the place of emission to other areas [24,25]. The main sources in Krakow are road traffic, solid fuel combustion, and industry. The Arcellor Mittal steel industry is located in the east part of the city. The power plants (PGE Energia Cieplna S.A. and CEZ Skawina S.A.) are in the east and southwest parts of the city, respectively. Source apportionment and chemical characterization have been carried out in Krakow since 2014 [26,27,28,29]. PM10 was characterized in the summer of 2018 and winter 2018/2019 at urban and traffic background stations in Kraków [30]. For the use of PMF, five sources of particles have been identified for each station: fossil fuel combustion, secondary inorganic aerosols, traffic exhaust, soil, and the fifth source includes road dust, industry, and construction [30]. The study of Cassoto et al. [31] (2022) described the sources of organic aerosols of PM10 and PM1 in 2018 in Krakow.
The first case in Europe of the transmission of severe acute respiratory syndrome coronavirus 2 (SARS-CoV-2), the virus that causes coronavirus disease 2019 (COVID-19), was detected on 20 February 2020 in Italy. In March, there was a large increase in the number of confirmed cases in many European countries, including Italy, Spain, Germany, and Great Britain. Lockdowns were imposed that led to a drastic reduction in the use of fossil fuels [32,33]. In Poland, the pandemic restrictions started on 11 January 2020. Some limitations in the activity of people were introduced step by step in March, April, and May 2020. An improvement in the air quality was observed during that time. PM10 was significantly lowered, especially at traffic monitoring stations. This could be due to decreased transport and anthropogenic activity during the COVID-19 pandemic.
The purpose of our research was to characterize PM10 and its sources in Krakow (Poland) for two periods of time. Prior to the COVID-19 epidemic and the introduction of a ban on individual heating with coal and wood in Kraków, sampling campaigns were carried out. The samples were collected in Spring 2018 and Spring 2020 at the Krakow Traffic Monitoring Station. Positive matrix factorization was used for the source attribution study. The contributions of different sources were determined.
2. Materials and Methods
2.1. Sampling
PM10 samples were collected at the traffic monitoring station (Ave. Krasińskiego 50.057678; 19.926189) in Krakow during two periods: 2 February–30 May 2018 and 2 February–17 June 2020. The 24 h samples were collected on quartz filters by the Voivodeship Inspectorate for Environmental Protection and the Chief Inspectorate of Environmental Protection. This station is located between a three-lane dual carriageway. This road is one of the most congested streets in the city and is used by passenger cars and buses. Furthermore, the sampling location is about 1 km from the Old Town and 400 m from the Vistula River. The filter is stored in a refrigerator at +4 C. The samples from every third day were taken to the analyses. A total of 60 samples from both campaigns were selected for chemical analysis. Figure 1 presents a map with the location of the sampling site.
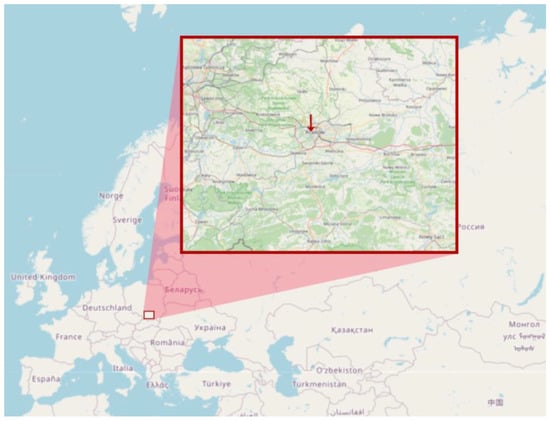
Figure 1.
The map with the location of the sampling site (Av. Krasińskiego, traffic air monitoring station).
2.2. Elemental Analysis
The filters were weighed before and after sampling, following the PN-EN 12,341 standard procedure [34]. They were conditioned before weighing at a temperature of 20 ± 1 °C and constant relative humidity (50 ± 5%) for 48 h. The concentrations of the following elements were determined: P, S, Cl, K, Ca, Ti, V, Cr, Mn, Fe, Co, Ni, Zn, Cu, Br, Rb, Sr, As, and Pb. Energy-dispersive X-ray fluorescence (EDXRF) method was used for the quantification of elements’ concentrations. Analysis was performed under the following conditions: 55 kV voltage, 30 mA current, and 2400 s measuring time. EDXRF spectrometer calibration was performed using thin film standards (Micromatter, Surrey, BC, Canada). The following standards were used for the calibration: SiO, KCl, CaF2, ScF3, Ti, V, Cr, Mn, Fe, Ni, CuSx, ZnTe, Se, SrF2, GaP, Ge, YF3, ZrF4, MoO3, Ag, CsBr, TbF3, Ba, WO3, Au, and Pb. The calibration was verified by analyzing the U.S. NIST standard SRM 2783 (Air Particulate Matter on Filter Media) [28,29]. Figure 2 shows the results of calibration validation.
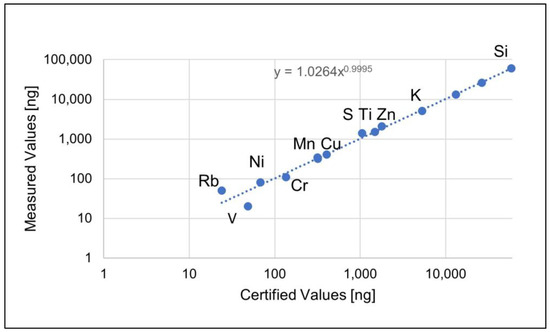
Figure 2.
Validation of the calibration of EDXRF method by SRM 2783.
2.3. Ion Analysis
Isocratic ion chromatography on an ICS-1100 instrument (Thermo Scientific, Sunnyvale, CA, USA) equipped with an auto-sampler (AS-DV Thermo Scientific, Sunnyvale, USA) was used for the determination of the concentrations of ions (Na+, K+, Mg2+, Ca2+, NH4+, NO3−, Cl−, PO43−, and SO42−). Separations were performed using an Ion Pac AS22 and analytical column CS16 for anions and cations, respectively. The separations of samples (25 µL injection volume) were performed with a flow rate of 1.2 mL min−1 of the mobile phase. Separated ion concentrations were determined after electrochemical suppression using AERS 500 and CERS 500 (Thermo Scientific, Sunnyvale, CA, USA) suppressors for anions and cations, respectively. Calibration was performed against external standards (Dionex Combined Seven Anion Standard II and Dionex Combined Six Cation Standard-II) diluted from stock solutions supplied by Thermo Scientific. The detection limits (DL) for selected ions were evaluated in triplicate analysis of standard deviation analysis for blank field samples and their minimum concentrations were detected in the ranges 0.05–0.14 µg/m3 and 0.001–0.07 µg/m3, for anions and cations, respectively. Details of the analytical procedure are presented elsewhere [27].
2.4. Elemental Enrichment Factors
An evaluation of element enrichment factors (EF) was carried out and the nature and human origin of elements were assessed. The EF was calculated using Belis and colleagues′ formulas [15]:
where X PM and RPM are the concentrations of the element under consideration and the reference element in PM, respectively. XCrust and RCrust are the concentrations of the element under consideration and the reference element in the Earth’s Crust, respectively. These measurements were taken from EDXRF measurements. PM and crust mean the concentrations in PM and in the Earth’s crust. Three groups of sources are presented: (i) EF < 10 indicates the crustal origin of the element; (ii) 10 < EF < 100 indicates a mixed origin of the elements (natural and anthropogenic); and (iii) EF > 100 indicates an anthropogenic origin of a given element. EF calculations of EF were performed for Ti as a reference element (if Ti is taken as a reference element EFTi = 1). The abundances of elements in the Earth’s crust were taken from the publication by Rudnick et al. [35].
2.5. PMF Modelling
One of the methods that allows for the identification of particulate matter sources and the quantification of their contribution is the positive matrix factorization method (PMF) introduced by Paatero et al. [36] Due to the need to have many samples (at least several dozen), it is often classified as a statistical method. The basic assumption of the method is a constant relative share of components that characterize a given source. This share is called the profile of a given source. The PMF method, based on the matrix of the sample of chemical species of particulate matter, calculates the matrix of participation of a given number of factors and profiles of these factors [37]. The PMF receptor model solves the set of equations:
where xij is an element of the concentration matrix X (i sample index and j species index), gik is an element of the contribution matrix G with p sources (k is the index of the sources), fkj is an element of F the source and, finally, eij is an element of the residual matrix E [38]. The PMF multivariate statistical method decomposes the concentration matrix (X) into the source contribution (G) and source profile (F) matrixes in such a way that G and F obtain non-negative values only, ensuring the physical meaning of the model. The profile determines the share of individual components in each factor and is the basis for the physical assignment of a given factor to identify the sources of particulate matter. In this method, the number of factors is set arbitrarily. In practice, modeling is carried out for a different number of factors, and the number for which the determination of sources is unambiguous is finally selected [26]. In this work, the EPA PMF 5.0 software, developed by the US Environmental Protection Agency (US EPA), was used. As input, not only is the concentration matrix (X) required but also the appropriate uncertainty matrix (U). For a given number of factors (p), the matrixes G and F are adjusted by minimizing the objective function Q, which is defined as follows:
where uij is an element of the uncertainty matrix (U), m is the number of species and n is the number of samples. A general optimization method where the measured value is ’weighted’ by its uncertainty requires an accurate estimate of the uncertainty. The following 20 chemical species identified in elemental and ions analyses of the PM10 samples were used: S, K, Ti, Cr, Mn, Fe, Co, Cu, Zn, Br, Rb, Sr, Pb, Cl−, NO3−, PO43−, NH4+, Na+, Mg2+ and Ca2+. All of these data were classified as ’strong’, which resulted in a high signal-to-noise ratio. In the present work, if the concentration is less than or equal to the detection limit (LOD) for a given element, the uncertainty is set at 5/6 LOD and the concentration replaced by 1/2 LOD [26,39]. The missing data were substituted by median values, and the corresponding uncertainties were set at four times the LOD median value [26,39]. After the factorization run, the PMF software provides the possibility of analyzing the factorization stability by the “Fpeak Bootstrap Method” [40]. Modeling was carried out together for the data from 2018 and 2020 years. The following values were obtained for Q robust 18,274; Q true 64,574.
2.6. Statistical Analysis
The Wilcoxon rank sum test was used to test whether there were significant differences in medians for solid fuel combustion, SIA, traffic/industry/construction work, soil contributions in both years 2018 and 2020. A value of 1 indicates a rejection of the statement that medians are equal; 0 indicates a failure to reject the statement that medians are equal. The Wilcoxon rank sum test is a nonparametric test that requires no specific distribution on the measurements (like a normal distribution, for instance). This analysis tests the null hypothesis that the data in x and y are samples from continuous distributions with equal medians, against the alternative that they are not, where x and y are samples from 2018 and 2020. The result h = 1 indicates a rejection of the null hypothesis and h = 0 indicates a failure to reject the null hypothesis at the 5% significance level.
3. Results and Discussion
3.1. Chemical Analysis
Figure 3 shows the daily PM10 mass concentrations at the traffic-dominated station during the two sampling periods. Table 1 presents the minimum, maximum, and mean ± SD of the PM10 and element and ion concentrations at the traffic-dominated station in 2018 and 2020. It also presents a ratio of the concentrations in 2018 to the concentrations in 2020. Table S1 includes monthly concentrations of the PM10 and element and ion concentrations at a traffic-dominated station in 2018 and 2020. The PM10 decreased from 74 ± 29 µg/m3 to 37 ± 13 µg/m3 at the traffic station in 2018 and 2020, respectively. It was lowered by 61%, 54%, 34%, and 42% in February, March, April, and May in 2020 compared to 2018, respectively (Table S2). Table S2 shows the concentration of PM10 before the COVID-19 pandemic (in 2018 and 2017–2019) and during the pandemic (2020) in different cities. Filonchyk et al. observed a slightly lower drop in the PM10 concentrations than those observed by Filonchyk et al. for Krakow in the same period [32]. The PM10 lowering in February can be caused primarily by one reason. It is the introduction of a ban on the use of coal and wood for residential heating purposes in Krakow in September 2019. In March, two reasons can be observed. One is the introduction of the ban, and the second is the COVID-19 pandemic which started in March 2020 in Europe. In April and May, the differences between 2018 and 2020 were around 30–40%. It may be related to the limited activity of people during the COVID-19 pandemic, and especially the limited transport in Krakow. Filonchyk et al. observed smaller differences in the PM10 between 2018 and 2020 in March, April, and May in other Polish cities, namely Warszawa, Wrocław, Łódź, and Gdańsk [32]. Sicard et al. obtained a 51% and 48.7% reduction of the PM10 in the Valencia traffic station and Wuhan in March and April, respectively [41]. Strong differences in the concentration were observed for Cl. The 2018/2020 ratio was equal to 3.9. Its concentration decreased by 80%, 82%, and 20% in February, March, and May, respectively, while in April it increased by 31%. This element is an indicator of solid fuel combustion and the de-icing of roads in winter. Therefore, it can be expected that the emission related to solid fuel combustion will be lowered by a similar factor for 2020 compared to 2018. The concentrations of Cu, Zn, Ca, and Fe were lowered by 30–40% in April and May 2020. These elements are indicators of traffic. It could be caused by restrictions in activity during the COVID-19 pandemic. The concentration of K and Na+ in 2018 was 2.3 times higher than in 2020. The NH4+ concentration was 2.5 times lower in 2020 than in 2018. K is an indicator of biomass burning, and NH4+ is a tracer of coal combustion, while Na+ is connected to road dust and soil or salt. The following chemical species had similar concentrations at the station in both years: Ca, Ti, Mn, Ni, Rb, Sr, PO43−, Mg2+, K+, and Ca2+. The 2018/2020 ratio was in the range 0.9–1.2 for the species mentioned above. The ratio varying between 1.5 and 1.9 was for S, NO3−, SO42−, Br, and Zn. The ratio for Fe, Co, and Cu was found to be equal to 1.4. The Cr concentration was higher in 2020 than in 2018. This element can come from the steel industry.
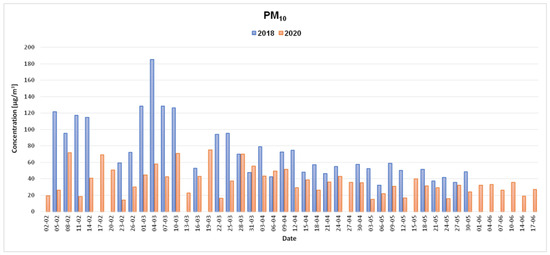
Figure 3.
Daily PM10 concentration in measured periods 2018 and 2020 at the Krasińskiego traffic station in Krakow.

Table 1.
The concentrations of PM10 (in µg/m3) and their associated chemical species (in ng/m3) in the year 2018 and 2020. One column contains the ratio of concentration in 2018 to concentration in 2020. The last column contains limit of detection (LOD—in ng/m3).
3.2. Preliminary Identification of PM10 Sources: An Element Enrichment Factor
Figure 4 shows the enrichment factors in decreasing order for the elements analyzed at the traffic-dominated station of Aleje Krasińskiego. The EFs were about 200 for Cl and Br and around 100 for Zn and Cu. They were in the range 50–10 for S, Pb, Co, As, and Cr (in the year 2020). For example, Cl, Br, Zn, Pb, and As are released by coal combustion, Pb and Zn are caused by industrial processes and/or vehicle exhaust emissions, and Zn is caused by non-emissions (tire wear) [14,29]. Cu originates mainly from exhaust emissions (breast wear). Cr can come from coal burning, industry, or traffic [29]. Also, Cr can have a natural origin. For enrichment factors below 10, Cr (2018), Fe, Ni, V, Mn, K, Ca, Rb, and Sr are mainly of natural origin. These elements come not only from natural sources, but also from human emissions, which contribute to the PM10. Ca can be associated with construction. Mn is associated with emissions from fuel additives or industrial processes. K is a marker for biomass combustion [14].
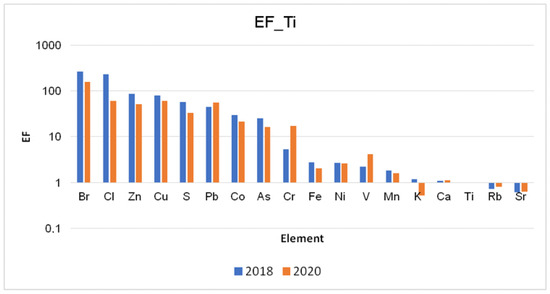
Figure 4.
Enrichment factors for elements at Aleja Krasińskiego traffic-dominated station.
3.3. Source Apportionment PMF
Four factors were obtained from the PMF analysis. Figure 5 shows the factor profiles and attributed emission sources.
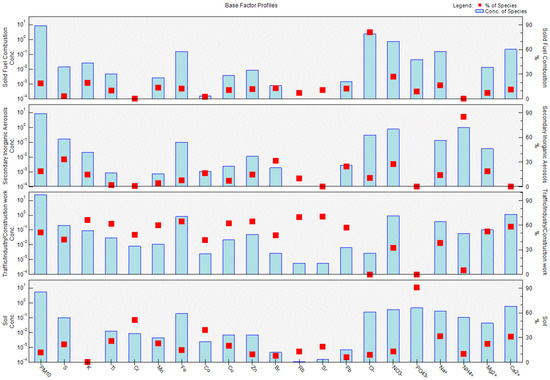
Figure 5.
Factor profiles and attributed emission sources of PM10.
The first factor was characterized by Cl− (81% of the mass), NO3− (27% of the mass), K (19% of the mass), Na+ (16% of the mass). It was attributed to solid fuel combustion and the de-icing of roads in winter. Cl, S, Cd, Cr, and Br come from coal combustion [42,43]. K and Cl− are the major compounds emitted from wood, straw, and other agricultural residues burning and are related to biomass burning [14,23,42,44]. The contribution of this source to the mass of the PM10 was equal to 15 µg/m3 and 2.9 µg/m3 in 2018 and 2020, respectively. The contribution decreased by 82% in 2020 compared to 2018. The most important lowering of this emission source contribution to the PM10 mass was observed in February and March. In these months, people heat their houses. This may be related to the introduction of the ban on the use of coal and wood for heating purposes in September 2019 in Krakow. The difference in the contribution to solid fuel combustion in 2018 and 2020 was very small in April and May (between 0.2 and 6.3 µg/m3) when higher ambient temperatures were observed.
The second factor was attributed to secondary inorganic aerosols (SIAs) and the main chemical species were NH4+ (84% of the mass), S (33% of the mass), NO3− (27% of the mass), Br (31% of the mass), Pb (24% of the mass), and Co (17% of the mass). The SIA contribution was reduced from 15.5 µg/m3 in 2018 to 2.3 µg/m3 in 2020. It was reduced by around 84% during the entire analyzed period. In February and March, it decreased by 98% and 72%, respectively. In April it lowered by 35% and in May it increased by 90%. But the contribution of SIAs in April and May was very low and was in the range of 1.4–3.0 µg/m3. SIAs are produced in the atmosphere by chemical reactions involving SO2, NOx, and NH3. (NH4)2SO4 and NH4NO3 were the dominant components of SIAs in PM10, which could be chemically formed by atmospheric reactions of NH3 with SO2 and NOx emitted from high-temperature combustion processes using sulfur-containing fuels such as coal and heavy fuel oil. The SO42−/NO3− ratio was in the range 0.35–7.74 and 0.35–4.60 in 2018 and 2020, respectively. A higher ratio was observed for 2018 than for 2020. In particular, the main sources of SO2 and NOx were coal-fired power plants, industrial boilers, and vehicular exhaust. The lowering of the above-mentioned ratio in 2020 can be connected to the lowering of the contribution of coal combustion. All elements included in this source are of dominantly or at least partly anthropogenic origin, as was confirmed by the analysis of the enrichment factors (Section 3.2.)
The third factor characterized by Sr (70% of the mass), Rb (70% of the mass), Zn (66% of the mass), Fe (65% of the mass), K (67% of the mass), Ca2+ (58% of the mass), Cu (62% of the mass), Mn (60% of the mass), Ti (62% of the mass), S (42% of the mass), Na+ (39% of the mass), Pb (58% of the mass), and Br (48% of the mass) was attributed to traffic/industry/construction work. Ti, Mn, Sr, Zr, Al, Ca, and Fe come from the resuspension of road dust [45,46]. Zn, Cu, Ba, Sb, and Fe are related to the wearing of brakes and tires [46,47,48]. Ti, Sr, and Fe may be emitted from the abrasion of roads, Fe, Mn, and Co from brake pads and Mn, Fe, and Co from tires [14] The contribution of this source to the PM10 mass was equal to 23.7 µg/m3 and 23.1 µg/m3 in 2018 and 2020 during the entire analysis period, respectively. In February, the contribution of this source was increasing by 30%, and in April it was on the same level in both analyzed years. In March and May, it was lowering by 6 and 36%, respectively. The decrease in emission source contribution could be caused by the reduction in activity during the COVID-19 pandemic which started in March 2020. It could also be the result of limited traffic in April and May 2020 during the COVID-19 pandemic.
The fourth factor was attributed to soil. The markers were PO43− (92% of the mass), Cr (52% of the mass), Co (42% of the mass), Na+ (31% of the mass), Ca2+ (31% of the mass), Mg2+ (22% of the mass), Cu (20% of the mass), Mn (23% of the mass), and Ti (26% of the mass). The contributions to the PM10 mass were 4.5 µg/m3 and 6.5 µg/m3 in 2018 and 2020, respectively. Non-identified sources contributed 14.5 µg/m3 and 2.9µg/m3 to the PM10 in 2018 and 2020, respectively. Figure 6 shows the factor fingerprints. Figure 7 presents the monthly contribution of sources to the mass of PM10 in µg/m3.
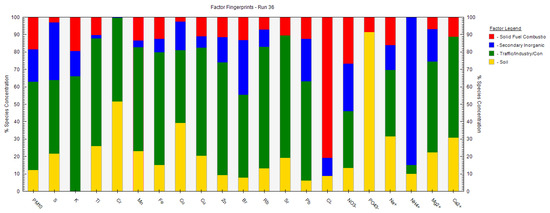
Figure 6.
Factor fingerprints.
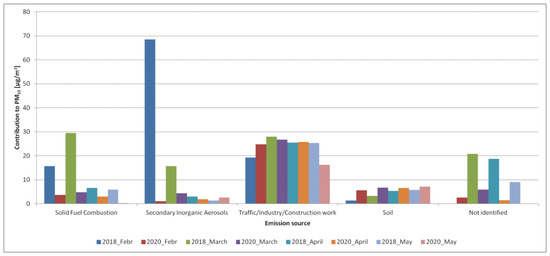
Figure 7.
The monthly contribution of emission sources to PM10 at traffic-dominated station in Krakow in measured period 2018 and 2020.
For our DISP (displacement analysis), the results present no swaps that means the solution is stable. For our BS (bootstrapping analysis) analysis, the resulting mapping values met the criterion values (according to the PMF guideline document) for which it can be concluded that the number of factors is appropriate.
Gianini et al. [49] estimated that about 30% of the PM10 mass at the urban roadside site is generated by local road traffic emissions in Bern, Switzerland. Mineral matter (43%), secondary inorganic aerosol (SIA) (17%), organic matter and elemental carbon (31%) contribute to the PM10 mass in the urban location of Granada, Spain [50]. Dongarra et al. in Palermo, Italy, found that road traffic contributed almost 50% of the PM [51]. Road traffic, specifically emissions from vehicles, the suspension of dust due to vehicular movement, and tire break wear, add significantly to the PM10 around traffic sites [51,52,53,54].
Figure 8 presents the comparison of the modelled PM10 and measured PM10. Figure S2 shows the predicted versus the observed concentration of chemical species.
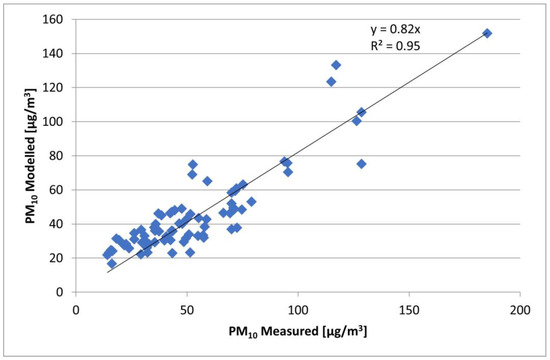
Figure 8.
The comparison of modeled and measured PM10.
Table 2 presents the results of the sources of contribution to the PM in the different urban areas.
Table 2.
The contribution of different sources to PM mass in urban areas (in %).
3.4. Statistical Analysis
The Wilcoxon rank sum test (Table 3) showed that significant statistical differences in solid fuel combustion were observed in March and May, and the SIA contributions were statistically different in February and March. The traffic/industry/construction work contributions were statistically different in May, falling by 36% in 2020 compared to 2018. It may be the result of the reduction in people’s activity and traffic during the COVID-19 pandemic.
Table 3.
Wilcoxon rank sum test results for solid fuel combustion, SIA, traffic/industry/construction work, and soil in both years 2018 and 2020. A value of 1 indicates a rejection of the statement that medians are equal; 0 indicates a failure to reject the statement that medians are equal.
4. Conclusions
In this study, the effect of the lockdown on the air quality was assessed in Krakow. The PM10 concentrations at the Krakow traffic monitoring station decreased by 61%, 54%, 34%, and 42% in February, March, April, and May 2020 compared to the same months in 2018. The following elements and ions: Ca, Ti, Mn, Ni, Rb, Sr, PO43−, Mg2+, K+, and Ca2+, had similar concentrations in both years (2018 and 2020). The PMF modelling showed that the contributions of solid fuel combustion and SIA decreased by 77–84% and 98–72% in two months (February and March), respectively. The changes in the contribution of the sources in February 2020 could be caused by the introduction of a ban of the use of solid fuel combustion for residential heating in Krakow in September 2019. The high contribution of traffic/industry/construction work to the PM10 mass was equal to 24.6 µg/m3 (33.1%) and 23.4 µg/m3 (63.7%) in 2018 and 2020, respectively. In March and May 2020, it was reduced by 6% and 36%, respectively, compared to 2018. This may be related to the limited activity of people during the COVID-19 pandemic, especially the restriction of traffic in the city. In March 2020, the lockdown caused by the COVID-19 pandemic began.
Supplementary Materials
The following supporting information can be downloaded at: https://www.mdpi.com/article/10.3390/app132011492/s1.
Author Contributions
Conceptualization, L.S.; formal analysis, XRF L.S., J.D. and A.R.; IC analysis, K.S.; PMF modelling, Z.S.; funding acquisition, L.S., V.M. and S.M.A.; investigation, L.S.; methodology, L.S., K.S., A.R, J.D., V.M. and S.M.A.; project administration, L.S.; software, Z.S.; supervision, L.S.; validation, L.S., A.R., K.S. and Z.S.; roles/writing—original draft, L.S.; writing—review and editing, all. All authors have read and agreed to the published version of the manuscript.
Funding
The bilateral cooperation project (no BPN/BPT/2021/1/00001 in Poland and no 2021.09406.CBM in Portugal) between Poland and Portugal partially financed this work.
Institutional Review Board Statement
Not applicable.
Informed Consent Statement
Not applicable.
Data Availability Statement
The data are available on request from the authors.
Acknowledgments
This research project was supported/partially supported by the program ‘Excellence initiative, research university’ for the University of Science and Technology (Project no 1644). The bilateral cooperation project (no BPN/BPT/2021/1/00001 in Poland and no 2021.09406.CBM in Portugal) between Poland and Portugal partially financed this work together with the subsidy of the Ministry of Science and Higher Education, grants numbers 16.16.220.842 and 16.16.210.476. The authors thank the Voivodeship Inspectorate for Environmental Protection and the Chief Inspectorate of Environmental Protection for supplying the PM10 samples.
Conflicts of Interest
The authors declare no conflict of interest.
References
- European Parliament; Council of the European Union. Directive 2008/50/EC of the European Parliament and the Council of 21 May 2008 on ambient air quality and cleaner air for Europe. Off. J. Eur. Union 2008, 51, 1–361. [Google Scholar]
- GIOS. The Annual Reports of Air Quality Measurements of Chief Inspectorate of Environmental Protection, 2010–2019. Available online: https://powietrze.gios.gov.pl/ (accessed on 1 June 2021). (In Polish)
- WIOS. The Annual Reports of Air Quality Measurements of Voivodeship Inspectorate for Environmental Protection in Krakow, 2010–2020. Available online: https://krakow.wios.gov.pl/ (accessed on 1 June 2021). (In Polish)
- Alastuey, A.; Querol, X.; Plana, F.; Viana, M.; Ruiz, C.R.; Sánchez de la Campa, A.; de la Rosa, J.; Mantilla, E.; García dos Santos, S. Identification and Chemical Characterization of Industrial Particulate Matter Sources in Southwest Spain. J. Air Waste Manag. Assoc. 2006, 56, 993–1006. [Google Scholar] [CrossRef]
- Belarbi, N.; Belamri, M.; Dahmani, B.; Benamar, M.A. Road Traffic and PM10, PM2.5 Emission at an Urban Area in Algeria: Identification and Statistical Analysis. Pollution 2020, 6, 651–660. [Google Scholar] [CrossRef]
- Summak, G.; Ozdemir, H.; Oruc, I.; Kuzu, L.; Saral, A.; Demir, G. Statistical evaluation and predicting the possible sources of particulate matter in a Mediterranean metropolitan city. Glob. NEST J. 2018, 20, 173–180. [Google Scholar]
- Mukherjee, A.; Agrawal, M. World air particulate matter: Sources, distribution and health effects. Environ. Chem. Lett. 2017, 15, 283–309. [Google Scholar] [CrossRef]
- Sochacka-Tatara, E.; Majewska, R.; Perera, F.P.; Camann, D.; Spengler, J.; Wheelock, K.; Sowa, A.; Jacek, R.; Mróz, E.; Pac, A. Urinary polycyclic aromatic hydrocarbon metabolites among 3-year-old children from Krakow, Poland. Environ. Res. 2018, 164, 212–220. [Google Scholar] [CrossRef] [PubMed]
- Konduracka, E.; Krawczyk, K.; Surmiak, M.; Pudełek, M.; Malinowski, K.P.; Mastalerz, L.; Zimnoch, M.; Samek, L.; Styszko, K.; Furman, L.; et al. Monocyte exposure to fine particulate matter results in miRNA release: A link between air pollution and potential clinical complication. Environ. Toxicol. Pharmacol. 2022, 96, 103996. Available online: https://www.sciencedirect.com/science/article/pii/S1382668922001892/pdfft?md5=323e7d3f525e618b2c26d3b26cdc5f6f&pid=1-s2.0-S1382668922001892-main.pdf (accessed on 17 October 2023). [CrossRef] [PubMed]
- Reizer, M.; Juda-Rezler, K. Explaining the high PM10 concentrations observed in Polish urban areas. Air Qual. Atmos. Health 2016, 9, 517–531. [Google Scholar] [CrossRef] [PubMed]
- Cohen, A.J.; Brauer, M.; Burnett, R.; Anderson, H.R.; Frostad, J.; Estep, K.; Balakrishnan, K.; Brunekreef, B.; Dandona, L.; Dandona, R.; et al. Estimates and 25-year trends of the global burden of disease attributable to ambient air pollution: An analysis of data from the Global Burden of Diseases Study 2015. Lancet 2017, 389, 1907–1918. [Google Scholar] [CrossRef] [PubMed]
- Pope III, C.A.; Burnett, R.T.; Thun, M.J.; Calle, E.E.; Krewski, D.; Ito, K.; Thurston, G.D. Lung cancer, cardiopulmonary mortality, and long-term exposure to fine particulate air pollution. JAMA 2002, 287, 1132–1141. [Google Scholar] [CrossRef]
- Pope, C.A., III; Ezzati, M.; Dockery, D.W. Fine-Particulate Air Pollution and Life Expectancy in the United States. N. Engl. J. Med. 2009, 360, 376–386. [Google Scholar] [CrossRef]
- Juda-Rezler, K.; Reizer, M.; Maciejewska, K.; Błaszczak, B.; Klejnowski, K. Characterization of atmospheric PM2.5 sources at a Central European urban background site. Sci. Total Environ. 2020, 713, 136729. [Google Scholar] [CrossRef] [PubMed]
- Belis, C.A.; Karagulian, F.; Larsen, B.R.; Hopke, P.K. Critical review and meta-analysis of ambient particulate matter source apportionment using receptor models in Europe. Atmos. Environ. 2013, 69, 94–108. [Google Scholar] [CrossRef]
- Belis, C.A.; Larsen, B.R.; Amato, F.; El Haddad, I.; Favez, O.; Harrison, R.M.; Viana, M. European Guide on Air Pollution Source Apportionment with Receptor Models. 2014. Available online: https://www.researchgate.net/profile/Olivier-Favez/publication/335661273_European_guide_on_air_pollution_source_apportionment_with_receptor_models_-_Revised_version_2019/links/5f1d210045851515ef4a9f56/European-guide-on-air-pollution-source-apportionment-with-receptor-models-Revised-version-2019.pdf (accessed on 17 October 2023).
- Belis, C.; Pernigotti, D.; Pirovano, G.; Favez, O.; Jaffrezo, J.; Kuenen, J.; van Der Gon, H.D.; Reizer, M.; Riffault, V.; Alleman, L.; et al. Evaluation of receptor and chemical transport models for PM10 source apportionment. Atmos. Environ. X 2019, 5, 100053. [Google Scholar] [CrossRef]
- Hopke, P.K. Review of receptor modeling methods for source apportionment. J. Air Waste Manag. Assoc. 2016, 66, 237–259. [Google Scholar] [CrossRef] [PubMed]
- Thunis, P.; Clappier, A.; Tarrasón, L.; Cuvelier, C.; Monteiro, A.; Pisoni, E.; Peduzzi, E. Source apportionment to support air quality planning: Strengths and weaknesses of existing approaches. Environ. Int. 2020, 130, 104825. [Google Scholar] [CrossRef] [PubMed]
- Mircea, M.; Calori, G.; Pirovano, G.; Belis, C.A. European guide on air pollution source apportionment for particulate matter with source oriented models and their combined use with receptor models. Publ. Off. Eur. Union Luxemb. 2020. [Google Scholar] [CrossRef]
- Johnson, T.M.; Guttikunda, S.; Wells, G.J.; Artaxo, P.; Bond, T.C.; Russell, A.G.; Watson, J.G.; West, J. Tools for Improving Air Quality Management: A Review of Top-Down Source Apportionment Techniques and Their Application in Developing Countries; Report 339/11, Energy Sector Management Assistance Program; World Bank Group: Washington, DC, USA, 2011. [Google Scholar]
- Kelly, F.J.; Fussell, J.C. Size, Source and Chemical Composition as Determinants of Toxicity Attributable to Ambient Particulate Matter. Atmos. Environ. 2012, 60, 504–526. [Google Scholar] [CrossRef]
- Rys, A.; Samek, L.; Stegowski, Z.; Styszko, K. Comparison of concentrations of chemical species and emission sources PM2. 5 before pandemic and during pandemic in Krakow, Poland. Sci. Rep. 2022, 12, 16481. [Google Scholar] [CrossRef]
- Bokwa, A. Wieloletnie Zmiany Struktury Mezoklimatu Miasta na Przykładzie Krakowa; Instytut Geografii i Gospodarki Przestrzennej Uniwersytetu Jagiellońskiego: Kraków, Poland, 2010. [Google Scholar]
- Bokwa, A. Rozwój badań nad klimatem lokalnym Krakowa. Acta Geogr. Lodz. 2019, 108, 7–20. [Google Scholar] [CrossRef]
- Samek, L.; Stegowski, Z.; Furman, L.; Styszko, K.; Szramowiat, K.; Fiedor, J. Quantitative Assessment of PM2.5 Sources and Their Seasonal Variation in Krakow. Water Air Soil Pollut. 2017, 228, 290. [Google Scholar] [CrossRef]
- Samek, L.; Stegowski, Z.; Styszko, K.; Furman, L.; Fiedor, J. Seasonal contribution of assessed sources to submicron and fine particulate matter in a Central European urban area. Environ. Pollut. 2018, 241, 406–411. [Google Scholar] [CrossRef] [PubMed]
- Samek, L.; Stegowski, Z.; Styszko, K.; Furman, L.; Zimnoch, M.; Skiba, A.; Kistler, M.; Kasper-Giebl, A.; Rozanski, K.; Konduracka, E. Seasonal variations of chemical composition of PM2.5 fraction in the urban area of Krakow, Poland: PMF source attribution. Air Qual. Atmos. Health 2020, 13, 89–96. [Google Scholar] [CrossRef]
- Samek, L.; Turek-Fijak, A.; Skiba, A.; Furman, P.; Styszko, K.; Furman, L.; Stegowski, Z. Complex characterization of fine fraction and source contribution to PM2.5 mass at an urban area in central Europe. Atmosphere 2020, 11, 1085. [Google Scholar] [CrossRef]
- Samek, L.; Styszko, K.; Stegowski, Z.; Zimnoch, M.; Skiba, A.; Turek-Fijak, A.; Gorczyca, Z.; Furman, P.; Kasper-Giebl, A.; Rozanski, K. Comparison of PM10 Sources at Traffic and Urban Background Sites Based on Elemental, Chemical and Isotopic Composition: Case Study from Krakow, Southern Poland. Atmosphere 2021, 12, 1364. [Google Scholar] [CrossRef]
- Casotto, R.; Skiba, A.; Rauber, M.; Strähl, J.; Tobler, A.; Bhattu, D.; Lamkaddam, H.; Manousakas, M.I.; Salazar, G.; Cui, T.; et al. Organic aerosol sources in Krakow, Poland, before implementation of a solid fuel residential heating ban. Sci. Total Environ. 2023, 855, 158655. [Google Scholar] [CrossRef] [PubMed]
- Filonchyk, M.; Hurynovich, V.; Yan, H. Impact of Covid-19 lockdown on air quality in the Poland, Eastern Europe. Sci. Total Environ. 2020, 198, 110454. [Google Scholar] [CrossRef] [PubMed]
- Collivignarelli, M.C.; Abbà, A.; Bertanza, G.; Pedrazzani, R.; Ricciardi, P.; Miino, M.C. Lockdown for COVID-2019 in Milan: What are the effects on air quality? Sci. Total Environ. 2020, 732, 139280. [Google Scholar] [CrossRef] [PubMed]
- Polish Committee for Standardization. Atmospheric air—Standard gravimetric measurement method for determining the mass concentrations of PM10 or PM2.5 fractions of particulate matter. PN EN 2014, 12, 341. [Google Scholar]
- Rudnick, R.L.; Gao, S. The composition of the continental crust. In Treatise on Geochemistry—The Crust; Rudnick, R.L., Holland, H.D., Turekian, K.K., Eds.; Elsevier: Oxford, UK, 2003; pp. 1–64. [Google Scholar]
- Paatero, P.; Tapper, U. Positive matrix factorization: A Non-Negative Factor Model with Optimal Utilization of Error Estimates of Data Values. Environmetrics 1994, 5, 111–126. [Google Scholar] [CrossRef]
- Karagulian, F.; Belis, C.A. Enhancing source apportionment with receptor models to foster the air quality directive implementation. Int. J. Environ. Pollut. 2012, 50, 190–199. [Google Scholar] [CrossRef]
- Manousakas, M.; Diapouli, E.; Papaefthymiou, H.; Migliori, A.; Karydas, A.; Padilla-Alvarez, R.; Bogovac, M.; Kaiser, R.; Jaksic, M.; Bogdanovic-Radovic, I.; et al. Source apportionment by PMF on elemental concentrations obtained by PIXE analysis of PM10 samples collected at the vicinity of lignite power plants and mines in Megalopolis, Greece. Nucl. Instrum. Methods Phys. Res. B 2015, 349, 114–124. [Google Scholar] [CrossRef]
- Polissar, A.V.; Hopke, P.K.; Paatero, P.; Malm, W.C.; Sisler, J.F. Atmospheric aerosol over Alaska: 2. Elemental composition and sources. J. Geophys. Res. Atmos. 1998, 103, 19045–19057. [Google Scholar] [CrossRef]
- Manousakas, M.; Papaefthymiou, H.; Diapouli, E.; Migliori, A.; Karydas, A.; Bogdanovic-Radovic, I.; Eleftheriadis, K. Assessment of PM2.5 sources and their corresponding level of uncertainty in a coastal urban area using EPA PMF 5.0 enhanced diagnostics. Sci. Total Environ. 2017, 574, 155–164. [Google Scholar] [CrossRef] [PubMed]
- Sicard, P.; De Marco, A.; Agathokleous, E.; Feng, Z.; Xu, X.; Paoletti, E.; Rodriguez, J.J.D.; Calatayud, V. Amplified ozone pollution in cities during the COVID-19 lockdown. Sci. Total Environ. 2020, 735, 139542. [Google Scholar] [CrossRef] [PubMed]
- Yatkin, S.; Bayram, A. Elemental composition and sources of particulate matter in the ambient air of a Metropolitan City. Atmos. Res. 2007, 85, 126–139. [Google Scholar] [CrossRef]
- Agarwal, A.; Satsangi, A.; Lakhani, A.; Kumari, K.M. Seasonal and spatial variability of secondary inorganic aerosols in PM2.5 at Agra: Source apportionment through receptor models. Chemosphere 2019, 242, 125132. [Google Scholar] [CrossRef] [PubMed]
- Saarikoski, S.; Timonen, H.; Saarnio, K.; Aurela, M.; Järvi, L.; Keronen, P.; Kerminen, V.-M.; Hillamo, R. Sources of organic carbon in fine particulate matter in northern European urban air. Atmos. Chem. Phys. 2008, 8, 6281–6295. [Google Scholar] [CrossRef]
- Sternbeck, J.; Sjödin, Å.; Andréasson, K. Metal emissions from road traffic and the influence of resuspension—Results from two tunnel studies. Atmos. Environ. 2002, 36, 4735–4744. [Google Scholar] [CrossRef]
- Querol, X.; Viana, M.; Alastuey, A.; Amato, F.; Moreno, T.; Castillo, S.; Pey, J.; de la Rosa, J.; de la Campa, A.S.; Artíñano, B.; et al. Source origin of trace elements in PM from regional background, urban and industrial sites of Spain. Atmos. Environ. 2007, 41, 7219–7231. [Google Scholar] [CrossRef]
- Hampel, R.; Peters, A.; Beelen, R.; Brunekreef, B.; Cyrys, J.; de Faire, U.; de Hoogh, K.; Fuks, K.; Hoffmann, B.; Hüls, A.; et al. Long-term effects of elemental composition of particulate matter on inflammatory blood markers in European cohorts. Environ. Int. 2015, 82, 76–84. [Google Scholar] [CrossRef]
- Samek, L.; Gdowik, A.; Ogarek, J.; Furman, L. Elemental composition and rough source apportionment of fine particulate matter in air in Cracow, Poland. Environ. Prot. Eng. 2016, 42, 71–83. [Google Scholar] [CrossRef]
- Gianini, M.F.; Gehrig, R.; Fischer, A.; Ulrich, A.; Wichser, A.; Hueglin, C. Chemical composition of PM10 in Switzerland: An analysis for 2008/2009 and changes since 1998/1999. Atmos. Environ. 2012, 54, 97–106. [Google Scholar] [CrossRef]
- Titos, G.; Foyo-Moreno, I.; Lyamani, H.; Querol, X.; Alastuey, A.; Alados-Arboledas, L. Optical properties and chemical composition of aerosol particles at an urban location: An estimation of the aerosol mass scattering and absorption efficiencies. J. Geophys. Res. Atmos. 2012, 117, 1–12. [Google Scholar] [CrossRef]
- Dongarrà, G.; Manno, E.; Varrica, D.; Lombardo, M.; Vultaggio, M. Study on ambient concentrations of PM10, PM10–2.5, PM2.5 and gaseous pollutants. Trace elements and chemical speciation of atmospheric particulates. Atmos. Environ. 2010, 44, 5244–5257. [Google Scholar] [CrossRef]
- Mansha, M.; Ghauri, B.; Rahman, S.; Amman, A. Characterization and source apportionment of ambient air particulate matter (PM2. 5) in Karachi. Sci. Total Environ. 2012, 425, 176–183. [Google Scholar] [CrossRef] [PubMed]
- Tiwari, S.; Srivastava, A.K.; Bisht, D.S.; Bano, T.; Singh, S.; Behura, S.; Srivastava, M.K.; Chate, D.M.; Padmanabhamurty, B. Black carbon and chemical characteristics of PM10 and PM2.5 at an urban site of North India. J. Atmos. Chem. 2010, 62, 193–209. [Google Scholar] [CrossRef]
- Rahman, S.A.; Hamzah, M.S.; Wood, A.K.; Elias, S.; Salim, N.A.A.; Sanuri, E. Sources apportionment of fine and coarse aerosol in Klang Valley, Kuala Lumpur using positive matrix factorization. Atmos. Pollut. Res. 2011, 2, 197–206. [Google Scholar] [CrossRef]
- Chlebowska-Styś, A. Identyfikacja Źródeł Emisji Pyłu Zawieszonego na Terenie Poznania. Ph.D. Dissertation, Wydział Inżynierii Środowiska, Politechnika Wrocławska, Wrocław, Poland, 2020. [Google Scholar]
- Database on Source Apportionment Studies for Particulate Matter. Available online: https://www.who.int/data/gho/data/themes/air-pollution/source-apportionment-db (accessed on 3 October 2023).
- Doumbia, T.; Liousse, C.; Ouafo-Leumbe, M.-R.; Ndiaye, S.A.; Gardrat, E.; Galy-Lacaux, C.; Zouiten, C.; Yoboué, V.; Granier, C. Source Apportionment of Ambient Particulate Matter (PM) in Two Western African Urban Sites (Dakar in Senegal and Bamako in Mali). Atmosphere 2023, 14, 684. [Google Scholar] [CrossRef]
Disclaimer/Publisher’s Note: The statements, opinions and data contained in all publications are solely those of the individual author(s) and contributor(s) and not of MDPI and/or the editor(s). MDPI and/or the editor(s) disclaim responsibility for any injury to people or property resulting from any ideas, methods, instructions or products referred to in the content. |
© 2023 by the authors. Licensee MDPI, Basel, Switzerland. This article is an open access article distributed under the terms and conditions of the Creative Commons Attribution (CC BY) license (https://creativecommons.org/licenses/by/4.0/).