Article

Experimental Investigation on Effects of Water Injection on Rock Frictional Sliding and Its Implications for the Mechanism of Induced Earthquake

1
Guangdong Earthquake Agency, Guangzhou 510070, China
2
State Key Laboratory of Earthquake Dynamics, Institute of Geology, China Earthquake Administration, Beijing 100029, China
*
Authors to whom correspondence should be addressed.
Appl. Sci. 2023, 13(20), 11466; https://doi.org/10.3390/app132011466
Submission received: 6 September 2023 / Revised: 7 October 2023 / Accepted: 17 October 2023 / Published: 19 October 2023

Abstract

:
This study conducted water-induced fault slip experiments on saw-cut granite, sandstone, and limestone samples. Experimental results demonstrated that injecting 15 MPa pressurized water into the vicinity of a high-permeability sandstone fault could decrease the effective normal stress and induce fault slip but not significantly affect the stress of granite and limestone faults due to low permeability. When the pressurized water was injected into the fault plane, 1 MPa pressurized water could not significantly affect fault stress; however, the 15 MPa pressurized water caused a significant reduction in frictional strength and induced fault sliding. The actual pore pressure differed from the injection pressure and showed significant differences in three faults, resulting in the apparent difference in stress drop, slip duration, displacement, and sliding rate. Three faults showed velocity-strengthening properties at room temperature. The fault slip caused by 15 MPa pressurized water injection was a direct response of fault strength to the reduction in effective normal stress. The limestone fault was characterized by velocity-weakening behavior at 100 °C, and the sliding rate of the fault induced by the 15 MPa pressurized water injection was faster than that at room temperature. The experiment results suggest that high-pressure injection can dominate over velocity-dependent effects, inducing fault-unstable slips in velocity-strengthening faults, but is more likely to induce medium-strong earthquakes on the velocity-weakening fault.

1. Introduction

Human activities are known to induce earthquakes in various ways. It has been known for decades that reservoir impoundments induce earthquakes. Recently, induced seismicity related to fluid injection has been reported worldwide and has attracted growing attention [1,2,3,4]. For example, the extraordinary increase in the seismicity rate in the central United States has been primarily linked to large-volume wastewater disposal [5,6,7,8]. In western Canada, it is mainly associated with shale gas hydraulic fracturing [9,10]. In China, the induced earthquakes in the Sichuan Basin are mainly attributed to long-term injections for wastewater disposal [11,12] and salt mining [12,13], as well as short-term injections for shale gas hydraulic fracturing [12,14,15,16]. In addition, earthquakes have also been linked to the modeling of enhanced geothermal systems (EGS), such as the earthquakes in Pohang, South Korea [17] and Basel, Switzerland [18].
According to previous research, stronger induced earthquakes are usually caused by the reactivation of large-scale pre-existing faults with different maturity [12,19]. Pre-existing faults located and optimally oriented in the present-day regional stress field will be more susceptible to reactivation. Thus, injections can induce strong earthquakes by reducing the effective stress on the fault or the intrinsic fault strength as it is critically stressed. As a result, the distribution of induced earthquakes is ultimately determined by the spatial distribution of the pre-existing faults [20], while the maximum magnitude of possible earthquakes is primarily defined by the fault scale, density, and maturity [14,16,19]. Lithology and rock permeability play essential roles in induced earthquakes, controlling their spatial and temporal migration characteristics [8], and even the depth position where seismicity is most prevalent [21].
Rock mechanics experiments performed in previous studies have provided many insights into the mechanism of injection-induced earthquakes. In a pioneering study, Lockner and Byerlee [22] investigated the impact of fluid injection rate on sandstone failure and stated that shear fracture was induced by slow injection of pore fluid, whereas rapid injection caused a tensile fracture. At constant stress, Byerlee and Lockner [23] found that acoustic emission (AE) events migrated as a cluster along the sample, following the migration of the waterfront closely. Masuda et al. [24] performed a similar injection experiment on dry granite and reported positive feedback between acoustic emission (AE) activity and pore pressure diffusion. The injection studies conducted over the last two decades provided substantial evidence that pore fluid diffusion was crucial to AE activity, altering its temporal and spatial distribution [25,26]. For example, Lei et al. [26] performed a series of rock fracture tests under different drainage conditions, demonstrating that drainage conditions played a governing role in rock deformation and fracture. Good drainage conditions are conducive to the fast diffusion of pore pressure, leading to a significant decrease in rock strength and stabilization of the dynamic rupture processes, which may enlarge the nucleation dimension and duration, thereby increasing the predictability of the final catastrophic failure. Li et al. [25] carried out injection tests on partly saturated (the middle part was dry) and fully saturated sandstone samples and compared their fracturing behaviors using acoustic emission (AE) monitoring. The results suggested that the local hydraulic condition controlled the geometry of the shear fracture zone, AE productivity, and mechanical properties. The partly saturated sample showed significant positive feedback between pore pressure diffusion and damage growth, while the fully saturated sample demonstrated quite ductile fracture behavior and a low level of AE activity. More recently, laboratory creep experiments on carbonate-bearing fault gouge suggested that the coupling between fluid pressure and rate-and-state friction parameters controls fault stability [27,28].
Previous laboratory experiments have systematically investigated the mechanism of injection-induced earthquakes; however, many issues are still not fully understood and must be addressed. For instance, the leading cause of strong induced earthquakes is the reactivation of pre-existing faults [12,19], but the existing research primarily concentrates on how fluid injection affects the deformation and fracture of rocks. Again, because no apparent differences have been found between natural origin events and induced earthquakes concerning earthquake seismological aspects [12,29], the mechanism of induced earthquakes is explained mainly by the knowledge of tectonic earthquakes. For example, the velocity weakening of fault was applied to explain focal depths [30]. Since injection-induced earthquakes mainly occur in shallow sedimentary faults that are usually characterized by velocity-strengthening properties, it is a question of whether the velocity weakening of a fault may also be applied to induced earthquakes at shallow sedimentary faults [15]. Considering this gap, this paper performed frictional experiments with pressurized water injection on granite, sandstone, and limestone faults using a triaxial friction apparatus and measured their velocity dependence. Moreover, it highlights the impacts of fluid injection on the faulting slip, and the results can shed light on the mechanism and influencing factors of injection-induced earthquakes.

2. Materials and Methods
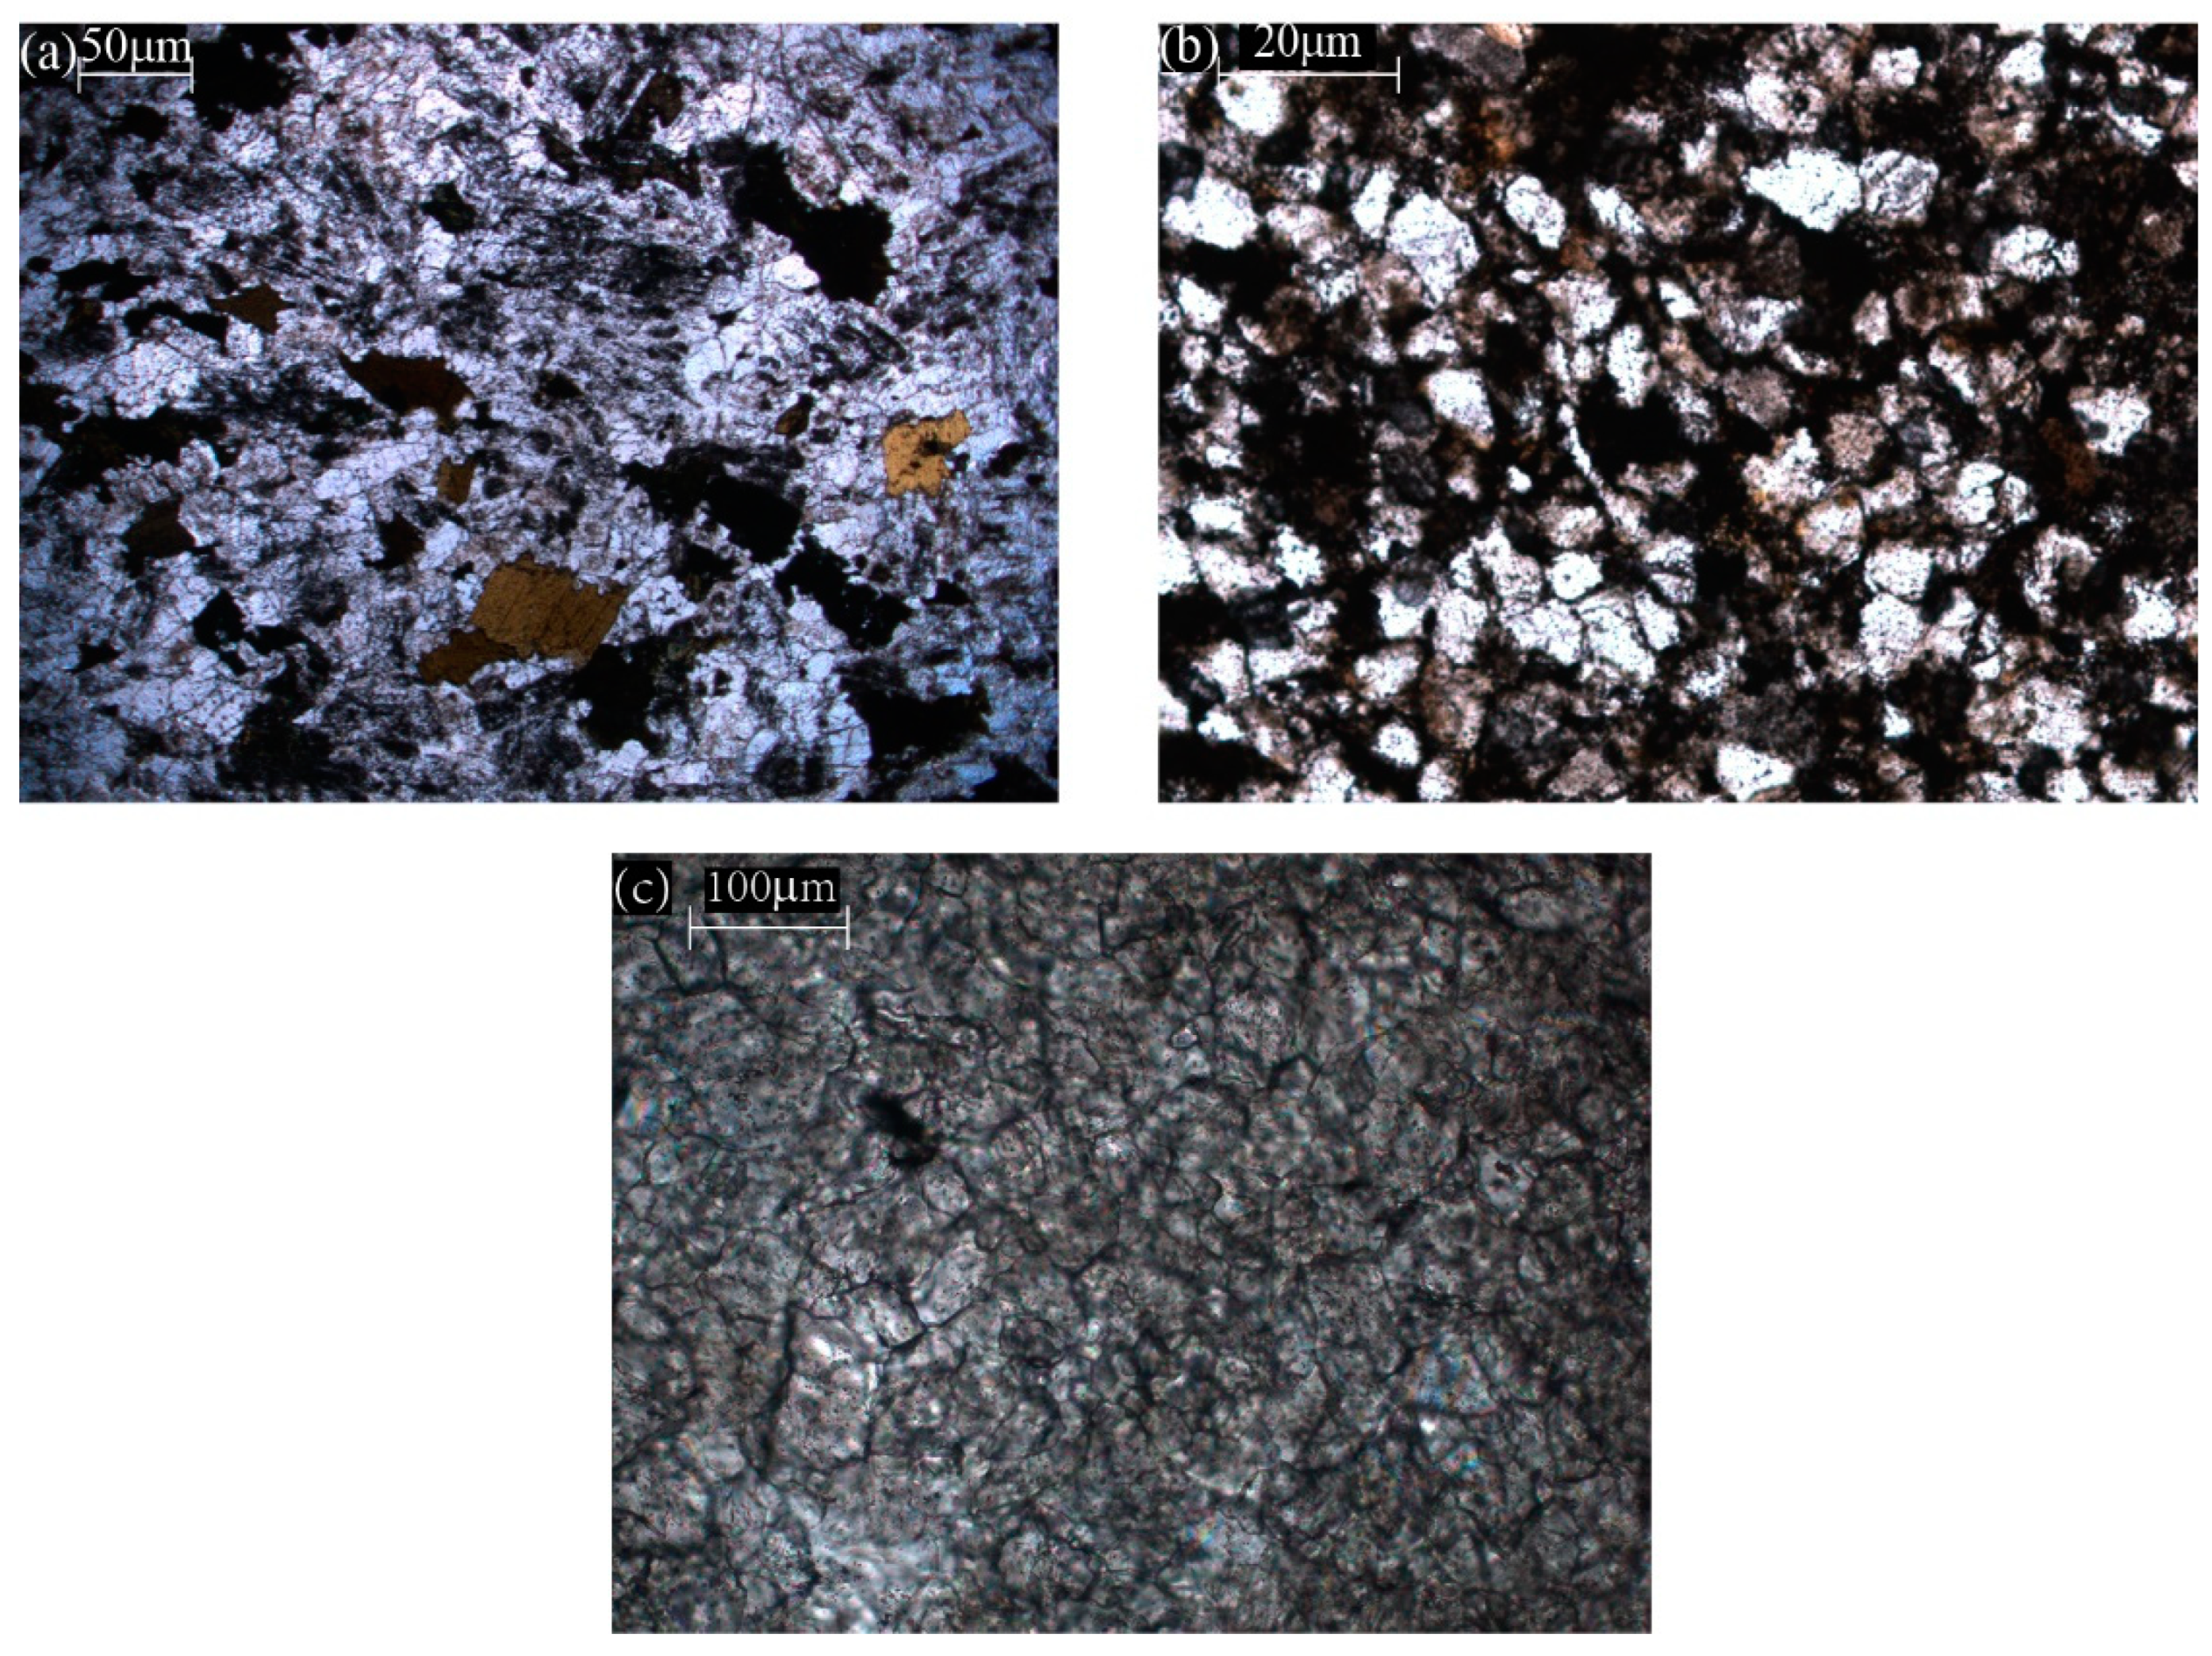
2.1. Materials

Injection-induced earthquakes mainly occur in sedimentary sandstone and limestone. Classic examples of sedimentary rock were collected as samples to infer how water injection affects fault stability. For comparison, we also performed the injection test in the granite sample in this study; granite is widely distributed in the Earth’s crust. The granite chiefly consists of plagioclase, potassium feldspar, quartz, amphibole, and magnetite. The plagioclase and potassium feldspar are in the shape of euhedral and semi-euhedral plate-columns, filled by the fine-grained quartz in allotriomorphic granular and magnetite in irregular shapes (Figure 1a). The sandstone mainly consists of isometric fine-grained quartz and feldspar, filled with a small amount of biotite and clay minerals at the edges and in intergranular spaces (Figure 1b). The limestone is primarily composed of calcite mixed with clay minerals to form the main structure of the rock (Figure 1c). The calcite particles are semi-euhedral, with pressure-dissolved seam lines in local areas. Rock permeability values measured by the pore pressure oscillation method [31] are listed in Table 1.
Cylindrical samples 20 mm in diameter and 40 mm in length were used. Each sample contained a saw-cut inclined 35° to the sample axis to simulate a fault, and the saw-cut surface was ground flat and then roughened with 200# abrasive. A borehole with a diameter of 1 mm was drilled in the upper half of the sample, reaching the position at 1 mm from the fault (blind borehole) (Figure 2a) or the fault plane (open borehole) (Figure 2b), to investigate the influence of rock permeability on injection-induced earthquakes.

2.2. Methods

Experiments were performed on bare rock surfaces using a high-pressure and high-temperature triaxial testing apparatus [32]. The samples were jacketed in a hot shrinkage pipe with a wall thickness of 1 mm in the test carried out at room temperature or in an annealed copper tube with a wall thickness of 0.35 mm in the test carried out at 100 °C (Figure 2c). A detailed description of the sample assembly is presented in the study of He et al. [32]. In the experiments, high-pressure gas was injected into the pressure vessel, forming a constant confining pressure (Pc). Axial deformation was applied with an electro-hydraulic servo-control system at 1 μm/s to ensure stable slip conditions for the sample.
The average overburden pressure gradient equals the lithostatic pressure gradient plus the fluid pressure gradient, which is 22.7 kPa/m [33]. Injection-induced earthquakes usually occur at the shallow sedimentary fault, typically at 3–5 km depths [8,13,15,16,34]. The lithostatic pressure, equaling the overburden pressure gradient minus the hydraulic pressure gradient, is around 50 MPa at this depth, so we ran experiments at 1 μm/s initial loading rate and 50 MPa confining pressure (Pc) in this study (Table 2). A preset pore pressure (Pp = 1 MPa or 15 MPa) was injected into the sample when the fault reached the steady-state friction.
In the applications associated with unconventional oil/gas resource development, pressurized water may be injected into a position connecting to nearby pre-existing faults or separated from nearby faults. Considering the difference between these situations, we performed the injection tests in blind and open borehole samples (Figure 2a,b). In the blind borehole tests, the 15 MPa pressurized water was injected into the blind borehole, separated by a 1 mm rick from the fault plane, to investigate the impacts of rock permeability on injection-induced earthquakes. In the open borehole tests, 1 MPa and 15 MPa pressurized water were injected into the fault successively to investigate the influence of fault deformation on injection-induced earthquakes.
According to rate-and-state dependent friction (RSF) laws [35,36,37], friction slip stability is characterized by the velocity-dependent parameter a b = d μ s s / d l n ( v ) , where a and b are empirical constants in RSF laws, μ s s is the fault frictional strength in steady state, and v is sliding velocity. When a b > 0 , the steady-state friction coefficient increases with the slip velocity, called velocity-strengthening, and slip is accommodated by stable sliding. On the contrary, when a b < 0 , the friction coefficient decreases as the sliding velocity, called velocity-weakening, and the fault may experience dynamic instability, meeting the conditions for earthquake nucleation [35,37]. To test the velocity dependence of friction, we carried out velocity stepping tests in three faults at different loading conditions, including dry and wet samples with 1 MPa and 15 MPa pressurized water, by switching the loading rate between 1 μm/s and 0.2 μm/s.
Most experiments were carried out at room temperature. Given the critical roles of temperature on fault velocity-dependent properties, a limestone experiment was conducted at T = 100 °C for comparison. A thermocouple was used to regulate the test’s temperature at T = 100 °C (Figure 2c). Table 2 lists all experiments performed in this study.

2.3. Data Processing

The experiment recorded data at a sampling rate of 1 Hz using a 16-bit A/D converter connected to a digital interface. Due to the saw-cut sample assembly, the fault contact area decreased with slip. Thus, we corrected the axial stress for this geometric effect following He et al. [32]. The slip rate (R) was first calculated by the difference in displacement, then smoothed using the moving average method with a 10 s window. The apparent friction coefficient (μa) was calculated by taking the ratio of shear stress to effective normal stress (τ/σeff).
In the velocity step experiments, we used the (quasi) steady-state friction strength (μss) before and after each velocity step (v step) to determine the velocity dependence parameter, a b = μ s s / l n v 2 / v 1 = ( μ s s v 2 μ s s v 1 ) / l n v 2 / v 1 [36]. A detailed description of obtaining the velocity dependence parameter follows the study of Chen et al. [38].

3. Results

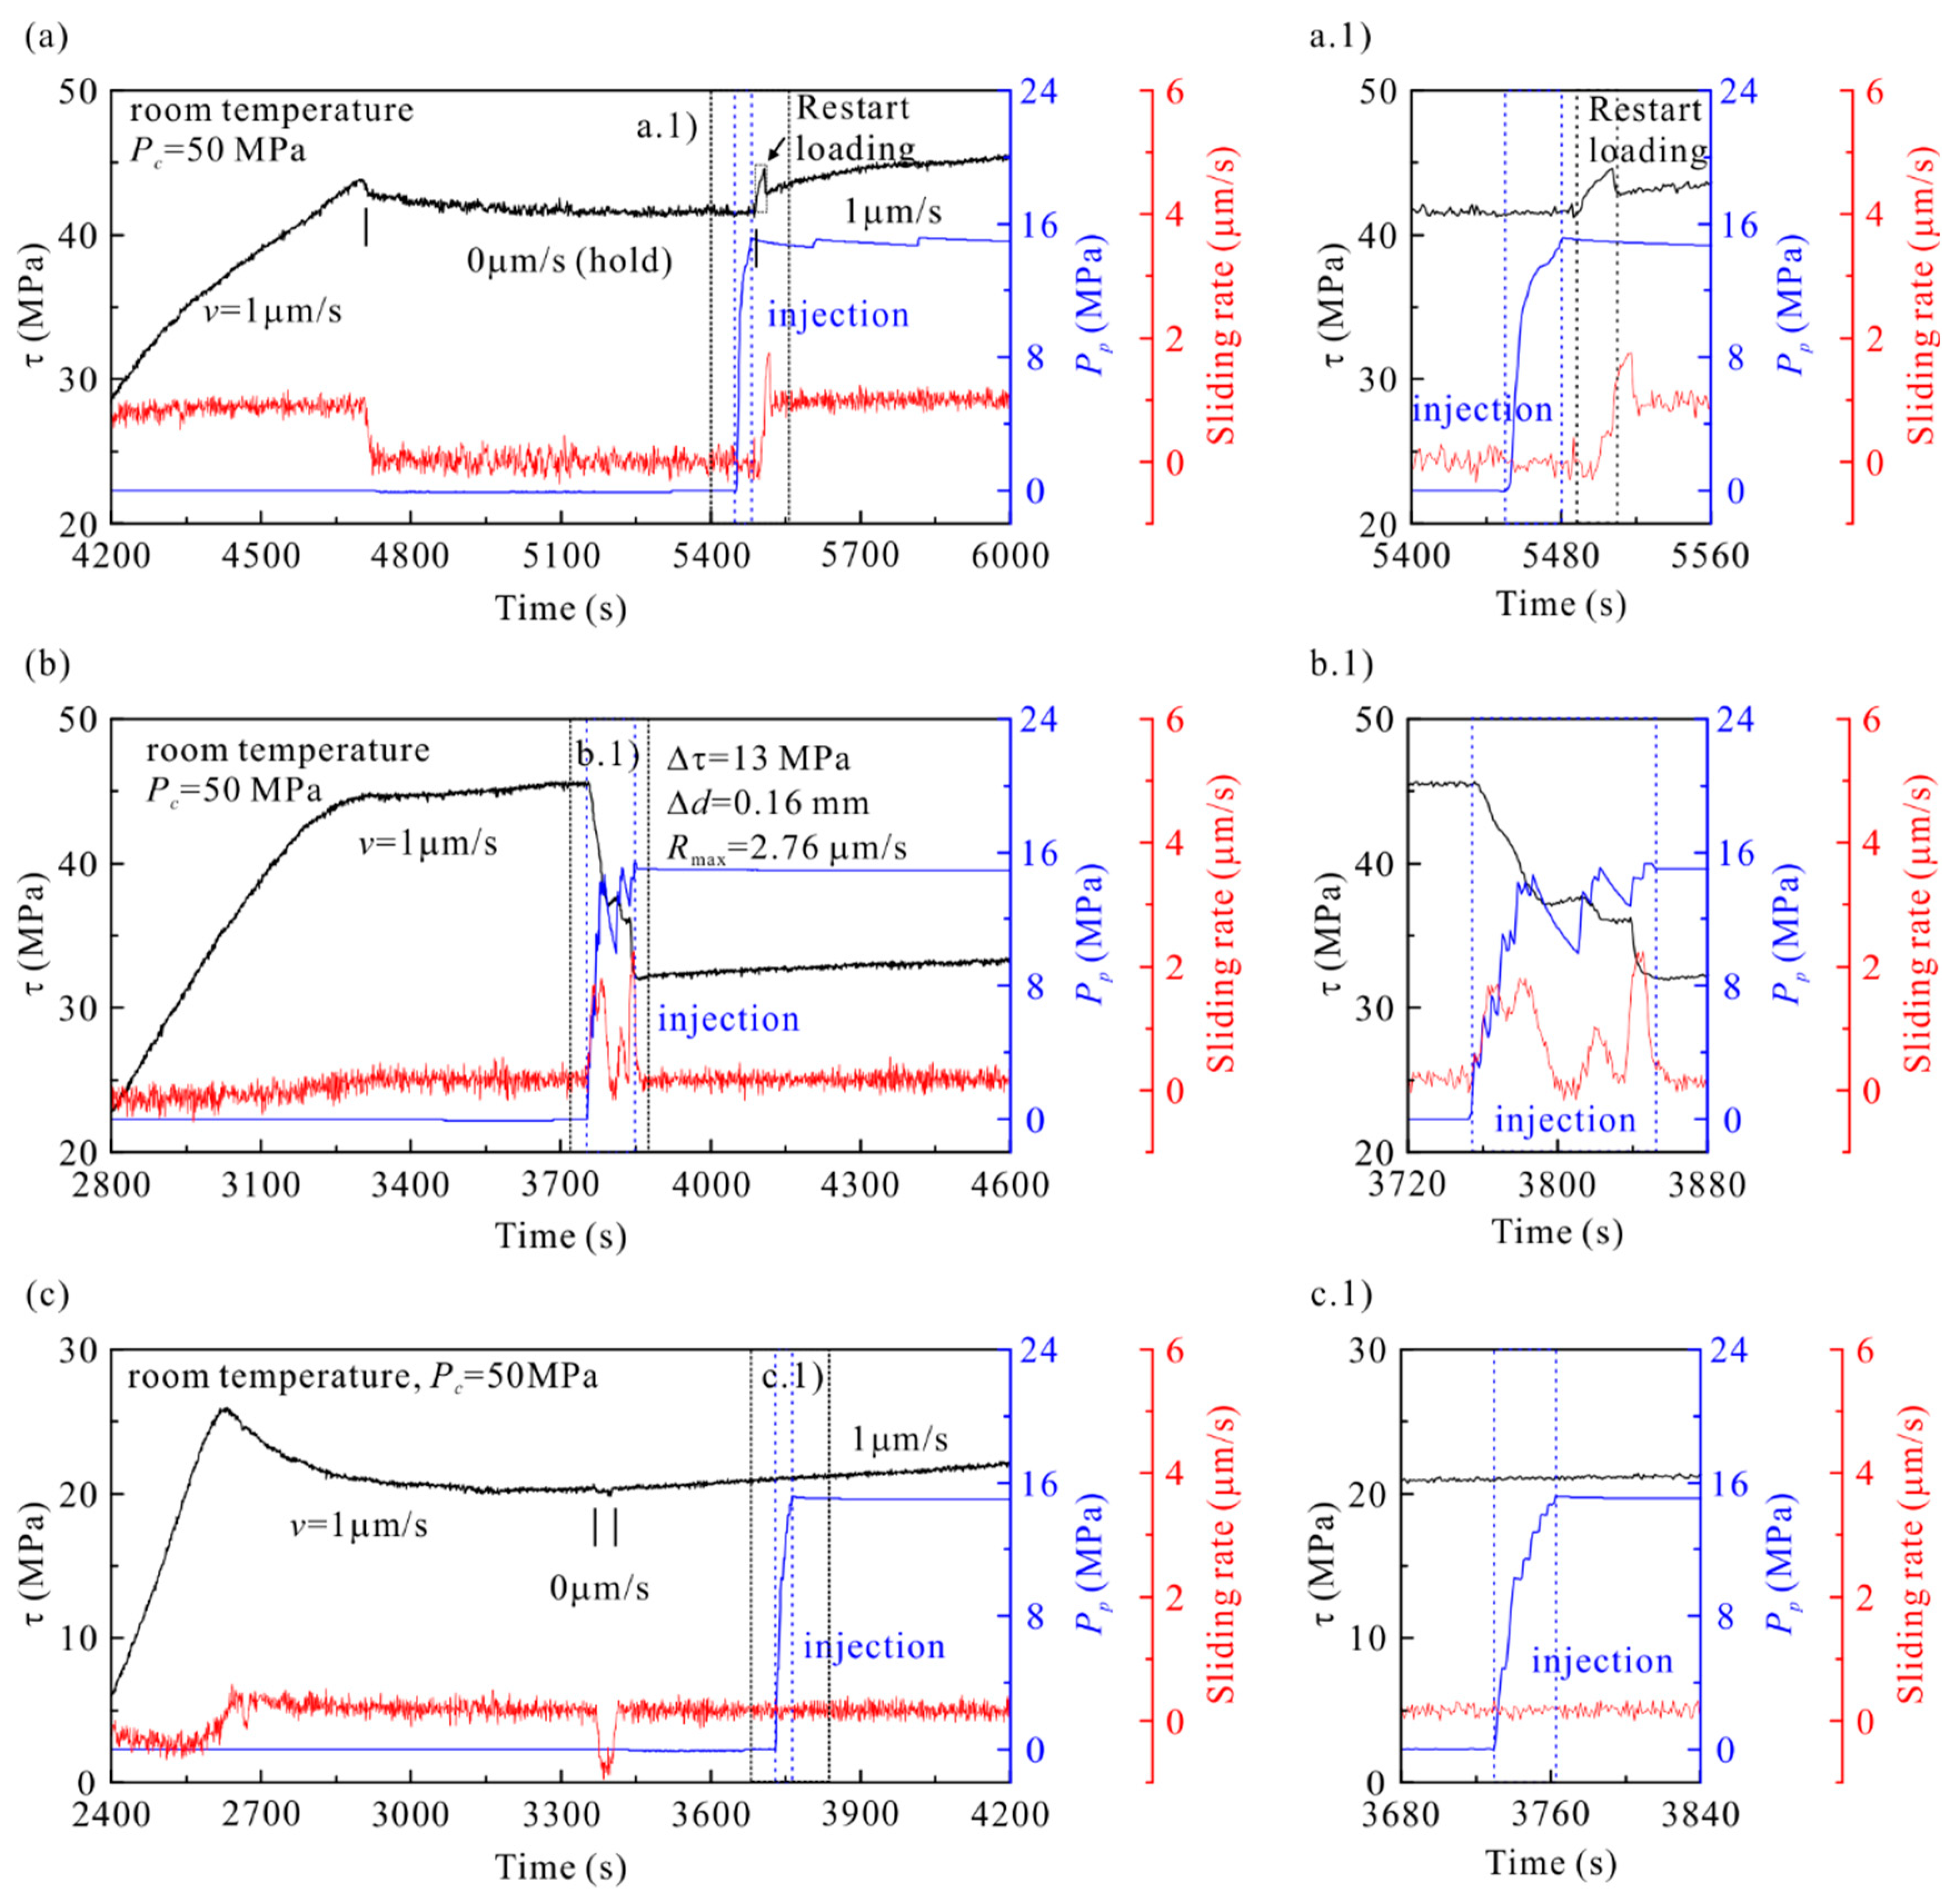
3.1. Pressurized Water Injection into the Vicinity of the Fault

Representative plots of shear stress and fault sliding rate versus time for the pressurized water (15 MPa) being injected into the vicinity of the faults are presented in Figure 3. All faults showed a rapid increase in shear stress first, followed by macroscopic yield and stable sliding behaviors. When the 15 MPa pressurized water was injected into the blind borehole of the samples, the frictional strength and fault sliding rate of granite and limestone faults barely changed (Figure 3a,c). Note that the variation observed in the shear stress of the granite fault at around 5500 s was due to the restart of fault loading, which occurred behind the finishing time of the water injection (Figure 3a). However, the shear stress of the sandstone fault decreased sharply, producing ~13 MPa stress drop and ~0.16 mm fault displacement within ~103 s (Figure 3b).
In contrast, the fault sliding rate (R) increased considerably during the injection, and the maximum slip rate was up to 2.76 μm/s (Figure 3b). Due to the high permeability, the injected water could diffuse to the sandstone fault quickly but could quickly dissipate in the matrix. Thus, the pore pressure varied during the injection, making the exact change in the sliding rate but the reversed variation in shear stress (Figure 3b).

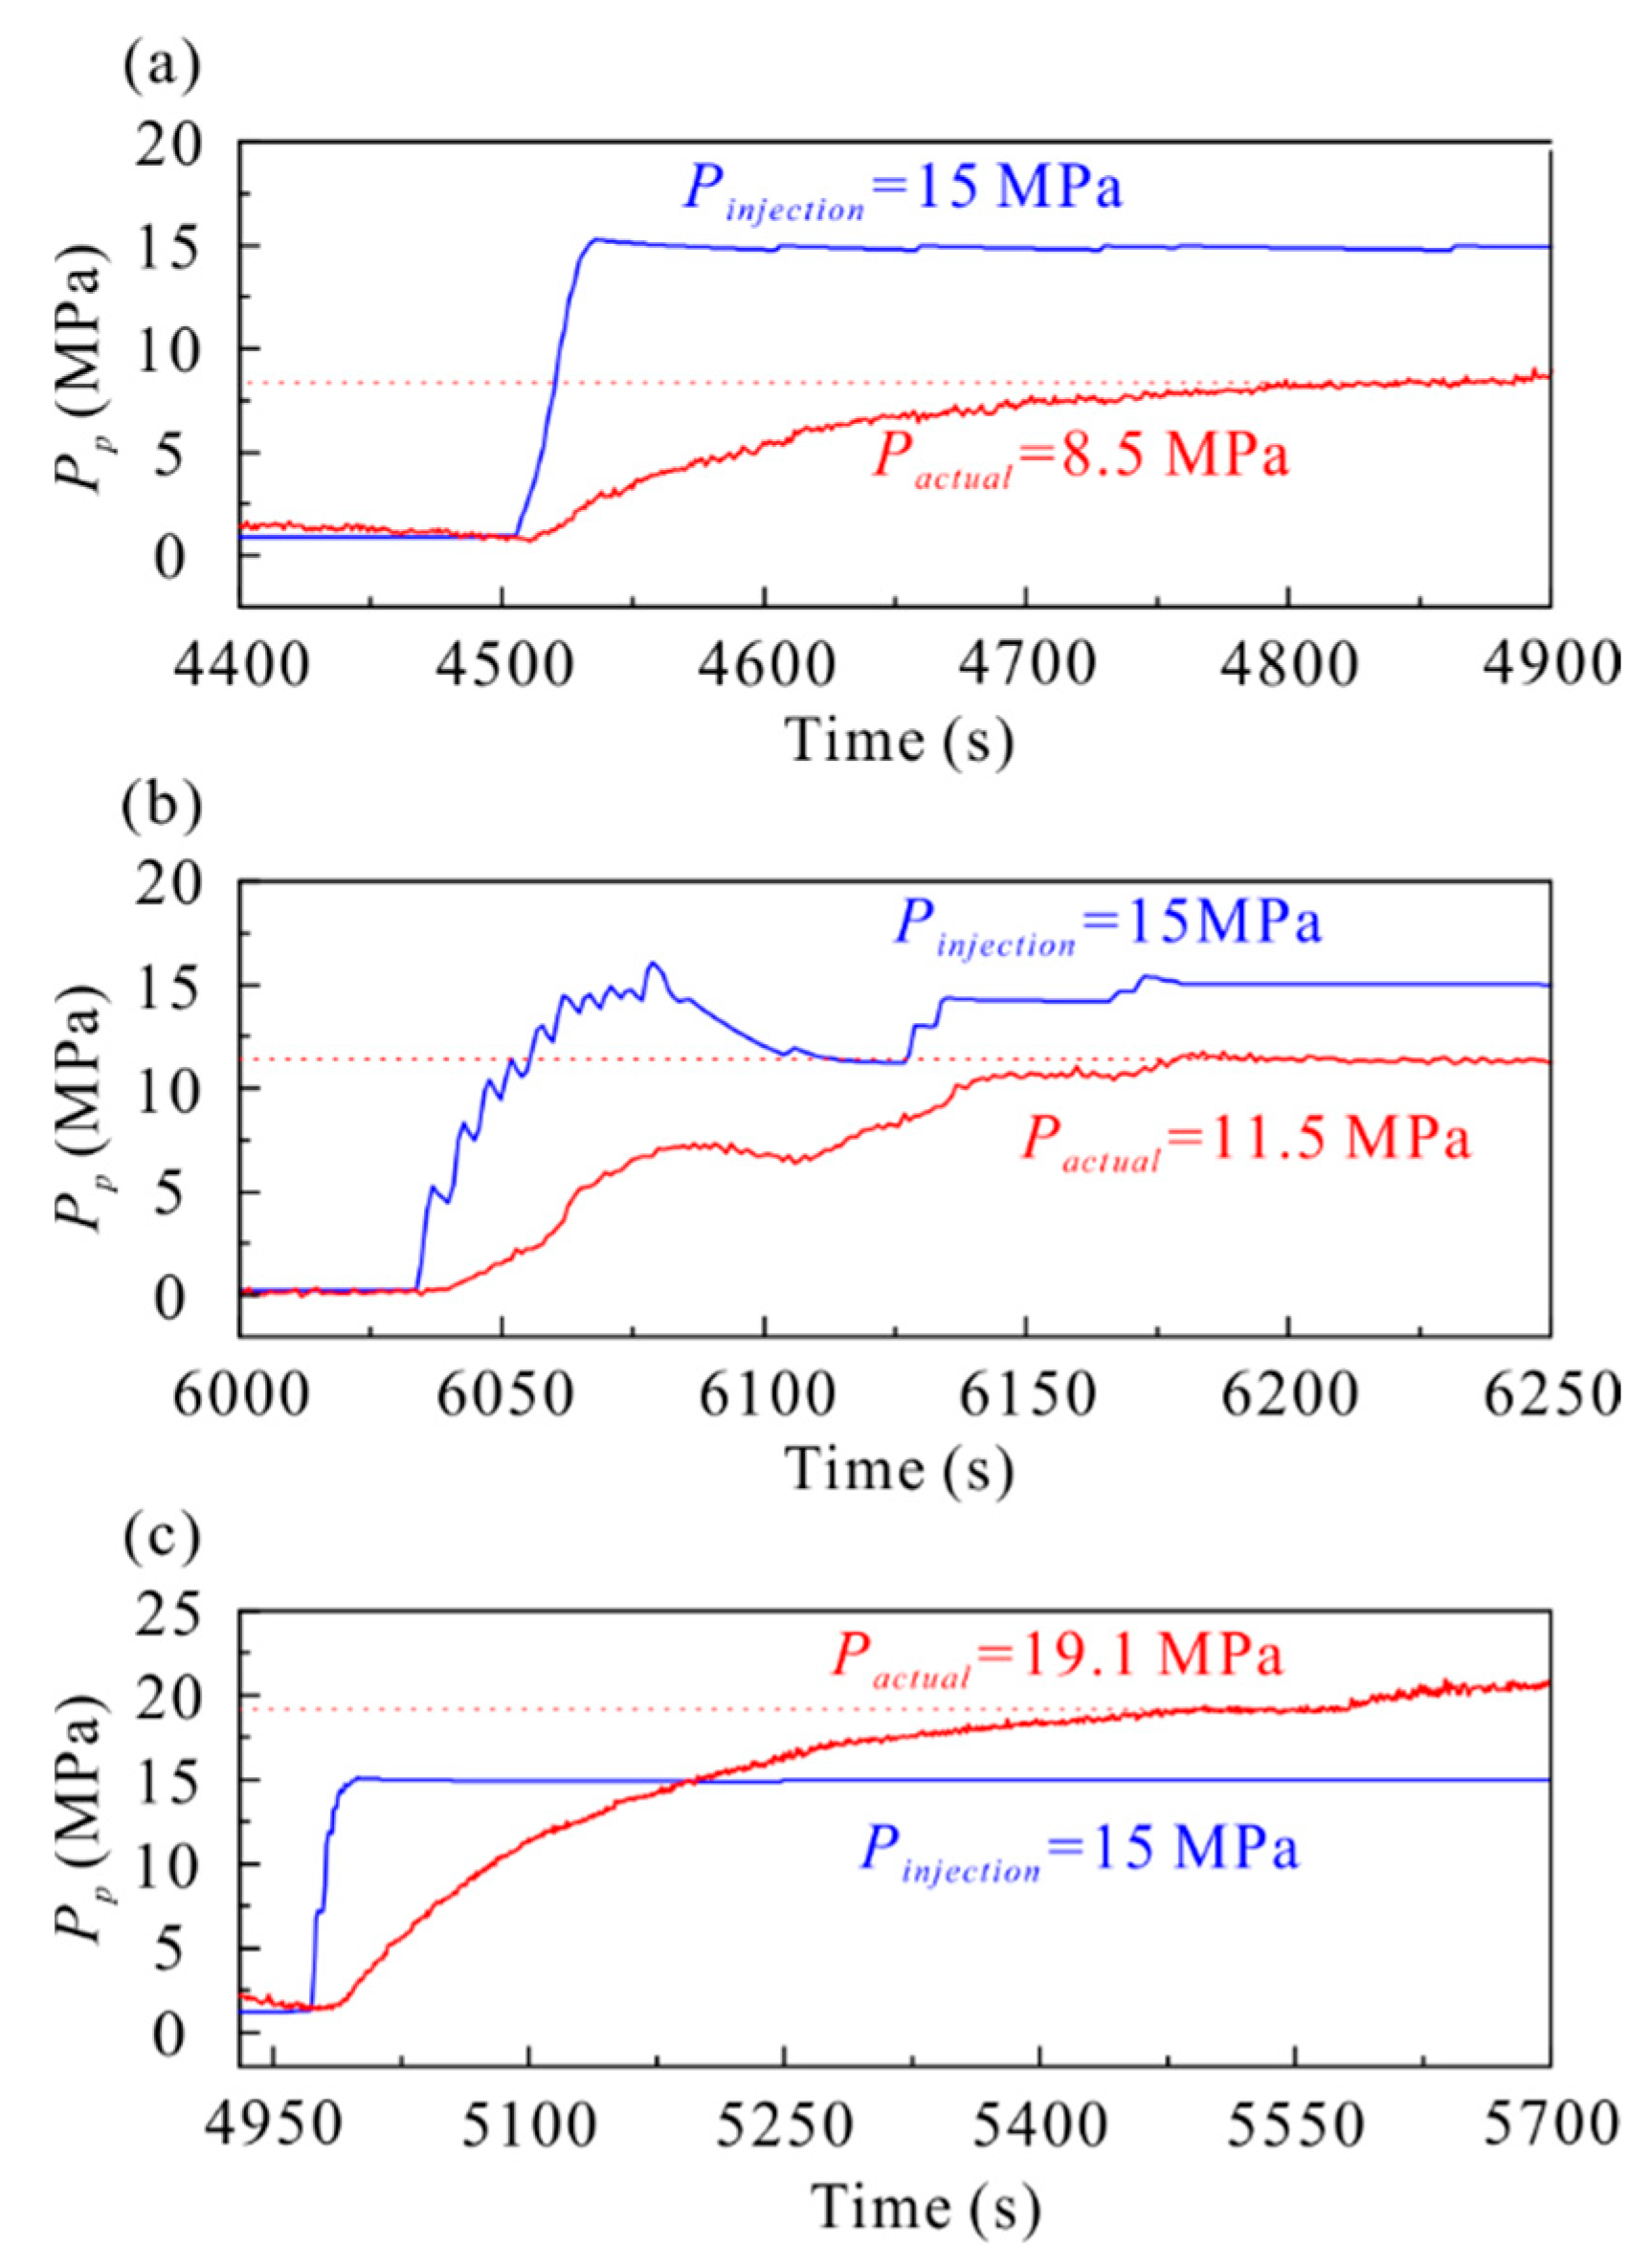
3.2. Pressurized Water Injection into the Fault Plane

Typical results for the pressurized water being injected into the fault planes are presented in Figure 4. For each experiment, we injected 1 MPa and 15 MPa pressurized water into the borehole of the samples and performed the velocity stepping test in the dry and wet samples with 1 MPa and 15 MPa pressurized water. Overall, all samples showed stable slip at room temperature, and the fault sliding rate decreased with the decreasing loading rate. When 1 MPa pressurized water was injected into the faults (~2% of the confining pressure), three faults showed slight changes both in the shear stress and fault sliding rate (Figure 4(a1–c1)), indicating that low-pressure injection had negligible effects on fault stress and fault slip. However, the 15 MPa pressurized water injection (~30% of the confining pressure) made the shear stresses decline significantly, and the fault sliding rate increased considerably (Figure 4(a2–c2)), suggesting that the injection induced the fault reactivation.
As the fault reactivation induced by water injection, three faults showed significant differences in the shape of shear stress decreasing, stress drop, slip duration, and fault displacement (Figure 4). The shear stress of granite and limestone faults decreased like an exponential curve. However, the shear stress of the sandstone fault decreased like a quasi-linear curve as a whole and showed synchronous fluctuation as the pore pressure changed during the injection. When the faults reached a new steady state, a ~6.9 MPa stress drop, ~290 s slip duration, and ~0.28 mm fault displacement were observed in the granite fault (Figure 4(a,a2), Table 3). For the sandstone fault, these parameters were ~10.4 MPa, ~145 s, and 0.19 mm, respectively (Figure 4(b,b2), Table 3). They were ~18 MPa, ~490 s, and ~0.57 mm, respectively, in the limestone fault (Figure 4(c,c2), Table 3). Note that the permeability of sandstone is much higher than granite and limestone (Table 1), so the injected fluid could more easily dissipate in the matrix, which means that the sandstone fault required more injection time to form the 15 MPa pore pressure. However, the time for the fault to reach a new steady state in the sandstone experiment was less than that in the other two samples, suggesting that the shear stress of the sandstone fault decreased faster than that of the granite and limestone faults. In addition to the mechanics data, the fault sliding rate showed apparent differences in the three faults. The sliding rate of the granite and limestone faults increased monotonously, but the sliding rate of the sandstone faults varied with the injection pressure fluctuation. The maximum sliding rate of the sandstone fault was 2.19 μm/s, significantly exceeding that of the two other faults, which were 1.57 μm/s and 1.7 μm/s, respectively (Figure 4). When the injection stopped, the fault sliding rate slowed again, showing different behaviors in the three faults, too. Like the shear stress, the sliding rate of granite and limestone faults decreased like an exponential curve as a whole (Figure 4a,c) and showed oscillatory behavior during the decreasing process (Figure 4(a2,c2)); but in the sandstone faults, the sliding rate varied with the fluctuation in the pore pressure and changed nearly linearly at the decreasing and increasing stages (Figure 4b). When the fault reached a new steady state, the sudden decrease in loading velocity in the velocity stepping test produced an observed decrease in sliding rate in the three faults.
To investigate how water injection affects the frictional strength, we calculated the apparent friction coefficient (μa) by taking the ratio of shear stress to effective normal stress (τ/σeff) (Figure 5, Table 3). The differences in apparent friction coefficient (μa) between dry and wet samples with 1 MPa pressurized water were less than 0.01 in three faults, suggesting that the injection hardly affected the fault friction coefficients. However, when the 15 MPa pressurized water injection started, the apparent friction coefficients increased sharply, in contrast to the 1 MPa pressurized water injection. Furthermore, when the fault reached the steady state, the apparent friction coefficients of the granite and sandstone faults were larger than that in 1 MPa pressurized water injection, and the differences were 0.06 and 0.03. However, the apparent friction coefficient of the limestone fault was smaller than that in 1 MPa pressurized water injection, and the difference was −0.04 (Figure 5).
In summary, when 15 MPa pressurized water was injected, three faults exhibited noticeable differences in shear stress reduction, stress drop, and variation in apparent friction coefficient, suggesting that the actual pore pressure on the faults may not be equal to the injection pressure and show differences in three samples. To evaluate this difference, we took the apparent friction coefficient in 1 MPa pressurized water as the friction coefficient of the fault and then put it into the effective stress law to calculate the actual pore pressure on the fault. The actual pore pressure on the granite fault was 8.5 MPa, significantly lower than the injection pressure. It was about 11.5 MPa on the sandstone fault, close to the injection pressure. The actual pore pressure on the limestone fault was about 19.1 MPa, much higher than the injection pressure (Figure 6, Table 3). The stress reduction caused by water injection was proportional to the actual pore pressure on the faults.

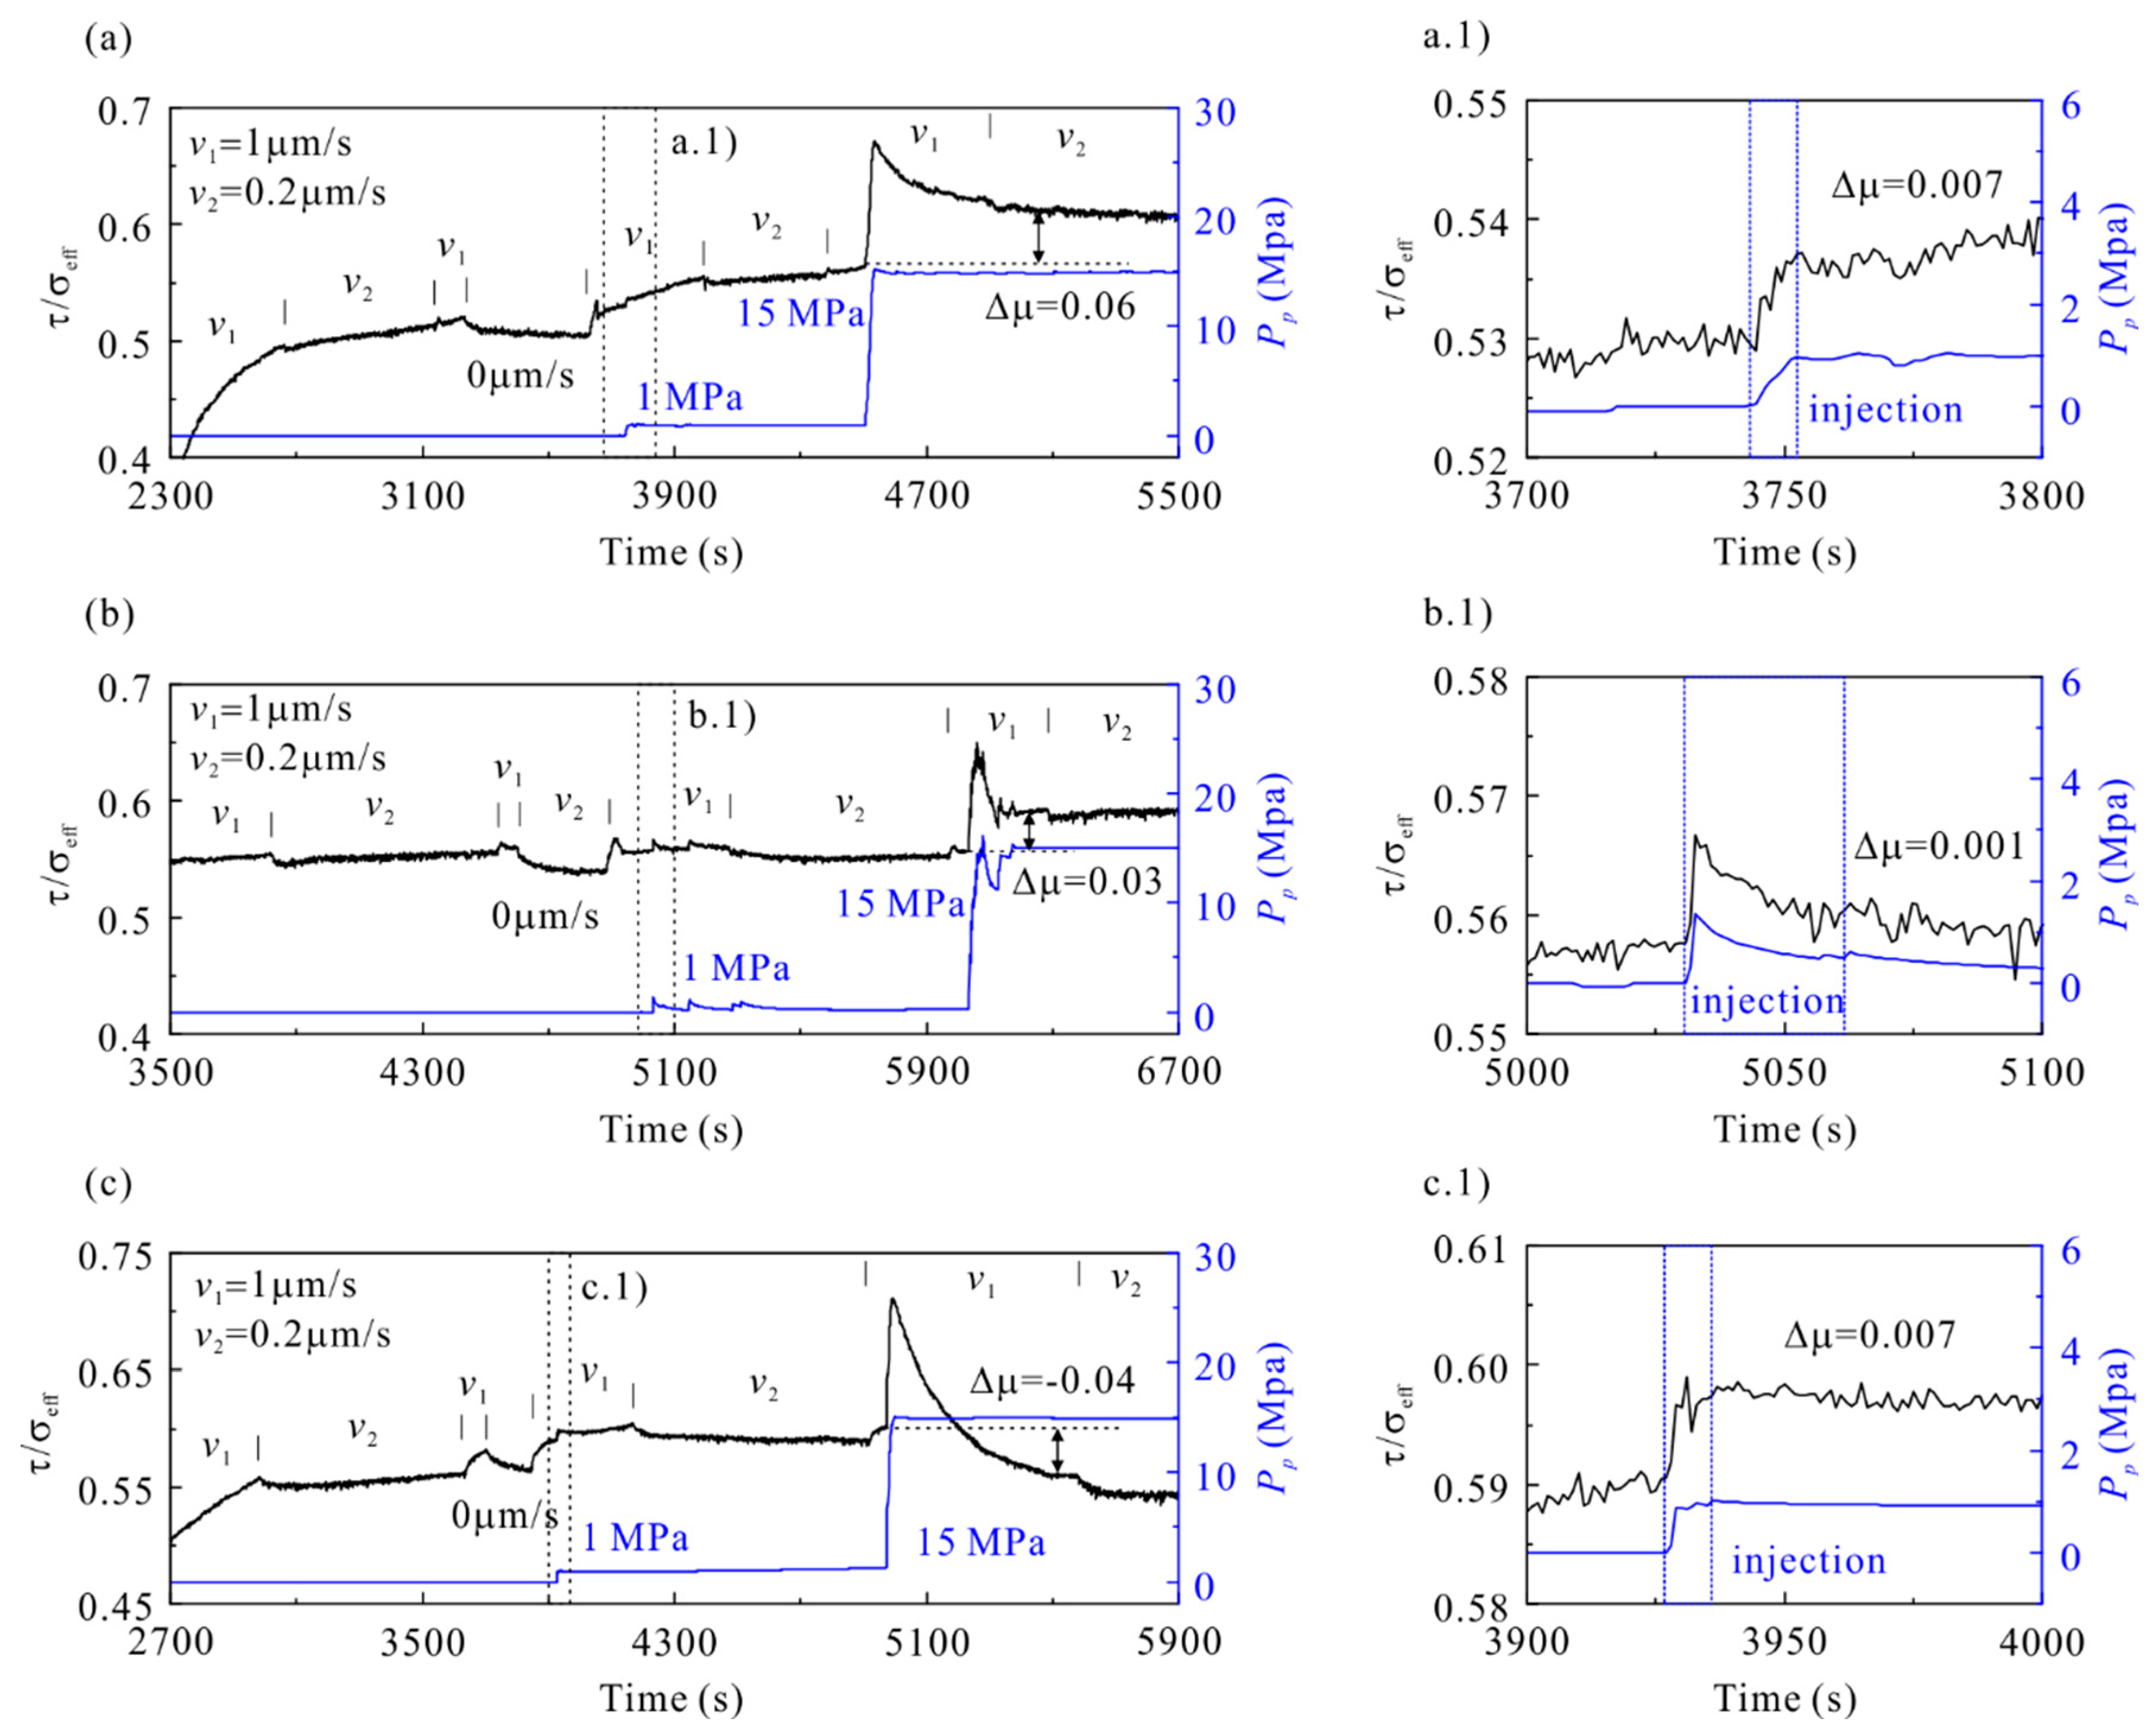
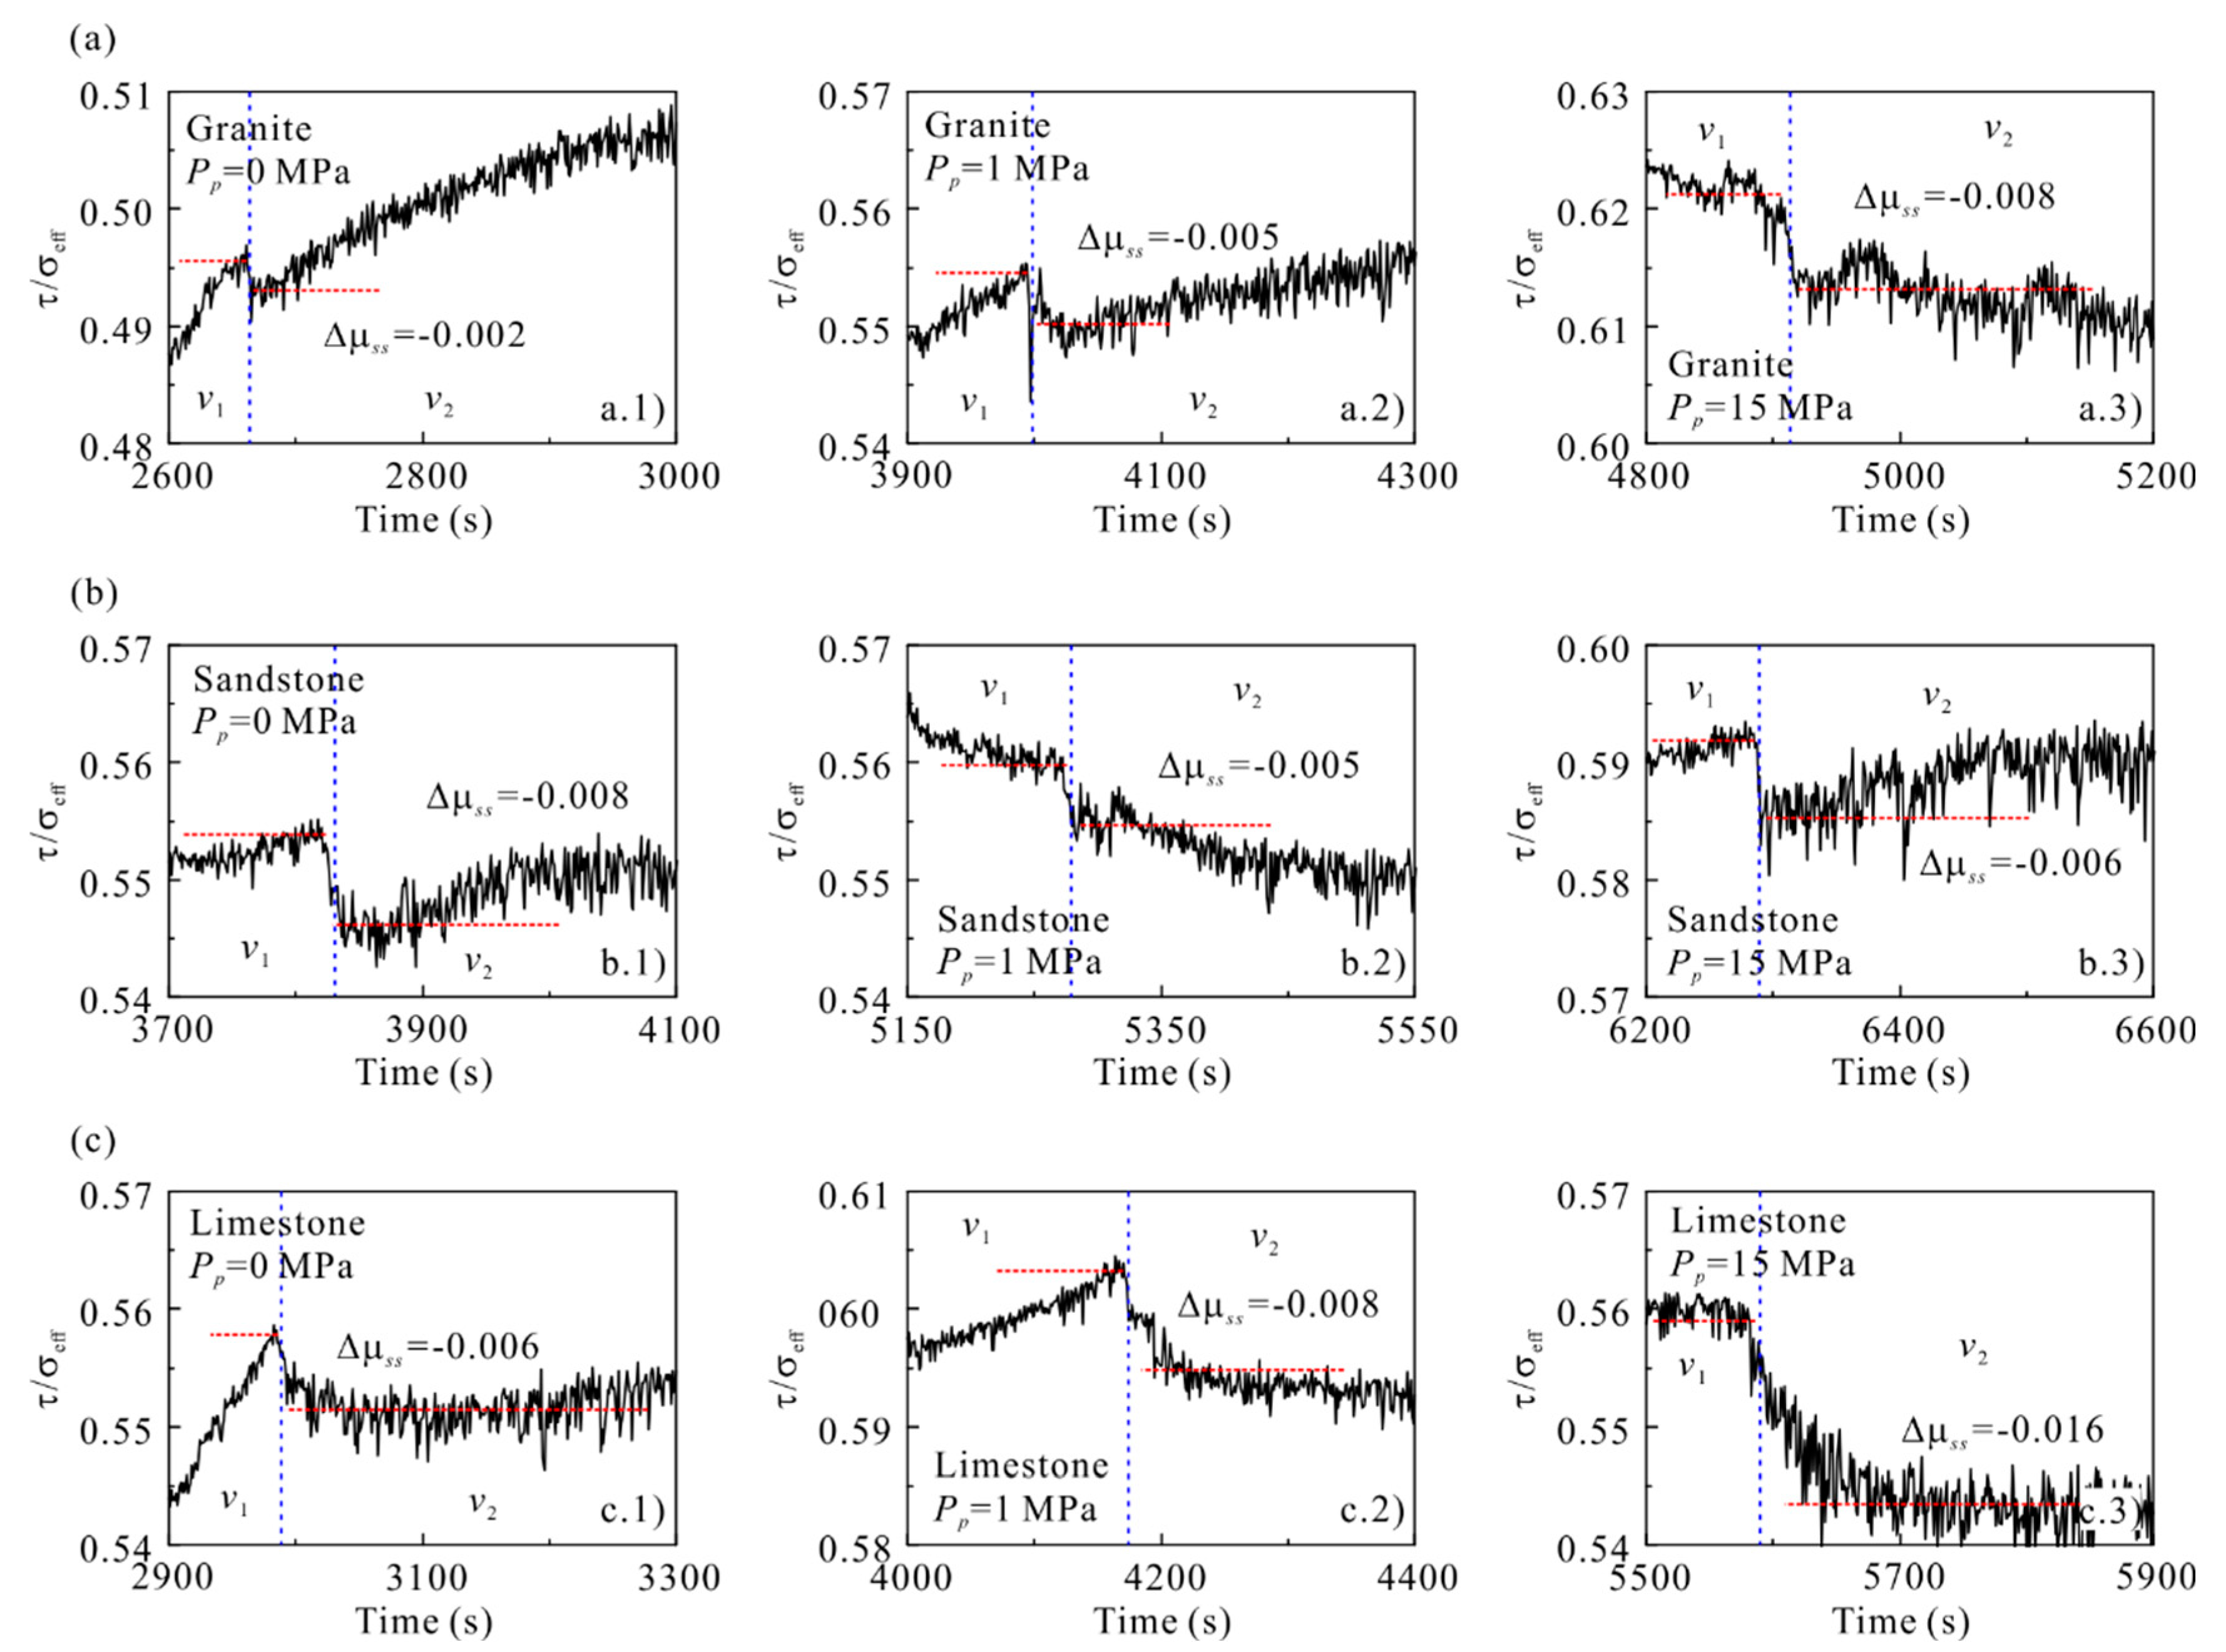
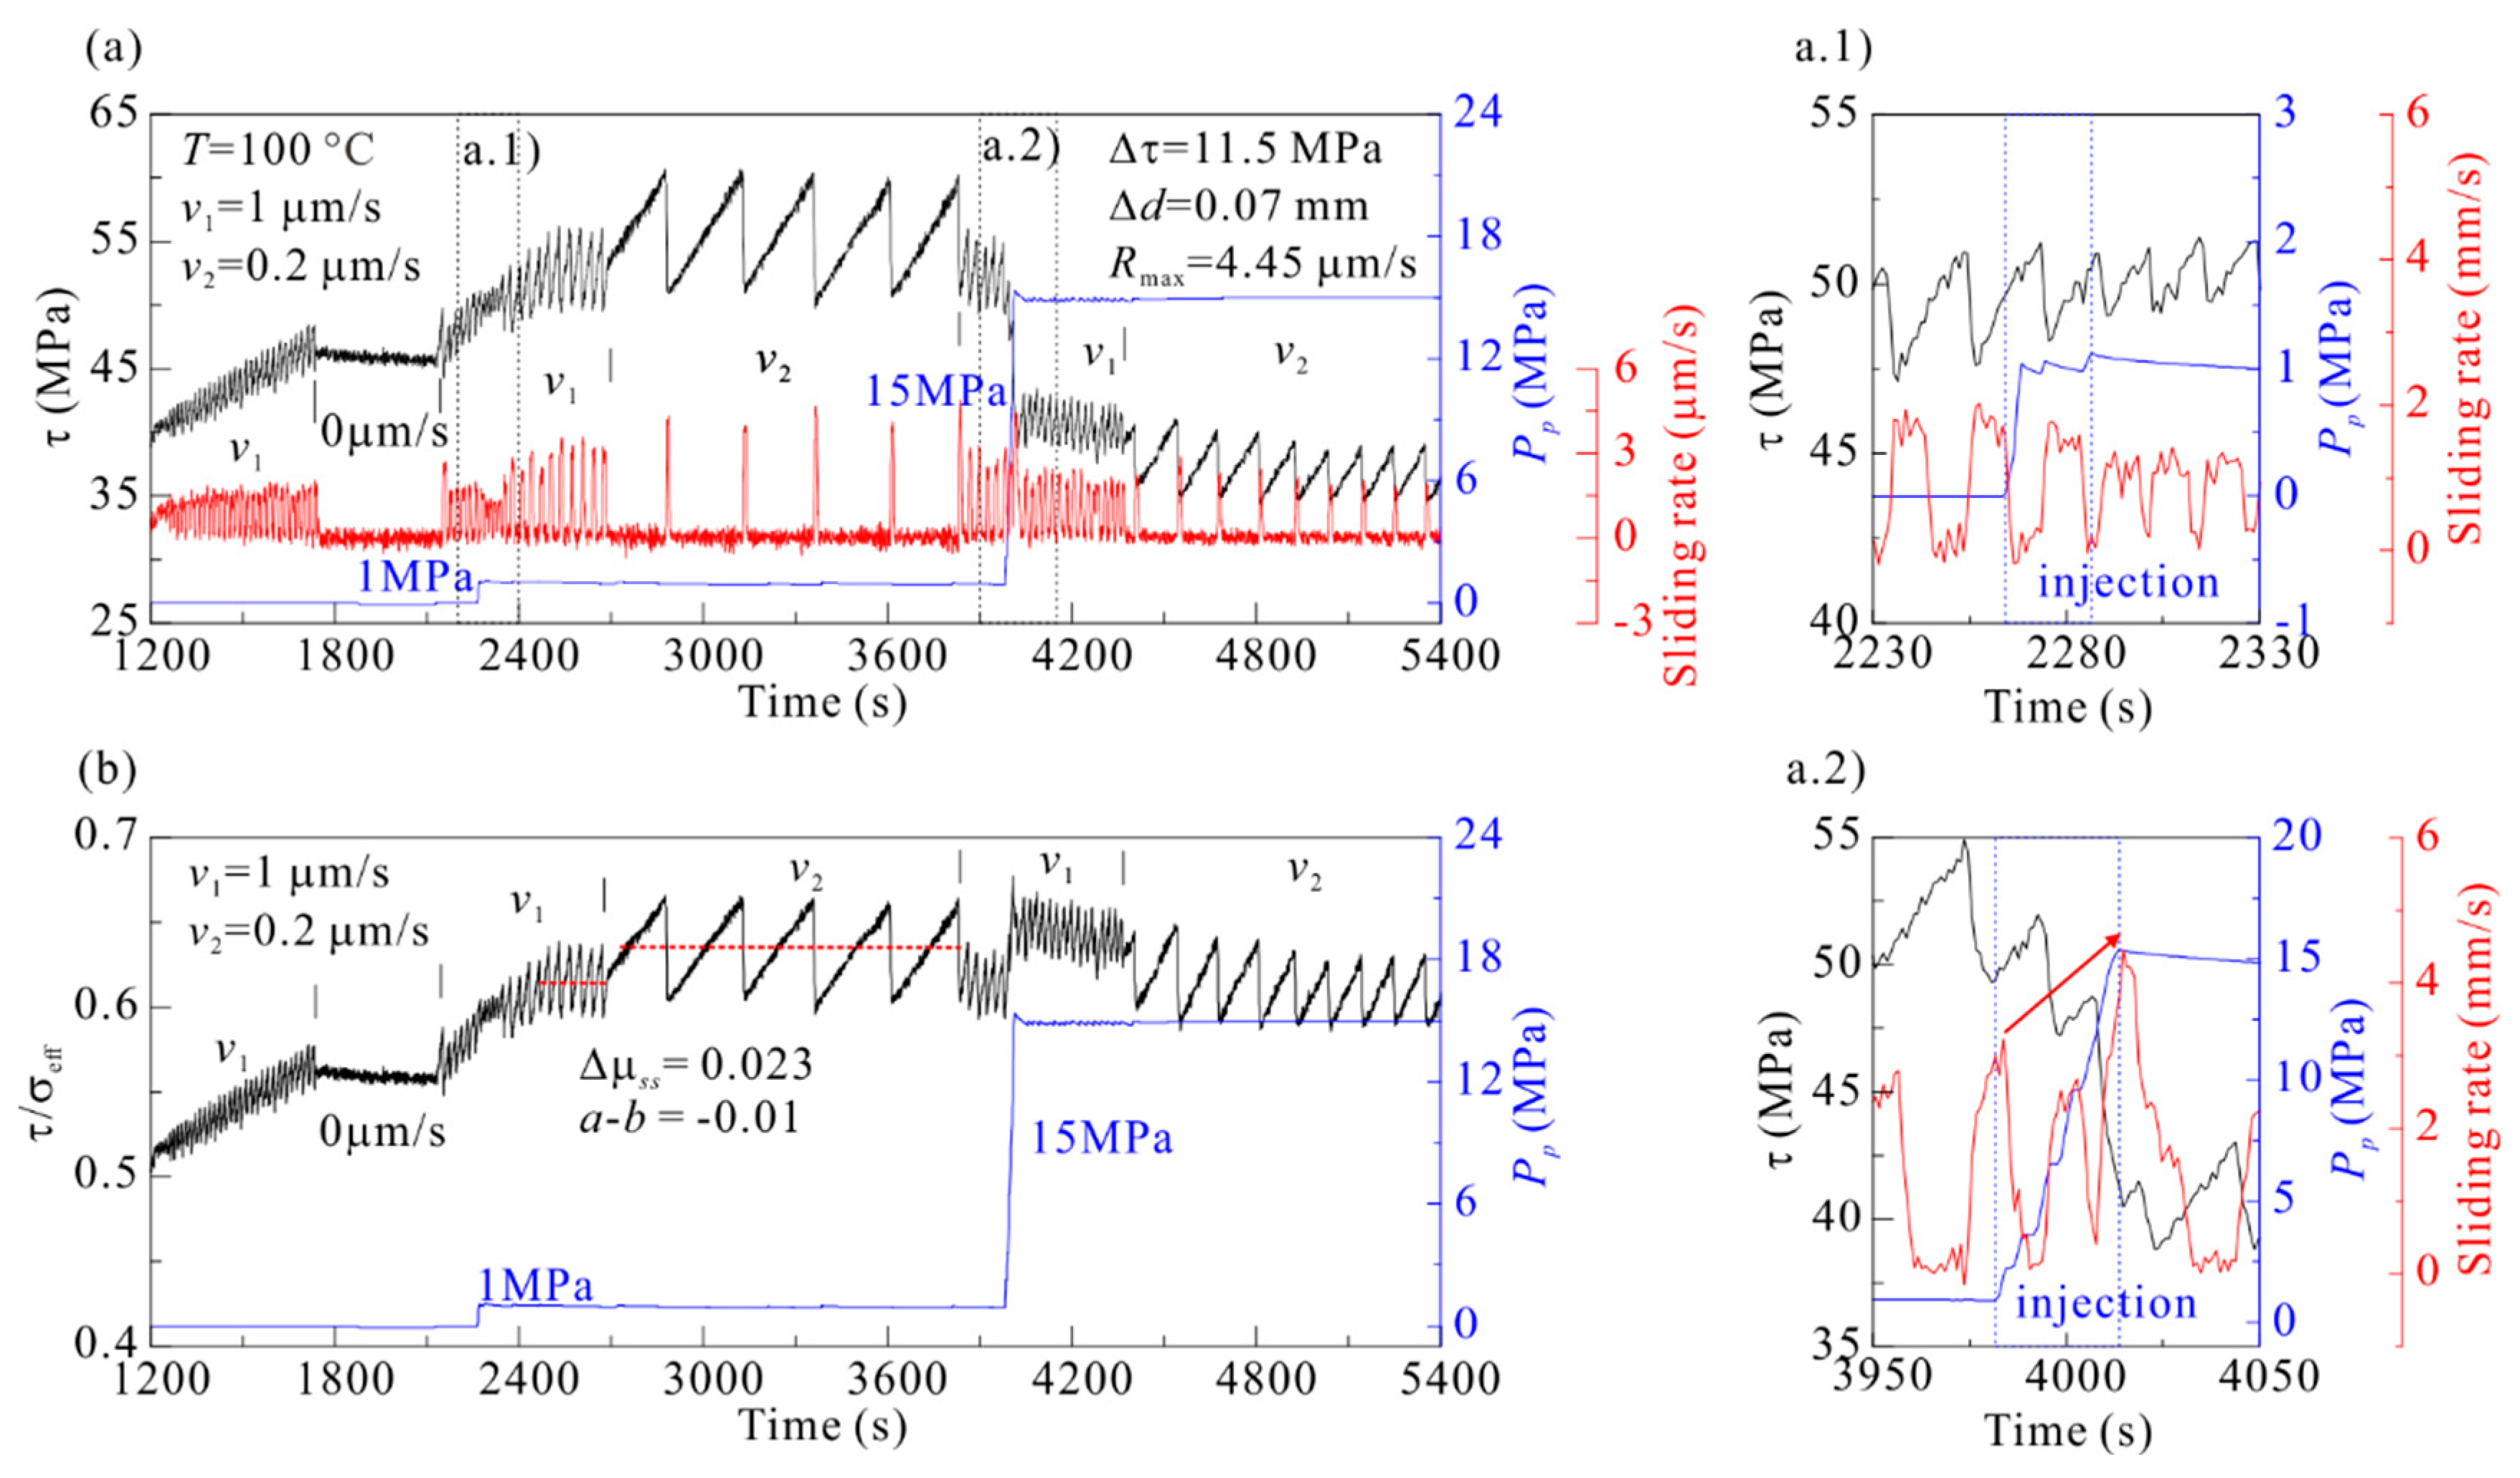
3.3. The Velocity Stepping Experiments

Representative velocity stepping data obtained from the experiments are shown in Figure 7 (see also Table 3). Before the injection, the friction coefficient of three faults decreased as the loading rate decreased from 1 μm/s to 0.2 μm/s, suggesting the faults were characterized by velocity-strengthening at room temperature, that is, a b > 0 (see Table 3). When 1 MPa and 15 MPa pressurized water were injected into the fault, the friction coefficient of the three faults decreased with the decreasing loading rate, suggesting that the water injection and injection pressure change did not alter the faults’ velocity-dependent properties.
The water injection and velocity stepping tests were also performed on the limestone fault at 100 °C for comparison. The result suggests that the limestone fault showed stick-slip (Figure 8a), and the frictional strength and stress drop increased with the decreasing loading rate (Figure 8b), that is a b = 0.01 < 0 , indicating that the fault was characterized by noticeable velocity weakening at 100 °C. Similarly to the test at room temperature, the injection of 1 MPa pressurized water hardly modified the fault shear stress and sliding rate (Figure 8(a1)). However, the 15 MPa pressurized water injection decreased the shear stress sharply and increased the sliding rate significantly (Figure 8(a2)). During the fault slip, the maximum sliding rate was 4.45 μm/s, greatly exceeding the 1.7 μm/s in the room temperature test. A stress drop with ~11.5 MPa was observed when the fault reached the new steady state. The sliding displacement and time were ~0.07 mm and ~6 s, respectively. The decreasing rate of the shear stress was higher than that at room temperature, showing a sudden instability (Figure 8).

4. Discussion and Conclusions

4.1. Influence of Rock Permeability

Recently, it has been suggested that pore pressure increase plays a vital role in injection-induced earthquakes when a fluid pathway to nearby pre-existing faults is available, and the poroelastic stressing plays a dominant role in the case of large distance injection or injection without a hydraulic pathway to the faults [1,2,34]. When the pressurized water is injected into the vicinity of the fault, pressurized water is separated from the fault plane, so poroelastic stressing may play a dominant role before the diffusion of pore pressure has begun to take effect. However, the cumulative volume of the pressurized water was tiny due to the small injection hole in the experiments; thereby, the change in the solid matrix stresses caused by injection was slight, suggesting the effect of poroelastic stressing can be ignored. For the mechanism of pore pressure to increase, the pressurized water must diffuse to the fault plane to affect the effective stress of the fault. Thus, the permeability of the rock is the most critical factor affecting injection-induced earthquakes. When pressurized water is injected, the diffusion time of pore water in rock is controlled by compressibility, permeability, and porosity [39]. The permeability of granite and limestone in this experiment were 2.25 × 10⁻¹⁹ m2 and 3.88 × 10⁻²² m2, two orders of magnitude smaller than that of the sandstone, 2.66 × 10⁻¹⁷ m2 (Table 1). Due to the lower permeability, the pressurized water was sealed in the granite and limestone injection hole. Thus, no changes were observed in fault shear stress and sliding rate (Figure 3a,c), suggesting that injection does not affect the fault slip behaviors. The results of the granite experiment are consistent with those of Blanpied and others [40], demonstrating that pressurized water injection into the vicinity of the fault has little effect on fault stress.
On the contrary, pressurized water can quickly penetrate the sandstone to the fault plane due to the higher permeability, so the injection caused a decrease in the shear stress and increased the sliding rate (Figure 3b). The experimental results showed that whether the pressurized water acting near the fault zone can induce fault sliding is mainly controlled by the permeability. Therefore, pressurized water injection can induce earthquakes on nearby faults in an area with high-permeability rocks, such as sandstone [41,42]. However, pressurized water injection cannot affect the fault stress in a short time in areas with low-permeability rocks, such as granite and limestone. Nevertheless, if the injection lasts long, it may also affect the fault stress and induce earthquakes.

4.2. Influence of Fault Deformation

When pressurized water is injected directly into the fault, the diffusion of water is affected not only by the rock permeability but also by the contact state and deformation of the fault plane. The actual contact area of the fault plane is controlled by the contact area of asperities, which is related to the mineral composition of the rock [43]. The pressurized water can only enter the non-contact area of asperities.
The granite in this experiment is composed of high-strength minerals such as quartz and feldspar, having more asperities and a large actual contact area under particular normal stress. With this, the volume of the water entering the fault is relatively small, and the actual pore pressure may be much less than the injection pressure. The sandstone is composed of quartz and feldspar, having an asperity distribution similar to that of granite. However, the high permeability facilitates fluid diffusion, and the actual pore pressure is close to the injection pressure. Limestone is composed of calcite, having a few asperities and small actual contact areas under the same normal stress. Thus, pressurized water can diffuse into most parts of the fault plane. Also, because of the plastic blunting effect of calcite [44], the pressurized water is easily sealed on the fault plane to form local high pore pressure zones, making the actual pore pressure much higher than the injection pressure.
Because 1 MPa is far below the normal stress, larger than 50 MPa, the difference in actual pore pressure caused by injection was very small, resulting in a slight change in fault slip. In contrast, the 15 MPa pressurized water injection significantly reduced the effective normal stress of the fault and induced fault sliding. Moreover, three faults showed apparent differences in the permeability, fault contact state, and deformation property, causing apparent differences in the actual pore pressure, so noticeable differences were observed in several parameters, such as stress drop, sliding duration, and displacement.
The experimental results suggest that it is difficult for low-pressure injection to affect the fault stress significantly, but the higher fluid pressure may reduce the inherent strength of the fault, thereby inducing fault sliding. When fault reactivation is induced, rock permeability and fault deformation properties control the fault sliding rate, duration, and stress drop. High permeability and strong, brittle rock are conducive to the rapid sliding of a fault.

4.3. Control Effect of the Velocity-Dependence Parameter

The velocity-dependence parameter a b in rate-and-state friction law controls the fault frictional behavior for constant normal stress. Three faults exhibited velocity-strengthening at room temperature, both in dry and wet samples with different injection pressures, that is, a b > 0 (see Table 3), indicating that the faults were not under the necessary condition for unstable slip. Thus, the stress drop and the accelerated sliding caused by the injection of 15 MPa pressurized water were direct responses of frictional strength to the reduction in the effective normal stress. Furthermore, the sliding behaviors were affected by factors such as injection pressure, injection rate, rock permeability, fault deformation property, etc. In the experiments, the stress drop was proportional to the actual pore pressure in the fault, which means that the magnitude of the induced earthquake was related to the injection parameters, such as injection volume and rate, in agreement with previous numerical simulations [45] and those recorded in the field cases [6,46].
Previous researches have shown that temperature can affect the velocity-dependent property of carbonate rocks [38,47,48]. The limestone fault exhibited velocity-weakening and regular stick-slip at 100 °C, in line with previous experiments [38,47]. Based on the experiments of normal stress perturbation on fault sliding instability [49], when the shear stress of a velocity-weakening fault is close to the frictional strength, a stress perturbation above 0.03 MPa can induce the critically stressed fault dynamic slip. However, the injection of 1 MPa pressurized water did not cause a significant change in shear stress in this experiment, partly attributable to the low criticality of fault stress during injection. When the injection pressure increased from 1 MPa to 15 MPa, it was large enough to ignore the effect of criticality of the fault stress. Consequently, the injection immediately induced a stick-slip, producing a sizable stress drop. Due to the velocity-weakening property, the fault sliding was faster than at room temperature, implying that the high-pressure injection in a velocity-weakening fault is more likely to induce the fault dynamic slip, thereby triggering earthquakes. According to rate-and-state friction law, a fault characterized by velocity-weakening meets the conditions for earthquake nucleation [35,37], which means that the dynamic slip induced by pressurized water injection may release the tectonic stress of the fault. Thus, the maximum magnitude of the induced earthquake may be affected by the tectonic parameters, such as fault length and the criticality of the fault stress, which has been demonstrated by previous experiments and numerical simulations [45,50,51].

4.4. Implications for Induced Earthquakes

The injection-induced earthquakes associated with wastewater disposal and shale gas hydraulic fracturing suggest that induced earthquakes usually occur at the shallow sedimentary fault, typically at 3–5 km depths [8,13,15,16,34]. According to the average overburden pressure gradient in sedimentary faults [33], the lithostatic pressure at this depth is around 50 MPa. Since this research was not aimed at any specific site, a 50 MPa confining pressure was selected and also used in other friction experiments [38,47,52]. From the previous studies, fault slip behaviors are mainly affected by the criticality of fault stress [45,49,50,53]. The results of this study can be expanded to other confining pressures and provide a qualitative analysis for different situations.
Under shallow crustal boundary conditions (i.e., depth < 3 km, T < 100 °C), laboratory experiments have shown that a great number of rocks observed or inferred to host induced earthquakes (i.e., carbonates, shales, and granites) showed velocity-strengthening behavior, usually considered for aseismic creep [38,47,48,54,55]. There is a conflict between the observations and the frictional experiments. The experiments performed in this study and previous experiments [27,28] showed that high-pressure injection can dominate over velocity-dependent effects and induce fault-unstable slip in velocity-strengthening faults that favors aseismic creep. Due to the initial velocity-dependent property, induced earthquakes mainly come from the decrease in fault effective stress; the magnitude of induced earthquakes is relatively small. The induced earthquake associated with the shale gas hydraulic fracturing in the Western Canada Sedimentary Basin [9,10,56] and Sichuan Basin, China [14,15,16,57] can be accepted as examples of this mechanism.
Although injection can outweigh the rate-and-state dependent effects promoting fault dynamic slip, our experimental results show that the velocity-weakening fault showed a faster sliding rate than the velocity-strengthening fault, as it was induced by the pressurized water injection, suggesting that the induced medium-strong earthquakes more likely occur on faults in the underlying crystalline basement. For example, many significant induced earthquakes in Arkansas, Ohio, Oklahoma, and California occurred below the injection zones at a depth of up to 10 km [20,58,59]. For the velocity-weakening fault close to its frictional strengths, minor stress perturbations can also induce fault failure, releasing the fault tectonic stress [49,52,60]. Therefore, if there is a pre-existing basement fault and the stress level is close to its frictional strength, reservoir impoundment or water injection with several MPa pressures may induce fault sliding and cause strong earthquakes. This mechanism can explain the reservoir earthquakes and strong earthquakes in industrial wastewater reinjection areas, such as several MW 5–6 earthquakes in the central United States [59,61,62].

Author Contributions

Conceptualization, Y.H. and S.M.; methodology, Y.H. and L.Z.; writing—original draft preparation, Y.H.; writing—review and editing, S.M. and X.L.; supervision, S.M.; funding acquisition, S.M. All authors have read and agreed to the published version of the manuscript.

Funding

This research was funded by the National Natural Science Foundation of China, grant number U1839211, and the Spark Program of Earthquake Science and Technology, grant number XH20044.

Institutional Review Board Statement

Not applicable.

Informed Consent Statement

Not applicable.

Data Availability Statement

Data available on request from the authors.

Acknowledgments

The authors thank Changrong He, Yongsheng Zhou, Wenming Yao, Lu Yao, Yanshuang Guo, Qingbao Duan, and Lining Cheng for their help and discussion in the experiments and manuscript writing.

Conflicts of Interest

The authors declare no conflict of interest.

References

  1. Ellsworth, W.L. Injection-Induced Earthquakes. Science 2013, 341, 1225942. [Google Scholar] [CrossRef]
  2. Grigoli, F.; Cesca, S.; Priolo, E.; Rinaldi, A.P.; Clinton, J.F.; Stabile, T.A.; Dost, B.; Fernandez, M.G.; Wiemer, S.; Dahm, T. Current challenges in monitoring, discrimination, and management of induced seismicity related to underground industrial activities: A European perspective. Rev. Geophys. 2017, 55, 310–340. [Google Scholar] [CrossRef]
  3. Fisher, Q.; Casey, M.; Harris, S.; Knipe, R. Fluid-flow properties of faults in sandstone: The importance of temperature history. Geology 2003, 31, 965–968. [Google Scholar] [CrossRef]
  4. Yang, H.; Liu, Y.; Wei, M.; Zhuang, J.; Zhou, S. Induced earthquakes in the development of unconventional energy resources. Sci. China Earth Sci. 2017, 60, 1632–1644. [Google Scholar] [CrossRef]
  5. Langenbruch, C.; Zoback, M.D. How will induced seismicity in Oklahoma respond to decreased saltwater injection rates? Sci. Adv. 2016, 2, e1601542. [Google Scholar] [CrossRef]
  6. Weingarten, M.; Ge, S.; Godt, J.W.; Bekins, B.A.; Rubinstein, J.L. High-rate injection is associated with the increase in U.S. mid-continent seismicity. Science 2015, 348, 1336–1340. [Google Scholar] [CrossRef]
  7. Keranen, K.M.; Weingarten, M.; Abers, G.A.; Bekins, B.A.; Ge, S. Sharp increase in central Oklahoma seismicity since 2008 induced by massive wastewater injection. Science 2014, 345, 448–451. [Google Scholar] [CrossRef]
  8. Kim, W.-Y. Induced seismicity associated with fluid injection into a deep well in Youngstown, Ohio. J. Geophys. Res. Solid Earth 2013, 118, 3506–3518. [Google Scholar] [CrossRef]
  9. Atkinson, G.M.; Eaton, D.W.; Ghofrani, H.; Walker, D.; Cheadle, B.; Schultz, R.; Shcherbakov, R.; Tiampo, K.; Gu, J.; Harrington, R.M.; et al. Hydraulic Fracturing and Seismicity in the Western Canada Sedimentary Basin. Seismol. Res. Lett. 2016, 87, 631–647. [Google Scholar] [CrossRef]
  10. Bao, X.; Eaton, D.W. Fault activation by hydraulic fracturing in western Canada. Science 2016, 354, 1406–1409. [Google Scholar] [CrossRef]
  11. Lei, X.; Ma, S.; Chen, W.; Pang, C.; Zeng, J.; Jiang, B. A detailed view of the injection-induced seismicity in a natural gas reservoir in Zigong, southwestern Sichuan Basin, China. J. Geophys. Res. Solid Earth 2013, 118, 4296–4311. [Google Scholar] [CrossRef]
  12. Lei, X.; Su, J.; Wang, Z. Growing seismicity in the Sichuan Basin and its association with industrial activities. Sci. China Earth Sci. 2020, 63, 1633–1660. [Google Scholar] [CrossRef]
  13. Lei, X.; Wang, Z.; Su, J. Possible link between long-term and short-term water injections and earthquakes in salt mine and shale gas site in Changning, south Sichuan Basin, China. Earth Planet. Phys. 2019, 3, 510–525. [Google Scholar] [CrossRef]
  14. Lei, X.; Wang, Z.; Su, J. The December 2018 ML 5.7 and January 2019 ML 5.3 Earthquakes in South Sichuan Basin Induced by Shale Gas Hydraulic Fracturing. Seismol. Res. Lett. 2019, 90, 1099–1110. [Google Scholar] [CrossRef]
  15. Yang, H.; Zhou, P.; Fang, N.; Zhu, G.; Xu, W.; Su, J.; Meng, F.; Chu, R. A Shallow Shock: The 25 February 2019 ML 4.9 Earthquake in the Weiyuan Shale Gas Field in Sichuan, China. Seismol. Res. Lett. 2020, 91, 3182–3194. [Google Scholar] [CrossRef]
  16. Lei, X.; Huang, D.; Su, J.; Jiang, G.; Wang, X.; Wang, H.; Guo, X.; Fu, H. Fault reactivation and earthquakes with magnitudes of up to Mw4.7 induced by shale-gas hydraulic fracturing in Sichuan Basin, China. Sci. Rep. 2017, 7, 7971. [Google Scholar] [CrossRef]
  17. Ellsworth, W.L.; Giardini, D.; Townend, J.; Ge, S.; Shimamoto, T. Triggering of the Pohang, Korea, Earthquake (Mw 5.5) by Enhanced Geothermal System Stimulation. Seismol. Res. Lett. 2019, 90, 1844–1858. [Google Scholar] [CrossRef]
  18. Deichmann, N.; Giardini, D. Earthquakes Induced by the Stimulation of an Enhanced Geothermal System below Basel (Switzerland). Seismol. Res. Lett. 2009, 80, 784–798. [Google Scholar] [CrossRef]
  19. Kozlowska, M.; Brudzinski, M.R.; Friberg, P.; Skoumal, R.J.; Baxter, N.D.; Currie, B.S. Maturity of nearby faults influences seismic hazard from hydraulic fracturing. Proc. Natl. Acad. Sci. USA 2018, 115, E1720–E1729. [Google Scholar] [CrossRef]
  20. Horton, S. Disposal of Hydrofracking Waste Fluid by Injection into Subsurface Aquifers Triggers Earthquake Swarm in Central Arkansas with Potential for Damaging Earthquake. Seismol. Res. Lett. 2012, 83, 250–260. [Google Scholar] [CrossRef]
  21. Shah, A.K.; Keller, G.R. Geologic influence on induced seismicity: Constraints from potential field data in Oklahoma. Geophys. Res. Lett. 2017, 44, 152–161. [Google Scholar] [CrossRef]
  22. Lockner, D.; Byerlee, J.D. Hydrofracture in Weber Sandstone at high confining pressure and differential stress. J. Geophys. Res. 1977, 82, 2018–2026. [Google Scholar] [CrossRef]
  23. Byerlee, J.D.; Lockner, D.A. Acoustic emission during fluid injection in rock. In Proceedings of the First Conference on Acoustic Emission/Microseismic Activity in Geological Structures and Materials, State College, PA, USA, 1 January 1977; pp. 87–98. [Google Scholar]
  24. Masuda, K.; Nishizawa, O.; Kusunose, K.; Satoh, T.; Takahashi, M.; Kranz, R.L. Positive feedback fracture process induced by nonuniform high-pressure water flow in dilatant granite. J. Geophys. Res. 1990, 95, 21583–21592. [Google Scholar] [CrossRef]
  25. Li, X.; Lei, X.; Li, Q. Injection-induced fracturing process in a tight sandstone under different saturation conditions. Environ. Earth Sci. 2016, 75, 1466. [Google Scholar] [CrossRef]
  26. Lei, X.; Tamagawa, T.; Tezuka, K.; Takahashi, M. Role of drainage conditions in deformation and fracture of porous rocks under triaxial compression in the laboratory. Geophys. Res. Lett. 2011, 38, L24310. [Google Scholar] [CrossRef]
  27. Scuderi, M.M.; Collettini, C. Fluid Injection and the Mechanics of Frictional Stability of Shale-Bearing Faults. J. Geophys. Res. Solid Earth 2018, 123, 8364–8384. [Google Scholar] [CrossRef]
  28. Scuderi, M.M.; Collettini, C.; Marone, C. Frictional stability and earthquake triggering during fluid pressure stimulation of an experimental fault. Earth Planet. Sci. Lett. 2017, 477, 84–96. [Google Scholar] [CrossRef]
  29. Jeong, S.; Stump, B.W.; DeShon, H.R. Spectral Characteristics of Ground Motion from Induced Earthquakes in the Fort Worth Basin, Texas, Using the Generalized Inversion Technique. Bull. Seismol. Soc. Am. 2020, 110, 2058–2076. [Google Scholar] [CrossRef]
  30. Kolawole, F.; Johnston, C.S.; Morgan, C.B.; Chang, J.C.; Marfurt, K.J.; Lockner, D.A.; Reches, Z.; Carpenter, B.M. The susceptibility of Oklahoma’s basement to seismic reactivation. Nat. Geosci. 2019, 12, 839–844. [Google Scholar] [CrossRef]
  31. Kranz, R.L.; Saltzman, J.; Blacic, J.D. Hydraulic diffusivity measurements on laboratory rock samples using an oscillating pore pressure method. Int. J. Rock Mech. Min. Sci. Geomech. Abstr. 1990, 27, 345–352. [Google Scholar] [CrossRef]
  32. He, C.; Yao, W.; Wang, Z.; Zhou, Y. Strength and stability of frictional sliding of gabbro gouge at elevated temperatures. Tectonophysics 2006, 427, 217–229. [Google Scholar] [CrossRef]
  33. Tiab, D.; Donaldson, E.C. Introduction to Petroleum Geology. In Petrophysics, 4th ed.; Tiab, D., Donaldson, E.C., Eds.; Gulf Professional Publishing: Waltham, MA, USA, 2016; pp. 23–66. [Google Scholar]
  34. Eyre, T.S.; Eaton, D.W.; Garagash, D.I.; Zecevic, M.; Venieri, M.; Weir, R.; Lawton, D.C. The role of aseismic slip in hydraulic fracturing–induced seismicity. Sci. Adv. 2019, 5, eaav7172. [Google Scholar] [CrossRef] [PubMed]
  35. Dieterich, J. Modeling of rock friction: 1. Experimental Results and constitutive equations. J. Geophys. Res. 1979, 84, 2161–2168. [Google Scholar] [CrossRef]
  36. Marone, C.; Marone, C. Laboratory-derived friction laws and their application to seismic faulting. Annu. Rev. Earth Planet. Sci. 1998, 26, 643–696. [Google Scholar] [CrossRef]
  37. Ruina, A. Slip instability and state variable friction laws. J. Geophys. Res. Solid Earth 1983, 88, 10359–10370. [Google Scholar] [CrossRef]
  38. Chen, J.; Verberne, B.A.; Spiers, C.J. Effects of healing on the seismogenic potential of carbonate fault rocks: Experiments on samples from the Longmenshan Fault, Sichuan, China. J. Geophys. Res. Solid Earth 2015, 120, 5479–5506. [Google Scholar] [CrossRef]
  39. Samuelson, J.; Elsworth, D.; Marone, C. Shear-induced dilatancy of fluid-saturated faults: Experiment and theory. J. Geophys. Res. 2009, 114, B12404. [Google Scholar] [CrossRef]
  40. Blanpied, M.L.; Lockner, D.A.; Byerlee, J.D. An earthquake mechanism based on rapid sealing of faults. Nature 1992, 358, 574–576. [Google Scholar] [CrossRef]
  41. Medici, G.; West, L.J. Reply to Discussion on ‘Review of groundwater flow and contaminant transport modelling approaches for the Sherwood Sandstone Aquifer, UK; insights from analogous successions worldwide’ by Medici and West (QJEGH, 55, qjegh2021-176). Q. J. Eng. Geol. Hydrogeol. 2023, 56. [Google Scholar] [CrossRef]
  42. Medici, G.; West, L.J.; Mountney, N.P.; Welch, M. Permeability of rock discontinuities and faults in the Triassic Sherwood Sandstone Group (UK): Insights for management of fluvio-aeolian aquifers worldwide. Hydrogeol. J. 2019, 27, 2835–2855. [Google Scholar] [CrossRef]
  43. Logan, J.M.; Teufel, L.W. The effect of normal stress on the real area of contact during frictional sliding in rocks. Pure Appl. Geophys. 1986, 124, 471–486. [Google Scholar] [CrossRef]
  44. Brown, S.; Scholz, C. Closure of Rock Joints. J. Geophys. Res. 1986, 91, 4939–4948. [Google Scholar] [CrossRef]
  45. Dieterich, J.H.; Richards-Dinger, K.B.; Kroll, K.A. Modeling Injection-Induced Seismicity with the Physics-Based Earthquake Simulator RSQSim. Seismol. Res. Lett. 2015, 86, 1102–1109. [Google Scholar] [CrossRef]
  46. McGarr, A. Maximum magnitude earthquakes induced by fluid injection. J. Geophys. Res. Solid Earth 2014, 119, 1008–1019. [Google Scholar] [CrossRef]
  47. Chen, J.; Verberne, B.A.; Spiers, C.J. Interseismic re-strengthening and stabilization of carbonate faults by “non-Dieterich” healing under hydrothermal conditions. Earth Planet. Sci. Lett. 2015, 423, 1–12. [Google Scholar] [CrossRef]
  48. Verberne, B.A.; de Bresser, J.H.P.; Niemeijer, A.R.; Spiers, C.J.; de Winter, D.A.M.; Plümper, O. Nanocrystalline slip zones in calcite fault gouge show intense crystallographic preferred orientation: Crystal plasticity at sub-seismic slip rates at 18–150 °C. Geology 2013, 41, 863–866. [Google Scholar] [CrossRef]
  49. Huang, Y.; Ma, S.; Miao, A.; Yang, M. Effect of normal stress perturbation on frictional instability: An experimental study. Chin. J. Geophys. 2016, 59, 931–940. (In Chinese) [Google Scholar] [CrossRef]
  50. Huang, Y.; Lei, X.; Ma, S. Numerical study of the role of localized stress perturbations on fault slip: Insights for injection-induced fault reactivation. Tectonophysics 2021, 819, 229105. [Google Scholar] [CrossRef]
  51. Norbeck, J.H.; Horne, R.N. Maximum magnitude of injection-induced earthquakes: A criterion to assess the influence of pressure migration along faults. Tectonophysics 2018, 733, 108–118. [Google Scholar] [CrossRef]
  52. Lockner, D.A.; Beeler, N.M. Premonitory slip and tidal triggering of earthquakes. J. Geophys. Res. Solid Earth 1999, 104, 20133–20151. [Google Scholar] [CrossRef]
  53. Gischig, V.S. Rupture propagation behavior and the largest possible earthquake induced by fluid injection into deep reservoirs. Geophys. Res. Lett. 2015, 42, 7420–7428. [Google Scholar] [CrossRef]
  54. Blanpied, M.; Lockner, D.; Byerlee, J. Frictional slip of granite at hydrothermal conditions. J. Geophys. Res. 1995, 1001, 13045–13064. [Google Scholar] [CrossRef]
  55. Sawai, M.; Niemeijer, A.R.; Plümper, O.; Hirose, T.; Spiers, C.J. Nucleation of frictional instability caused by fluid pressurization in subducted blueschist. Geophys. Res. Lett. 2016, 43, 2543–2551. [Google Scholar] [CrossRef]
  56. Atkinson, G.M.; Eaton, D.W.; Igonin, N. Developments in understanding seismicity triggered by hydraulic fracturing. Nat. Rev. Earth Environ. 2020, 1, 264–277. [Google Scholar] [CrossRef]
  57. Tan, Y.; Hu, J.; Zhang, H.; Chen, Y.; Qian, J.; Wang, Q.; Zha, H.; Tang, P.; Nie, Z. Hydraulic Fracturing Induced Seismicity in the Southern Sichuan Basin Due to Fluid Diffusion Inferred From Seismic and Injection Data Analysis. Geophys. Res. Lett. 2020, 47, e2019GL084885. [Google Scholar] [CrossRef]
  58. Goebel, T.H.W.; Hosseini, S.M.; Cappa, F.; Hauksson, E.; Ampuero, J.P.; Aminzadeh, F.; Saleeby, J.B. Wastewater disposal and earthquake swarm activity at the southern end of the Central Valley, California. Geophys. Res. Lett. 2016, 43, 1092–1099. [Google Scholar] [CrossRef]
  59. Keranen, K.M.; Savage, H.M.; Abers, G.A.; Cochran, E.S. Potentially induced earthquakes in Oklahoma, USA: Links between wastewater injection and the 2011 Mw 5.7 earthquake sequence. Geology 2013, 41, 699–702. [Google Scholar] [CrossRef]
  60. Boettcher, M.S.; Marone, C. Effects of normal stress variation on the strength and stability of creeping faults. J. Geophys. Res. 2004, 109, B03406. [Google Scholar] [CrossRef]
  61. Yeck, W.L.; Hayes, G.P.; McNamara, D.E.; Rubinstein, J.L.; Barnhart, W.D.; Earle, P.S.; Benz, H.M. Oklahoma experiences largest earthquake during ongoing regional wastewater injection hazard mitigation efforts. Geophys. Res. Lett. 2017, 44, 711–717. [Google Scholar] [CrossRef]
  62. Yeck, W.L.; Weingarten, M.; Benz, H.M.; McNamara, D.E.; Bergman, E.A.; Herrmann, R.B.; Rubinstein, J.L.; Earle, P.S. Far-field pressurization likely caused one of the largest injection induced earthquakes by reactivating a large preexisting basement fault structure. Geophys. Res. Lett. 2016, 43, 10198–10207. [Google Scholar] [CrossRef]
Figure 1. Microstructure of the (a) granite, (b) sandstone, and (c) limestone samples.
Applsci 13 11466 g001
Figure 2. Sample configuration for an injection hole (a) reaching the position at 1 mm from the fault (blind borehole) and (b) the fault plane (open borehole). (c) Sketch of sample assembly.
Applsci 13 11466 g002
Figure 3. Shear stress, injection pressure, and fault sliding rate for (a) granite, (b) sandstone, and (c) limestone faults as the 15 MPa pressurized water is injected into the vicinity of the fault. (a1c1) are enlarged views of the time window denoting the pressurized water injection. The black dotted lines denote the locations of enlarged views. The blue dotted lines denote the processes of pressurized water injection.
Applsci 13 11466 g003
Figure 4. Shear stress, pore pressure, and fault sliding rate change with time for (a) granite, (b) sandstone, and (c) limestone faults as the water is injected into the fault plane. (a1c1) are enlarged views of the time window denoting the 1 MPa pressurized water injection. (a2c2) are enlarged views of the time window denoting the 15 MPa pressurized water injection. The black dotted lines denote the locations of enlarged views. The blue dotted lines denote the processes of pressurized water injection.
Applsci 13 11466 g004
Figure 5. The apparent friction coefficient changes with time in (a) granite, (b) sandstone, and (c) limestone faults as the water is injected into the fault plane. (a1c1) are enlarged views of the time window denoting the injection of 1 MPa pressurized water. The black dotted lines denote the locations of enlarged views. The blue dotted lines denote the processes of pressurized water injection.
Applsci 13 11466 g005
Figure 6. Injection and actual pore pressure on (a) granite, (b) sandstone, and (c) limestone faults as 15 MPa pressurized water is injected. The red dotted lines denote the actual pore pressure on the faults.
Applsci 13 11466 g006
Figure 7. Velocity stepping data were obtained on (a) granite, (b) sandstone, and (c) limestone faults. v 1 and v2 are 1 μm/s and 0.2 μm/s, respectively. Subplots (a1a3,b1b3,c1c3) denote the velocity stepping test performed in dry and wet samples with 1 MPa and 15 MPa pressurized water injection. The blue dotted lines denote the locations for changing loading velocity. The red dotted lines denote the steady-state friction strength (μss) in different loading velocity.
Applsci 13 11466 g007
Figure 8. (a) Shear stress, injection pressure, and slip rate of the limestone fault at 100 °C. (a1,a2) are enlarged views of the time window denoting the 1 MPa and 15 MPa pressurized water injection. (b) The apparent friction coefficient changes with time. The black dotted lines denote the locations of enlarged views. The blue dotted lines denote the processes of pressurized water injection. The red dotted lines denote the steady-state friction strength (μss) in different loading velocity.
Applsci 13 11466 g008
Table 1. Mineral components and permeability of the samples.
SamplesMineral ComponentPermeability (m2)
GranitePlagioclase, potassium feldspar, quartz, amphibole, and magnetite2.25 × 10−19
SandstoneQuartz, feldspar, biotite, and clay2.66 × 10−17
LimestoneCalcite and clay3.88 × 10−22
Table 2. List of experiments, conditions, and critical data.
ExperimentSampleBorehole TypeTPcPpvSlip Behavior
Run-1GraniteblindrT 50151Stable slip
Run-2SandstoneblindrT50151Stable slip
Run-3LimestoneblindrT50151Stable slip
Run-4GraniteopenrT501&151&0.2Stable slip
Run-5SandstoneopenrT501&151&0.2Stable slip
Run-6LimestoneopenrT501&151&0.2Stable slip
Run-7Limestoneopen100 °C501&151&0.2Stick-slip
Note: T (°C) = temperature; Pc (MPa) = confining pressure; Pp (MPa) = pore pressure; v (μm/s) = loading rate; 1 and 0.2 are the loading rates in velocity stepping tests, of 1 μm/s and 0.2 μm/s, respectively; rT (°C) = room temperature.
Table 3. Parameters of the fault slip caused by water injection.
FaultDryInjection of 1 MPa Pressurized WaterInjection of 15 MPa Pressurized Water
μaa − bμaa − bμaa − bΔτDistslidePactral
Granite0.52~0.530.00090.54~0.560.0220.61~0.620.0346.90.282908.5
Sandstone0.560.0340.560.0220.590.02610.40.1914511.5
Limestone0.58~0.590.0260.600.0340.560.069180.5749019.1
Note: μa = Apparent friction coefficient; Δτ (MPa) = stress drop; Dis (mm) = sliding displacement; tslide (s) = sliding time; Pactual (MPa) = actual pore pressure.
Disclaimer/Publisher’s Note: The statements, opinions and data contained in all publications are solely those of the individual author(s) and contributor(s) and not of MDPI and/or the editor(s). MDPI and/or the editor(s) disclaim responsibility for any injury to people or property resulting from any ideas, methods, instructions or products referred to in the content.

