1. Introduction
The eye is one of the most important organs for routine activities [
1,
2,
3]. Eye diseases can cause permanent damage to the retina [
4]. Eye disorders can result in visual impairment or blindness, making it difficult for individuals to carry out activities, including reading, driving, recognizing faces, and navigating the environment [
4]. Thus, visual impairment can affect an individual’s quality of life. On a global scale, a minimum of 2.2 billion individuals are experiencing some form of visual impairment [
4]. At least one billion of these cases could be prevented, or have failed to receive adequate treatment. The global cost of vision impairment is estimated at USD 411 billion annually, representing a significant burden on global economies [
4]. Across the globe, only 36% of patients with vision impairment owing to refractive error and 17% of individuals with cataracts received adequate treatments [
4].
Children with severe visual impairment may experience motor, verbal, emotional, social, and cognitive development delays [
5,
6,
7,
8]. Low academic achievement is a common problem for school-aged children who are visually impaired. Traditional treatment options such as those for dry eye, conjunctivitis, and blepharitis could not provide a solution for visual impairment. Additionally, these treatments can cause discomfort and pain [
9]. Treating these disorders aims to reduce symptoms and prevent disease progression. Vision rehabilitation has demonstrated significant efficacy in enhancing functionality among those experiencing permanent vision loss from various eye disorders, including diabetic retinopathy (DR), glaucoma, trauma-related effects, and age-related macular degeneration [
10].
Medical imaging encompasses diverse technologies to provide visual representations of the internal structures of the human body [
11]. It is essential for non-invasive assessments of anatomical structures and physiological processes [
12]. Healthcare experts diagnose, monitor, and treat diseases using these images. AI-based tools and technologies enable healthcare centers to treat ocular disorders effectively [
13]. These technologies can analyze medical imagery, including retinal images and optical coherence tomography (OCT) scans, to identify signs of eye disorders, including diabetic retinopathy, glaucoma, and age-related macular degeneration in early stages [
14].
Ophthalmologists can employ artificial intelligence (AI) to review patient images and provide consultations remotely [
15,
16,
17,
18]. Additionally, the AI application enables the remote monitoring of patients’ eye problems, eliminating the requirement for frequent in-person checkups [
19]. AI algorithms can categorize patients into different risk groups by evaluating their ocular conditions’ severity [
20]. This information assists healthcare centers in allocating resources to provide prompt care for patients at a higher risk. AI applications can assess various types of patient data, including medical history, genetic information, and medical imaging, to provide tailored treatment recommendations [
21]. This practice guarantees that interventions are customized to address each patient’s unique requirements and attributes.
Recently, Image-based Convolutional Neural Network (CNN) models have been used to classify eye diseases using retinal, fundus, and OCT scans [
22]. The initial stage is the collection of an extensive dataset of medical images encompassing multiple ocular pathologies. Medical imaging machinery or datasets facilitate the acquisition of visual representations of ocular diseases. The CNN model is trained using a labeled dataset with a supervised learning methodology [
23]. During training, the model can discern patterns, characteristics, and textures within the images that serve as biomarkers for various ocular ailments [
24]. After optimization, the model undergoes testing on an independent dataset to assess its performance in real-time [
25].
Researchers and developers are focusing on improving the efficiency of the CNN models to overcome the existing challenges. A substantial number of parameters and high-performance computing resources are required to train an eye disease classification (EDC) model. Furthermore, the model’s performance is based on the dataset. Data imbalances may reduce the performance of the EDC. In order to address the shortcomings, a practical hyper-parameter tuning approach is required. The existing knowledge gap in the literature has motivated the authors to build a lightweight CNN model for classifying eye diseases with less computational power. Thus, the authors intend to build a lightweight EDC using the fundus images. The novelty of the study can be summarized as follows.
- i.
A feature extraction technique for extracting crucial patterns from fundus images.
The existing feature extraction techniques demand substantial computational resources. These techniques may not capture the semantic meaning of the features. The proposed single-shot detection (SSD)-based feature extraction technique uses multiple feature maps at different scales to detect meaningful features with limited computational resources. It improves the performance of the proposed EDC.
- ii.
A feature selection technique for generating compelling features.
The more recent feature selection techniques are limited to specific problems or datasets. They may not identify the key features. The proposed whale optimization algorithm (WOA)-based feature selection technique uses the Levy Flight and Wavelet search strategy to find the features. It assists the proposed model in identifying eye diseases with optimal accuracy.
- iii.
An optimized CNN multi-class EDC model to classify ocular diseases with limited computational resources.
The remaining part of the study is organized as follows:
Section 2 presents the recent techniques for detecting eye diseases. The research methodology of feature generation and multi-class image classification is described in
Section 3. The experimental results are highlighted in
Section 4.
Section 5 shows the comparative analysis outcomes and outlines the study’s contribution. Finally,
Section 6 presents the effects of the study in classifying the fundus images. In addition, it highlights the future aspects of the proposed study.
2. Literature Review
The conventional classification of eye illnesses depends on clinical observations, symptom evaluation, and diagnostic testing by ophthalmologists and optometrists [
25]. The procedure commences with a thorough clinical assessment of the patient’s ocular condition. During this assessment, medical professionals specializing in ophthalmology or optometry observe and analyze observable indications and manifestations of visual disorders [
26]. Tonometry is a well-known tool for detecting glaucoma by measuring intraocular pressure [
26]. Ophthalmoscopy examines the retina, optic nerve, and blood vessels. Fundus photography offers high-resolution retinal images [
27]. The utilization of these images has immense value in the diagnosis and continual monitoring of retinal disorders. The method of Fluorescein Angiography entails the intravenous administration of a fluorescent dye, which helps to emphasize the blood vessels within the retina [
27]. This technique diagnoses retinal vascular disorders such as DR and retinal vein occlusion. OCT is a non-invasive imaging modality that offers high-resolution cross-sectional images of the retina and optic nerve [
28]. Electroretinography is a technique used to assess the electrical responses of the retina in response to light stimulation [
29]. This diagnostic tool is utilized to identify retinal conditions, specifically hereditary retinal diseases.
Image classifiers based on deep learning (DL) techniques are valuable in classifying eye diseases [
30]. DL models are employed to extract relevant data from medical images, including retinal and OCT scans, and subsequently categorize these images. These features may include blood vessels, lesions, or retinal structural abnormalities in eye disease categorization. DL models can identify disorders such as DR, age-related macular degeneration, glaucoma, and cataracts [
31]. These models can be especially advantageous in cases wherein a patient presents with many concurrent ocular conditions. Consistency in diagnosis and categorization can be achieved using DL models [
32].
The existing studies have proposed an ocular disease dataset and classification techniques. Li et al. (2021) [
33] presented a dataset of 10,000 fundus images. They evaluated the state-of-the-art DL techniques using the dataset. They emphasized the significance of an effective DL technique in classifying the fundus images. Sundaram et al. (2019) [
34] proposed a model to extract the blood vessels from the images. They followed the hybrid segmentation approach for the classification. He et al. (2021) [
35] proposed a multi-label disease classification model. They applied a dense correlation network for classifying the ocular diseases. In their study [
36], Gour and Khanna (2021) proposed a multi-class image classification method. They followed two transfer learning-based models to identify abnormal patterns. Junayed et al. (2021) [
37] employed the hyper-parameter-optimized CNN model for detecting cataracts. Xu et al. (2021) [
38] proposed a DL-based model to detect glaucoma. They trained the model using a small set of training samples. Luo et al. (2021) [
39] proposed an ophthalmic disease detection model using a novel mixture loss function. Shamsan et al. (2023) [
40] proposed a hybrid CNN model for eye disease classification (EDC). They used principal component analysis for feature selection.
Researchers increasingly confront significant gaps and challenges in developing DL-based EDC. There is a requirement for large-scale, multicenter clinical trials to evaluate the efficacy of deep learning models in real-world healthcare settings, regardless of their promising results in research and small-scale clinical settings. Models trained on data from a specific population may exhibit limited generalizability when applied to different ethnic, age, or gender cohorts. DL models can interpret images rapidly. Nevertheless, computational resources, medical device integration, and regulatory approvals limit their real-time diagnosis. Finding strategies to apply findings from academic studies in real-world settings is crucial. DL models demand consistent benchmark datasets for a wide range of eye disorders. This would allow for more reliable comparisons and assessments of unique DL models. Limited research has been conducted evaluating the cost-effectiveness of DL algorithms for categorizing eye diseases in contrast to conventional diagnostic approaches. Thus, the authors focus on developing cost-effective EDC using DL techniques.
3. Materials and Methods
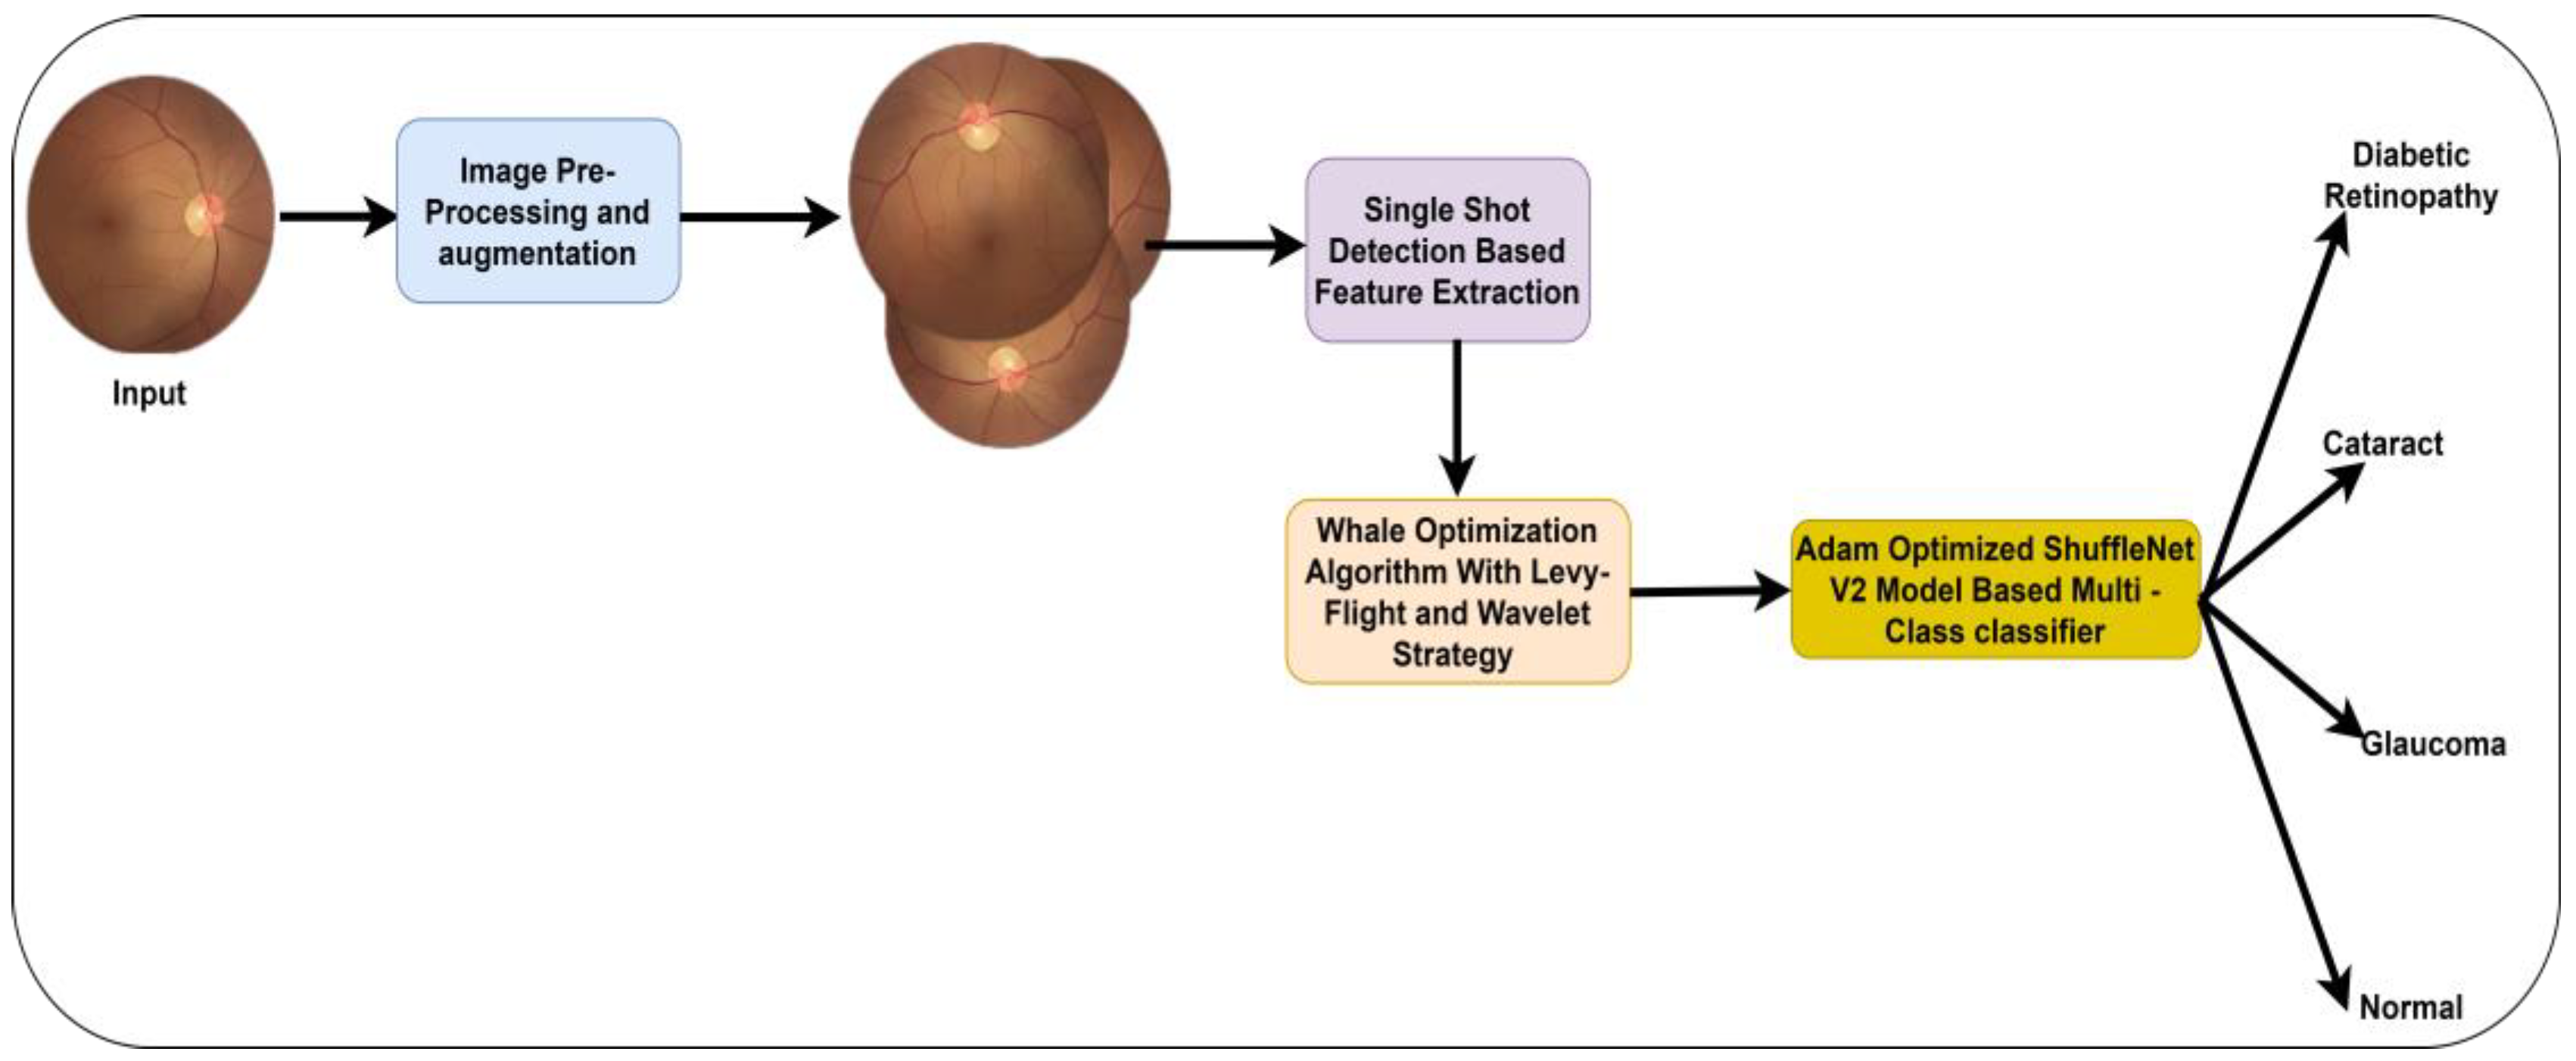
The study intends to build a lightweight DL model for identifying eye diseases in the earlier stages. The fundus images may contain noises and black spaces. Thus, image pre-processing is required to improve the standard of the images. A high-quality image can support the proposed model in identifying the key indicators of eye diseases. In addition, a dedicated feature extraction technique offers a set of features. Using these features, the proposed model can generate an outcome with limited computational resources. It comprises image pre-processing, feature extraction and selection, and image classification techniques.
SSD uses low-level features to capture minor details and high-level features to represent abstract information [
41]. By combining these two methods, the proposed EDC model may be trained to recognize eye diseases with a wide range of characteristics. The feature extraction procedure of SSD incorporates location information, which is highly significant [
33]. This information can be beneficial in precisely localizing crucial features of the fundus images. Assessing high-dimensional data can involve significant computing costs and may result in overfitting. WOA plays an essential role in identifying the subset of features with the highest clarity level [
42]. Noise reduction and the elimination of extraneous information facilitates the concentration of the machine learning model on the crucial elements of the data, consequently potentially enhancing accuracy and improving generalization capabilities. WOA-based feature selection may contribute to the proposed EDC model’s optimal accuracy. ShuffleNet V2 demonstrates notable efficiency in both computational and memory usage [
43]. The model attains exceptional performance in image classification with reduced computational resources. ShuffleNet V2 is well-suited for distributed processing or deployment on hardware with many processing units, as its architecture encourages efficient parallelism. It facilitates the deployment of proposed EDC on mobile devices and other low-powered endpoints. Thus, the authors employ the SSD technique, WOA, and ShuffleNet V2 for classifying the fundus images.
Figure 1 presents the proposed model.
3.1. Image Acquisition
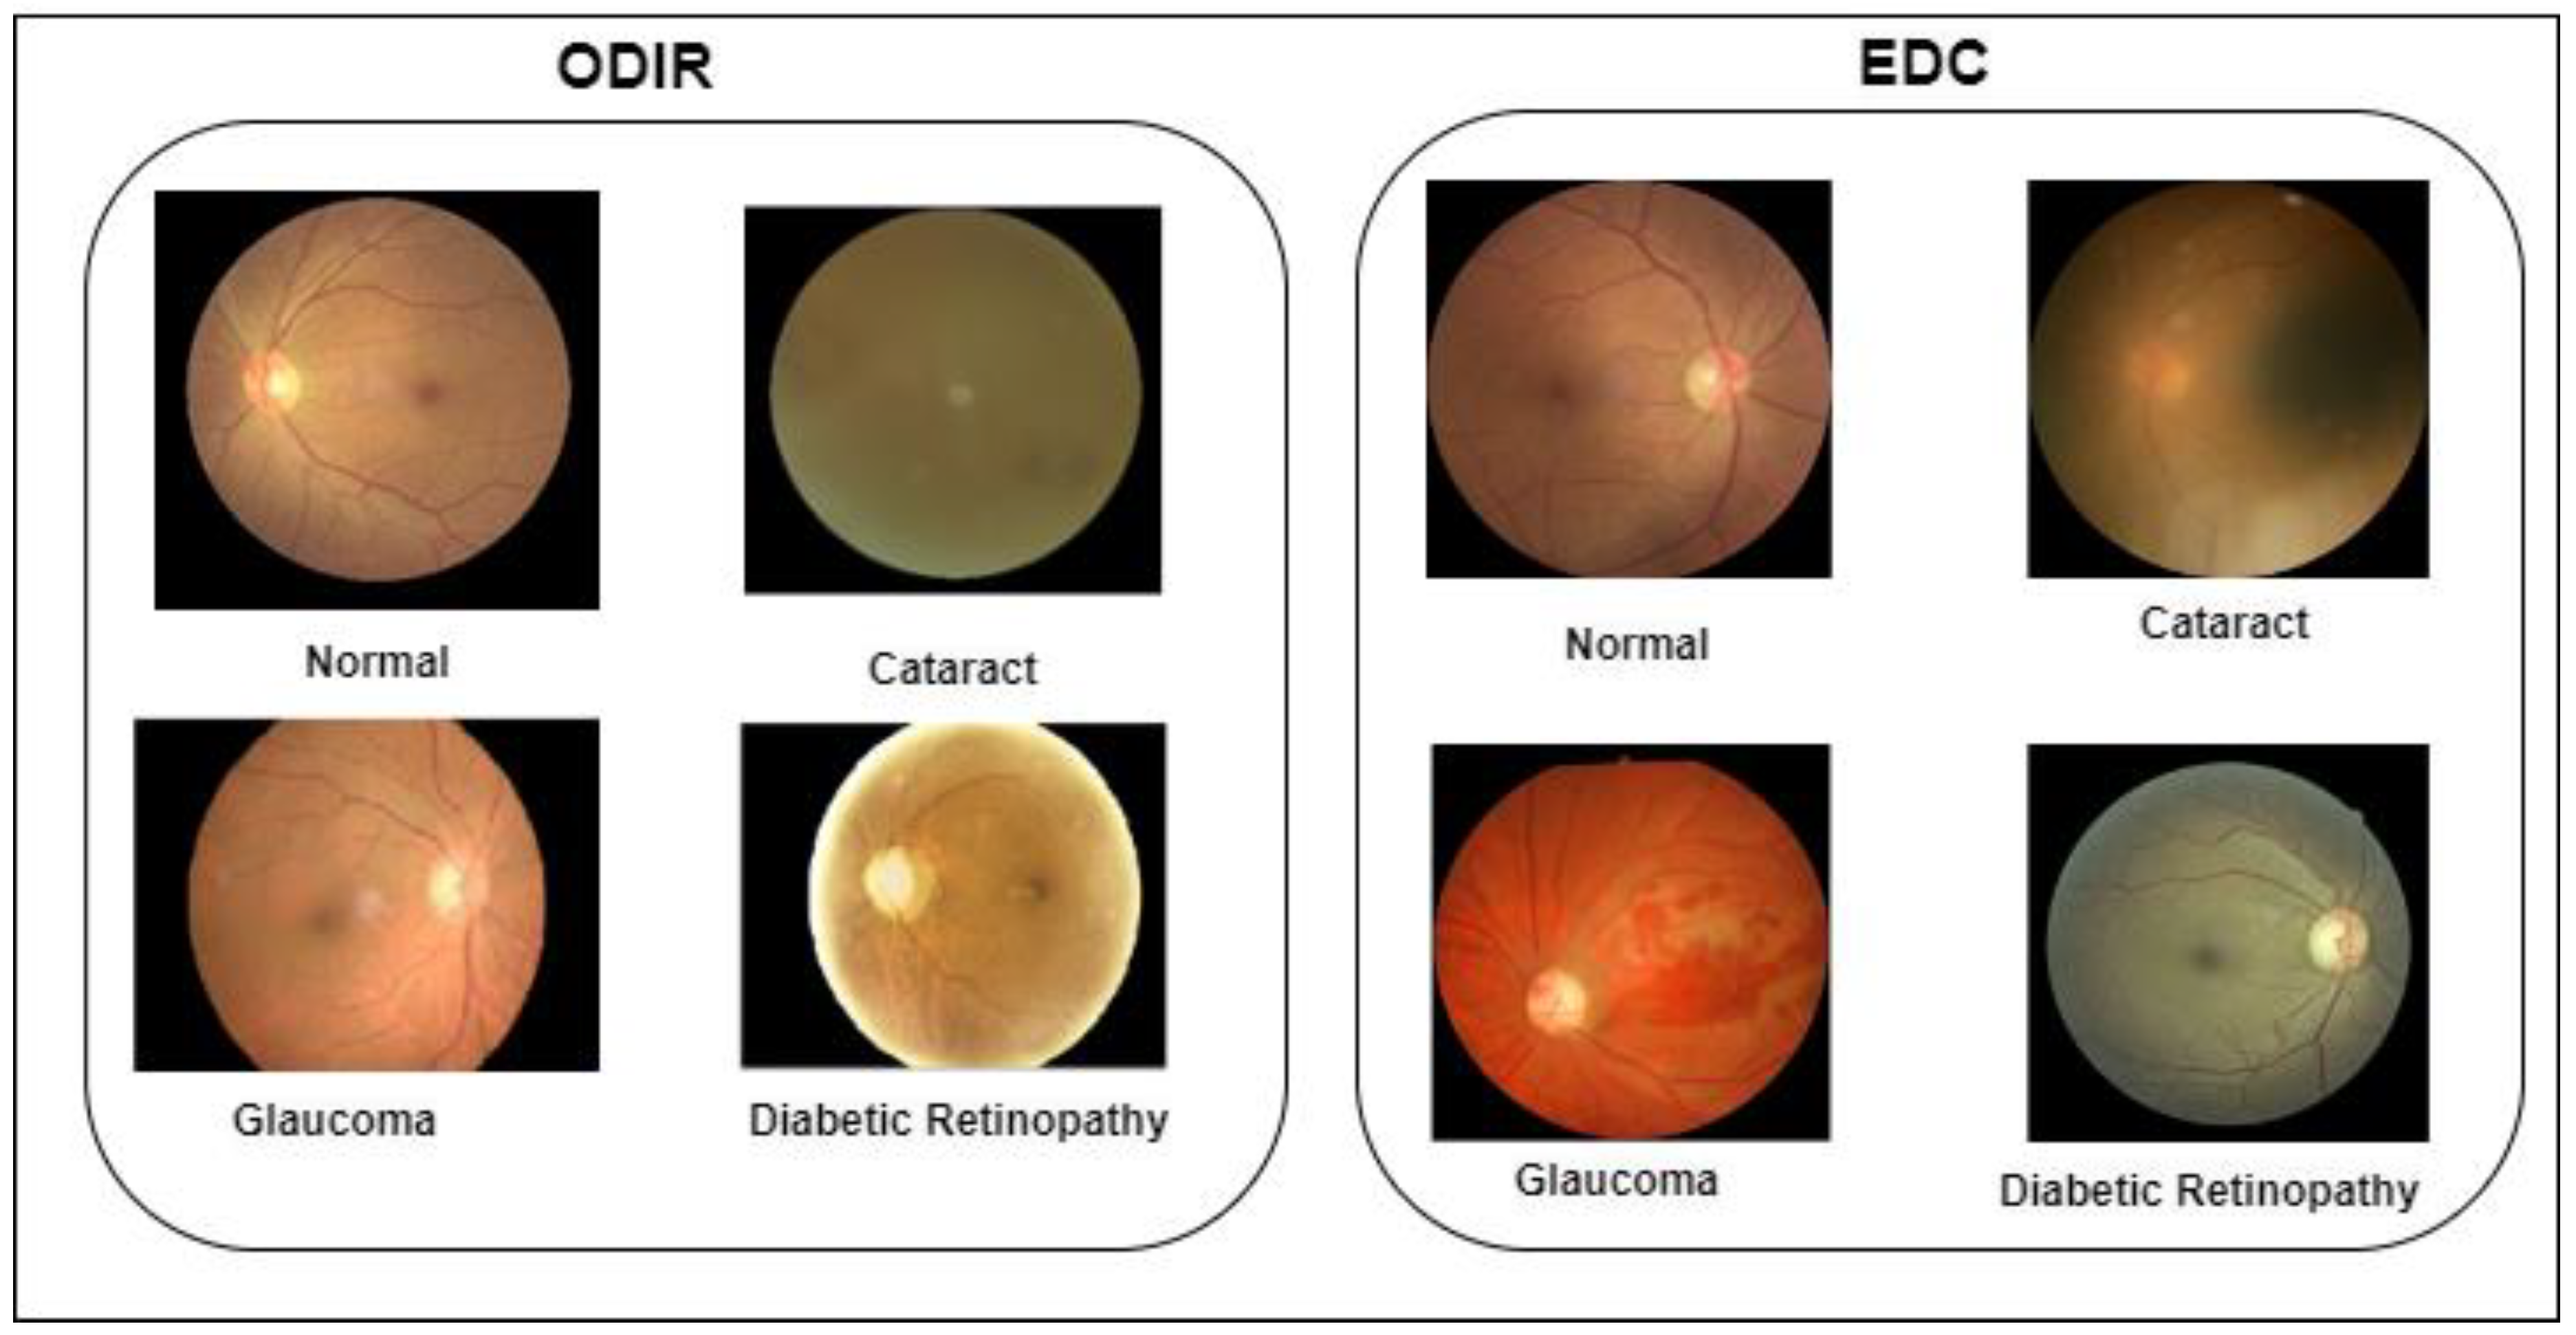
The authors obtained the fundus images from two benchmark datasets. The ocular disease intelligent recognition (ODIR) dataset offers left and right eye images of 5000 patients. It is available in the Kaggle repository [
44]. Shanggong Medical Technology Co., Ltd., China, gathered the images from various hospitals across China. The images were captured using Canon, Zeiss, and Kowa cameras. Thus, the image resolutions are not unique. The patients were classified into eight classes: normal, DR, glaucoma, cataracts, age-related macular degeneration, hypertension, pathological myopia, and other diseases/abnormalities.
Furthermore, the EDC dataset was used to train the proposed model. It is publicly available in the repository [
45]. The images were collected from multiple repositories. The dataset provides four categories: normal, glaucoma, DR, and cataract. The proposed model classifies the images into four classifications based on the image categories of the EDC dataset. The ground truth information is available for the ODIR and EDC datasets.
Table 1 highlights the properties of the datasets. In addition,
Figure 2 shows the sample images of the ODIR and EDC datasets.
3.2. Pre-Processing and Transformation
In order to pre-process the images, the authors applied contrast-limited adaptive histogram equalization (CLAHE), denoising autoencoders, and image transformations. The contrast value of each image differs based on the camera resolution. The CLAHE function improves the image contrast locally to overcome the different lighting conditions. In addition, it adapts to the characteristics of the multiple regions to cover a broader range of fundus images. Let
be the fundus images, and CLAHE be the function. Equation (1) expresses the computational model of image contrast enhancement.
where n is the number of images.
Furthermore, the authors employed denoising autoencoders to remove the noises and artifacts. Denoising autoencoders are based on an AI technique that learns the image representations. The encoder converts the image into a lower dimension, whereas the decoder reconstructs the high-quality, noiseless images from the lower dimension. Equations (2) and (3) show the encoding and decoding processes.
where
is the low-dimensional image,
is the high-quality image, and n is the number of images.
The images were resized into 512 512 pixels to support the feature extraction. To overcome the data imbalance, the images were transformed into different angles.
3.3. Feature Extraction
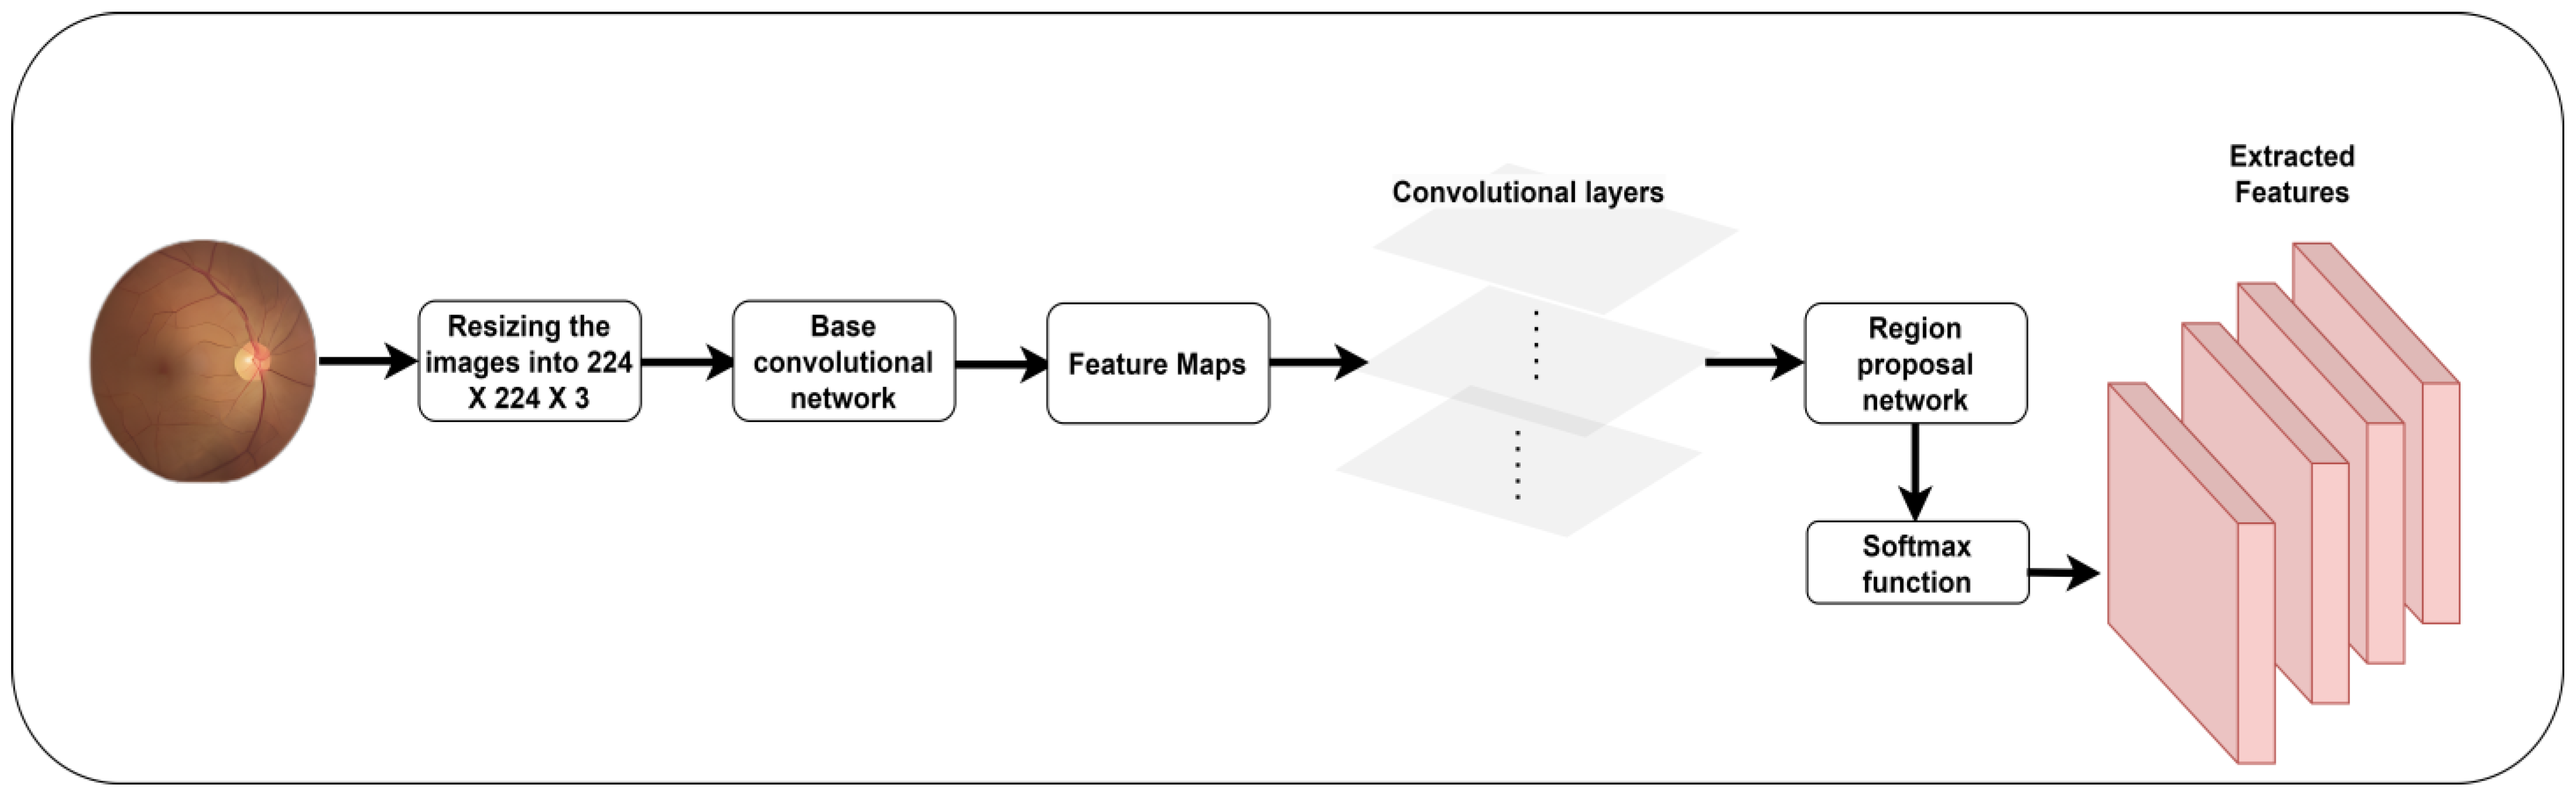
The feature extraction process in CNN entails the utilization of convolutional filters to scan the input data and produce feature sets with specific patterns and characteristics. These feature sets retain the input’s hierarchical information, allowing the proposed model to recognize and learn complicated patterns and structures essential for EDC. SSD [
46] is an efficient object-identification technique that uses a single forward pass of a neural network to detect and localize objects in the fundus image. It utilizes a deep CNN as its core architecture. Features are extracted from the input image at different scales and resolutions using the detection heads. Feature maps are derived from different network layers, wherein each layer captures distinct levels of detail and abstraction. SSD introduces anchor boxes at feature map locations. The anchor boxes are predetermined concerning their dimensions and aspect ratios. Based on the feature map location, the detection head predicts two blocks of information for a single anchor box.
Figure 3 outlines the process of feature extraction.
Moreover, a class score is used to identify the key feature. SSD integrates the feature maps at different ranges to cover the maximum size and aspect ratio. The confidence score is employed to ensure the existence of a crucial pattern. Equation (4) shows the feature set generation using the SSD technique.
where
is the feature set, SSD is the function for extracting the features, and n is the total number of images.
3.4. Feature Selection
The nature-inspired WOA is widely applied for addressing optimization problems. The concept is derived from the social behaviors shown by humpback whales, particularly their bubble-net hunting strategy [
47]. The primary purpose of WOA is to identify the most favorable solution or collection of alternatives that either decrease or maximize a specified objective function. The authors applied WOA to select the key features to determine diseases using fundus images.
The algorithm integrates aspects of exploration and exploitation, emulating the collective hunting behavior of humpback whales. During exploration, whales move forward randomly in a specific search space. This action aims to promote the investigation of unexplored areas within the search domain. During the exploitation phase, whales modify their locations by considering the positions of other whales closer to the best solution. This phase aims to direct the algorithm’s convergence toward the best solution. The repositioning of whales is determined by considering their prior locations, the positions of other whales, and their respective fitness values. The algorithm concludes its execution upon reaching the maximum number of iterations or satisfying predetermined stopping criteria. The whale’s response determines the ideal solution to the optimization issue.
The algorithm effectively combines the investigation of unknown images with exploitation to navigate complicated optimization landscapes and swiftly find the optimum set of features. The method’s performance is contingent upon both the parameter configurations and the inherent characteristics of the optimization issue. The potential solutions (whales) population is randomly initialized within the search space. The search agent position is updated related to the best solution. To achieve a better solution, the authors introduced the Levy Flight and Wavelet [
37] mutation strategy into exploration to improve the WOA performance. Initially, the WOA considers the best feature set as the target prey.
Figure 4 highlights the feature selection process.
The search agents update their positions based on the best search agent. Equations (5) and (6) compute the position vector of the optimal feature sets.
where t represents the current iteration,
are the co-efficient vectors,
is the position vector of optimum feature sets, “.” is the element-wise multiplication operator, and
is the position vector.
In the exploitation phase, the feature sets are generated using Equation (7).
where
indicates the distance of the ith whale to the prey, b is the constant in the exploitation phase,
is the position vector at t + 1 time, and l and P are random numbers in the range [−1,1].
Equations (8) and (9) show the mathematical model for the exploration phase.
where
is the random position vector.
The random positions of the whales are computed using the Levy Flight and Wavelet search strategies. Equation (10) calculates the random position of the agent to obtain the best feature set.
where
is the Levy Flight function using
, dim is the dimension of the feature sets, ub and lb are the upper and lower bounds, and
is the wavelet function. Equation (11) shows the mathematical model of the wavelet function.
where
is the pseudo-random number in the range [−2.5a–2.5a] and a is the scale parameter of the wavelet function.
3.5. Eye Disease Classification
The ShuffleNetV2 model has superior model inference efficiency and lower processing needs, and achieves comparable performance in picture classification and other computer vision applications [
43]. The architecture enables fast deep learning inference, focusing on resource-constrained devices, including mobile phones and handheld devices. Thus, the authors applied the ShuffleNet V2 model for classifying the fundus images.
The ShuffleNet model aims to enhance the balance between model accuracy and computing efficiency. It utilizes channel shuffling and pointwise group convolutions to decrease computational complexity. It presents a unique architectural component known as the shuffling unit. The utilization of this block simplifies the process of channel shuffling. It facilitates the interchange of information across different groups of channels within a feature map.
Figure 5 elucidates disease classification using the ShuffleNet V2 model.
Shuffle units are employed to construct network topologies of greater complexity while preserving computational efficiency. Channel shuffling plays a pivotal role as a significant innovation inside the ShuffleNet V2 architecture. It enables the division of channels into various groups and the subsequent interleaving or shuffling of channels within groups. Channel shuffling improves the network’s representation capacity and ability to learn varied features without raising parameters. ShuffleNet V2 utilizes pointwise group convolutions, a technique that entails the application of 1 × 1 convolutions to distinct groups of channels inside a feature map. Group convolutions reduce computational complexity compared to conventional convolutions while maintaining the same level of expressive capability. The inverted residual blocks are used to enhance the network’s depth and effectively capture hierarchical information. Inverted residuals incorporate depth-wise separable and pointwise convolutions with expansion and projection layers.
Equation (12) highlights the image classification model using the ShuffleNet V2 model.
where ReLu is the rectified linear unit, CL is the convolutional layer, FC is the fully connected layer, and softmax is the function for multi-class classification.
3.6. Hyperparameter Optimization
The AO algorithm dynamically adjusts the learning rate of the proposed EDC throughout the training process. It enables the system to achieve convergence faster and with greater reliability. In addition, it automatically modifies the learning rate based on the development progress. The automated modification minimizes the necessity for the manual fine-tuning of learning rates. ShuffleNet V2 includes a width multiplier (α) as a hyper-parameter, enabling the manipulation of channel quantities within each layer. A smaller α leads to a narrower network with lower computing costs. It is structured hierarchically, with distinct stages comprising shuffle units and convolutional layers. The authors applied AO to alter the number of settings and shuffling units to improve the performance of the proposed model. Equation (13) outlines the mathematical form of the fine-tuned proposed EDC.
3.7. Evaluation Metrics
In order to evaluate the performance of the proposed EDC, the author follows the benchmark metrics. Accuracy is a measure of correct predictions made by the proposed EDC. In the context of fundus image analysis, precision and recall are crucial metrics to measure the influence of false positives (FP) and false negatives (FN) in the outcome. The F1-score is used to find the relationship between precision and recall. Sensitivity computes the model’s ability to identify true positives (TP), whereas specificity measures the EDC’s ability to find true negatives (TN). Equations (14)–(19) show the expressions for computing accuracy, precision, recall, F1-score, specificity, and sensitivity. These metrics are used to determine the model’s effectiveness in classifying eye diseases. In addition, Equation (20) highlights the mathematical form of Cohen’s Kappa. This metric evaluates the multi-class classification capability of EDC.
The confidence interval (CI) and standard deviation (SD) are applied to calculate the model’s uncertainties. In addition, the prediction errors are computed using mean average deviation (MAD) and root mean square error (RMSE). Equations (20) and (21) outline the mathematical form of MAD and RMSE,
where P is the data point, μ is the mean, and N is the total number of images.
where K is the measure of the predicted class,
is the predicted class, and N is the number of images.
Furthermore, the author employed learning rate, FLOPs, number of parameters, and testing time for measuring the computational strategies of EDC to classify the fundus images.
4. Results
The authors implemented the proposed EDC mode in Python 3.8.3, Windows 10 Professional, 16 GB RAM, Intel core i7, NVIDIA GeForce RTX 3050. In order to train and test the EDC model, the authors divided the dataset into train (70%) and test (30%) sets. The source code of the ShuffleNet V2 and SSD was extracted from the repositories [
38,
39]. The authors accordingly executed the EDC model with batch sizes of 30 and 43 and epochs of 220 and 360 for the ODIR and EDC datasets. AO was used to identify the optimal parameters of the ShuffleNet V2 model in classifying the eye disease images.
Table 2 presents the computational cost of the existing and proposed EDC models. Hyperparameter optimization supported the proposed model in classifying the fundus images with lower learning rates, parameters, and floating point operations (FLOPs). The proposed model maintained the trade-off between the learning rate and the training time. The AO algorithm streamlined the parameters of the ShuffleNet V2 model to obtain an exceptional outcome.
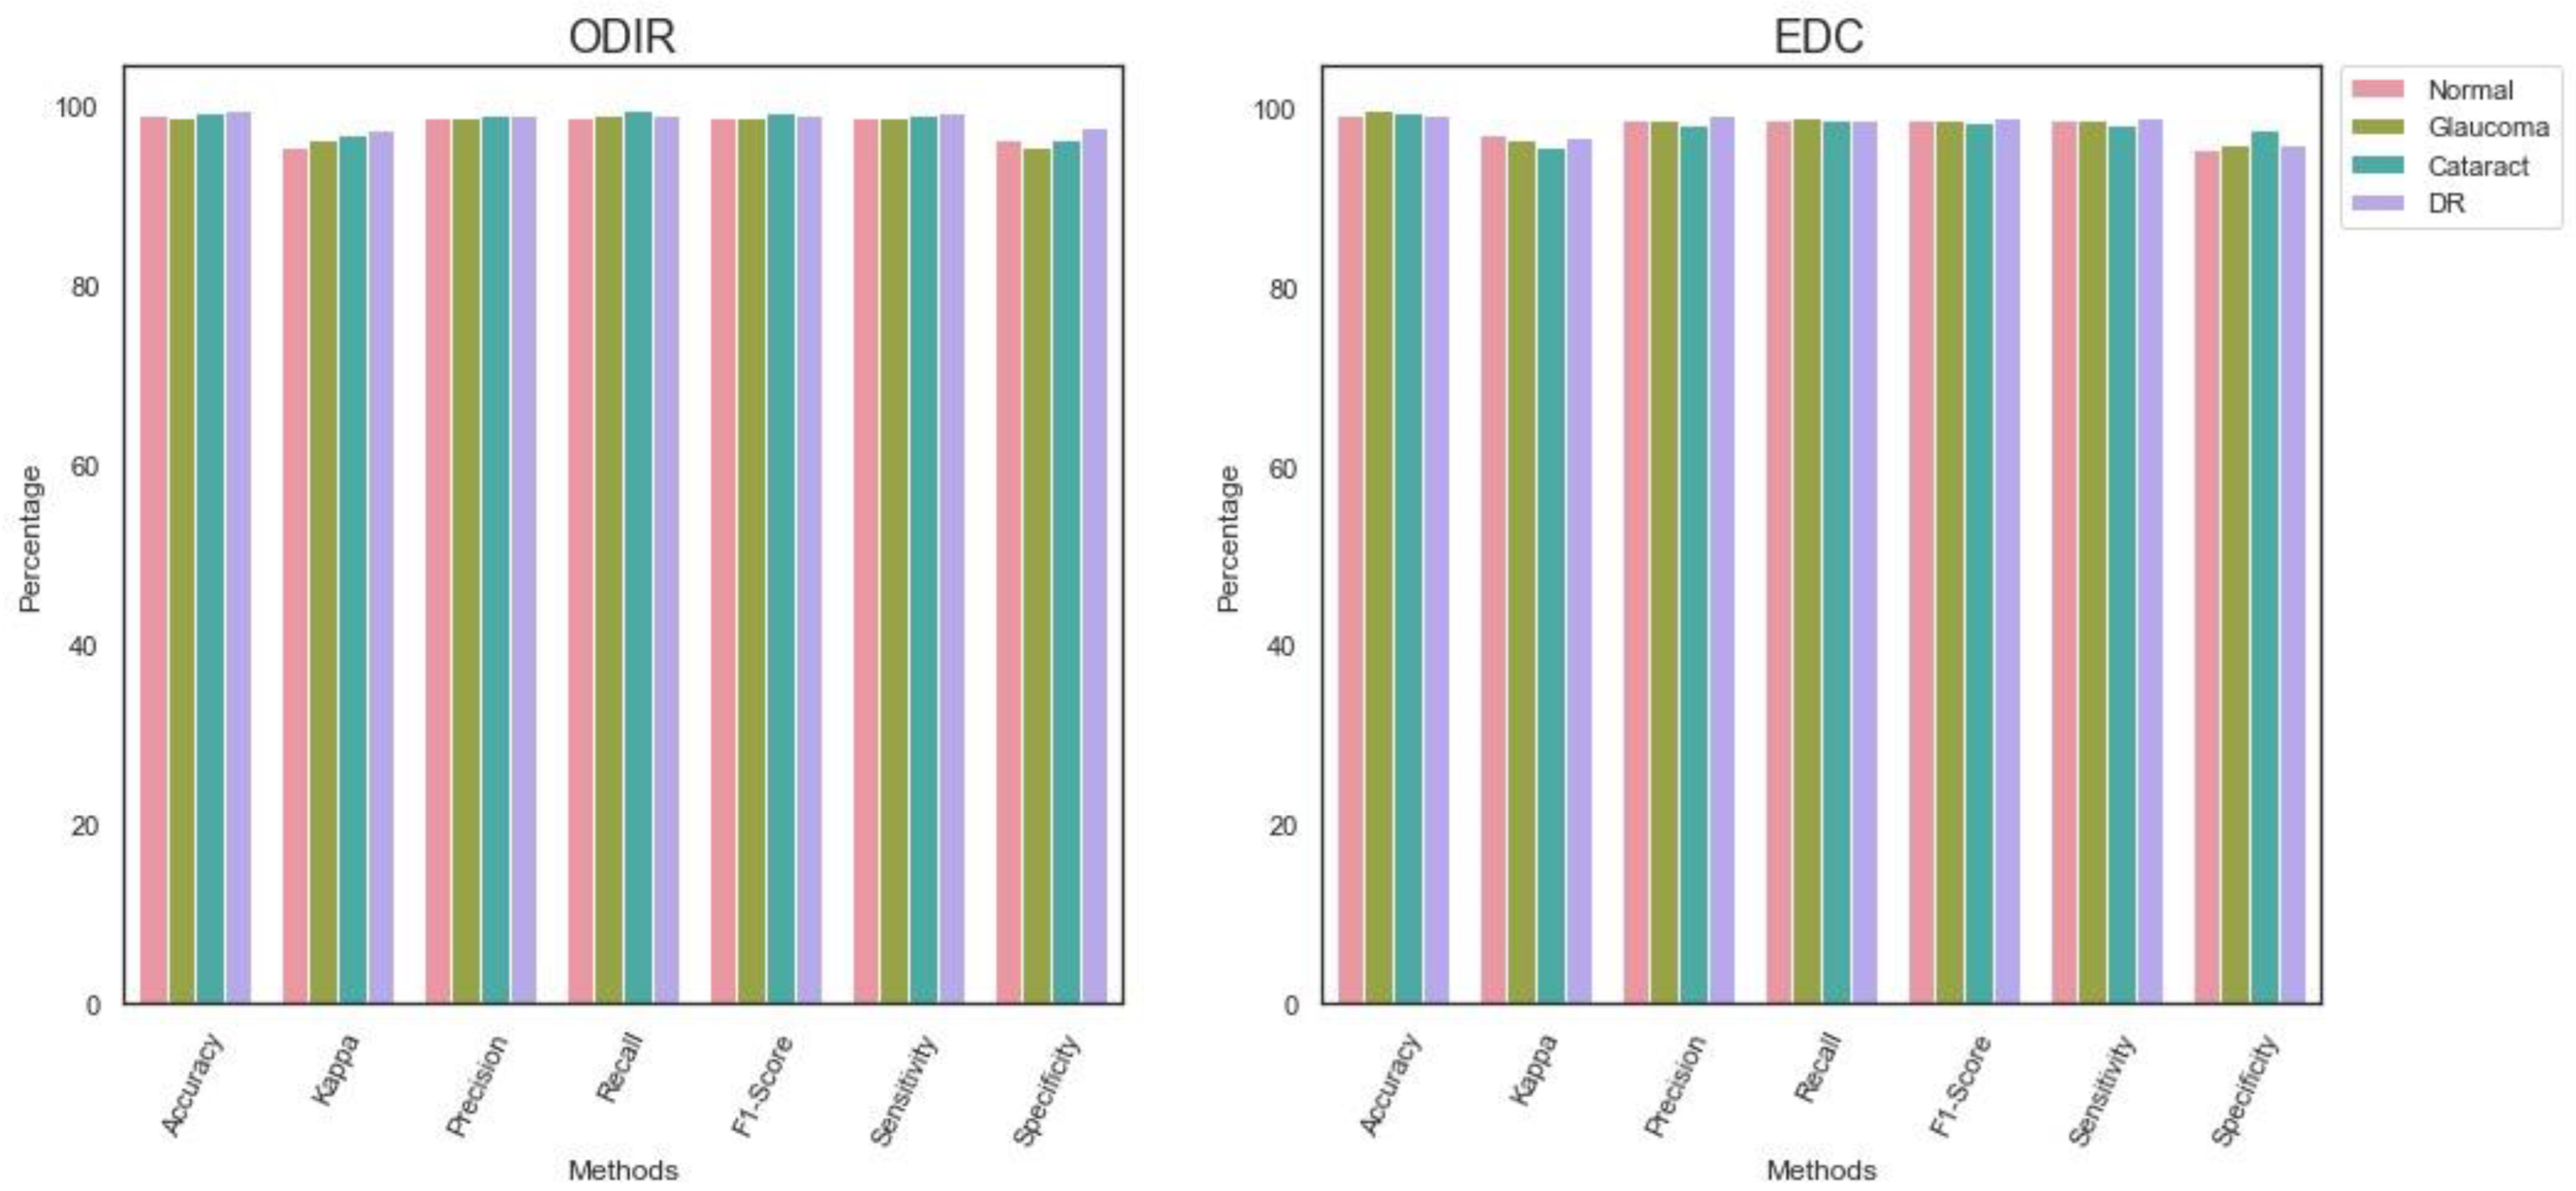
Table 3 shows the findings of the proposed models’ performance evaluation in the ODIR dataset. SSD extracted the appropriate features and supported the proposed model in overcoming the complexities in classifying the fundus images. The WOA optimization algorithm with Levy Flight and Wavelet mutation assisted the proposed EDC in detecting the diseases effectively. In addition, the optimized ShuffleNet V2 model-based multi-class classifier identified each class with optimal accuracy.
Table 4 highlights the outcome of the performance analysis of the proposed EDC model in the EDC dataset. The suggested image processing techniques produced high-quality images. The EDC dataset contains unique images that differ in size and pixel rates. However, the image pre-processing technique overcame the shortcomings and removed the noises and artifacts from the images. It supported the classifier in obtaining better results for each class.
Figure 6 presents the findings of the performance analysis.
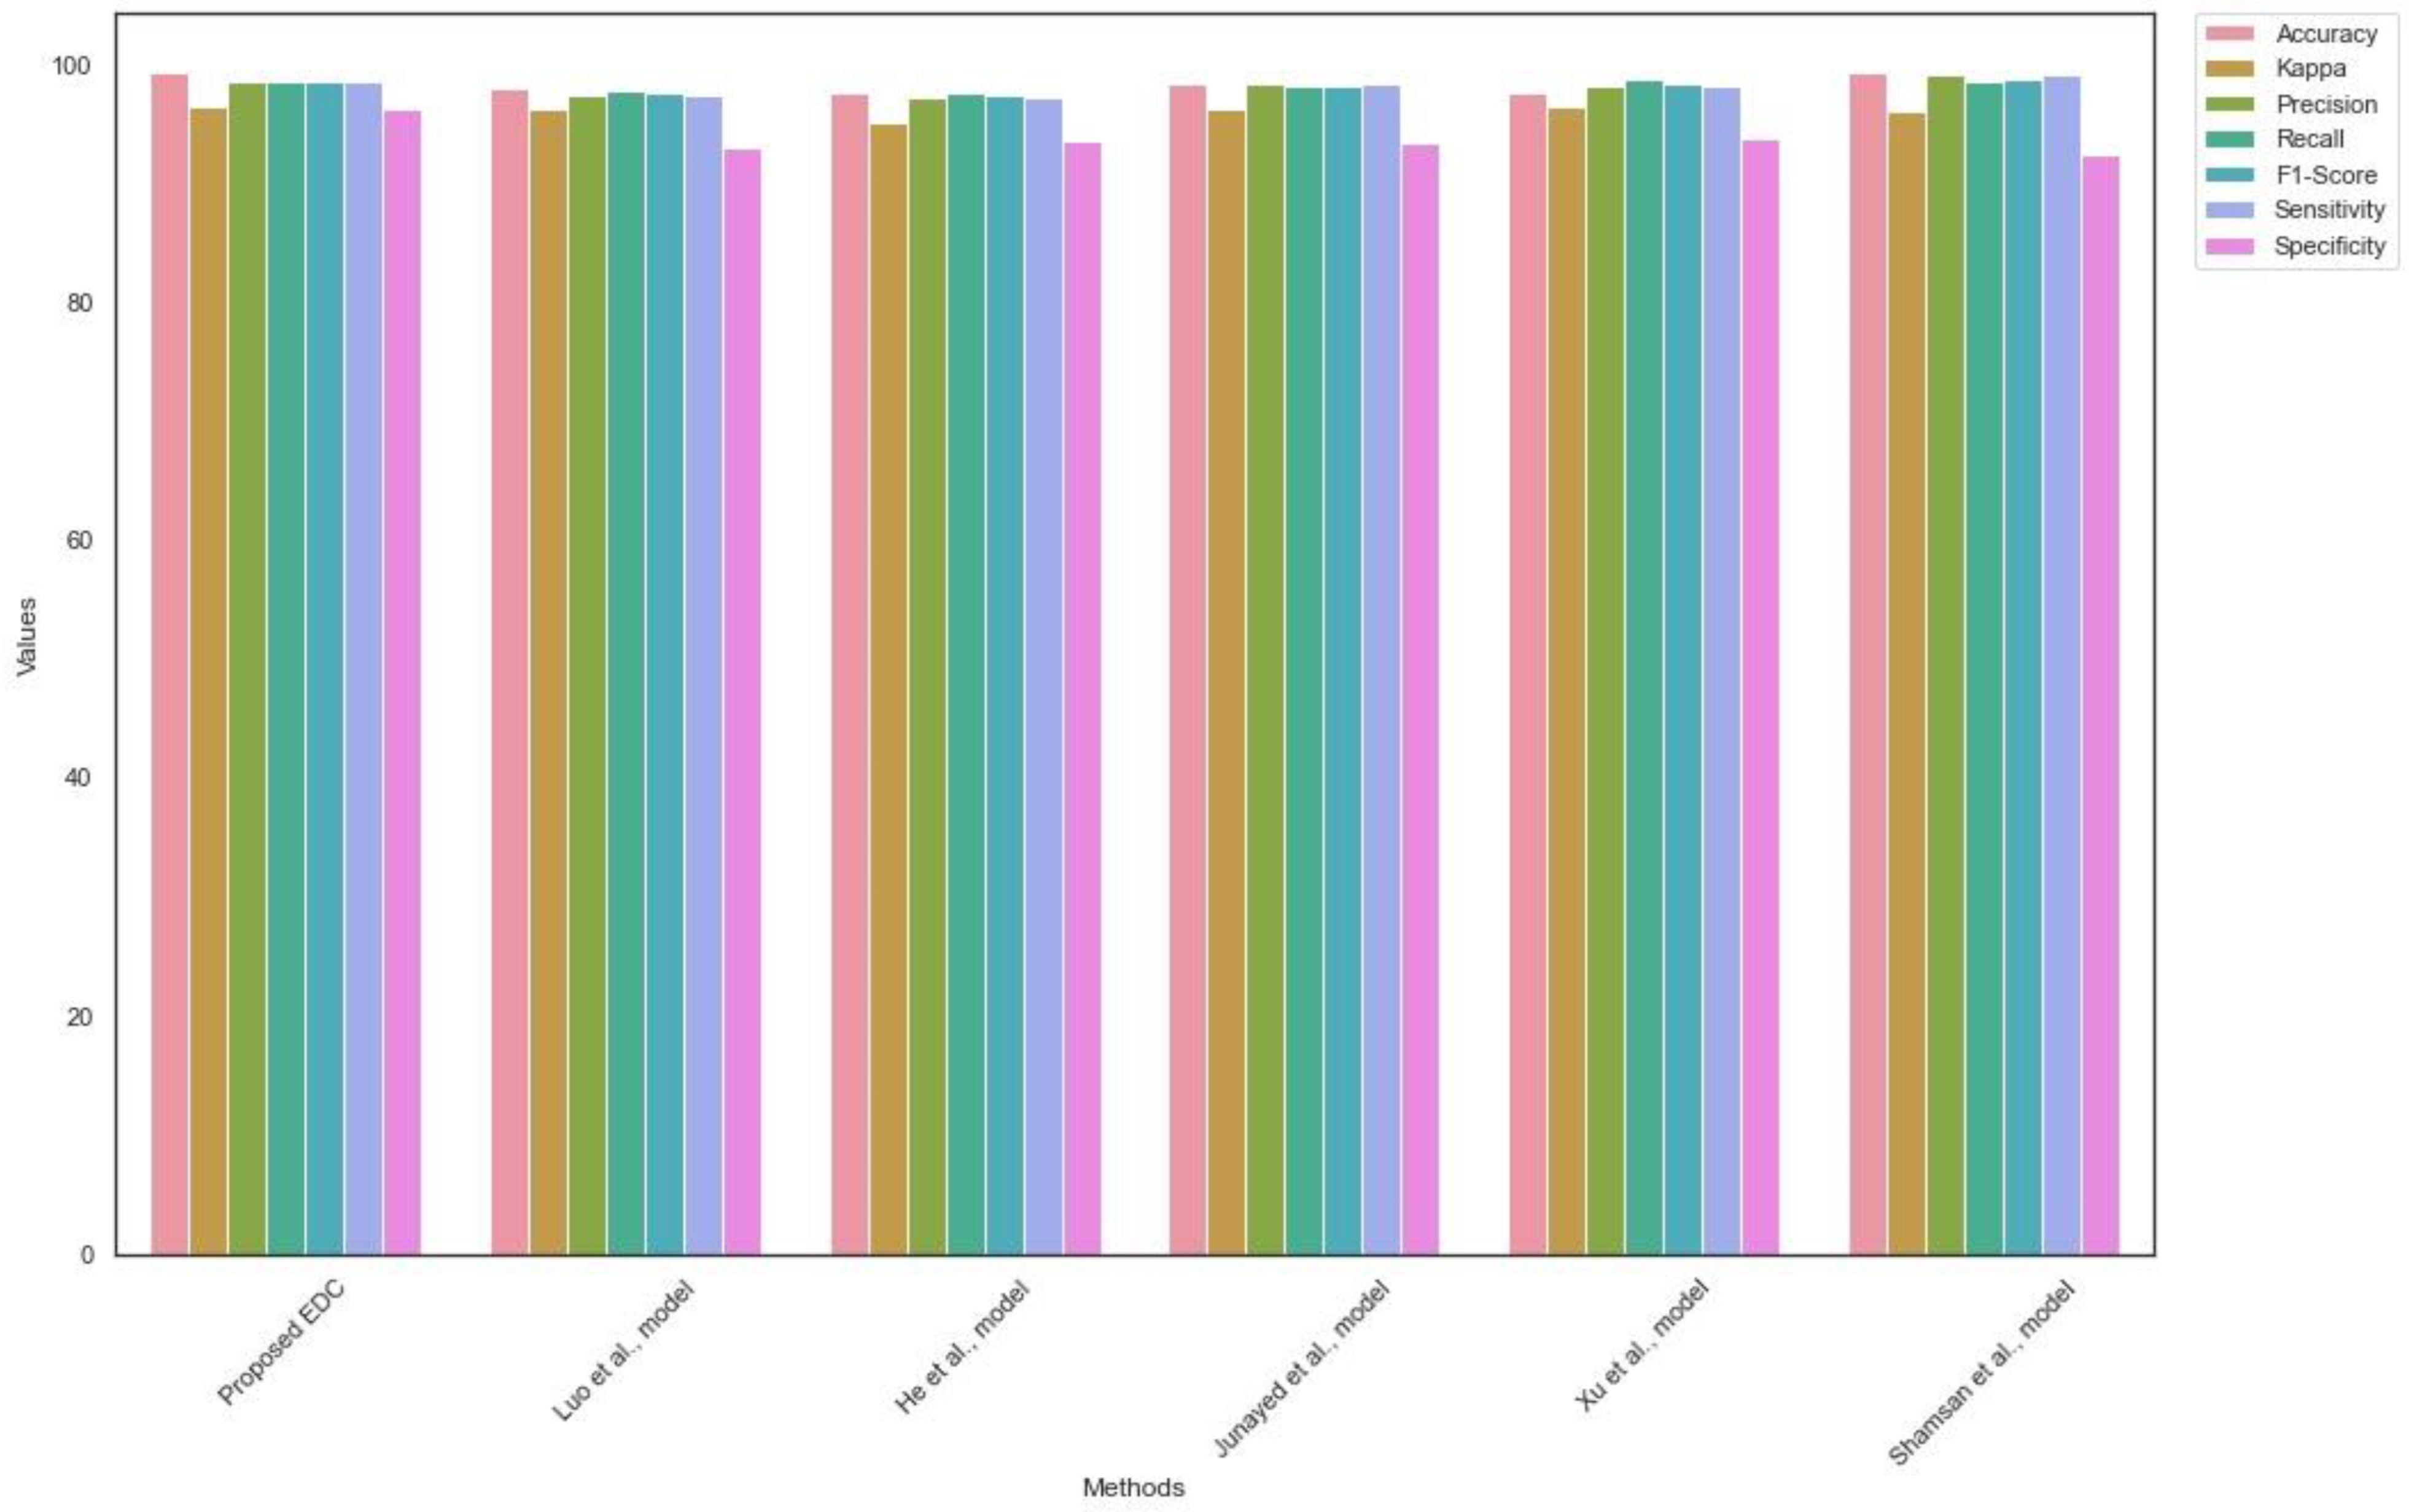
Table 5 reveals the findings of EDC generalization on the ODIR dataset. The proposed EDC outperformed the existing state-of-the-art techniques. The higher values of precision, recall, and F1-score highlight the significance of the proposed EDC model. The proposed model efficiently handled the true positives, true negatives, false positives, and false negatives.
Figure 7 shows the outcomes of comparative analysis for the ODIR dataset.
Likewise,
Table 6 shows the outcome of the EDC generalization using the EDC dataset. The proposed EDC model obtained a superior outcome and addressed the limitations of the existing EDC. The proposed model achieved a higher Kappa value compared to the current models. The findings suggest the efficiency of the proposed multi-class classification model.
Figure 8 highlights the results of the generalization of EDC on the EDC dataset.
Table 7 reveals the MAD and RMSE values of the proposed EDC model. The lower value of MAD represents the importance of the suggested EDC in classifying the real-time images. It is evident that the proposed model predicted multi-class images with high accuracy and lower error rates. In addition, the RMSE value shows that the proposed EDC model can handle the outliers and produce an optimal outcome.
Lastly,
Table 8 highlights the CI and SD of the EDC. The outcome highlights the significance of the proposed model in dealing with uncertainties. It indicates the reliability of the proposed model’s decisions. In addition, it shows that the model can deliver a helpful outcome in the real-time environment.
5. Discussion
The authors proposed a DL-based EDC for classifying the fundus images in this study. CLAHE and denoising autoencoders were employed to improve the image quality. The feature extraction was performed using the SSD technique. An improved WOA was employed to select the key features. The ShuffleNet V2 model was fine-tuned in order to classify the fundus images.
In medical image processing pipelines, image pre-processing is a crucial step. The utilization of image enhancement techniques enhances the visual quality of medical images. Additionally, it plays an essential role in improving the accuracy and dependability of subsequent analysis, diagnosis, and clinical decision-making processes. The author applied the CLAHE to cover the image’s maximum range. The denoising autoencoders technique helped the study to produce high-quality images using encoders and decoders. The proposed data augmentation technique increased the diversity of training data in order to improve the performance of the proposed EDC model. In feature extraction and selection, the SSD technique is used to extract features from complex images. The detection head technique has assisted the proposed model in extracting the key patterns of eye diseases. The minor spots were identified during this process. In addition, WOA, with the Levy Flight and Wavelet strategy, selected the critical features for classifying eye diseases.
Furthermore, the ShuffleNet V2 model was fine-tuned using the AO algorithm. The ShuffleNet V2 architecture contains fewer convolutional layers that help the proposed model to produce an effective outcome with limited resources. Moreover, the feature extraction and selection approaches assisted the ShuffleNet V2 model in generating the results with minimal convolutional layers.
Table 2 shows the significance of the proposed EDC in classifying the fundus images. The proposed feature selection process minimized the features and assisted the proposed EDC in identifying eye diseases with fewer computational resources. Due to the hyper-parameter optimization and feature selection, the proposed EDC required a lower number of parameters and FLOPs with a learning rate of
.
Table 3 and
Table 4 outline the performance evaluation of the proposed EDC. The proposed EDC achieved an accuracy of 99.1 and 99.4 for ODIR and EDC datasets, respectively. Compared to the EDC dataset, the ODIR dataset comprises fewer images. However, the proposed EDC performed exceptionally on the EDC and ODIR datasets.
Table 5 and
Table 6 show the findings of the comparative analysis. The proposed EDC outperformed the recent EDC models by achieving optimal accuracy and sensitivity. The proposed feature extraction and selection techniques played a significant role in improving the efficiency of the proposed model.
Table 7 highlights the outcome of the loss function. The AO hyper-parameter optimization fine-tuned the shuffleNet V2 model’s parameters to overcome the challenges in classifying the fundus images with fewer FLOPs and parameters. Finally,
Table 8 outlines the statistical significance of the proposed EDC. The proposed EDC generated outcomes with SD values of 0.0021 and 0.0091 for the ODIR and EDC datasets. The findings outline the capability of the proposed EDC to deliver a high-standard outcome.
He et al. [
35] employed a spatial correlation technique for extracting features. The technique used pixel-wise comparison for feature extraction. A dense correlation network was used for the image classification. In contrast, the author used an effective image pre-processing technique to improve the image quality. Moreover, the proposed model achieved a superior accuracy compared to the He et al. model.
Junayed et al. [
37] developed a deep neural network model for detecting cataracts from fundus images. They optimized the network using AO. Similarly, the proposed EDC model applied AO for tuning the hyper-parameters of the ShuffleNet V2 model. However, the proposed EDC model outperformed the Junayed et al. model.
Xu et al. [
38] followed a hierarchical DL approach for glaucoma diagnosis. They employed cup-to-disk ratio vectors for the image classification. The larger number of vectors reduced the performance of the classifier. On the other hand, the author followed the feature extraction and selection approaches for generating the feature sets and improved the overall prediction accuracy of the proposed EDC model. Luo et al. [
39] proposed DL-based ophthalmic disease detection. They used focal loss and correntrophy-induced loss function to overcome the data imbalances of the complex datasets. In contrast, the author employed data augmentation and compelling image pre-processing approaches to address data bias.
Shamson et al. [
40] employed principal component analysis for feature extraction. They used MobileNet and DenseNet 121 models to fuse the features to classify the images. On the other hand, the authors employed the lightweight version of the ShuffleNet model and obtained exceptional prediction accuracy.
The authors addressed the challenges in classifying the fundus images. The existing studies required substantial computational resources to obtain a reasonable outcome. In contrast, the proposed research achieved an exceptional outcome with limited resources. The generalization of the proposed method was performed on ODIR and EDC datasets, respectively. The findings reveal the significance of the proposed model in EDC. The proposed model can be implemented in remote places. In addition, it can be developed as a mobile application and assist clinicians in treating patients.
The proposed feature extraction and EDC play a significant role in the automation of diagnosing and evaluating different eye conditions. The feature extraction process discovers and extracts pertinent information from fundus images for classifying ocular diseases. It minimizes data dimensionality while maintaining essential data. The extracted feature enables the machine learning model to prioritize necessary data, consequently enhancing the manageability of the categorization operation. The suggested EDC detects eye diseases, including diabetic retinopathy, glaucoma, and cataracts. The proposed model can identify particular patterns or irregularities within the eye, such as detecting exudates or hemorrhages. In healthcare settings, these methods may improve the speed and precision of diagnosing and monitoring eye diseases.
The proposed model has a substantial impact on EDC. It was trained to recognize critical patterns, structures, and anomalies in retinal or fundus images to classify eye diseases. It can capture hierarchical and abstract characteristics by employing several layers of convolution, pooling, and non-linear activation functions. The basic features, including edges, textures, and shapes, were utilized to train the proposed model. The proposed classifier is data-driven and can learn from massive annotated image datasets. This ability enables the proposed model to classify novel data without additional training, which is crucial in medical imaging applications. The ShuffleNet model was pre-trained on large, general-purpose datasets. However, the authors fine-tuned the model with AO. The ShuffleNet architecture exhibits scalability and efficiently analyzes a substantial quantity of retinal data. This scalability is significant for healthcare providers and screening programs handling a massive volume of patients. The proposed model facilitates the continuous monitoring of ocular diseases. It can monitor the retinal images over time and notify physicians of any modifications that may indicate a demand for treatment. In addition, it can assist in driving forward research efforts in medicine.
While implementing the proposed model, the authors encountered a few limitations. Identifying small lesion patterns of ocular disorders may present difficulties for the proposed EDC due to image noise or other anatomical features. The datasets were highly imbalanced. In the ODIR dataset, the numbers of glaucoma and cataracts images were lower than those of the remaining diseases. However, the authors addressed the limitation using the effective data augmentation technique. The proposed EDC may face challenges in classifying multiple ocular disorders that may present in a single image. The quality of the fundus images was poor. Images were unique in size and clarity. Extensive image processing was required to normalize the images. The proposed model was generalized using two benchmark datasets. Implementing CNN models with minimal latency may be technically challenging. The proposed EDC may demand additional training in order to classify the real-time images.
In the future, the model’s overall performance can be improved using ensemble techniques, including boosting or bagging, oversampling the minority class, undersampling the majority class, or using loss functions involving the minority class to address class imbalance. In order to mitigate overfitting and enhance the generalization capabilities of the model, regularization methods such as dropout, L1/L2 regularization, or batch normalization can be employed. To build clinician trust, interpretable DL models can be used to justify the proposed model decisions.


.png)


