Abstract
Smart farm technology contributes to sustainable environmental protection, and so it is important to investigate consumer behavior in this regard. Therefore, this paper constructs a theoretical model focusing on the consumers of indoor smart farm restaurants. The theoretical framework integrates the theory of planned behavior and the perceived risk theory. The constructed framework is deepened by testing the moderating role of novelty seeking in the effects of perceived risks on attitudes. The results revealed that (1) psychological and quality risks negatively affect attitude, (2) subjective norm positively affects attitude, (3) attitudes, subjective norm, and perceived behavioral control positively affect behavioral intentions, and (4) the moderating impact of novelty seeking was discovered in the relationship between psychological risk and attitude. This is the first investigation of the perceived risks of indoor smart farm restaurants, and this study empirically proved the moderating role of novelty seeking in the risk-taking behavior context. This study consequently contributes to advancing state-of-the-art methods and presents practical marketing recommendations.
1. Introduction
Smart farming is regarded as an innovative solution in regard to threats to global food security [1,2,3]. Agricultural yield ability needs to be raised by larger than 25% because of the growing population [4,5]. A smart farm is an indoor vertical agriculture using an Internet of Things (IoT) system, which includes an automated water supply and sunlight control [6,7,8]. Smart farming requires around 95% less water than traditional farming. Also, it is a lot more productive because it can operate every day of the year, which is due to being independent of climatic events as well as either animal or insect damage [9,10]. Smart farming can involve growing crops in urban centers or nearby areas, so smart farming increases the freshness and the quality of food ingredients as well as decreases contamination risks [11,12].
Several foodservice enterprises have launched restaurants that operate smart farms inside their restaurants [13,14,15]. For instance, an agriculture tech startup in South Korea, which is called N. Thing, opened their flagship restaurant, which is called Sikmulsung, with an indoor smart farm system [13]. This restaurant serves salads and vegetable-based beverages using agricultural ingredients that grow in its indoor smart farm. A dining brand Interval also launched a restaurant using smart farms in Hong Kong [14]. Farmers and Chefs in New York in addition to Weilands and Good Bank in Berlin are also using agricultural ingredients that are grown from their smart farms [15]. Joo, Lee, and Hwang [16] defined such types of dining, which use smart farms in order to produce food ingredients in their store, as indoor smart farm restaurants (ISFR). According to the diffusion of innovations theory [17], it is important to find consumers’ various adoption patterns towards new technology and understand their structures, but a social-scientific study about consumer behavior in the context of ISFR is insufficient.
The theory of planned behavior (TPB), suggested by Ajzen [18], is undoubtedly a robust theoretical framework in regard to predicting consumer behavior, but the original TPB was limited to three predictors, which included attitude, subjective norm, and perceived behavioral control, and they might not be able to fully predict consumer behavior. Thus, Joo et al. [16] proposed a framework that merges the TPB and the norm activation model in the context of ISFR. Their research successfully investigated consumers’ pro-environmental behavior, but it overlooked their negative perceptions, which are the hindrances of consumer behavior. Consumers tend to be hesitant to try emerging technology-based products/services because they have no experience with them [19,20,21]. This perception of unexpected negative outcomes is referred to as perceived risk [22,23,24]. The perceived risk theory, which will hereinafter be referred to as PRT, has consistently been applied to predict consumers’ behavioral intentions because it is an essential barrier in regard to consumption [25,26,27]. There has recently been a growing number of studies in regard to understanding consumer behavior based on the PRT in the field of new technology [28,29,30]. For instance, Hwang and Choe [28] examined the perceived risks of drone delivery service and their outcomes. Seo and Lee [29] investigated the perceived risks of service robots at restaurants, and they identified their negative impact on consumer behavior. It implies that individuals tend to have unfavorable attitudes when they are worried about the negative consequences of specific products or services [21,31,32,33]. The innovation resistance theory states that consumer resistance towards new technology plays a crucial role in regard to shaping the success or failure of technological innovations [34]. Existing studies on adoption behavior towards new technology imply a prominent role of perceived risks from the perspective of innovation resistance [28,29,30], but there are still no empirical studies about the perceived risks of ISFR. As a result, this study proposes a framework that combines the TPB and the PRT.
Consumers who are seeking novelty tend to favor emerging technology-based products [35,36]. The concept of novelty seeking is the stimulus that consumers with a high level of innovativeness have a desire to try unusual/novel products [37]. Goo et al. [38] found that consumers with high novelty seeking are more likely to positively evaluate smart tourism technologies. Consumers who are seeking novelty are experimental and try new stimulating challenges, such as purchasing new products or services that they have not experienced [39]. Berlyne [40] also stated that an individual who seeks novelty is willing to try new products/services even though there are some potential risks. This means that consumers seeking novelty can possibly try and be favorable to new products or services even if there are unexpected risks. Hence, this study deepened the proposed framework by testing the moderating impact of novelty seeking between perceived risks and attitude.
In summary, the objectives of this study include (1) investigating the perceived risks of ISFR, (2) combining PRT and TPB, and (3) intensifying the framework by demonstrating the moderating effect of novelty seeking. This paper contributes to advancing state-of-the-art methods by investigating the perceived risks of ISFR for the first time, and it empirically identifies the moderating role of novelty seeking in the risk-taking behavior context. This paper also suggests practical marketing recommendations for ISFR managers.
2. Literature Review and Hypothesis Development
2.1. Research Background: ISFR
Standard population projections imply that agricultural yield ability should be raised by 1.5 times, because of population growth and global warming [41,42]. One approach in regard to increasing the productivity per unit area is vertical farming, which involves cultivating crops hydroponically in stacked trays [43,44]. Smart farming, which is innovative vertical farming that uses IoT-based automation systems to control environmental factors, such as light/water/air controlling to improve productivity/efficiency, has significantly improved production efficiency [5,16,45]. Smart farming is estimated to be 40 times more efficient than traditional agriculture [46]. The demand for smart farming is highly raised because of labor shortages during the COVID-19 pandemic [47]. Thus, smart farming is regarded as an innovative solution to threats to global food security [1,2,3].
The integration of smart farming technology into the foodservice sector has been observed in Asia/Europe/America [13,14,15]. As an explained earlier, Joo et al. [16] defined this type of dining as ISFR. Their study examined potential consumers’ pro-social behavior by applying the norm activation model. Joo and Hwang [48] also examined ISFR consumers’ pro-social behavior by applying four cognitive drivers (i.e., biospheric value, environmental concern, problem awareness, and ascription of responsibility). They found that these four factors significantly form behavioral intentions. They also intensified their study by testing significant differences in the four factors according to demographics.
The diffusion of innovations theory implies that it is important to find consumers’ various adoption patterns towards new technology as well as understand their structures [17]. The existing studies investigated consumer behavior in the context of ISFR, but they have a limited aim towards pro-social behavior as well as overlooking consumers’ negative perceptions towards new technology. They require an extended social-scientific study in the context of ISFR.
2.2. The Perceived Risk Theory (PRT)
Consumers assess potential risks based on their personal experiences and knowledge, so they are more likely to perceive higher risks when they make unfamiliar purchases [49,50]. Thus, consumers may be concerned about unexpected negative outcomes when they use new technology-based products/services [20,21,31]. The PRT is a concept in consumer behavior that explains how consumers evaluate the potential negative outcomes of their purchasing decisions [49,50]. This perception of unexpected negative outcomes is referred to as perceived risk [22,23,24]. In other words, it refers to the nature and amount of risk perceived by consumers in contemplating a specific purchase decision [50]. The innovation resistance theory states that consumer resistance towards new technology plays a crucial role in regard to shaping the success or failure of technological innovations [34]. The existing studies on the adoption behavior towards new technology imply a prominent role of perceived risks from the innovation resistance perspective [28,29,30], but there are still no empirical studies on the perceived risks of ISFR. This study thus adopted the PRT and investigated the multi-dimensions of perceived risks of ISFR. Mitchell [24] described the types of perceived risks by including the social, financial, physical, performance, time, and psychological risks.
First, social risk is defined as “the risk that the selection of the service provider will affect in a negative way the perception of other individuals about the purchaser” [24] (p. 27). For instance, when consumers consider using edible insect restaurants, they can be worried that eating insects would change what their friends think of them [51]. Consumers also can be worried that purchasing second-hand clothing would not match their social status in life [52]. This means that social risk relates to an individuals’ social status. However, using ISFR is regarded as prosocial behavior due to sustainable environmental protection [16,48], so the current study did not adopt the concept of social risk.
Second, financial risk refers to “the risk that the service purchased will not attain the best possible monetary gain for the consumer” [24] (p. 27). For example, consumers can be worried that using drone delivery services would be more expensive than they expect [19]. Travelers also may be worried that cruise tours would involve unexpected extra expenses [53]. It can be interpreted that consumers are worried about the value of what they paid for a specific product/service. The consumers’ experience using ISFR is insufficient, so they also can perceive financial risks.
The third and fourth dimensions of PRT include the physical and performance aspects. Mitchell [24] (p. 27) explained that physical risk is “the risk that the performance of the service will result in a health hazard to the consumer.” Also, performance risk is “the risk that the service purchased will not be completed in the manner that will result in customer satisfaction.” In other words, these dimensions reflect the extent that consumers are concerned about the low quality of a particular product or service. For instance, Hwang and Choe [51] measured the quality risk that consumers are concerned with regarding the quality of the menu items using edible insects. Nguyen et al. [54] also investigated the quality risk when consumers considered purchasing food products during the COVID-19 pandemic. These quality risks negatively influenced consumer behavior in each study. The consumers have insufficient experience using ISFR, so they would be worried about the quality of the menu items using agricultural ingredients that are produced by smart farms. Thus, the current study adapted the concept of quality risk in the context of ISFR.
The fifth dimension of PRT is time risk, which is defined as “the risk that the consumer will waste time, be inconvenienced, or waste effort in regard to getting a service redone” [24] (p. 27). Consumers spend their time and effort gaining information when they use new products/services that they have not experienced [19,55]. The consumers are concerned that planning to use new technology-based products/services, such as robotic restaurants and drone delivery services, would take too much time [21,28]. It can be inferred that ISFR consumers can also worry that planning to dine out and visit would be a waste of time.
Lastly, psychological risk means “the risk that the selection or performance of the producer will have a negative effect on the consumer’s peace of mind or self-perception” [24] (p. 27). Individuals tend to perceive risks, such as anxiety about negative outcomes and unnecessary tension when facing new technologies that they have not previously experienced [56]. For example, consumers can feel psychologically uncomfortable when they consider eating genetically modified food [57]. Consumers can also feel unwanted anxiety when they use drone delivery services [19]. The consumers fear and distrust new technology-based food products [58,59], so ISFR consumers can also feel psychological risk. In summary, the current study adopted the PRT, which includes the concepts of (1) financial risk, (2) quality risk, (3) time risk, and (4) psychological risk.
Previous studies investigated the outcomes of perceived risks in the consumer behavior context. Hwang and Choe [51] found that quality, psychological, health, time, and social risks play negative roles in regard to shaping an edible insect restaurant’s dining image. Choi et al. [31] identified that perceived hygiene, environmental risks, and health risks of street foods form the consumers’ negative attitudes. The concept of attitude (AT) is the consumers’ favorable/unfavorable evaluation of a particular object/behavior [18]. Hwang et al. [21] also proved that privacy, financial, time, performance, and psychological risks lead to the consumers’ negative attitudes towards robotic restaurants.
Individuals tend to more heavily weigh potential losses than potential gains when they make decisions under risk according to the prospect theory in regard to economics [60]. Thus, consumers may exhibit a negative attitude towards a particular product or service if they perceive a higher level of risk being associated with it. The existing studies also support the negative effect of perceived risks on attitudes [21,31]. The current study hypothesized the effect of perceived risks of ISFR on the consumers’ attitudes, which is based on the discussions above.
Hypothesis 1 (H1).
Perceived risks play a negative role in regard to forming AT.
2.3. The Theory of Planned Behavior (TPB)
Fishbein and Ajzen [61] first suggested the theory of reasoned action (TRA), and Ajzen [18] expanded this theory to the TPB. The TRA explains the individuals’ volitional behavior with two predictors, which include attitude and subjective norm [62,63]. The concept of attitude (AT) is the degree of the positive or negative evaluation of a particular object/behavior, which is explained above [18]. Subjective norm (SN) is defined as “the perceived social pressure to perform or not to perform a behavior” [18] (p. 188). The TPB suggests the concept of perceived behavioral control (PBC) as a predictor of behavioral intentions (BI) in addition to AT and SN. This concept is the degree of ease/difficulty in regard to performing a specific action, and this explains an individuals’ non-volitional behavior [18]. In summary, the TPB explains the causal effects of the three variables, which include AT, SN, and PBC, on an individual’s behavioral intention.
Previous studies adopted the TPB and successfully investigated consumer behavior in the context of new technology-based services, such as delivery drones/robots and robotic restaurants [64,65,66]. For instance, Choe et al. [64] discovered that AT, SN, and PBC positively affect behavioral intentions in the context of robotic restaurants. Hwang et al. [65] also proved the effects of AT, SN, and PBC on behavioral intentions in the context of drone delivery services. Yuen et al. [66] investigated the consumers’ acceptance behavior of autonomous delivery robots in urban cities. Their study indicated that AT, SN, and PBC play a crucial role in regard to forming the consumers’ behavioral intentions. The current study hypothesized three causal relationships in the TPB context.
Hypothesis 2 (H2).
AT positively affects BI.
Hypothesis 3 (H3).
SN positively affects BI.
Hypothesis 4 (H4).
PBC positively affects BI.
The extant studies also suggested and proved the causal effect of SN on AT because other people’s perceptions of a specific behavior can affect an individual’s evaluation of a behavior [67,68,69]. Schepers and Wetzels [70] also emphasized the important role of SN in the context of the technology acceptance behavior, and they proved the causal effect of SN on AT towards using new technology. In other words, if individuals perceive that it is socially acceptable for others to adopt new technologies, they tend to have a favorable AT towards using the new technologies themselves. The current study hypothesized the effect of SN on AT, which is based on the discussions above.
Hypothesis 5 (H5).
SN positively affects AT.
2.4. Moderating Impact of Novelty Seeking
Novelty seeking is the stimulus that consumers with a high level of innovativeness desire to try unusual/novel products [37]. It can motivate consumers to try new things which they would not consume in their ordinary lives [71]. Consumers who are seeking novelty are experimental, and they try new stimulating challenges, such as purchasing new products or services that they have not experienced [39]. Consumers with high novelty seeking tend to look favorably on technology [72], so the investigation of the consumers’ novelty seeking is important in regard to new technology-based products/services. Hwang et al. [73] discovered that consumers with high novelty seeking have favorable attitudes towards using drone delivery services when ordering food. However, Kim et al. [36] identified that novelty seeking has no statistically significant effect on the overall image of robotic restaurants, whereas quality and hedonic experience seeking are important in regard to forming the overall image. Restaurants inherently provide good quality foods and services, so novelty seeking might not directly influence the evaluation of new technology-based restaurants.
Some studies in consumer behavior focused on the concept of novelty seeking as a moderator as opposed to a predictor. For example, Ji et al. [74] found that the consumers’ novelty seeking significantly strengthened the effect of the neophilic tendency on food satisfaction. Wong and Zhao [75] also identified that high-novelty seekers show a greater path coefficient of the relationship between frequency of visits and travel spending than low-novelty seekers. These types of studies demonstrated the moderating roles of novelty seeking that strengthen positive relationships in regard to consumer behavior, but there are no studies where novelty seeking weakens a negative relationship.
Novelty seeking is also regarded as an important factor in the risk-taking behavior context [76,77,78]. Berlyne [40] stated that an individual who seeks novelty is more willing to try new products/services and take risks. Zuckerman and Neeb [79] also support this finding by delving into the different dimensions of sensation seeking and discussing its implications in various areas of life, which include risk-taking behavior. This means that novelty seeking can weaken it despite perceiving certain behaviors as being negative due to potential risks. It can be inferred that consumers perceive the risks of ISFR, but consumers with high novelty seeking would have more favorable attitudes towards using ISFR than consumers with low novelty seeking. The current study thus proposed the hypothesis below in regard to the moderating role of novelty seeking.
Hypothesis 6 (H6).
Novelty seeking weakens the negative effect of perceived risks on AT.
3. Methods
3.1. Quantitative Approach
The current study employs a quantitative methodology in order to test research hypotheses. First, this study proposes the hypothesis model in Figure 1, which follows the proposed hypotheses. Closed-ended questions were used in order to measure the main constructs of this study for the quantitative analysis. An exploratory factor analysis (EFA) was conducted in this study according to Churchill’s [80] procedure in order to determine the sub-dimensions of the perceived risks. The EFA was conducted using a principal component analysis (PCA) by using SPSS 22.0 software. Next, this study conducted the two-step approach by Anderson and Gerbing [81], which first involved testing a measurement model using a confirmatory factor analysis (CFA) in order to verify the data fit/quality. After that, structural equation modeling (SEM) was used in order to test the causal relationships. Lastly, a multiple-group analysis was performed in order to test the moderating role of novelty seeking. The CFA, SEM, and multiple-group analysis were performed using AMOS 22.0 software.
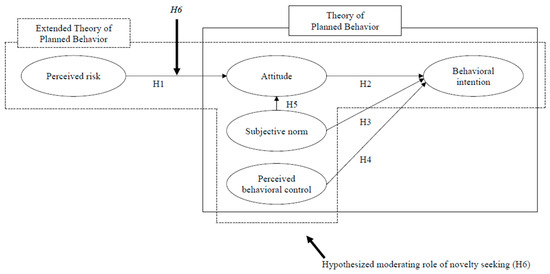
Figure 1.
Research model.
3.2. Mesures
The current study employed measurement items that were drawn from prior studies. First, perceived risks, which include psychology, quality, financial, and time, employed 12 items that were drawn from Choe et al. [19] and Hwang et al. [21]. Second, the four constructs of the TPB, which include attitude, subjective norm, perceived behavioral control, and behavioral intentions, each employed three items, and a total of twelve items were drawn from Ajzen [18] and Joo et al. [16]. Lastly, novelty seeking employed three items that were drawn from Hwang et al. [73] and Kim et al. [36]. A total of 27 items were measured by using a 7-point Likert scale (1: strongly disagree–7: strongly agree).
3.3. Data Collecting
The online data for this study was collected from South Korean consumers via a survey conducted by a prominent surveying company. The survey company boasts a vast panel of 1.5 million participants. A total of 5792 panel members who had dined out in the past six months were selected to receive an email survey, and 330 among them chose to participate in the survey. The respondents were asked to watch videos about smart farms for approximately three minutes and read articles about ISFR technology prior to starting the survey. The respondents were provided with a reward, which was valued less than US$1, when they completed the survey. The current study removed 16 outliers due to multivariate problems by testing the Mahalanobis distance, so 314 samples were used for the statistical analysis.
4. Results
4.1. Frequency Analysis
The profiles of the respondents are shown in Table 1. The male and female respondents each had the same proportion at 50% (n = 147) out of the 314 respondents. The average age of the respondents was 36.89 years. The majority of the respondents (53.2%) were single (n = 167) and 61.8% had a bachelor’s degree (n = 194).

Table 1.
Profile of survey respondents (n = 314).
4.2. Principal Component Analysis (PCA)
The current study employed a PCA in order to assess the perceived risks associated with ISFR, which is presented in Table 2. The PCA results revealed the extraction of four factors with eigenvalues that exceeded 1.0, which included the psychological, quality, financial, and time risks, and which were consistent with the existing theoretical background. The Kaiser-Meyer-Olkin (KMO) measure of sampling adequacy yielded a value of 0.861, which indicated the suitability of the factor model. Moreover, the factor model accounted for 89.404% of the variance. All items demonstrated factor loadings higher than 0.767. Lastly, Cronbach’s alpha values exceeded 0.70, which indicated a high level of reliability [82].
Table 2.
PCA for the PRT in the ISFR context.
4.3. Conceptual Model Revision
The PCA extracted the four perceived risks of ISFR and confirmed their reliability, so the research model was revised (see Figure 2).
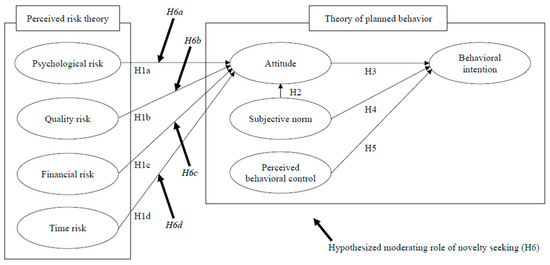
Figure 2.
Proposed model revision.
4.4. Confirmatory Factor Analysis (CFA)
The current study conducted the CFA by using the maximum likelihood estimation (MLE) (see Table 3). All standardized factor loadings were equal or greater than 0.743 and significant at p < 0.001.
Table 3.
CFA: items and loadings.
The results indicated that the model fits the data well (χ2(221) = 484.627, χ2/df = 2.193, p < 0.001, IFI = 0.963, CFI = 0.963, TLI = 0.953, and RMSEA = 0.062) [81,83], which is presented in Table 4. The results showed that the internal consistency (CR > 0.7), convergent validity (AVE > 0.5), and discriminant validity (correlation2 < AVE) satisfied the thresholds [84,85].
Table 4.
CFA: items and loadings.
4.5. Structural Equation Modeling (SEM)
The one-factor test, suggested by Harmon, was used in order to test if a common method bias (CMB) exists in the current study before SEM [86]. The test revealed that total variance was accounted for by a single factor less than 0.5, so there was no CMB issue. The current study conducted an SEM using the MLE, and the result is shown in Table 5. The results indicated that the model fits the data well (χ2(237) = 609.820, χ2/df = 2.573, p < 0.001, IFI = 0.948, CFI = 0.947, TLI = 0.939, and RMSEA = 0.071) [81,83]. The results also indicated that six paths were statistically significant, and two paths were not. PR (β = −0.247 and t = –3.876) and QR (β = −0.229 and t = –3.418) more specifically negatively affect AT, so H1a and H1b were supported. However, FR and TR had no significant effects on AT (p > 0.05), so H1c and H1d were rejected. AT (β = 0.457 and t = 8.644), SN (β = 0.176 and t = 3.661), and PBC (β = 0.574 and t = 9.617) positively influence BI in the TPB, and SN (β = 0.430 and t = 7.859) also positively affect AT. Thus, H2, H3, H4, and H5 were also supported.
Table 5.
The results of SEM.
4.6. Multiple-Group Analysis
The current study performed a multiple-group analysis in order to test the moderating role of novelty seeking in the relationship between perceived risks and AT. The data (n = 314) from this study was distinguished into two groups according to the average value of novelty seeking: (1) consumers with a high level of novelty seeking (n = 159) and (2) consumers with a low level of novelty seeking (n = 155). The nested model comparisons test was conducted before multiple-group analysis, and the result satisfied the threshold that the ΔCFI between the unconstrained and measurement weights is lower than 0.01 [87]. The chi-square difference (Δχ2) between the unconstrained and constrained models was used in order to identify the moderating effect, and Δχ2 should be greater than 3.84 to support it, for which the result is shown in Table 6. The results indicated that Δχ2 in the unconstrained and constrained models were found to be statistically significant at the 0.05 level in the relationship between psychological risk and attitude (Δχ2 = 11.237), so H6a was supported. However, the other relationships, which included quality risk—attitude, financial risk—attitude, and time risk—attitude, revealed that their Δχ2 are less than 3.84, so H6b, H6c, and H6d were rejected. The results of the current paper are summarized in Figure 3.
Table 6.
Results for the moderating impact of novelty seeking.
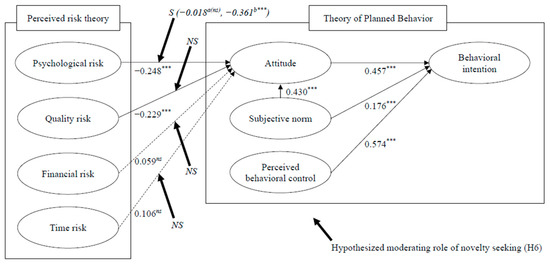
Figure 3.
Standardized theoretical path coefficients. Notes: *** p < 0.001, ns = not significant, S = supported and NS = not supported, a path coefficient for the group with a high level of novelty seeking, and b path coefficient for the group with a low level of novelty seeking.
5. Conclusions
5.1. Discussions
The current study constructs a theoretical framework that focuses on the consumers of ISFR by integrating the PRT into the TPB. The constructed framework was strengthened by postulating the moderating role of novelty seeking in the effects of perceived risks on attitudes. The proposed hypotheses were tested by performing a quantitative methodology. The results revealed that psychological and quality risks negatively affect AT, SN positively affects AT, and the three predictors of TPB, which include AT, SN, and PBC, positively affect behavioral intentions. Lastly, the moderating impact of novelty seeking was discovered in the relationship between psychological risk and attitude. In other words, the consumers’ concerns about the psychological and quality aspects of ISFR evoke unfavorable attitudes, and the consumers’ novelty-seeking characteristics weaken the negative effect of psychological risk on AT. Also, the consumers’ AT, SN, and PBC play a positive role in regard to forming behavioral intentions in the context of ISFR.
The effect of SN on BI is often rejected in the green food purchases context [16,88,89]. Nevertheless, subjective norms can also play a crucial role in the technology acceptance behavior context [68]. This study demonstrated that the ISFR consumers’ SN forms BI from the perspective of technology acceptance behavior as opposed to pro-environmental behavior.
However, the two hypotheses of the negative effects of financial and time risks on AT were statistically rejected. These results are not in line with Hwang et al. [21]. Their study revealed that the financial and time risks of robotic restaurants had negative effects on AT. The current study and their study involve investigations into the context of new technology-based restaurants, but they have subtle differences. One of the advantages of smart farms is economics, which is according to productivity, so the consumers’ perceived financial risks might be not important in regard to forming attitudes towards ISFR. On the other hand, consumers might perceive that companies can provide robot services at expensive prices, because the robots require significant initial investments in regard to research and development. Thus, the financial risk of robot services might play a crucial role in regard to forming negative AT during the initial stages of implementation. Nonetheless, the financial risk of robot services is not presently important in regard to forming AT, because robot services have more labor cost-effectiveness compared to human staff and tips are not required [90,91]. In addition, consumers may take time to learn how to use robot services when they plan to dine out at robotic restaurants, which is unlike ISFR. Planning to dine out at an ISFR also takes time, which includes searching for information about ISFRs as well as finding the restaurants. Also, the consumers do not have to be burdened with learning how to use technology, such as kiosks or robots. Thus, it may result in the time risk of an ISFR not playing a negative role in regard to forming AT, which is unlike robot services.
5.2. Theoretical Implications
First of all, the current study applied the PRT in the ISFR context for the first time. This study focused on the perceived risks of ISFR, and it adopted four types of perceived risks, which included psychological, quality, financial, and time risks. These risks are among the six types of perceived risks which were suggested by Mitchell [24] according to the research background. The result of the principal component analysis indicated that the four risks were successfully extracted, and the result of the SEM revealed that the psychological and quality risks had statistically negative effects on AT. This study presents theoretical contributions by empirically identifying the negative predictors of AT towards ISFR.
Secondly, the current study successfully applied a comprehensive framework that merged the PRT and the TAM in the context of ISFR. The TPB might not be able to fully predict consumer behavior, because it was limited to only three predictors. As a result, this study successfully incorporated this theory and the PRT in the context of ISFR. This study is not like the previous study, which focused on pro-environmental behavior [16].
Lastly, the present study empirically proved the moderating role of novelty seeking in the relationship between perceived risks and AT for the first time. The extant studies have a limitation in regard to identifying the moderating role of novelty seeking only in a positive relationship [74,75]. An individual who seeks novelty is more willing to try new products/services as well as take risks, so this study hypothesized that novelty seeking weakens the negative effect of perceived risks on attitudes. The result of the multiple group analysis revealed that the moderating role of novelty seeking was discovered in the relationship between psychological risk and AT. The path coefficient of the consumers with a high level of novelty seeking was specifically less negative than the path coefficient of the consumers with a low level of novelty seeking, which presents the theoretical contributions as empirically finding that the moderator weakened the negative effect of perceived risks in the context of new technology acceptance behavior.
5.3. Practical Suggestions
First, the psychological risk of ISFR is a negative factor in regard to forming AT. Consumers can feel anxiety towards food-tech products, such as genetically modified foods, cultured meat, and ISFR menus. ISFR is a much safer food option because it cultivates natural plant seeds, which is unlike genetically modified foods and cultured meat. Marketers should highlight this advantage when they plan advertisements in regard to promoting ISFR. Nonetheless, consumers can feel some psychological apprehension about new technology, so the marketers should reduce this apprehension for novelty items. Emphasizing ISFR as a new type of restaurant in the fourth industrial revolution era as well as the research and development of seasonally new menus are suggested.
Second, the quality risk of ISFR also negatively affects AT. The food ingredients that are used in ISFR are organic and fresher than commercial agriculture because smart farms produce vegetables in the store without pesticides. Managers should actively promote the high quality of the ingredients on the menus and the promotional materials in their stores. They can also collaborate with celebrity chefs to develop new menu items in order to reduce the perceived quality risks that are associated with ISFR.
Third, the SN of using ISFR can positively influence attitudes and behavioral intentions. This means that subjective norms play a crucial role in regard to forming technology acceptance behavior. Marketers can plan promotional content with social influencers, such as cooking/foodie YouTubers in order to enhance SN.
Furthermore, marketers can consider social media as a marketing tool in order to conduct these types of suggestions. Social media marketing plays a crucial role in regard to forming consumers’ trust in brand products [92]. Social media can be a suitable channel for advertisements to reduce psychological risks and collaborate marketing with celebrity chefs in order to reduce the quality risk. In addition, social media influencer marketing can also aid in regard to enhancing consumers’ SN.
Lastly, PBC also has a positive effect on behavioral intentions. The commercialization of ISFR and the establishment of a market environment are necessary in order to enhance this non-volitional behavior. For instance, ISFR restaurateurs can consider the various types of ISFR by including a low-cost restaurant chain that offers various pricing options from more locations.
5.4. Limitations and Further Study Suggestions
First, the current study collected data from only South Korean respondents. One suggestion is for future studies to focus on cross-cultural differences in order to overcome the limitation of generalization. Second, the respondents were potential consumers and this study used a structured questionnaire. Future research can consider an exploratory study by conducting qualitative methods in order to discover barriers to consumer behavior in addition to psychological and quality risks. It can also consider a study on the predictors of customer satisfaction and loyalty by collecting data from actual visitors. Third, this study only focused on PRT as a negative predictor of AT. Consumers tend to fear and mistrust new technology-based food products, and this notion is called food technophobia [58,93]. Consumers with high food technophobia may perceive more risks and have more negative AT than customers with low food technophobia. It can also be hypothesized that this phobia strengthens the effect of risk perception. This study suggests that future research should consider this phobia in the new technology-based food industry context. Lastly, cultured meat technology is also regarded as innovative food tech in addition to smart farming. The Guardian [94] in fact reported that the world’s first cultured meat restaurant emerged in Israel. Future research can plan a comparative study between ISFR and restaurants by using cultured meat.
Author Contributions
Conceptualization, K.J. and J.H.; methodology, K.J. and J.H.; writing—original draft preparation, K.J.; writing—review and editing, K.J. and J.H.; supervision, J.H. All authors have read and agreed to the published version of the manuscript.
Funding
This research received no external funding.
Institutional Review Board Statement
Not applicable.
Informed Consent Statement
Not applicable.
Data Availability Statement
Not applicable.
Conflicts of Interest
The authors declare no conflict of interest.
Appendix A. Measurement Items
| (PR1) | The thought of dining out at ISFR makes me feel psychologically uncomfortable because of worries about dissatisfaction. |
| (PR2) | The thought of dining out at ISFR causes me to experience unnecessary tension. |
| (PR3) | The thought of dining out at ISFR gives me a feeling of unwanted anxiety. |
| (QR1) | I worry about finding a lower quality of ISFR than I expected. |
| (QR2) | I am concerned with the quality of ISFR. |
| (QR3) | I worry because of the low quality of ISFR. |
| (FR1) | I worry that an additional fee must be paid for dining out at ISFR. |
| (FR2) | I worry that the concept of dining out at ISFR would be more expensive than I expected. |
| (FR3) | I worry that dining out at ISFR would involve unexpected extra expenses. |
| (TR1) | I am worried that planning (e.g., gathering information and finding the restaurants, etc.) for dining out at ISFR would take too much time. |
| (TR2) | I am worried that planning for dining out at ISFR would be a waste of time. |
| (TR3) | I am worried that planning for dining out at ISFR would take a long time. |
| (AT1) | Unfavorable—Favorable |
| (AT2) | Bad—Good |
| (AT3) | Negative—Positive |
| (SN1) | Most people who are important to me would think that I should try ISFR when I dine out. |
| (SN2) | Most people who are important to me would want me to visit ISFR when I dine out. |
| (SN3) | Most people who are important to me would prefer that I visit ISFR when I dine out. |
| (PBC1) | Whether or not I visit ISFR when I dine out is completely up to me. |
| (PBC2) | I am confident that if I want, I can visit ISFR when I dine out. |
| (PBC3) | I have resources, time, and opportunities to visit ISFR when I dine out. |
| (BI1) | I will visit ISFR when I dine out. |
| (BI2) | I am willing to visit ISFR when I dine out. |
| (BI3) | I am likely to visit ISFR when I dine out. |
References
- Campbell, B.M.; Vermeulen, S.J.; Aggarwal, P.K.; Corner-Dolloff, C.; Girvetz, E.; Loboguerrero, A.M.; Ramirez-Villegas, J.; Rosentosk, T.; Sebastian, L.; Thornton, P.K.; et al. Reducing risks to food security from climate change. Glob. Food Secur. 2016, 11, 34–43. [Google Scholar] [CrossRef]
- Musa, S.F.P.D.; Basir, K.H.; Luah, E. The Role of Smart Farming in Sustainable Development. Int. J. Asian Bus. Inf. Manag. 2022, 13, 1–12. [Google Scholar] [CrossRef]
- O’Shaughnessy, S.A.; Kim, M.; Lee, S.; Kim, Y.; Kim, H.; Shekailo, J. Towards smart farming solutions in the US and South Korea: A comparison of the current status. Geogr. Sustain. 2021, 2, 312–327. [Google Scholar]
- Lohchab, V.; Kumar, M.; Suryan, G.; Gautam, V.; Das, R.K. A review of iot based smart farm monitoring. In International Conference on Inventive Communication and Computational Technologies; IEEE: Piscataway, NJ, USA, 2018; pp. 1620–1625. [Google Scholar]
- Musa, S.F.P.D.; Basir, K.H. Smart farming: Towards a sustainable agri-food system. Br. Food J. 2021, 123, 3085–3099. [Google Scholar] [CrossRef]
- Benke, K.; Tomkins, B. Future food-production systems: Vertical farming and controlled-environment agriculture. Sustain. Sci. Pract. Policy 2017, 13, 13–26. [Google Scholar] [CrossRef]
- Charania, I.; Li, X. Smart farming: Agriculture’s shift from a labor intensive to technology native industry. Internet Things 2020, 9, 100142. [Google Scholar] [CrossRef]
- Hsu, W.L.; Wang, W.K.; Fan, W.H.; Shiau, Y.C.; Yang, M.L.; Lopez, D.J.D. Application of internet of things in smart farm watering system. Sens. Mater 2021, 33, 269–283. [Google Scholar] [CrossRef]
- Vardhan, H. How Vertical Farms Could Boost Food Production in India. Available online: https://www.weforum.org/agenda/2022/10/how-vertical-farms-increase-food-production-india/ (accessed on 25 October 2022).
- Vincent, J. These Smart Farms Are 100 Times More Productive than Traditional Agriculture. Available online: https://www.fastcompany.com/90783102/these-smart-farms-are-100-times-more-productive-than-traditional-agriculture (accessed on 25 October 2022).
- Beh, B. Controlled Environment Agriculture including Hydroponics, Aeroponics, Aquaponics, Automation, Sensors, LEDs, and Container Farms. Analysis by Region and Business Model. Forecast of Produce by Region. Available online: https://www.idtechex.com/en/research-report/vertical-farming-2022-2032/871 (accessed on 25 October 2022).
- Shoup, M.E. Whole Foods Reveals Top 10 Food Trends to Watch Next Year. Available online: https://www.foodnavigator-usa.com/Article/2021/10/18/Whole-Foods-reveals-top-10-food-trends-to-watch-next-year (accessed on 25 October 2022).
- Korea Joongang Daily. From Farm to Table—Via the Internet. Available online: https://koreajoongangdaily.joins.com/2021/06/06/culture/foodTravel/farm-market/20210606153100465.html (accessed on 25 October 2022).
- Issuu. DINING from Southside May 2021 by Hong Kong Living Ltd. 2021. Available online: https://issuu.com/saikung/docs/southside_may_2021/s/12209765 (accessed on 14 February 2022).
- Zuiderveld, U. Watch CNCPTS: Restaurants Uit Het Buitenland Met Vertical Farms. Available online: https://www.foodinspiration.com/be/watch-cncpts-restaurants-met-vertical-farms/0/ (accessed on 25 October 2022).
- Joo, K.; Lee, J.; Hwang, J. NAM and TPB Approach to Consumers’ Decision-Making Framework in the Context of Indoor Smart Farm Restaurants. Int. J. Environ. Res. Public Health 2022, 19, 14604. [Google Scholar] [CrossRef]
- Rogers, E.M. Diffusion of Innovations; Free Press: New York, NY, USA, 1995. [Google Scholar]
- Ajzen, I. The theory of planned behavior. Organ. Behav. Hum. Decis. Process. 1991, 50, 179–211. [Google Scholar] [CrossRef]
- Choe, J.Y.J.; Kim, J.J.; Hwang, J. Perceived risks from drone food delivery services before and after COVID-19. Int. J. Contemp. Hosp. Manag. 2021, 33, 1276–1296. [Google Scholar] [CrossRef]
- Featherman, M.; Jia, S.J.; Califf, C.B.; Hajli, N. The impact of new technologies on consumers beliefs: Reducing the perceived risks of electric vehicle adoption. Technol. Forecast. Soc. Chang. 2021, 169, 120847. [Google Scholar] [CrossRef]
- Hwang, J.; Kim, H.; Kim, J.J.; Kim, I. Investigation of perceived risks and their outcome variables in the context of robotic restaurants. J. Travel Tour. Mark. 2021, 38, 263–281. [Google Scholar] [CrossRef]
- Dowling, G.R. Perceived risk: The concept and its measurement. Psychol. Mark. 1986, 3, 193–210. [Google Scholar] [CrossRef]
- Jacoby, J.; Kaplan, L.B. The components of perceived risk. In Proceedings of the Third Annual Conference of the Association for Consumer Research, Association for Consumer Research, Chicago, IL, USA, 2–5 November 1972; Volume 10, pp. 382–393. [Google Scholar]
- Mitchell, V.W. Consumer perceived risk: Conceptualisations and models. Eur. J. Mark. 1999, 33, 163–195. [Google Scholar] [CrossRef]
- Ariffin, S.K.; Mohan, T.; Goh, Y.N. Influence of consumers’ perceived risk on consumers’ online purchase intention. J. Res. Interact. Mark. 2018, 12, 309–327. [Google Scholar]
- Belanche, D.; Casaló, L.V.; Guinalíu, M. Website usability, consumer satisfaction and the intention to use a website: The moderating effect of perceived risk. J. Retail. Consum. Serv. 2012, 19, 124–132. [Google Scholar] [CrossRef]
- Habib, S.; Hamadneh, N.N. Impact of perceived risk on consumers technology acceptance in online grocery adoption amid COVID-19 pandemic. Sustainability 2021, 13, 10221. [Google Scholar] [CrossRef]
- Hwang, J.; Choe, J.Y.J. Exploring perceived risk in building successful drone food delivery services. Int. J. Contemp. Hosp. Manag. 2019, 31, 3249–3269. [Google Scholar] [CrossRef]
- Seo, K.H.; Lee, J.H. The emergence of service robots at restaurants: Integrating trust, perceived risk, and satisfaction. Sustainability 2021, 13, 4431. [Google Scholar] [CrossRef]
- Trivedi, J. Examining the customer experience of using banking chatbots and its impact on brand love: The moderating role of perceived risk. J. Internet Commer. 2019, 18, 91–111. [Google Scholar] [CrossRef]
- Choi, J.; Lee, A.; Ok, C. The effects of consumers’ perceived risk and benefit on attitude and behavioral intention: A study of street food. J. Travel Tour. Mark. 2013, 30, 222–237. [Google Scholar] [CrossRef]
- Rahmafitria, F.; Suryadi, K.; Oktadiana, H.; Putro, H.P.H.; Rosyidie, A. Applying knowledge, social concern and perceived risk in planned behavior theory for tourism in the Covid-19 pandemic. Tour. Rev. 2021, 76, 809–828. [Google Scholar] [CrossRef]
- Xie, Q.; Song, W.; Peng, X.; Shabbir, M. Predictors for e-government adoption: Integrating TAM, TPB, trust and perceived risk. Electron. Libr. 2017, 35, 2–20. [Google Scholar] [CrossRef]
- Ram, S.; Sheth, J.N. Consumer resistance to innovations: The marketing problem and its solutions. J. Consum. Mark. 1989, 6, 5–14. [Google Scholar] [CrossRef]
- Im, S.; Bayus, B.L.; Mason, C.H. An empirical study of innate consumer innovativeness, personal characteristics, and new-product adoption behavior. J. Acad. Mark. Sci. 2003, 31, 61–73. [Google Scholar] [CrossRef]
- Kim, J.J.; Choe, J.Y.J.; Hwang, J. Application of consumer innovativeness to the context of robotic restaurants. Int. J. Contemp. Hosp. Manag. 2021, 33, 224–242. [Google Scholar] [CrossRef]
- Hirschman, E.C. Innovativeness, novelty seeking, and consumer creativity. J. Consum. Res. 1980, 7, 283–295. [Google Scholar] [CrossRef]
- Goo, J.; Huang, C.D.; Yoo, C.W.; Koo, C. Smart Tourism Technologies’ Ambidexterity: Balancing Tourist’s Worries and Novelty Seeking for Travel Satisfaction. Inf. Syst. Front. 2022, 24, 2139–2158. [Google Scholar] [CrossRef]
- Pérez, A.; del Bosque, I.R. How customer novelty seeking influences customer CSR perceptions. Mark. Intell. Plan. 2015, 33, 486–507. [Google Scholar] [CrossRef]
- Berlyne, D.E. Curiosity and Exploration: Animals spend much of their time seeking stimuli whose significance raises problems for psychology. Science 1966, 153, 25–33. [Google Scholar] [CrossRef]
- FAO. Looking at Edible Insects from a Food Safety Perspective, Challenges and Opportunities for the Sector; FAO: Québec City, QC, Canada, 2021. [Google Scholar] [CrossRef]
- Tal, A. Making conventional agriculture environmentally friendly: Moving beyond the glorification of organic agriculture and the demonization of conventional agriculture. Sustainability 2018, 10, 1078. [Google Scholar] [CrossRef]
- Al-Chalabi, M. Vertical farming: Skyscraper sustainability? Sustain. Cities Soc. 2015, 18, 74–77. [Google Scholar] [CrossRef]
- Banerjee, C.; Adenaeuer, L. Up, up and away! The economics of vertical farming. J. Agric. Stud. 2014, 2, 40–60. [Google Scholar] [CrossRef]
- Lin, X.; Sun, S.; Manogaran, C.; Rawal, B.S. Advanced energy consumption system for smart farm based on reactive energy utilization technologies. Environ. Impact Assess. Rev. 2021, 86, 106–496. [Google Scholar] [CrossRef]
- BBC. A Subterranean farm Deep Inside a South Korean Subway Station May Unlock the Secret to Food Sustainability. Available online: https://www.bbc.com/travel/article/20200723-is-underground-farming-the-future-of-food (accessed on 10 January 2023).
- Correa, D. Smart Agriculture Market Size to Reach USD 29.23 Billion by 2027. Industry Compound Annual Growth Rate of 9.7%. Available online: https://www.einnews.com/pr_news/581940357/smart-agriculture-market-size-to-reach-usd-29-23-billion-by-2027-industry-compound-annual-growth-rate-of-9-7 (accessed on 10 January 2023).
- Joo, K.; Hwang, J. Do Consumers Intend to Use Indoor Smart Farm Restaurants for a Sustainable Future? The Influence of Cognitive Drivers on Behavioral Intentions. Sustainability 2023, 15, 6666. [Google Scholar] [CrossRef]
- Bauer, R.A. Consumer behavior as risk taking. In Dynamic Marketing for a Changing World; Hancock, R.S., Ed.; American Marketing Association: Chicago, IL, USA, 1960; pp. 389–398. [Google Scholar]
- Cox, D.F. Risk-Taking and Information-Handling in Consumer Behavior; Harvard University Press: Boston, MA, USA, 1967. [Google Scholar]
- Hwang, J.; Choe, J.Y. How to enhance the image of edible insect restaurants: Focusing on perceived risk theory. Int. J. Hosp. Manag. 2020, 87, 102464. [Google Scholar] [CrossRef]
- Koay, K.Y.; Cheah, C.W.; Lom, H.S. Does perceived risk influence the intention to purchase second-hand clothing? A multigroup analysis of SHC consumers versus non-SHC consumers. J. Prod. Brand Manag. 2023, 32, 530–543. [Google Scholar] [CrossRef]
- Tapsall, S.; Soutar, G.N.; Elliott, W.A.; Mazzarol, T.; Holland, J. COVID-19′s impact on the perceived risk of ocean cruising: A best-worst scaling study of Australian consumers. Tour. Econ. 2022, 28, 248–271. [Google Scholar] [CrossRef]
- Nguyen, C.; Tran, D.; Nguyen, A.; Nguyen, N. The Effects of Perceived Risks on Food Purchase Intention: The Case Study of Online Shopping Channels during COVID-19 Pandemic in Vietnam. J. Distrib. Sci. 2021, 19, 19–27. [Google Scholar]
- Forsythe, S.M.; Shi, B. Consumer patronage and risk perceptions in Internet shopping. J. Bus. Res. 2003, 56, 867–875. [Google Scholar] [CrossRef]
- Okumus, B.; Bilgihan, A. Proposing a Model to Test Smartphone Users’ Intention to Use Smart Applications When Ordering Food in Restaurants. J. Hosp. Tour. Technol. 2014, 5, 31–49. [Google Scholar] [CrossRef]
- Zhou, R.; Wang, D.; Siddiquei, A.N.; Anwar, M.A.; Hammad, A.; Asmi, F.; Ye, Q.; Nawaz, M.A. GMO/GMF on social media in China: Jagged landscape of information seeking and sharing behavior through a valence view. Int. J. Environ. Res. Public Health 2019, 16, 4838. [Google Scholar] [CrossRef] [PubMed]
- Coppola, A.; Verneau, F. An empirical analysis on technophobia/technophilia in consumer market segmentation. Agric. Food Econ. 2014, 2, 2. [Google Scholar] [CrossRef]
- Ronteltap, A.; Van Trijp, J.C.M.; Renes, R.J.; Frewer, L.J. Consumer acceptance of technology-based food innovations: Lessons for the future of nutrigenomics. Appetite 2007, 49, 1–17. [Google Scholar] [CrossRef]
- Tversky, A.; Kahneman, D. Advances in prospect theory: Cumulative representation of uncertainty. J. Risk Uncertain. 1992, 5, 297–323. [Google Scholar] [CrossRef]
- Fishbein, M.; Ajzen, I. Belief, attitude, intention, and behavior: An introduction to theory and research. Contemp. Sociol. 1977, 6, 244–245. [Google Scholar]
- Hale, J.L.; Householder, B.J.; Greene, K.L. The theory of reasoned action. Persuas. Handb. Dev. Theory Pract. 2002, 14, 259–286. [Google Scholar]
- Sheppard, B.H.; Hartwick, J.; Warshaw, P.R. The theory of reasoned action: A meta-analysis of past research with recommendations for modifications and future research. J. Consum. Res. 1988, 15, 325–343. [Google Scholar] [CrossRef]
- Choe, J.Y.; Kim, J.J.; Hwang, J. Innovative robotic restaurants in Korea: Merging a technology acceptance model and theory of planned behaviour. Asian J. Technol. Innov. 2022, 30, 466–489. [Google Scholar] [CrossRef]
- Hwang, J.; Kim, I.; Gulzar, M.A. Understanding the eco-friendly role of drone food delivery services: Deepening the theory of planned behavior. Sustainability 2020, 12, 1440. [Google Scholar] [CrossRef]
- Yuen, K.F.; Koh, L.Y.; Anwar, M.H.D.B.; Wang, X. Acceptance of autonomous delivery robots in urban cities. Cities 2022, 131, 104056. [Google Scholar] [CrossRef]
- Brock Baskin, M.E.; Hart, T.A.; Bajaj, A.; Gerlich, R.N.; Drumheller, K.D.; Kinsky, E.S. Subjective norms and social media: Predicting ethical perception and consumer intentions during a secondary crisis. Ethics Behav. 2023, 33, 70–88. [Google Scholar] [CrossRef]
- Han, H.; Hsu, L.T.J.; Sheu, C. Application of the theory of planned behavior to green hotel choice: Testing the effect of environental friendly activities. Tour. Manag. 2010, 31, 325–334. [Google Scholar] [CrossRef]
- Tarkiainen, A.; Sundqvist, S. Subjective norms, attitudes and intentions of Finnish consumers in buying organic food. Br. Food J. 2005, 107, 808–822. [Google Scholar] [CrossRef]
- Schepers, J.; Wetzels, M. A meta-analysis of the technology acceptance model: Investigating subjective norm and moderation effects. Inf. Manag. 2007, 44, 90–103. [Google Scholar] [CrossRef]
- Chang, R.C.; Kivela, J.; Mak, A.H. Attributes that influence the evaluation of travel dining experience: When East meets West. Tour. Manag. 2011, 32, 307–316. [Google Scholar] [CrossRef]
- Dabholkar, P.A.; Bagozzi, R.P. An attitudinal model of technology-based self-service: Moderating effects of consumer traits and situational factors. J. Acad. Mark. Sci. 2002, 30, 184–201. [Google Scholar] [CrossRef]
- Hwang, J.; Kim, J.J.; Lee, K.W. Investigating consumer innovativeness in the context of drone food delivery services: Its impact on attitude and behavioral intentions. Technol. Forecast. Soc. Chang. 2021, 163, 120433. [Google Scholar] [CrossRef]
- Ji, M.; Wong, I.A.; Eves, A.; Scarles, C. Food-related personality traits and the moderating role of novelty-seeking in food satisfaction and travel outcomes. Tour. Manag. 2016, 57, 387–396. [Google Scholar] [CrossRef]
- Wong, I.A.; Zhao, W.M. Exploring the effect of geographic convenience on repeat visitation and tourist spending: The moderating role of novelty seeking. Curr. Issues Tour. 2016, 19, 824–844. [Google Scholar] [CrossRef]
- Kelley, A.E.; Schochet, T.; Landry, C.F. Risk taking and novelty seeking in adolescence: Introduction to part I. Ann. New York Acad. Sci. 2004, 102, 27–32. [Google Scholar] [CrossRef] [PubMed]
- Kashdan, T.B.; Hofmann, S.G. The high-novelty–seeking, impulsive subtype of generalized social anxiety disorder. Depress. Anxiety 2008, 25, 535–541. [Google Scholar] [CrossRef] [PubMed]
- Sahni, S.P.; Gupta, I.; Sahni, S.P.; Gupta, I. Novelty seeking: Exploring the role of variety seeking behavior in digital piracy. In Piracy in the Digital Era: Psychosocial, Criminological and Cultural Factors; Springer: Berlin/Heidelberg, Germany, 2019; pp. 99–113. [Google Scholar]
- Zuckerman, M.; Neeb, M. Sensation seeking and psychopathology. Psychiatry Res. 1979, 1, 255–264. [Google Scholar] [CrossRef] [PubMed]
- Churchill, G.A., Jr. A paradigm for developing better measures of marketing constructs. J. Mark. Res. 1979, 16, 64–73. [Google Scholar] [CrossRef]
- Anderson, J.C.; Gerbing, D.W. Structural equation modeling in practice: A review and recommended two-step approach. Psychol. Bull. 1988, 103, 411–423. [Google Scholar] [CrossRef]
- Nunnally, J.C. Psychometric Theory; McGraw-Hill: New York, NY, USA, 1967. [Google Scholar]
- Hair, J.F.; Anderson, R.E.; Tatham, R.L.; Black, W.C. Multivariate Data Analysis, 8th ed.; Prentice-Hall Inc.: Upper Saddle River, NJ, USA, 1998. [Google Scholar]
- Bagozzi, R.P.; Yi, Y. On the evaluation of structural equation models. J. Acad. Mark. Sci. 1988, 16, 74–94. [Google Scholar] [CrossRef]
- Fornell, C.; Larcker, D.F. Structural equation models with unobservable variables and measurement error: Algebra and statistics. J. Mark. Res. 1981, 18, 382–388. [Google Scholar] [CrossRef]
- Podsakoff, P.M.; Organ, D.W. Self-reports in organizational research: Problems and prospects. J. Manag. 1986, 12, 531–544. [Google Scholar] [CrossRef]
- Cheung, G.W.; Rensvold, R.B. Evaluating goodness-of-fit indexes for testing measurement invariance. Struct. Equ. Model. 2002, 9, 233–255. [Google Scholar] [CrossRef]
- Qi, X.; Ploeger, A. Explaining Chinese consumers’ green food purchase intentions during the COVID-19 pandemic: An extended Theory of Planned Behaviour. Foods 2021, 10, 1200. [Google Scholar] [CrossRef]
- Teixeira, S.F.; Barbosa, B.; Cunha, H.; Oliveira, Z. Exploring the antecedents of organic food purchase intention: An extension of the theory of planned behavior. Sustainability 2022, 14, 242. [Google Scholar] [CrossRef]
- Chuah, S.H.W.; Jitanugoon, S.; Puntha, P.; Aw, E.C.X. You don’t have to tip the human waiters anymore, but… Unveiling factors that influence consumers’ willingness to pay a price premium for robotic restaurants. Int. J. Contemp. Hosp. Manag. 2022, 34, 3553–3587. [Google Scholar] [CrossRef]
- Hussain, S.; Singh, A.M.; Mohanty, P.; Gavinolla, M.R. Next generation employability and career sustainability in the hospitality industry 5.0. Worldw. Hosp. Tour. Themes 2023, 15, 308–321. [Google Scholar] [CrossRef]
- Sohaib, M.; Han, H. Building value co-creation with social media marketing, brand trust, and brand loyalty. J. Retail. Consum. Serv. 2023, 74, 103442. [Google Scholar] [CrossRef]
- Sodano, V.; Gorgitano, M.T.; Verneau, F.; Vitale, C.D. Consumer acceptance of food nanotechnology in Italy. Br. Food J. 2016, 188, 714–733. [Google Scholar] [CrossRef]
- The Guardian. I Tried the World’s First No-Kill, Lab-Grown Chicken Burger. Available online: https://www.theguardian.com/food/2020/dec/04/no-kill-lab-grown-chicken-burger-restaurant-israel (accessed on 15 May 2023).
Disclaimer/Publisher’s Note: The statements, opinions and data contained in all publications are solely those of the individual author(s) and contributor(s) and not of MDPI and/or the editor(s). MDPI and/or the editor(s) disclaim responsibility for any injury to people or property resulting from any ideas, methods, instructions or products referred to in the content. |
© 2023 by the authors. Licensee MDPI, Basel, Switzerland. This article is an open access article distributed under the terms and conditions of the Creative Commons Attribution (CC BY) license (https://creativecommons.org/licenses/by/4.0/).