Article

Predicting the Rectal Temperature of Dairy Cows Using Infrared Thermography and Multimodal Machine Learning

1
Department of Mathematics, University of Architecture, Civil Engineering and Geodesy, 1 Hristo Smirnenski Blvd, 1164 Sofia, Bulgaria
2
Researcher at Trakia University, 6015 Stara Zagora, Bulgaria
3
Faculty of Agriculture, Trakia University, 6015 Stara Zagora, Bulgaria
4
Institute of Information and Communication Technologies, Bulgarian Academy of Sciences, 1113 Sofia, Bulgaria
*
Author to whom correspondence should be addressed.
Appl. Sci. 2023, 13(20), 11416; https://doi.org/10.3390/app132011416
Submission received: 21 August 2023 / Revised: 2 October 2023 / Accepted: 15 October 2023 / Published: 18 October 2023
(This article belongs to the Section Computing and Artificial Intelligence)

Abstract

:

Featured Application

non-invasive real-time health monitoring of dairy cows; early diagnostics and disease prevention in veterinary medicine; health risk control in animal husbandry.

Abstract

The paper proposes an approach for estimating the rectal temperature of dairy cows based on the non-invasive real-time monitoring of their respiration rates and the temperature-humidity index (THI) of the environment, combined with the analysis of infrared images. We use multimodal machine learning for the joint processing (fusion) of these different types of data. The implementation is performed using a new open source AutoML Python module named AutoGluon. After training and optimizing three different regression models (a neural network and two powerful boosting algorithms), it reduces the variance of the result using level 2 stacking. The evaluation metrics we work with are the mean absolute error, MAE, and the coefficient of determination, R 2 . For a sample of 295 studied animals, a weighted ensemble provides quite decent results: R 2 = 0.73 and MAE 0.1 °C. For another sample of 118 cows, we additionally use the pulse rate as a predictor and we achieve R 2 = 0.65 , MAE 0.2 °C. The maximal error is almost 1 °C due to outliers, but the median absolute error in both cases is significantly lower: MedAE < 0.1 °C, with the standard deviations respectively being 0 . 118 ° and 0 . 137 ° . These encouraging results give us confidence that tabular and visual data fusion in ML models has great potential for the advancement of non-invasive real-time monitoring and early diagnostics methods.

1. Introduction

Living organisms are a natural source of thermal radiation, which is the result of heat produced in many physiological processes. Body temperature is a very basic indicator, and deviations from normal levels can be a symptom of disease. Its measurement is an essential part of many diagnostic mechanisms. When the health condition changes, the amount of heat produced in the body usually responds. The blood flow carries some of this heat to the surface layers of the tissues, where it is released into the surrounding space through the processes of heat exchange. Its realization, however, depends strongly on the temperature and humidity characteristics of the surrounding environment. Therefore, one complex indicator is introduced to characterize the environment, the so-called temperature-humidity index (THI). Nowadays, there are many devices that measure this indicator. In order for normal heat exchange to take place, THI must be within some permissible limits. Beyond these limits, the normal heat exchange with the surrounding environment is disturbed and the body temperature cannot be considered an objective indicator for the health condition anymore. In addition, we consider two more basic parameters which provide information about the physiological state of dairy cows; namely, the pulse and the respiration rate. The problem that we focus on in the present research is in estimating the unknown rectal temperature of the animals based solely on these data and infrared images, without any intrusive procedures. The paper proposes the use of machine learning for the joint processing of multimodal data. Three different models are used to estimate rectal temperatures. Each one of them receives a plausibility score, determining its weight in the final prediction. Infrared thermography (IRT) allows for monitoring of the surface temperature distribution. The animals are periodically photographed without disturbing their daily routine. These IR images provide us with additional input data for our regression models. Its non-invasiveness makes it both harmless to the animal and cost-effective to the farmer. In this way, it allows for the continuous monitoring of physiological parameters and using the gathered data for scientific research. It also enables working from a sufficient distance, without introducing additional stress to the animal. These qualities make it a promising tool in veterinary medicine research [1,2,3,4,5,6,7].
Our main goal is to demonstrate the power of multimodal ML tools for the non-invasive monitoring of physiological indicators as a crucial part of smart farming and veterinary control. The paper is organized as follows: Section two reviews the current state of research for farm animals physiological data acquisition and processing. In the third section, we describe the proposed method, including infrared thermography, the data collection stage, and some machine learning techniques that we use. Section four presents the results of our temperature estimation. They are discussed and summarized in the last part of the text, which outlines the most important conclusions and points to directions for further research.

2. Related Works

With the rapid growth of computational power and data transfer capabilities, machine learning (ML) and artificial intelligence (AI) are also making inroads into animal husbandry and veterinarian research. In particular, IRT is being increasingly used for health monitoring and the diagnosis of dairy cows, especially in studies related to heat stress, which causes severe losses, helping us analyze its effects on nutrition, milk production, reproduction, etc. There is plenty of evidence for the potential benefits of using IRT for monitoring udder health status in dairy cows and for the early detection of mastitis [8,9,10,11,12,13,14,15,16]. Its role in detecting hoof lesions and lameness has also been reported [17,18,19]. The growth of the population and the increase of quality standards has set a requirement for the production of more and better quality food. The capabilities and potential benefits of IRT make systems for the automatic collection and processing of thermographic information and decision-making particularly important [20]. Some studies use computer vision technology and IRT to detect hoof diseases in dairy cows (see [21]). Others resort on deep learning methods, and more precisely, convolutional neural networks (CNNs), for detecting mastitis in dairy cows based on infrared images [22,23,24]. The possibility of using a combination of visible and infrared imaging has also been explored; for instance, to automate the measurement of pig skin surface temperature, emphasizing once more on the benefits of non-invasive methods [25]. The expansion of ML and AI into modern farming practices is facilitated by the advancement of increasingly more precise and affordable sensors reacting to subtle changes in the environment and the animals’ physiological parameters. This provides new opportunities for data analysis and ML-based optimization, which is the leading idea of ’smart farming’. There are many directions for development of this modern research field, but we shall focus on non-invasive diagnostics, allowing for precise real-time monitoring of the animals’ health condition without disturbing their comfort and exposing them to unnecessary stress. Body temperature is one of the most important physiological parameters to keep track of, and there are abundant data for it. Hence, multi-regression models predicting the rectal temperature are quite promising for the improvement of health conditions in animal farms and their overall optimization. Although the research area is relatively new, such studies have been conducted before, using different methods [26,27,28,29,30,31,32] and technologies [33,34], leading to different conclusions. We rely a lot on thermal images, like in [35,36], but we feed them into a multimodal algorithm along with tabular features, which improves the accuracy significantly. These ML models have become popular only in recent years due to their complexity, but with modern AutoML tools, they are already a standard task for data scientists [37,38]. The development of algorithms for processing information from multiple sensors began in the late 1980s, when the field of data fusion emerged [39]. Its aims to increase the accuracy of the assessment and reliability of the information system in case one of its sensors fails, to obtain a more accurate picture of the observed event or process, and to expand the area of observation. Multi-model approaches have become necessary in cases where the systems under evaluation may have different modes of operation (changing dynamics), each corresponding to a different model. The main advantage of this approach is its extreme robustness, which naturally comes at the cost of a higher computing load due to processing several models simultaneously. In the great variety of multi-model approaches [40], the algorithm of interacting multiple models [41] has emerged as one of the most successful. Stacking methods emerging in the 1990s; however, they became more popular in machine learning algorithms for various reasons (see [42,43]). They rely on weighted ensembles of models, rather than alternative choices. In this way, the imperfections of each individual ML algorithm tend to cancel out to some extend, and the overall variance of the result is reduced.
There is plenty of research on the applications of artificial intelligence in improving health conditions and quality of life in animal farms [44], thus optimizing the food production and minimizing the cost. Some authors study the behavioral response, while others focus on the early detection of diseases or environmental monitoring [45]. The data are collected with interconnected sensors, and advanced algorithms are used for processing and analysis. Remote monitoring systems, combined with recognition and identification techniques powered by AI algorithms, are aimed at obtaining better assessments of crucial physiological parameters and characteristics of the environment, in particular, discovering deviations in the health status [46]. Food production is increasingly demanding and leads to new fields of applied science, such as precision agriculture and intelligent animal husbandry [47]. Global changes in the climate and extreme weather conditions also contribute to the stress in farmed animals. This has negative impacts on the quality and quantity of milk produced in farms, as recent studies reveal [48]. The digitalization of agriculture and the advent of modern technology facilitate the expansion of AI into animal husbandry. Cattle identification methods no longer rely just on radio frequencies, but uses image recognition techniques as well. Behavioral research applications are being created as an aid for disease prevention and the early detection of health issues, as well as may other diverse farming applications [49].

3. Materials and Methods

Here, we explain into more detail the tools used in this study, and the process of gathering our data. Since the problem is interdisciplinary, it demands discussing different branches.

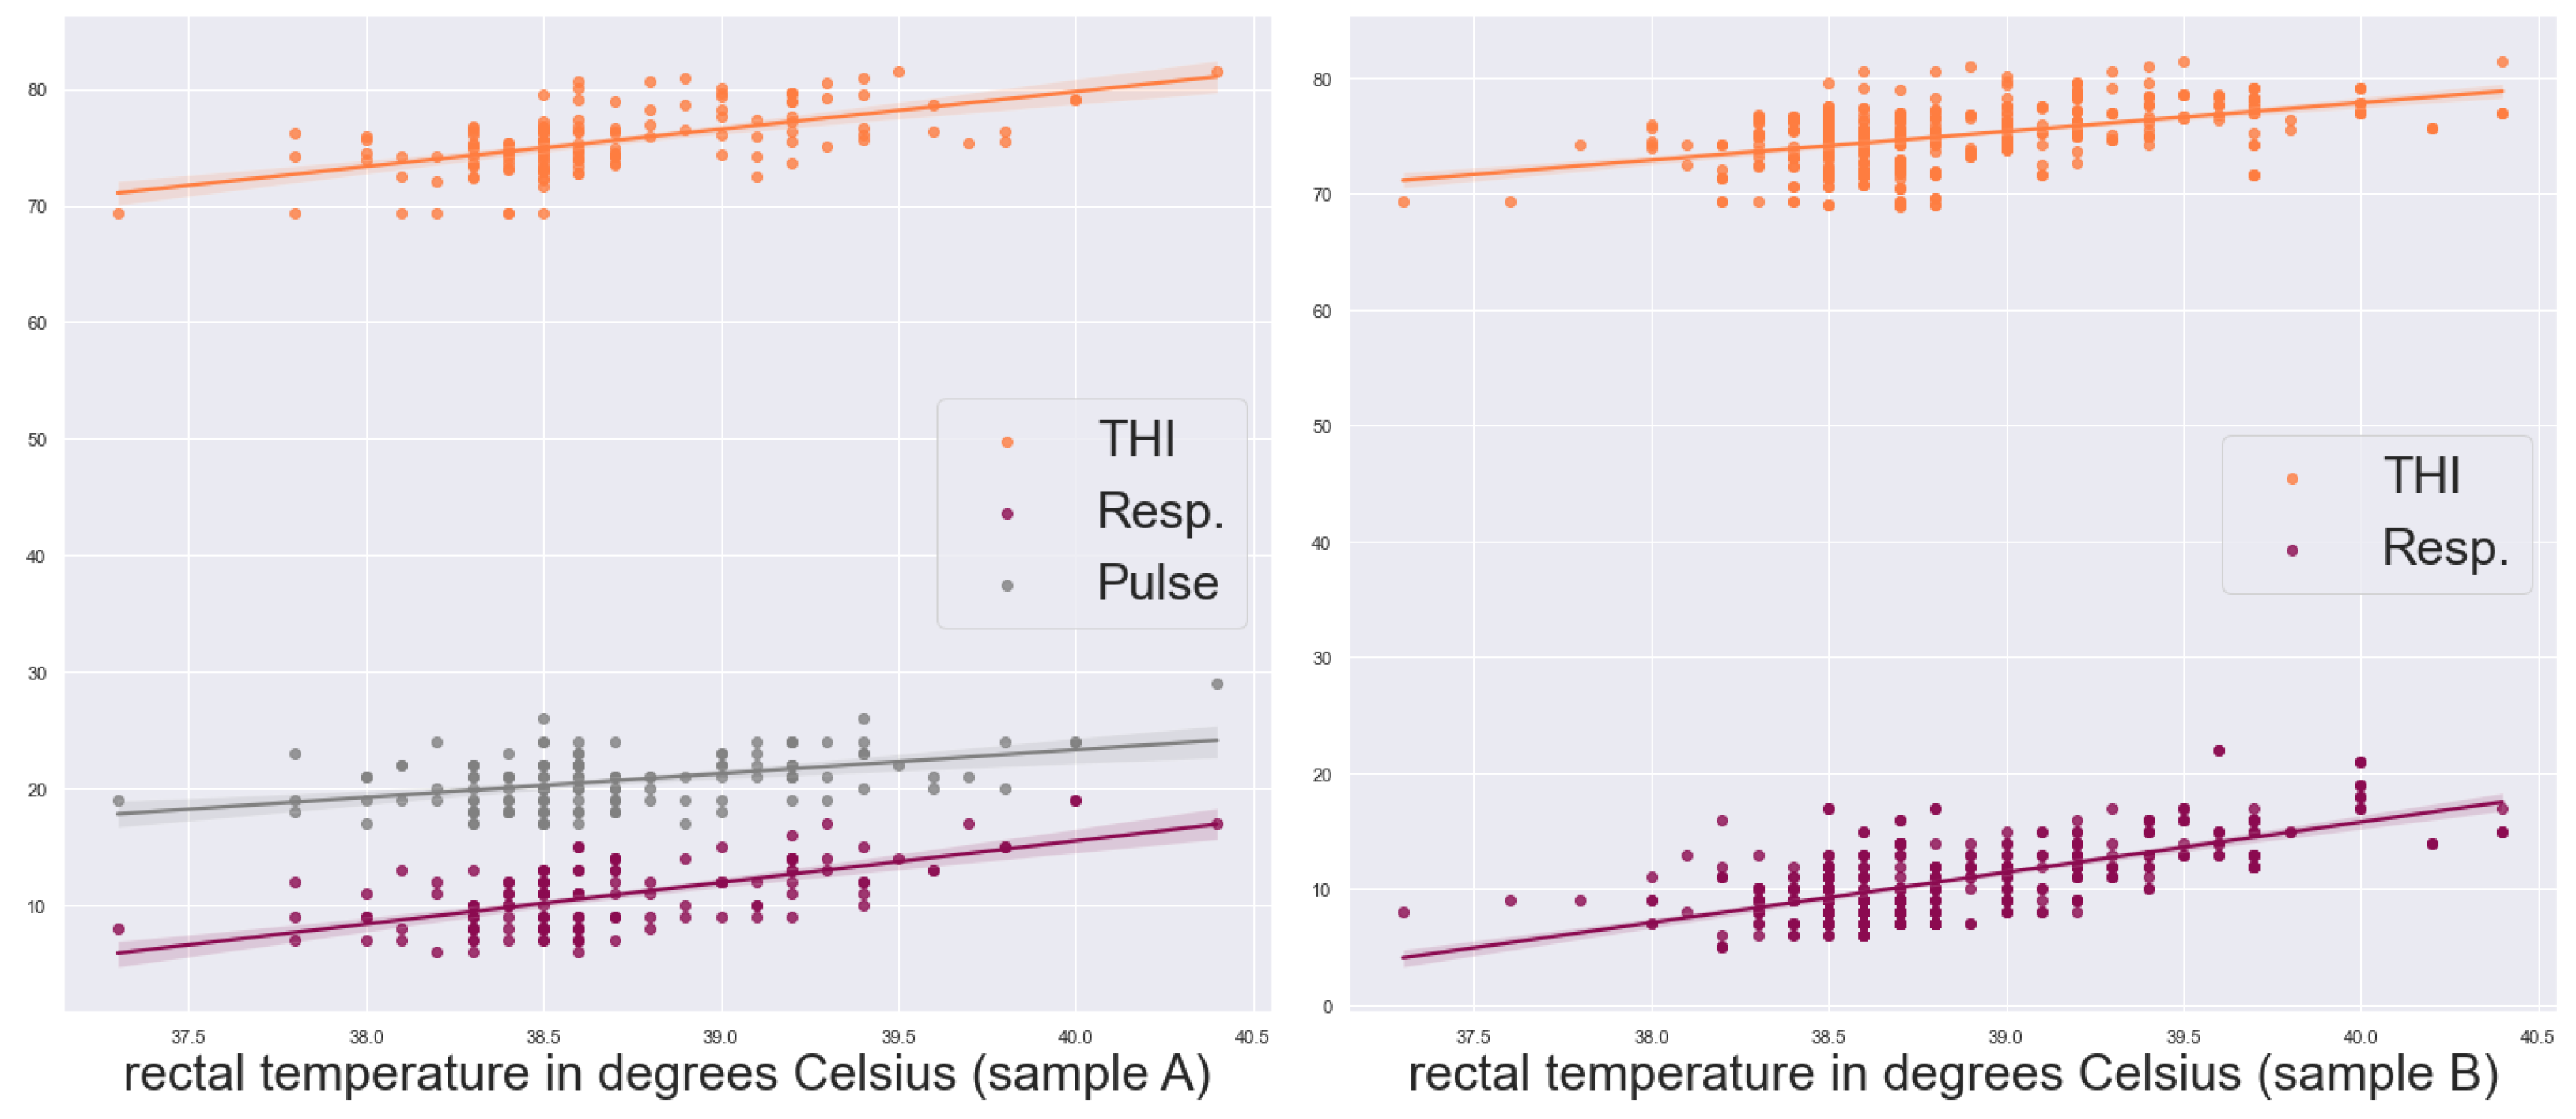
3.1. Physiological Parameters

The healthy state of a living organism is characterized by the synergy of all functional systems and its optimally maintained equilibrium with the surrounding environment [50], an essential part of the health condition and the physiological status of animals. It is determined by certain clinical and paraclinical indicators. Because of the specifics and the need for quick reactions, the following clinical indicators of the physiological status are usually measured by veterinarians and zoo engineers in dairy farms for milk production: rectal temperature, breathing rate, and pulse. The rectal temperature of the animal is a very accurate indicator, measuring the health status (infection, toxemia etc.) and well-being of animals. Increases in rectal temperature and the frequency of breathing and pulse in healthy cows during the hot months are considered as important symptoms for the onset of heat stress [51,52]. In [53], it has been confirmed that physiological parameters respond earlier to heat stress than production-related parameters (feed intake and feeding behavior) or behavioral changes (shade usage). They are also used as predictors of declines in milk production traits and feed intake during moderate stress in multiparous US Holstein cows (see, for example, [54]).

3.2. Temperature-Humidity Index

The temperature-humidity index (THI) is an indicator for determining the current comfort state of the animal in relation to the joint influence of the environmental temperature and the relative humidity of the surrounding air, giving a quantitative assessment of the risk of falling under thermal stress, i.e., it gives a numerical evaluation for the comfort zone. Studies use THI to classify the health condition and to determine the level of heat stress in animals, based on the presented scales [55,56]. It became popular in the last century [57] and has been presented using different expressions (see [58] for more details on that issue).

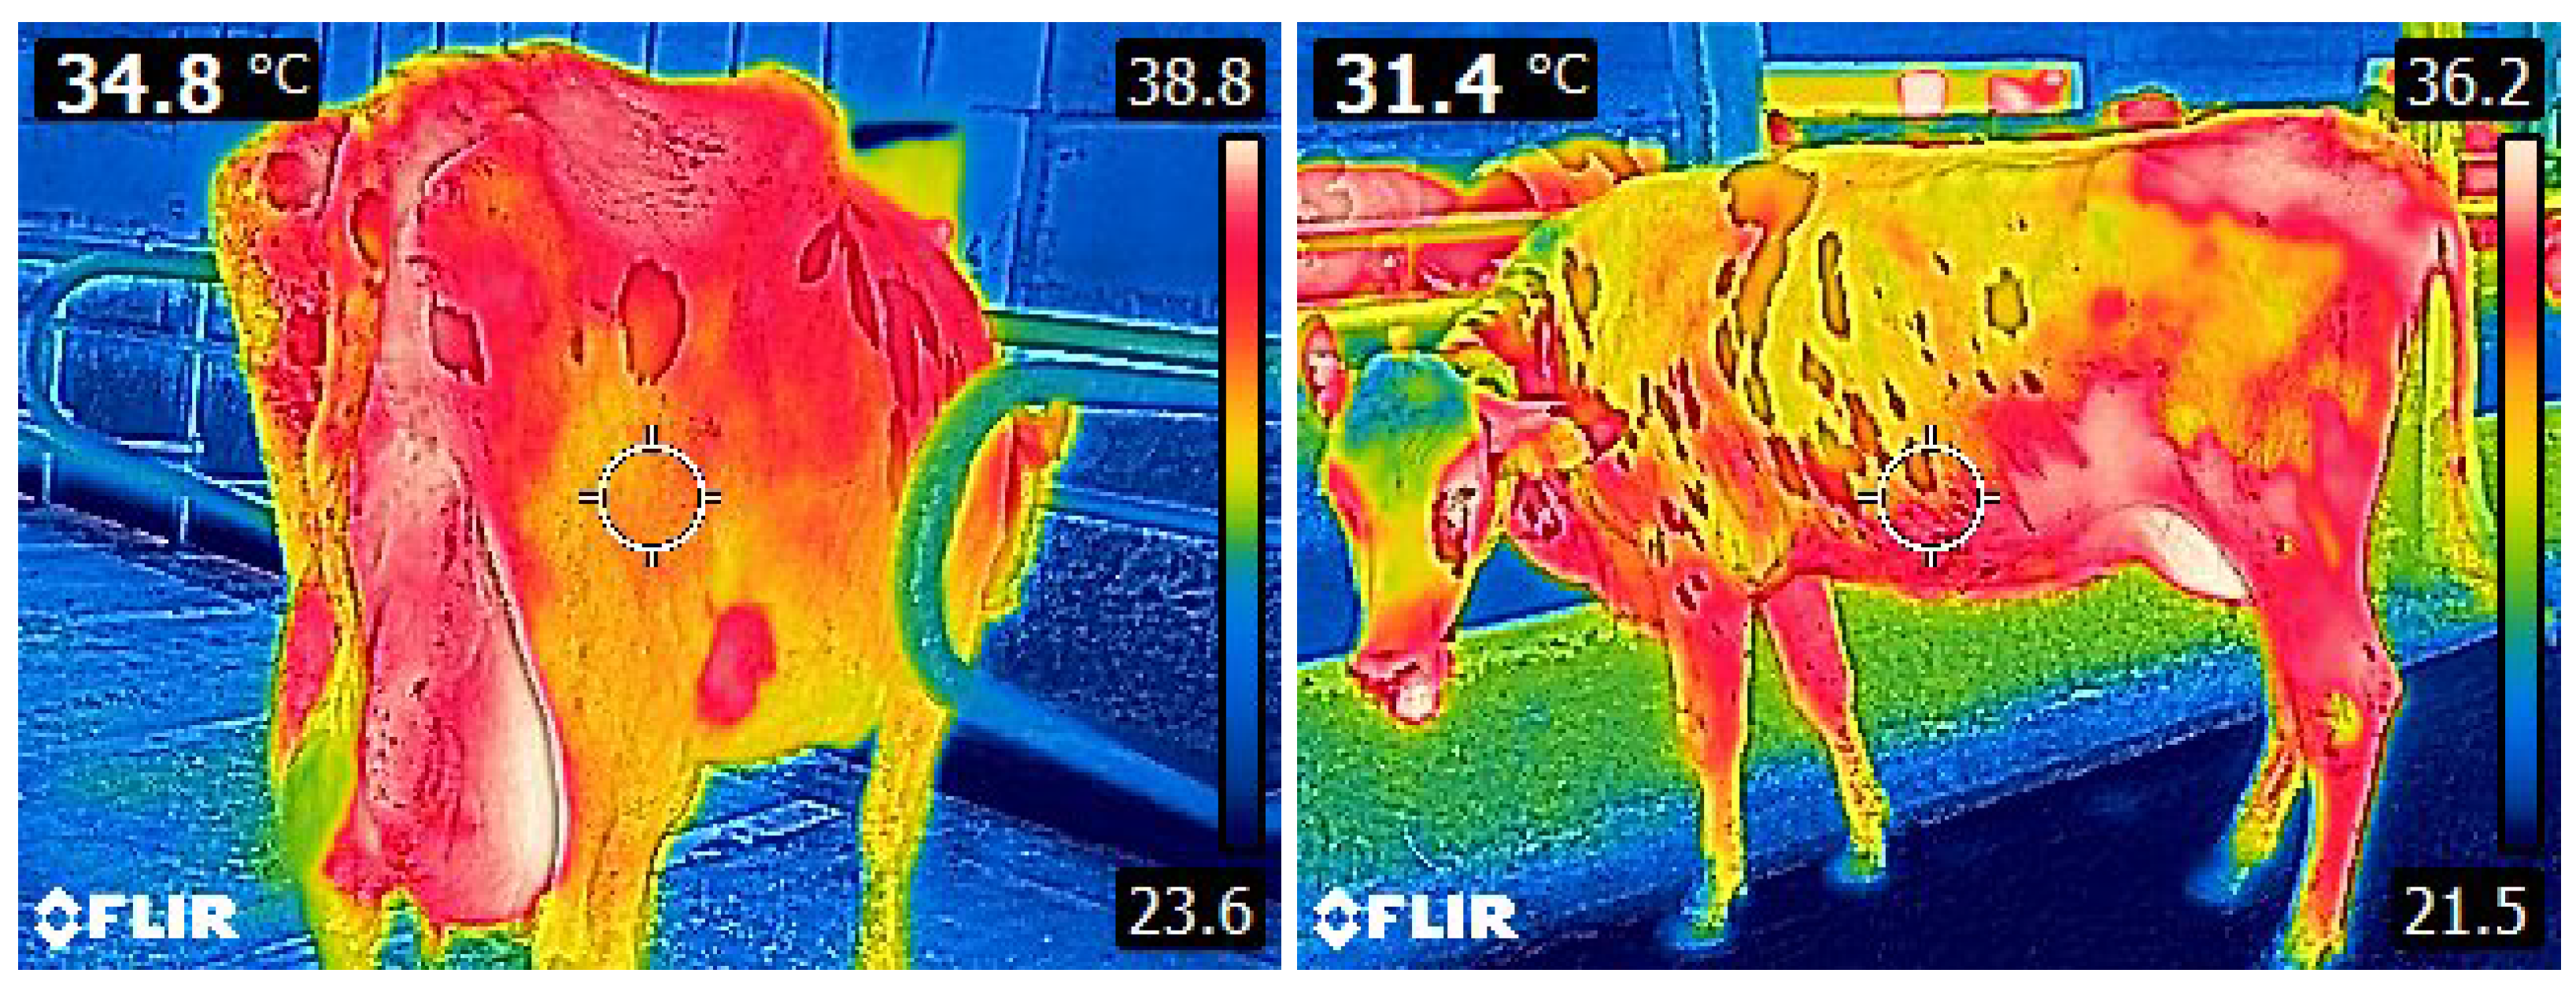
3.3. Infrared Thermography

Infrared thermography is a method of monitoring heat radiation. It serves to detect heat sources and to track their temperature dynamics over time, allowing for visualization and recording of the changes in temperature distribution on the surface of the observed object, in the form of thermographic images (Figure 1). They represent a color complex, in which each color corresponds to a given temperature and shows us the amount of thermal energy that is registered by the thermal camera. It enables measurements and long-term monitoring from a distance. All of this, together with its speed, harmlessness, and accuracy make IRT a preferred tool when working with animals [59,60,61,62,63]. For studies of living tissues, we use thermal cameras ( 160 × 120 pixels) operating in the so-called far infrared range: 8–14 μ m.

3.4. Data Collection

Our study covers the period from May to August, 2018, and monitors animals at a Holstein-Friesian dairy cow farm in Karnobat region, Southeastern Bulgaria. The animals within our samples are raised via free box breeding in a building of semi-open type, with a full-year feeding on a voluntary basis with a mixed diet. Measurements are made twice a day at 10 am and 5 pm. Thermographic images are captured with the FLIR E6 thermal camera. The temperature-humidity index (THI) is reported with the aid of the Kestrel automatic measuring device. All measurements are carried out at the same time in the premises for keeping the cow, as well as the physiological indicators of each cow— rectal temperature, heart rate, and breathing intensity. The calculations of these physiological indicators is done by separating and fixing the cows. Rectal temperature is measured in degrees Celsius by placing a digital thermometer in the rectum. The intensity of respiration was measured by visual observation, and the movement of the chest was measured for a period of one minute, according to the methodology of Zimbelman et al. (2009) [57]. The pulse rate recording was performed manually on the occipital artery. All of this requires time and water until the stress is known, which is reflected in the values of some indicators, especially in respiration [57]. In Table 1, we present some basic statistical estimates for the data gathered within our study.
The cows were studied between May and August, since we had been monitoring physiological indicators and other parameters in May, when they are in comfort. Those parameters were subsequently being tracked during the warmer months, from June to August, in order to investigate the effect of heat stress on the physiological, productive and reproductive features. The reason for this is that the animals had not passed the long period of lactation at that time, and it can be argued that the changes in milk production and content, as well as in other indicators, are due to heat stress. Let us also point out that the experiments have been carried out under field conditions—not in a laboratory-controlled environment. We have chosen namely these features namely because they are easy to measure and are highly correlated with the rectal temperature, as Figure 2 and Figure 3 illustrate. An estimate of their significance for the model is presented in the next section. The time of measurement is included as text or categorical data. As it turns out, this parameter carries crucial information due to the animals’ daily physiological cycles and varying conditions in the farm. Neglecting it reduces our evaluation metric estimates drastically: in some cases, up to 50 % .

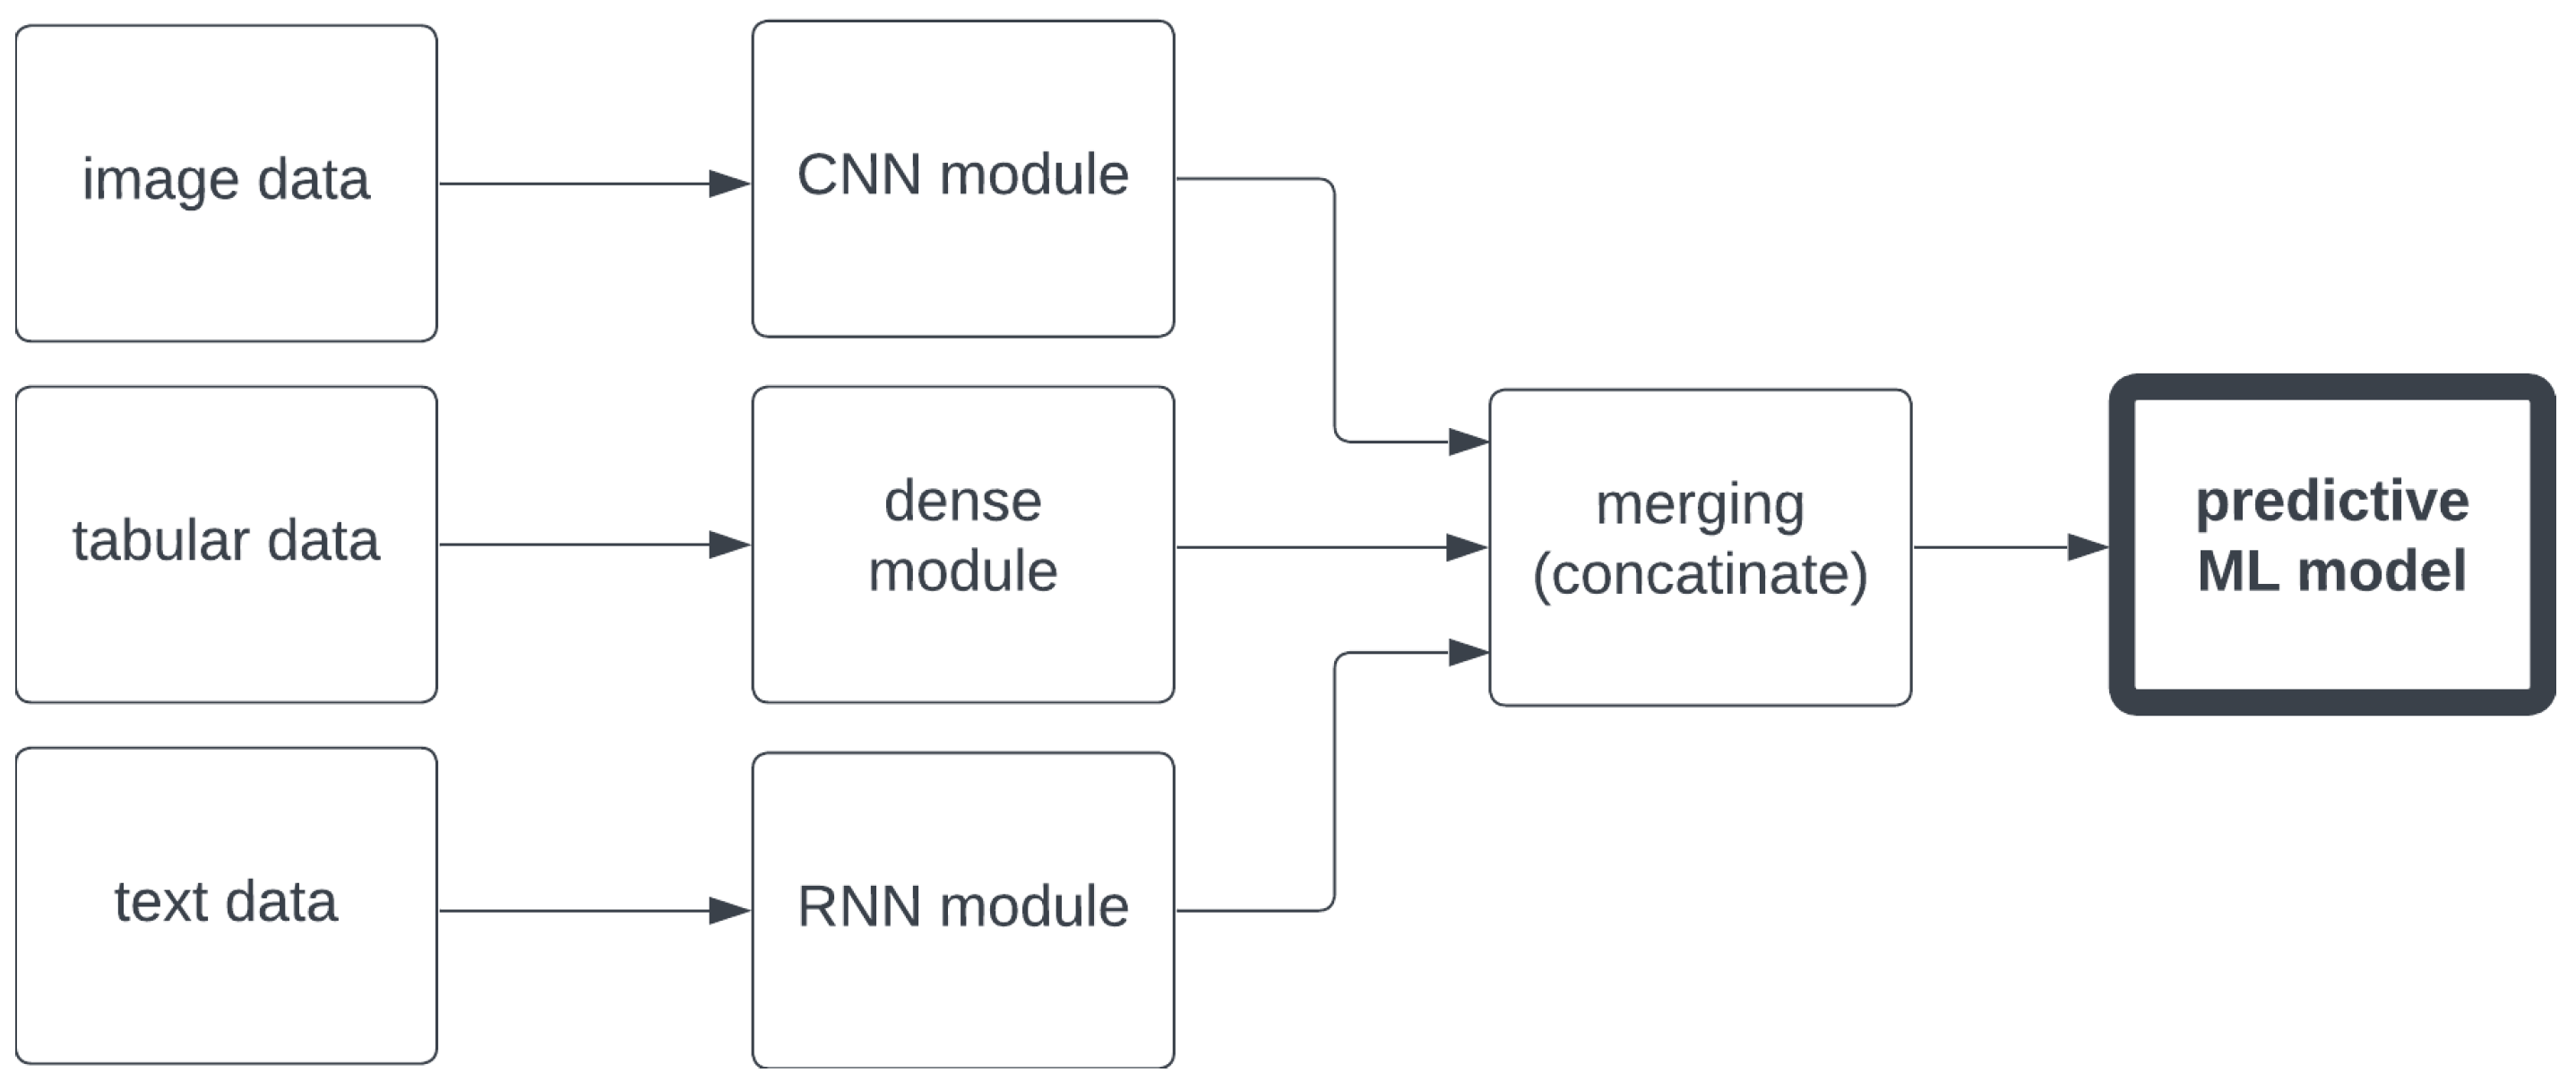
4. Machine Learning Techniques
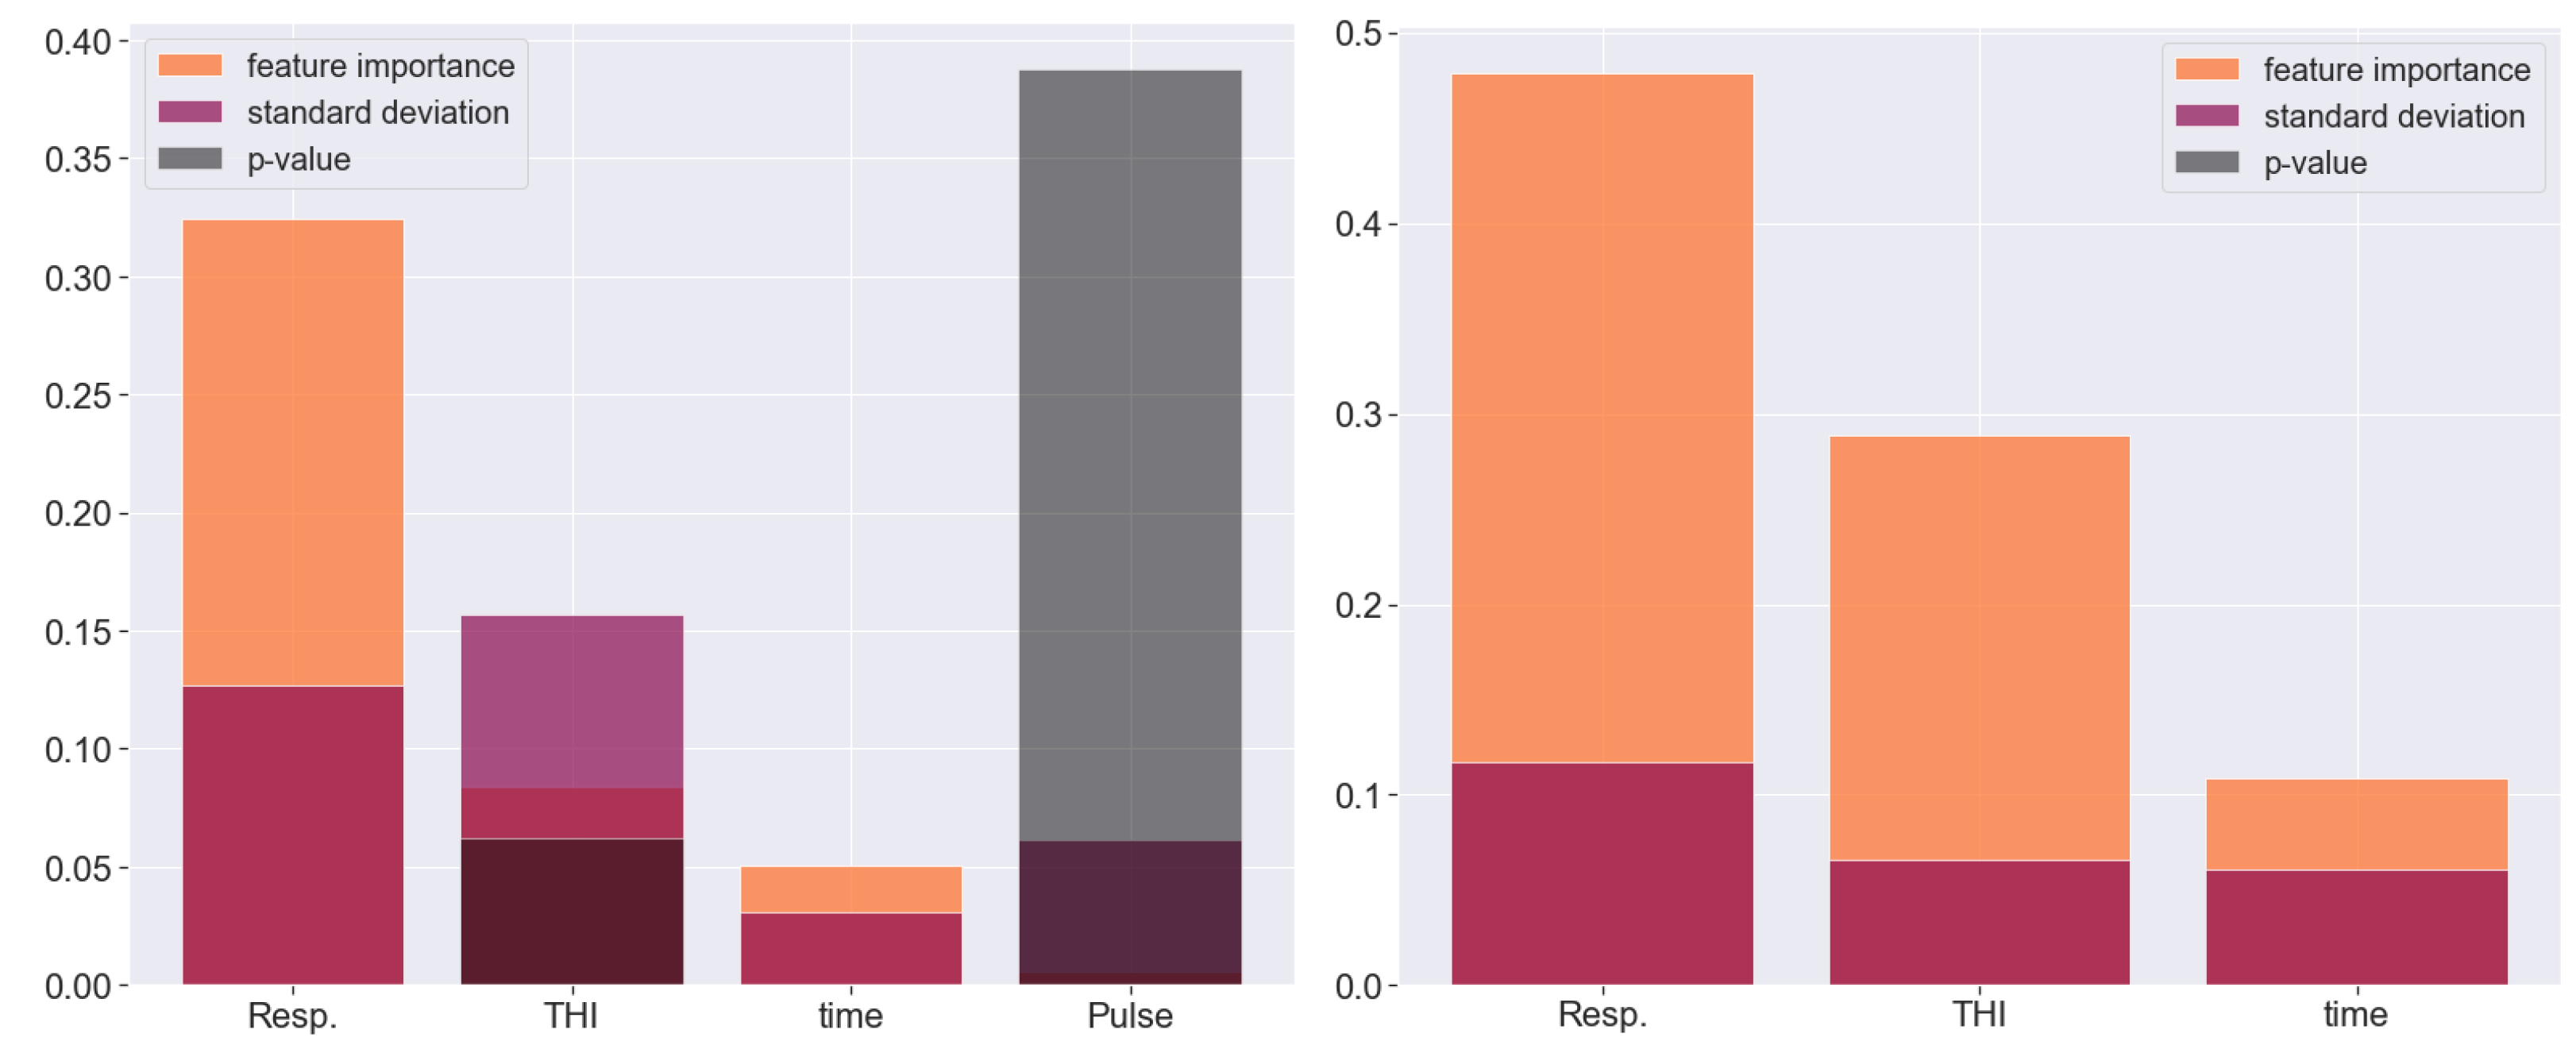
For the realization or the multimodal regression problem described above, we chose a powerful machine learning module, AutoGluon [38], which allows for automatic hyperparameter tuning and compares advanced algorithms based on a custom-selected evaluation metric (such as R 2 , MAE, MedAE, etc.), creates models for image, text, and tabular data, and runs under Python 3 on a low-to-mid-range PC with ease. It allows for the training integral models based on categorical and numerical data (that are easily merged using ’dummy variables’), along with text, dealt with by the standard for this task, recurrent neural networks (RNNs), and images that are analyzed, respectively, as it is customary, with convolutional neural networks (CNNs). The algorithm then merges already-processed data of different types and feeds them to an integral machine learning model to be trained with it, as shown in Figure 4. Images and text are mapped to tables using tools like Word2Vec (see [37] for more details).
However, the choice of model depends not only on the problem setting, but also on the specific features of the data, and so there is no general prescription on how to proceed with that step. There are certainly hints that narrow our choice, but it is done mostly ad hoc, following the empirical criteria for performance. AutoML tools provide a significant improvement in that respect: they test various models, assess them, and tune their hyperparameters without human interference. Then, in order to minimize the distortion effect of each individual model (e.g. overfitting or underfitting), for the end result, it combines the best performing ones into a weighted sum which cancels out a large part of their imperfections (Figure 5). This process is known as ’stacking’ and it has proven to be quite efficient when the available data are scarce or ’messy’ (see, for example, [64]). Note that in both cases, the best models turn out to be ensemble learning regression algorithms based on decision trees and neural networks.
Stacking generalizations were proposed in the 1990s, [42,65] and have ever since been a major boost for the advancement of machine learning. The idea, as has already been mentioned above, is to use the results produced by different models simultaneously in a weighted sum (ensemble), allowing the laws of statistics to deal with some portion of the error. The base model is used for training data in the next level of stacking (here, we use level 2). Their evaluation is performed with different metrics, like MAPE = Δ i : the average of all errors Δ i for the data instances x i , mean squared error MSE = Δ i 2 or MedAE (median of the Δ i s), which we use here. A very common metric is the coefficient of determination, R 2 , as it has a quite clear interpretation as a squared correlation and explains what portion of the variance σ 2 (the average squared deviation from the mean value x i ) of the studied observable is due to the regression model features. Here, we use the so-called coefficient of determination,
R 2 = 1 Δ i 2 / σ 2 , σ 2 = x i 2 x i 2
and we also mention the standard deviation σ . Note that these complex algorithms are quite easy to manipulate using AutoML [66], but one should be mindful of the underlying logic.
As the tables in the following section clearly indicate, neural networks and ensemble learning models outperform other known techniques in the multimodal setting for all our experiments. It is worth mentioning some of their features which make them so adaptive in problems involving fuzzy unstructured data with lots of missing values. In our study, we use all of the three most common types of neural networks: convolutional (CNNs) that find patterns in the images (we have not trained them to recognize specific body parts, they only keep track on the surface heat distribution.), recurrent (RNNs) that analyze the text in our datasets (as a substitute for encoding, e.g., in the feature importance estimates) and the usual artificial neural networks (ANNs), which give predictions in our stack ensemble based on tabular values. However, those algorithms have become an integral part of our everyday life with social media, chat-bots, and face recognition apps, so they probably do not need much explanation. Ensemble learning techniques, on the other hand, seem to be popular mostly within the data science community as they tend to solve more specific tasks; thus, we shall comment on them. Ensemble learning promotes the concept of collective decisions, showing in practice that a large number of rough and biased models (weak learners) often beat the accuracies of highly sophisticated algorithms. The most commonly used example, Random Forest (RF), has been around for almost three decades. It uses an ensemble of decision trees trained in parallel with biased data—each tree, with its own sample and subset of features via bootstrapping (sampling with replacement). Then, simple majority vote (aggregation) takes place for the output, although statistical weights can also be introduced in some modifications. Combining these two stages, we end up with what in ML slang is called a bagging model. It is powerful and unpretentious at the same time, good for parallel processing and resistant to overfitting, but it might need lots of resources, especially when it comes to hyperparameter tuning and optimization. Boosting algorithms provide significant improvement in that respect, relying on the iterative corrections of statistical weights assigned to each data instance in the samples. The ones that lead to wrong predictions are promoted by increasing the corresponding weight, so that they are more likely to appear in the next iteration, giving the model a chance to learn and to minimize the error, much like how musicians spend more time on the difficult parts of the pieces. That is the basis of adaptive boosting (AdaBoost), but there are certainly other variations to this idea. For example, gradient boosting algorithms, such as XGBoost, use gradient descent to optimize the weights at each iteration, just like as with neural networks do. This makes it quite fast and successful in balancing the so-called ’bias-variance trade-off’. Just like bagging algorithms, it does not require data normalization and works well even with missing values, but it seems to be more sensitive to outliers, and so one needs to pay attention. Nevertheless, it is one of the best known solutions to both the classification and regression machine learning problems. CatBoost is another gradient boosting algorithm that is specifically designed for handling categorical data in a more efficient manner. It works well even with smaller samples, it does not require much tuning, and it takes special measures to prevent overfitting. Another difference is the decision tree topology: ’stumps’ for AdaBoost, symmetric trees for CatBoost, and leaf-wise growing ones for LightGBM.

5. Results

In this section, we present the experimental results of our models and assess their behavior. We consider two samples of tabular data with their corresponding thermal images. In sample A, we have information about the temperature-humidity index (THI) at the moment of each of the 138 measurements, as well as the respiration frequency, pulse, and rectal temperature of 118 dairy cows from one farm. Sample B consists of 522 data instances for 295 animals, this time coming from two different farms and with the exception of the pulse measurements that are not available for all the animals; hence, we can discard them in this setting. In both cases, we begin with clearing the data and encoding the hour of the day in which the corresponding measurement has been taken, as the physiological parameters may differ according to the time of the day. Thus, we have a binary-encoded time variable, in addition to the numerical features and the infrared images, and a target which we want our model to be able to predict with a reasonable degree of precision. Neither the images nor the tabular data alone are sufficient to achieve this goal, even when using highly advanced machine learning algorithms. Our test shows R 2 < 0.3 and a mean absolute error (MAE) to within a couple of degrees Celsius.
After processing the image layer in the standard manner using a convolutional neural network (CNN), and by concatenating the result with our tabular data containing numerical features and dummy variables, we let the AutoML engine rank the models for both samples with respect to the R 2 , MAE, MedAE, and RMSE = MSE metrics. The ensemble learning algorithms and neural networks provide the most accurate results: the ’winners’ for both samples are XGBoost, CatBoost, and NeuralNetTorch. The WeightedEnsemble_L2 model essentially provides a weighted sum (stacking) in order to refine the final prediction, and the improvement for the two datasets can be seen in Table 2 and Table 3. The evaluation is based on cross-validation, which tends to provide a more accurate and objective assessment.
The test data in all experiments consist of randomly chosen samples with volume 20 % . The feature importance data (Figure 6) show that including the pulse does not add much value. It is visible from Figure 3 that the tabular predictors in both samples are highly correlated, but multiliearity does not cause problems when we employ ensemble learning regression methods, which is one of their major advantages. The only categorical data that we use indicate the hour of measurement, so we encode it with a binary variable as there are only two options: 10 am and 5 pm. Merging tabular predictors and images with AutoGluon in a powerful multimodal ensemble learning algorithm yields quite a decent degree of accuracy: for sample A, we end up with a coefficient of determination of R 2 = 0.65 (meaning a correlation of R > 0.8 ) and MAE 0.2 °C. The error goes up to 0 . 78 ° for the outliers (the standard deviation σ determines the thresholds for outliers, respectively, at T A 0.34 °C and T B 0.30 °C) (see Figure 7), but it remains below 0.5   ° C in more than 92 % of the predictions. For sample B, we have R 2 = 0.73 , i.e., R > 0.85 , and respectively, MAE 0.1 °C. Although the maximal error reaches almost 1 °C, over 95 % of the predictions are within 0.5 °C from the target, with a median error of only 5 milidegrees.
Finally, we plot the data from the measurements and the predicted values to visualize the overlap between the two sets (see Figure 8 and Figure 9). There are some outliers which may be analyzed further in the context of detecting pathological tendencies such as illness or thermal stress in animals. Let us note that if one attempts to reverse the problem, e.g., predicting the pulse or respiration frequency based on thermal images and the remaining tabular data, the accuracy of the regression model is significantly reduced: R 2 varies in a wide range and the relative error is up to 60%, and so the target choice is not quite arbitrary. We also find predictions based on the R 2 cross-validation metric to be better fitting for both samples.

6. Discussion

The accurate measurement of rectal temperature is crucial for real-time monitoring and the early diagnostics of various health issues with dairy cows. The standard invasive methods, however, may be stressful to the animal and costly for the farmer, so they cannot be performed with a high enough frequency to meet the demands of real-time health control. Combining physiological features and thermal images for dairy cows allows us to estimate their rectal temperature in a non-invasive manner with an average accuracy that is commensurate with that of widely used thermometers, despite the small size of the training samples used in our experiments. Modern AutoML tools are intuitive to operate and are optimized to perform such tasks on low-end computers with ease, and so the ‘learning’ and the updating can be done locally, using an app on the farmer’s laptop or mobile phone. With the increasing efficiency and decreasing prices of electronic equipment, in particular, IR cameras, and continuous wave (CW) and ultra-wideband (UWB) radars (see [67,68] for more details), as well as mobile weather stations with high functionality, the application of artificial intelligence in dairy farms has the potential to automate many processes and to improve the quality of life of cows. The use of non-contact and non-invasive methods reduces the stress and improves the health of farm animals by allowing for the early detection of diseases and various other abnormalities, facilitating the work of veterinary specialists, zoo engineers, and caretakers.

7. Conclusions

Our study demonstrates some advantages of multimodal machine learning in a practical problem, which is important in farming and veterinary medicine. Infrared cameras and interconnected sensors used in IoT-based smart farming, smart homes, or smart cities, on the other hand, allow for real-time surveillance, while ML models can provide a sufficiently accurate estimate of vital parameters like rectal temperature, completing the dataset and thus opening the door for more accurate multi-label classification models—a natural step towards medical applications. This trail of thoughts is not restricted by any means to farms and cattle—a similar idea can be discussed in wildlife scenarios, as well in a human context, e.g., smart baby monitors, epidemic control at airports etc., which we will leave for further research.

Author Contributions

Conceptualization, D.B. and H.H.; methodology, D.B. and H.H.; software, D.B.; validation, D.B.; formal analysis, D.B.; investigation, H.H.; resources, D.D.; data curation, H.H.; writing—original draft preparation, D.B. and H.H.; writing—review and editing, D.B., H.H. and K.A.; visualization, D.B.; supervision, K.A.; project administration, H.H. and D.D.; funding acquisition, D.D. and H.H. All authors have read and agreed to the published version of the manuscript.

Funding

This investigation was funded by the Bulgarian Ministry of Education and Science (MES) within the Bulgarian National Recovery and Resilience Plan, component, “Innovative Bulgaria”, under project, “Development of research and innovation at Trakia University in service of health and sustainable well-being”, grant number: BG-RRP-2.004-0006-C02.

Institutional Review Board Statement

Not applicable.

Informed Consent Statement

Not applicable.

Data Availability Statement

Not applicable.

Conflicts of Interest

The authors declare no conflict of interest.

Abbreviations

The following abbreviations are used in this manuscript:
THITemperature-humidity index
IRTInfrared thermography
MAEMean absolute error
MedAEMedian absolute error
RMSERoot mean square error
XGBoostExtreme Gradient Boosting
CatBoostCategory Boosting
CNNsConvolutional neural networks
IoTInternet of things

References

  1. Lahiri, B.B.; Bagavathiappan, S.; Jayakumar, T.; Philip, J. Medical Applications of Infrared Thermography: A Review. Infrared Phys. Technol. 2012, 55, 221–235. [Google Scholar] [CrossRef] [PubMed]
  2. Vainer, B.G.; Morozov, V.V. Infrared Thermography-Based Biophotonics: Integrated Diagnostic Technique for Systemic Reaction Monitoring. Phys. Procedia 2017, 86, 81–85. [Google Scholar] [CrossRef]
  3. Schlessinger, M. Infrared Technology Fundamentals; Routledge: London, UK, 2019; ISBN 9780203750834. [Google Scholar]
  4. Ring, F.J.; Ng, E.Y.K.; Diakides, M.; Bronzino, J.; Peterson, D. Infrared Thermal Imaging Standards for Human Fever Detection. In Medical Infrared Imaging: Principles and Practices; CRC Press: Boca Raton, FL, USA, 2012; pp. 1–5. [Google Scholar]
  5. Miller, J.L. Principles of Infrared Technology; Springer: New York, NY, USA, 2012; ISBN 9781461576662. [Google Scholar]
  6. Soroko, M.; Howell, K. Infrared Thermography: Current Applications in Equine Medicine. J. Equine Vet. Sci. 2018, 60, 90–96.e2. [Google Scholar] [CrossRef]
  7. Bansi, D. Utilization of Infrared Thermography in Cattle Production and Its Application Potency in Indonesia. WARTAZOA. Indones. Bull. Anim. Vet. Sci. 2018, 28, 99–106. [Google Scholar] [CrossRef]
  8. Colak, A.; Polat, B.; Okumus, Z.; Kaya, M.; Yanmaz, L.E.; Hayirli, A. Short Communication: Early Detection of Mastitis Using Infrared Thermography in Dairy Cows. J. Dairy Sci. 2008, 91, 4244–4248. [Google Scholar] [CrossRef]
  9. Porcionato, M.A.F.; Canata, T.F.; Oliveira, C.E.L.D.E.; Santos, M.V.D.O.S. Udder thermography of gyr cows for subclinical mastitis detection. Rev. Bras. Eng. Biossistemas 2009, 3, 251–257. [Google Scholar] [CrossRef]
  10. Polat, B.; Colak, A.; Cengiz, M.; Yanmaz, L.E.; Oral, H.; Bastan, A.; Kaya, S.; Hayirli, A. Sensitivity and Specificity of Infrared Thermography in Detection of Subclinical Mastitis in Dairy Cows. J. Dairy Sci. 2010, 93, 3525–3532. [Google Scholar] [CrossRef]
  11. Sathiyabarathi, M.; Jeyakumar, S.; Manimaran, A.; Jayaprakash, G.; Pushpadass, H.A.; Sivaram, M.; Ramesha, K.P.; Das, D.N.; Kataktalware, M.A.; Prakash, M.A.; et al. Infrared Thermography: A Potential Noninvasive Tool to Monitor Udder Health Status in Dairy Cows. Vet. World 2016, 9, 1075–1081. [Google Scholar] [CrossRef]
  12. Zaninelli, M.; Redaelli, V.; Luzi, F.; Bronzo, V.; Mitchell, M.; Dell’Orto, V.; Bontempo, V.; Cattaneo, D.; Savoini, G. First Evaluation of Infrared Thermography as a Tool for the Monitoring of Udder Health Status in Farms of Dairy Cows. Sensors 2018, 18, 862. [Google Scholar] [CrossRef]
  13. Berry, R.J.; Kennedy, A.D.; Scott, S.L.; Kyle, B.L.; Schaefer, A.L. Daily Variation in the Udder Surface Temperature of Dairy Cows Measured by Infrared Thermography: Potential for Mastitis Detection. Can. J. Anim. Sci. 2003, 83, 687–693. [Google Scholar] [CrossRef]
  14. Sinha, R.; Bhakat, M.; Mohanty, T.K.; Ranjan, A.; Kumar, R.; Lone, S.A.; Rahim, A.; Paray, A.R.; Khosla, K.; Danish, Z. Infrared Thermography as Non-Invasive Technique for Early Detection of Mastitis in Dairy Animals—A Review. Asian J. Dairy Food Res. 2018, 37, 1–6. [Google Scholar]
  15. Pamparienė, I.; Veikutis, V.; Oberauskas, V.; Žymantienė, J.; Želvytė, R.; Stankevičius, A.; Marčiulionytė, D.; Palevičius, P. Thermography Based Inflammation Monitoring of Udder State in Dairy Cows: Sensitivity and Diagnostic Priorities Comparing with Routine California Mastitis Test. J. Vibroeng. 2016, 18, 511–521. [Google Scholar]
  16. Hovinen, M.; Siivonen, J.; Taponen, S.; Hänninen, L.; Pastell, M.; Aisla, A.-M.; Pyörälä, S. Detection of Clinical Mastitis with the Help of a Thermal Camera. J. Dairy Sci. 2008, 91, 4592–4598. [Google Scholar] [CrossRef]
  17. Alsaaod, M.; Büscher, W. Detection of Hoof Lesions Using Digital Infrared Thermography in Dairy Cows. J. Dairy Sci. 2012, 95, 735–742. [Google Scholar] [CrossRef] [PubMed]
  18. Amezcua, R.; Walsh, S.; Luimes, P.H.; Friendship, R.M. Infrared Thermography to Evaluate Lameness in Pregnant Sows. Can. Vet. J. 2014, 55, 268–272. [Google Scholar]
  19. Novotna, I.; Langova, L.; Havlicek, Z. Risk Factors and Detection of Lameness Using Infrared Thermography in Dairy Cows—A Review. Ann. Anim. Sci. 2019, 19, 563–578. [Google Scholar] [CrossRef]
  20. Koltes, J.E.; Koltes, D.A.; Mote, B.E.; Tucker, J.; Hubbell, D.S., 3rd. Automated Collection of Heat Stress Data in Livestock: New Technologies and Opportunities. Transl. Anim. Sci. 2018, 2, 319–323. [Google Scholar] [CrossRef]
  21. Kříž, P.; Horčičková, M.; Bumbálek, R.; Bartoš, P.; Smutný, L.; Stehlík, R.; Zoubek, T.; Černý, P.; Vochozka, V.; Kuneš, R. Application of the Machine Vision Technology and Infrared Thermography to the Detection of Hoof Diseases in Dairy Cows: A Review. Appl. Sci. 2021, 11, 11045. [Google Scholar] [CrossRef]
  22. Wang, Y.; Kang, X.; He, Z.; Feng, Y.; Liu, G. Accurate Detection of Dairy Cow Mastitis with Deep Learning Technology: A New and Comprehensive Detection Method Based on Infrared Thermal Images. Animal 2022, 16, 100646. [Google Scholar] [CrossRef]
  23. Çevik, K.K.; Boğa, M. Body Condition Score (BCS) Segmentation and Classification in Dairy Cows Using R-CNN Deep Learning Architecture. Eur. J. Sci. Technol. 2019, 1248–1255. [Google Scholar] [CrossRef]
  24. Bochtis, D.D.; Moshou, D.E.; Vasileiadis, G.; Balafoutis, A.; Pardalos, P.M. Information and Communication Technologies for Agriculture—Theme II: Data; Springer Nature: Berlin/Heidelberg, Germany, 2022; ISBN 9783030841485. [Google Scholar]
  25. Xie, Q.; Wu, M.; Yang, M.; Bao, J.; Zheng, P. A Deep Learning-Based Fusion Method of Infrared Thermography and Visible Image for Pig Body Temperature Detection. In Proceedings of the International Symposium on Animal Environment and Welfare, Chongqing, China, 20–23 October 2021; pp. 326–333. [Google Scholar]
  26. Manullang, M.C.T.; Lin, Y.-H.; Lai, S.-J.; Chou, N.-K. Implementation of Thermal Camera for Non-Contact Physiological Measurement: A Systematic Review. Sensors 2021, 21, 7777. [Google Scholar] [CrossRef] [PubMed]
  27. Oliveira, R.F.d.; Ferreira, R.A.; Abreu, L.H.P.; Yanagi Júnior, T.; Lourençoni, D. Estimation of respiratory frequency and rectal temperature on pigs in heat stress by fuzzy logic. Eng. Agrícola 2018, 38, 457–470. [Google Scholar] [CrossRef]
  28. Li, G.; Chen, S.; Chen, J.; Peng, D.; Gu, X. Predicting Rectal Temperature and Respiration Rate Responses in Lactating Dairy Cows Exposed to Heat Stress. J. Dairy Sci. 2020, 103, 5466–5484. [Google Scholar] [CrossRef] [PubMed]
  29. Neves, S.F.; Silva, M.C.F.; Miranda, J.M.; Stilwell, G.; Cortez, P.P. Predictive Models of Dairy Cow Thermal State: A Review from a Technological Perspective. Vet. Sci. 2022, 9, 416. [Google Scholar] [CrossRef] [PubMed]
  30. Theusme, C.; Avendaño-Reyes, L.; Macías-Cruz, U.; Castañeda-Bustos, V.; García-Cueto, R.; Vicente-Pérez, R.; Mellado, M.; Meza-Herrera, C.; Vargas-Villamil, L. Prediction of Rectal Temperature in Holstein Heifers Using Infrared Thermography, Respiration Frequency, and Climatic Variables. Int. J. Biometeorol. 2022, 66, 2489–2500. [Google Scholar] [CrossRef]
  31. Kulaz, E.; Ser, G. A Meta-Analysis of Heat Stress in Dairy Cattle: The Increase in Temperature Humidity Index Affects Both Milk Yield and Some Physiological Parameters. Czech J. Anim. Sci. 2022, 67, 209–217. [Google Scholar] [CrossRef]
  32. Jorquera-Chavez, M.; Fuentes, S.; Dunshea, F.R.; Warner, R.D.; Poblete, T.; Jongman, E.C. Modelling and Validation of Computer Vision Techniques to Assess Heart Rate, Eye Temperature, Ear-Base Temperature and Respiration Rate in Cattle. Animals 2019, 9, 1089. [Google Scholar] [CrossRef]
  33. Bleul, U.; Hässig, M.; Kluser, F. Screening of febrile cows using a small handheld infrared thermography device. Tierärztliche Prax. Ausg. G Großtiere Nutztiere 2021, 49, 12–20. [Google Scholar] [CrossRef]
  34. Lewis Baida, B.E.; Swinbourne, A.M.; Barwick, J.; Leu, S.T.; van Wettere, W.H.E.J. Technologies for the Automated Collection of Heat Stress Data in Sheep. Anim. Biotelemetry 2021, 9, 4. [Google Scholar] [CrossRef]
  35. Hennessey, E.; DiFazio, M.; Hennessey, R.; Cassel, N. Artificial Intelligence in Veterinary Diagnostic Imaging: A Literature Review. Vet. Radiol. Ultrasound 2022, 63 (Suppl. 1), 851–870. [Google Scholar] [CrossRef]
  36. Lazri, Z.M.; Zhu, Q.; Chen, M.; Wu, M.; Wang, Q. Detecting Essential Landmarks Directly in Thermal Images for Remote Body Temperature and Respiratory Rate Measurement with a Two-Phase System. IEEE Access 2022, 10, 39080–39094. [Google Scholar] [CrossRef]
  37. Erickson, N.; Shi, X.; Sharpnack, J.; Smola, A. Multimodal AutoML for Image, Text and Tabular Data. In Proceedings of the 28th ACM SIGKDD Conference on Knowledge Discovery and Data Mining, Washington, DC, USA, 14–18 August 2022; Association for Computing Machinery: New York, NY, USA, 2022; pp. 4786–4787. [Google Scholar]
  38. Erickson, N.; Mueller, J.W.; Shirkov, A.; Zhang, H.; Larroy, P.; Li, M.; Smola, A. AutoGluon-Tabular: Robust and Accurate AutoML for Structured Data. arXiv 2020, arXiv:2003.06505. [Google Scholar]
  39. Aluja-Banet, T.; Daunis-I-Estadella, J.; Brunsó, N.; Mompart-Penina, A. Improving Prevalence Estimation through Data Fusion: Methods and Validation. BMC Med. Inform. Decis. Mak. 2015, 15, 49. [Google Scholar] [CrossRef]
  40. Mazor, E.; Averbuch, A.; Bar-Shalom, Y.; Dayan, J. Interacting multiple model methods in target tracking: A survey. IEEE Trans. Aerosp. Electron. Syst. 1998, 34, 103–123. [Google Scholar] [CrossRef]
  41. Li, X.R. Engineers’ Guide to Variable-Structure Multiple-Model Estimation and Tracking. Multitarg.-Multisens. Track. Appl. Adv. 2000, 3, 499–567. [Google Scholar]
  42. Wolpert, D.H. Stacked Generalization. Neural Netw. 1992, 5, 241–259. [Google Scholar] [CrossRef]
  43. Caruana, R.; Niculescu-Mizil, A.; Crew, G.; Ksikes, A. Ensemble Selection from Libraries of Models. In Proceedings of the Twenty-First International Conference on Machine Learning, Banff, AB, Canada, 4–8 July 2004; Association for Computing Machinery: New York, NY, USA, 2004; p. 18. [Google Scholar] [CrossRef]
  44. Bao, J.; Xie, Q. Artificial Intelligence in Animal Farming: A Systematic Literature Review. J. Clean. Prod. 2022, 331, 129956. [Google Scholar] [CrossRef]
  45. Selvaraju, V.; Spicher, N.; Wang, J.; Ganapathy, N.; Warnecke, J.M.; Leonhardt, S.; Swaminathan, R.; Deserno, T.M. Continuous Monitoring of Vital Signs Using Cameras: A Systematic Review. Sensors 2022, 22, 4097. [Google Scholar] [CrossRef]
  46. Fuentes, S.; Gonzalez Viejo, C.; Tongson, E.; Dunshea, F.R. The Livestock Farming Digital Transformation: Implementation of New and Emerging Technologies Using Artificial Intelligence. Anim. Health Res. Rev. 2022, 23, 59–71. [Google Scholar] [CrossRef]
  47. Wang, S.; Jiang, H.; Qiao, Y.; Jiang, S.; Lin, H.; Sun, Q. The Research Progress of Vision-Based Artificial Intelligence in Smart Pig Farming. Sensors 2022, 22, 6541. [Google Scholar] [CrossRef]
  48. Fuentes, S.; Gonzalez Viejo, C.; Cullen, B.; Tongson, E.; Chauhan, S.S.; Dunshea, F.R. Artificial Intelligence Applied to a Robotic Dairy Farm to Model Milk Productivity and Quality based on Cow Data and Daily Environmental Parameters. Sensors 2020, 20, 2975. [Google Scholar] [CrossRef] [PubMed]
  49. De Vries, A.; Bliznyuk, N.; Pinedo, P. Invited Review: Examples and Opportunities for Artificial Intelligence (AI) in Dairy Farms. Appl. Anim. Sci. 2023, 39, 14–22. [Google Scholar] [CrossRef]
  50. Dimanov, D.; Mitev, Y. Animal Health & Welfare; Callisto Reference: Stara Zagora, Bulgaria, 2004; ISBN 954-9887-45-9. (In Bulgarian) [Google Scholar]
  51. Silanikove, N. Effects of Heat Stress on the Welfare of Extensively Managed Domestic Ruminants. Livest. Prod. Sci. 2000, 67, 1–18. [Google Scholar] [CrossRef]
  52. Penev, T.; Dimov, D.; Marinov, I.; Angelova, T. Study of Influence of Heat Stress on Some Physiological and Productive Traits in Holstein-Friesian Dairy Cows. Agron. Res. 2021, 19. [Google Scholar] [CrossRef]
  53. Brown-Brandl, T.M.; Eigenberg, R.A.; Nienaber, J.A.; Hahn, G.L. Dynamic Response Indicators of Heat Stress in Shaded and Non-Shaded Feedlot Cattle, Part 1: Analyses of Indicators. Biosyst. Eng. 2005, 90, 451–462. [Google Scholar] [CrossRef]
  54. Fuhrer, J.; Gregory, P.J. Climate Change Impact and Adaptation in Agricultural Systems: Soil Ecosystem Management in Sustainable Agriculture; CABI: Houston, TX, USA, 2014; ISBN 9781780642895. [Google Scholar]
  55. Armstrong, D.V. Heat Stress Interaction with Shade and Cooling. J. Dairy Sci. 1994, 77, 2044–2050. [Google Scholar] [CrossRef]
  56. Watson, R.R.; Collier, R.J.; Preedy, V.R. Nutrients in Dairy and Their Implications for Health and Disease; Academic Press: Cambridge, MA, USA, 2017; ISBN 9780128097632. [Google Scholar]
  57. Zimbelman, R.; Rhoads, R.; Rhoads, M.; Baumgard, L.; Collier, R. A Re-Evaluation of the Impact of Temperature Humidity Index (THI) and Black Globe Humidity Index (BGHI) on Milk Production in High Producing Dairy Cows. In Proceedings of the 24th Annual Southwest Nutrition and Management Conference, Tempe, AZ, USA, 26–27 February 2009; pp. 159–168. [Google Scholar]
  58. Dikmen, S.; Hansen, P.J. Is the Temperature-Humidity Index the Best Indicator of Heat Stress in Lactating Dairy Cows in a Subtropical Environment? J. Dairy Sci. 2009, 92, 109–116. [Google Scholar] [CrossRef] [PubMed]
  59. Daltro, D.d.S.; Fischer, V.; Alfonzo, E.P.M.; Dalcin, V.C.; Stumpf, M.T.; Kolling, G.J.; da Silva, M.V.G.B.; McManus, C. Infrared Thermography as a Method for Evaluating the Heat Tolerance in Dairy Cows. R. Bras. Zootec. 2017, 46, 374–383. [Google Scholar] [CrossRef]
  60. St-Pierre, N.R.; Cobanov, B.; Schnitkey, G. Economic Losses from Heat Stress by US Livestock Industries. J. Dairy Sci. 2003, 86, E52–E77. [Google Scholar] [CrossRef]
  61. Martello, L.S.; da Luz E Silva, S.; da Costa Gomes, R.; da Silva Corte, R.R.P.; Leme, P.R. Infrared Thermography as a Tool to Evaluate Body Surface Temperature and Its Relationship with Feed Efficiency in Bos Indicus Cattle in Tropical Conditions. Int. J. Biometeorol. 2016, 60, 173–181. [Google Scholar] [CrossRef]
  62. Bang, N.N.; Gaughan, J.B.; Hayes, B.J.; Lyons, R.E.; McNeill, D.M. Application of Infrared Thermal Technology to Assess the Level of Heat Stress and Milk Yield Reduction of Cows in Tropical Smallholder Dairy Farms. J. Dairy Sci. 2022, 105, 8454–8469. [Google Scholar] [CrossRef]
  63. McManus, C.; Tanure, C.B.; Peripolli, V.; Seixas, L.; Fischer, V.; Gabbi, A.M.; Menegassi, S.R.O.; Stumpf, M.T.; Kolling, G.J.; Dias, E.; et al. Infrared Thermography in Animal Production: An Overview. Comput. Electron. Agric. 2016, 123, 10–16. [Google Scholar] [CrossRef]
  64. Brezov, D.; Burov, A. Ensemble Learning Traffic Model for Sofia: A Case Study. Appl. Sci. 2023, 13, 4678. [Google Scholar] [CrossRef]
  65. Ting, K.M.; Witten, I.H. Stacking Bagged and Dagged Models. In Proceedings of the Fourteenth International Conference on Machine Learning (ICML ’97), Nashville, TN, USA, 8–12 July 1997; Morgan Kaufmann Publishers Inc.: San Francisco, CA, USA, 1997; pp. 367–375. [Google Scholar]
  66. Hutter, F.; Kotthoff, L.; Vanschoren, J. Automated Machine Learning: Methods, Systems, Challenges; Springer: Berlin/Heidelberg, Germany, 2019; ISBN 9783030053185. [Google Scholar]
  67. Rittiplang, A.; Phasukkit, P.; Orankitanun, T. Optimal Central Frequency for Non-Contact Vital Sign Detection Using Monocycle UWB Radar. Sensors 2020, 20, 2916. [Google Scholar] [CrossRef] [PubMed]
  68. Xu, H.; Ebrahim, M.P.; Hasan, K.; Heydari, F.; Howley, P.; Yuce, M.R. Accurate Heart Rate and Respiration Rate Detection Based on a Higher-Order Harmonics Peak Selection Method Using Radar Non-Contact Sensors. Sensors 2022, 22, 83. [Google Scholar] [CrossRef] [PubMed]
Figure 1. Infrared images of dairy cows from different angles.
Applsci 13 11416 g001
Figure 2. Our tabular predictors against the measured rectal temperature for the two samples.
Applsci 13 11416 g002
Figure 3. Correlation heatmap of the tabular predictors for sample A (left) and sample B (right).
Applsci 13 11416 g003
Figure 4. The basic idea behind multimodal ML algorithms.
Applsci 13 11416 g004
Figure 5. Merging and stacking of multiple models in AutoML.
Applsci 13 11416 g005
Figure 6. Feature importance for the tabular predictors for sample A (left) and sample B (right).
Applsci 13 11416 g006
Figure 7. A histogram of the absolute error distributions for the two samples; the y-scale ratio is 2:1.
Applsci 13 11416 g007
Figure 8. Visual comparison between predicted and measured RT-values in sample A.
Applsci 13 11416 g008
Figure 9. Visual comparison between predicted and measured RT-values in sample B.
Applsci 13 11416 g009
Table 1. Basic statistical indicators for the gathered data: 138 instances in sample A, 522 in sample B.
FeatureModeMedianMeanStandard Deviation
THI 75.4 75.2 74.9 2.58
Resp. 9.0 10.0 10.8 3.11
Pulse 21.0 21.0 20.6 2.24
R-temp. 38.5 38.7 38.8 0.48
Table 2. Best performing models for the regression task for sample A, according to AutoGluon.
Model R 2 MAEMedAERMSE
WeightedEnsemble_L2 0.645 0.219 °C 0.092 °C 0.254 °C
NeuralNetTorch 0.624 0.278 °C 0.092 °C 0.262 °C
XGBoost 0.457 0.238 °C 0.158 °C 0.314 °C
CatBoost 0.385 0.227 °C 0.119 °C 0.334 °C
Table 3. Best performing models for the regression task for sample B, according to AutoGluon.
Model R 2 MAEMedAERMSE
WeightedEnsemble_L2 0.728 0.11 °C 0.005 °C 0.218 °C
NeuralNetTorch 0.701 0.13 °C 0.029 °C 0.225 °C
XGBoost 0.697 0.11 °C 0.005 °C 0.230 °C
CatBoost 0.588 0.19 °C 0.112 °C 0.268 °C
Disclaimer/Publisher’s Note: The statements, opinions and data contained in all publications are solely those of the individual author(s) and contributor(s) and not of MDPI and/or the editor(s). MDPI and/or the editor(s) disclaim responsibility for any injury to people or property resulting from any ideas, methods, instructions or products referred to in the content.

