Article

Discrete Element Simple Shear Test Considering Particle Shape

1
School of Civil and Hydraulic Engineering, Ningxia University, Yinchuan 750021, China
2
Solid Mechanics Institute, Ningxia University, Yinchuan 750021, China
*
Author to whom correspondence should be addressed.
Appl. Sci. 2023, 13(20), 11382; https://doi.org/10.3390/app132011382
Submission received: 4 September 2023 / Revised: 9 October 2023 / Accepted: 9 October 2023 / Published: 17 October 2023

Abstract

:
The particle shape has significant effects on the slip and rotation of particles in the shear of geomaterials, which is an important factor in the deformation and strength of geomaterials. This paper employed particle flow code (PFC3D) to simulate the simple shear test, and ellipsoidal particles with different aspect ratios were prepared to study the effects of particle shape on the mechanical behavior and fabric evolution of granular materials under complex stress paths. The numerical results show that the particle shape has a significant effect on the peak strength, dilatancy, non-coaxiality, and other mechanical properties of granular materials. The contact fabric evolves from orthotropy to transverse isotropy under the principal stress axes rotation. This paper will provide a reference for natural granular materials with different shapes in the study of mechanical behavior and the micro-constitutive model.

1. Introduction

The deformation of soil under the action of heap load can be studied with the one-dimensional compression test and conventional triaxial compression test. The direction of stress is fixed during the deformation process. In practical engineering, there is another form of load that can also cause plastic deformation. Different from the previous form of load, its stress direction changes in the process of soil deformation, such as in foundation pit excavation, dam construction, and wave load traffic load. The stress direction inside the soil is rotating, which will lead to noncoaxial plastic deformation [1] and will impact the stress–strain [2]. In laboratory tests, the simple shear test is often employed to investigate the stress–strain characteristics of soil under the condition of principal stress axes rotation. Swedish Geotechnical Institute first invented a simple shear apparatus [3], and many researchers have carried out extensive laboratory tests. Mortezaie [4] investigated the effect of frequency and vertical stress on cyclic degradation in clay via a simple shear test. Oda [5] showed the difference in stress and strain rate directions in a simple shear test with aluminum rod deposits. Xiong’s [6] simple shear test reveals that noncoaxiality causes the dilatancy curve to depart from the Rowe line under the principal stress axes rotation in a simple shear test. In the hollow cylinder torsional shear test, Ishihara [7] came to similar conclusions. The stress–strain can be measured in the laboratory test, but the micro-characteristics of geomaterials cannot be captured, such as the fabric of geomaterials, the contact force of particles, and the anisotropic parameter [8]. The limitations of laboratory tests are also reflected in the microscopic design of granular materials; although some ideal granular materials were used for testing [5], factors such as particle shape and deposition angle cannot be fully considered because of the high cost. This is also unfavorable to the development of the constitutive model. In theory study, the noncoaxiality has integrated into the constitutive model based on the laboratory tests [9,10]. This method seems to belong to image fitting, and several researchers have developed the constitutive model that considers the micro-characteristics of geomaterials [11], but some microscopic parameters cannot be directly obtained from laboratory tests, and are generally derived from previous experience [12].
The discrete element method (DEM) is based on contact mechanics to model individual particles that can capture macro and micro variables and design particle morphology, it is widely used in simulated soil mechanics tests. Zhang [13] investigated granular materials’ strength and microscopic mechanisms subjected to true triaxial stress paths. Li [14] investigated the micromechanical behavior of granular materials under rotating shear stress. Under conditions of principal stress axes rotation, Thornton [15] simulated the formation of the shear band and illustrated the evolution of noncoaxiality via the simple shear test. Lin [16] employed finite element and discrete element methods to simulate the simple shear test and biaxial test of granular materials and validated the constitutive model’s advantage in explaining the behavior of microscale materials. In discrete element simulation, the contact force chain and particle orientation can be captured, and the fabric of contact and particle arrangement can be history [17,18]. Due to the convenience of discrete element software, the effect of loading rate has been investigated from a microscopic perspective [19]. For different materials, the effect of loading rate on the stress–strain of materials is different [20,21,22]. From the perspective of discrete element simulation, the force inside the sample is transferred through contact. After the shear begins, the loading rate will affect the formation of new contact between particles and between particles and the wall, and then affect the macro-stress–strain relationship of granular materials. Therefore, the effect of loading rate should be given attention in the PFC numerical test.
Spherical particles (or disk particles) were employed to generate the sample of the DEM model in the simple shear test. It can reflect some characteristics of geomaterials, such as anisotropy and noncoaxiality [23], but in the contact position between the ball and the boundary, the ball is easy to slip and roll because of its free rotation and low friction, which will lead to unreliable test data [24]. In terms of the particles themselves, the sphericity of spherical particles seems to be inconsistent with the nonsphericity of geomaterials; nonspherical particles have better slip and roll resistance to avoid this phenomenon and are more consistent with the particle shape of geomaterials. Some numerical simulations employed nonspherical particles and the result shows the difference in comparison to spherical particles; the nonspherical particles have higher peak and residual friction angles [25,26]. Therefore, the particle morphology of geomaterials should be considered in the simulation of soil mechanics tests. Some researchers have designed particles with different shapes to carry out simple shear tests, which are usually carried out in a two-dimensional plane, and rarely involve particle morphology in three-dimensional space [27]. Under the condition of the two-dimensional plane, the sample is sheared by rotating a rigid wall, and the sample is sheared by simulating laminar sidewalls in the three-dimensional model, and there are differences in the response of the two shear modes inside the sample [28]. Therefore, it is necessary to consider the microstructure of particles in three-dimensional discrete element simulation of geomaterials.
In this study, a three-dimensional model of the simple shear test will be established and integrate the microscopic morphology of particles to study the effect of particle shape and confining pressure on the macroscopic stress–strain relationship and noncoaxiality. The sample will be prepared with ellipsoidal particles with different aspect ratios and shear under constant vertical pressure. The effect of particle shape on microscopic mechanical properties and fabric evolution under the principal stress rotation will be investigated to provide a reference for developing constitutive models of granular materials and the deformation behavior of subgrade and other engineering facilities.

2. Numerical Simulation

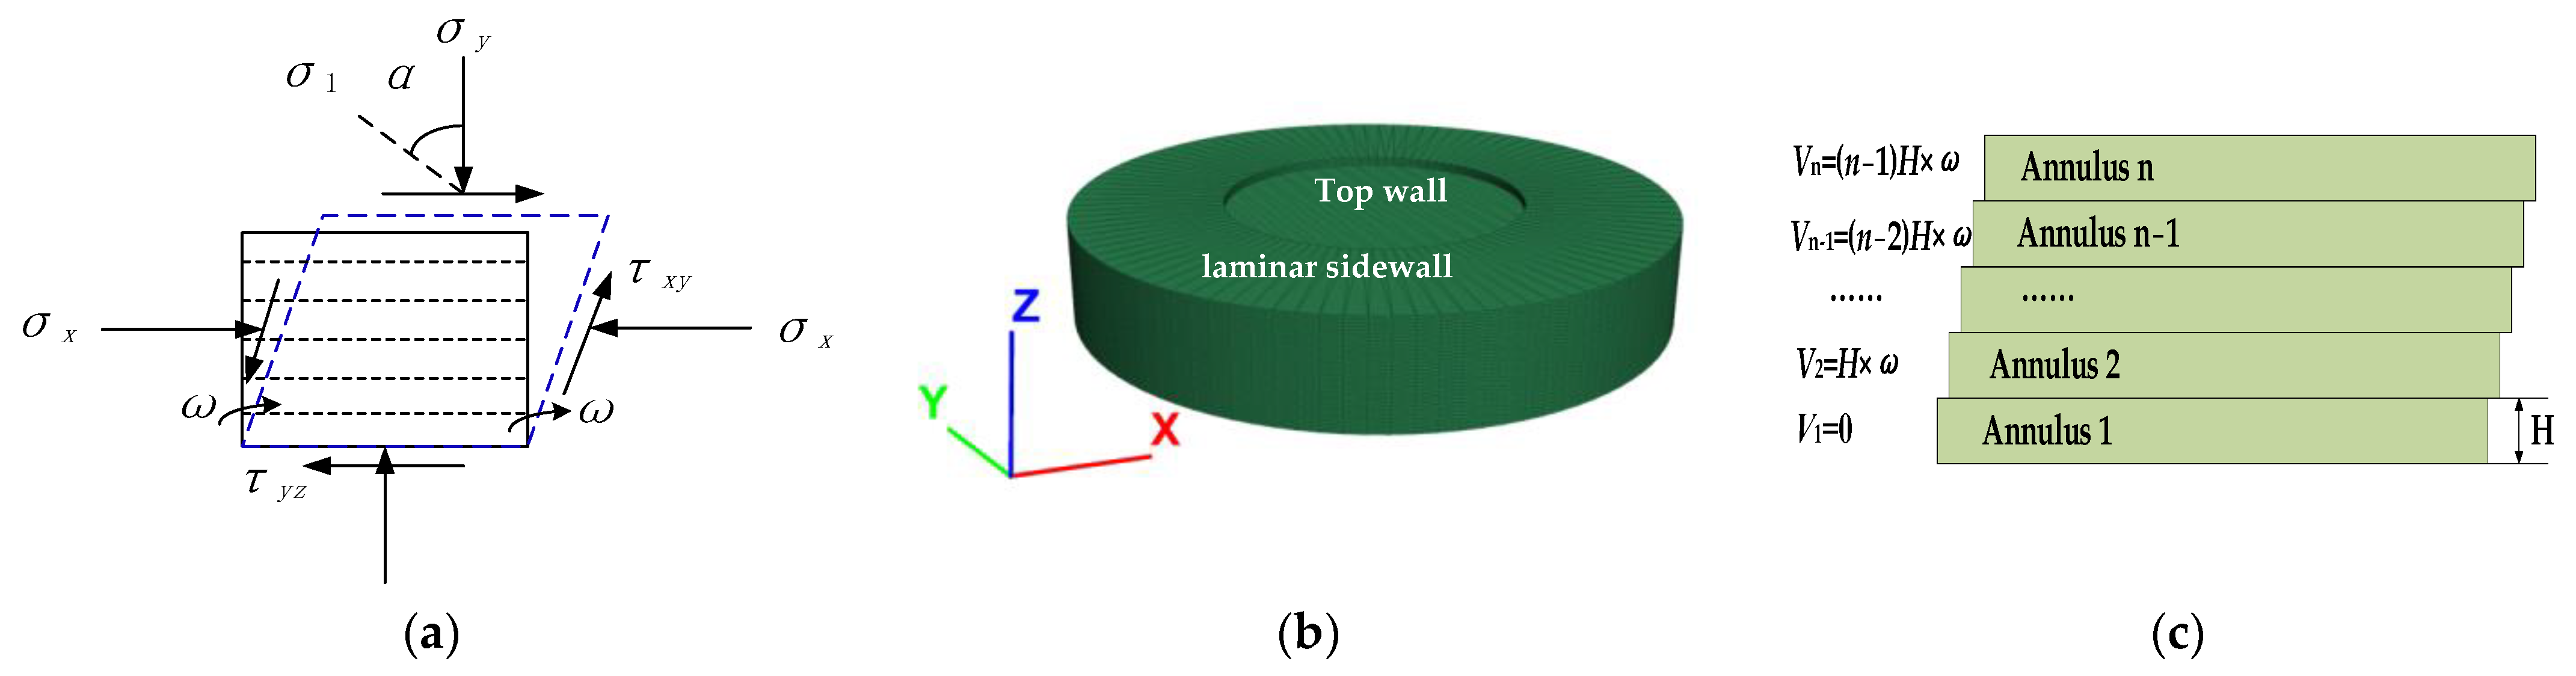
2.1. Simple Shear Test Model

The simple shear test is a traditional soil mechanics test with an unfixed shear surface and uniform deformation. The stress state in the sample during the shear is consistent with the pure shear test. Figure 1a depicts the stress element. The rectangle represents the initial state of the sample and is loaded under isotropic consolidation stress. The vertical boundary is sheared at a fixed angular velocity when the shear rate is set, and the parallelogram is the stress element following the shear. It should be noted that under the condition of small strain, the axial strain should be zero or compressed, because the geomaterials have significant dilatancy, and will expand under the shear stress. In a sample of simple shear tests, the width is constant, and dilatancy is reflected by the relative position of the top and bottom loading plane, so the stressed element in Figure 1a gives a more general diagram. In the PFC program, the elements that build the model include ball, clump, contact wall, etc. Ball and clump are used to simulate particles to prepare samples, contact is used to transfer the force between particles. The wall applies stress to the sample, which can simulate different stress paths. The way of applying stress via the wall is diversified. The target stress value can be directly set, and the stability can be maintained through the servo mechanism. The moving speed of the wall can also be given to simulate the strain loading. In this paper, the applied stress adopts the above two loading schemes. The top wall gives the target stress value and maintains stability through the servo to simulate different vertical pressures in the simple shear test. The shearing is achieved by specifying the moving speed of the laminar sidewall in the x direction, as shown in Figure 1b. The moving speed of the laminar sidewall is shown in Figure 1c, the vertical rigid boundary was modeled by 10 group walls, the speed of Annulus 1 is 0, and the speed of Annulus n is V n = ( n 1 ) H × ω . The vertical pressure is applied by the top wall and bottom wall, and the pressure is constant.

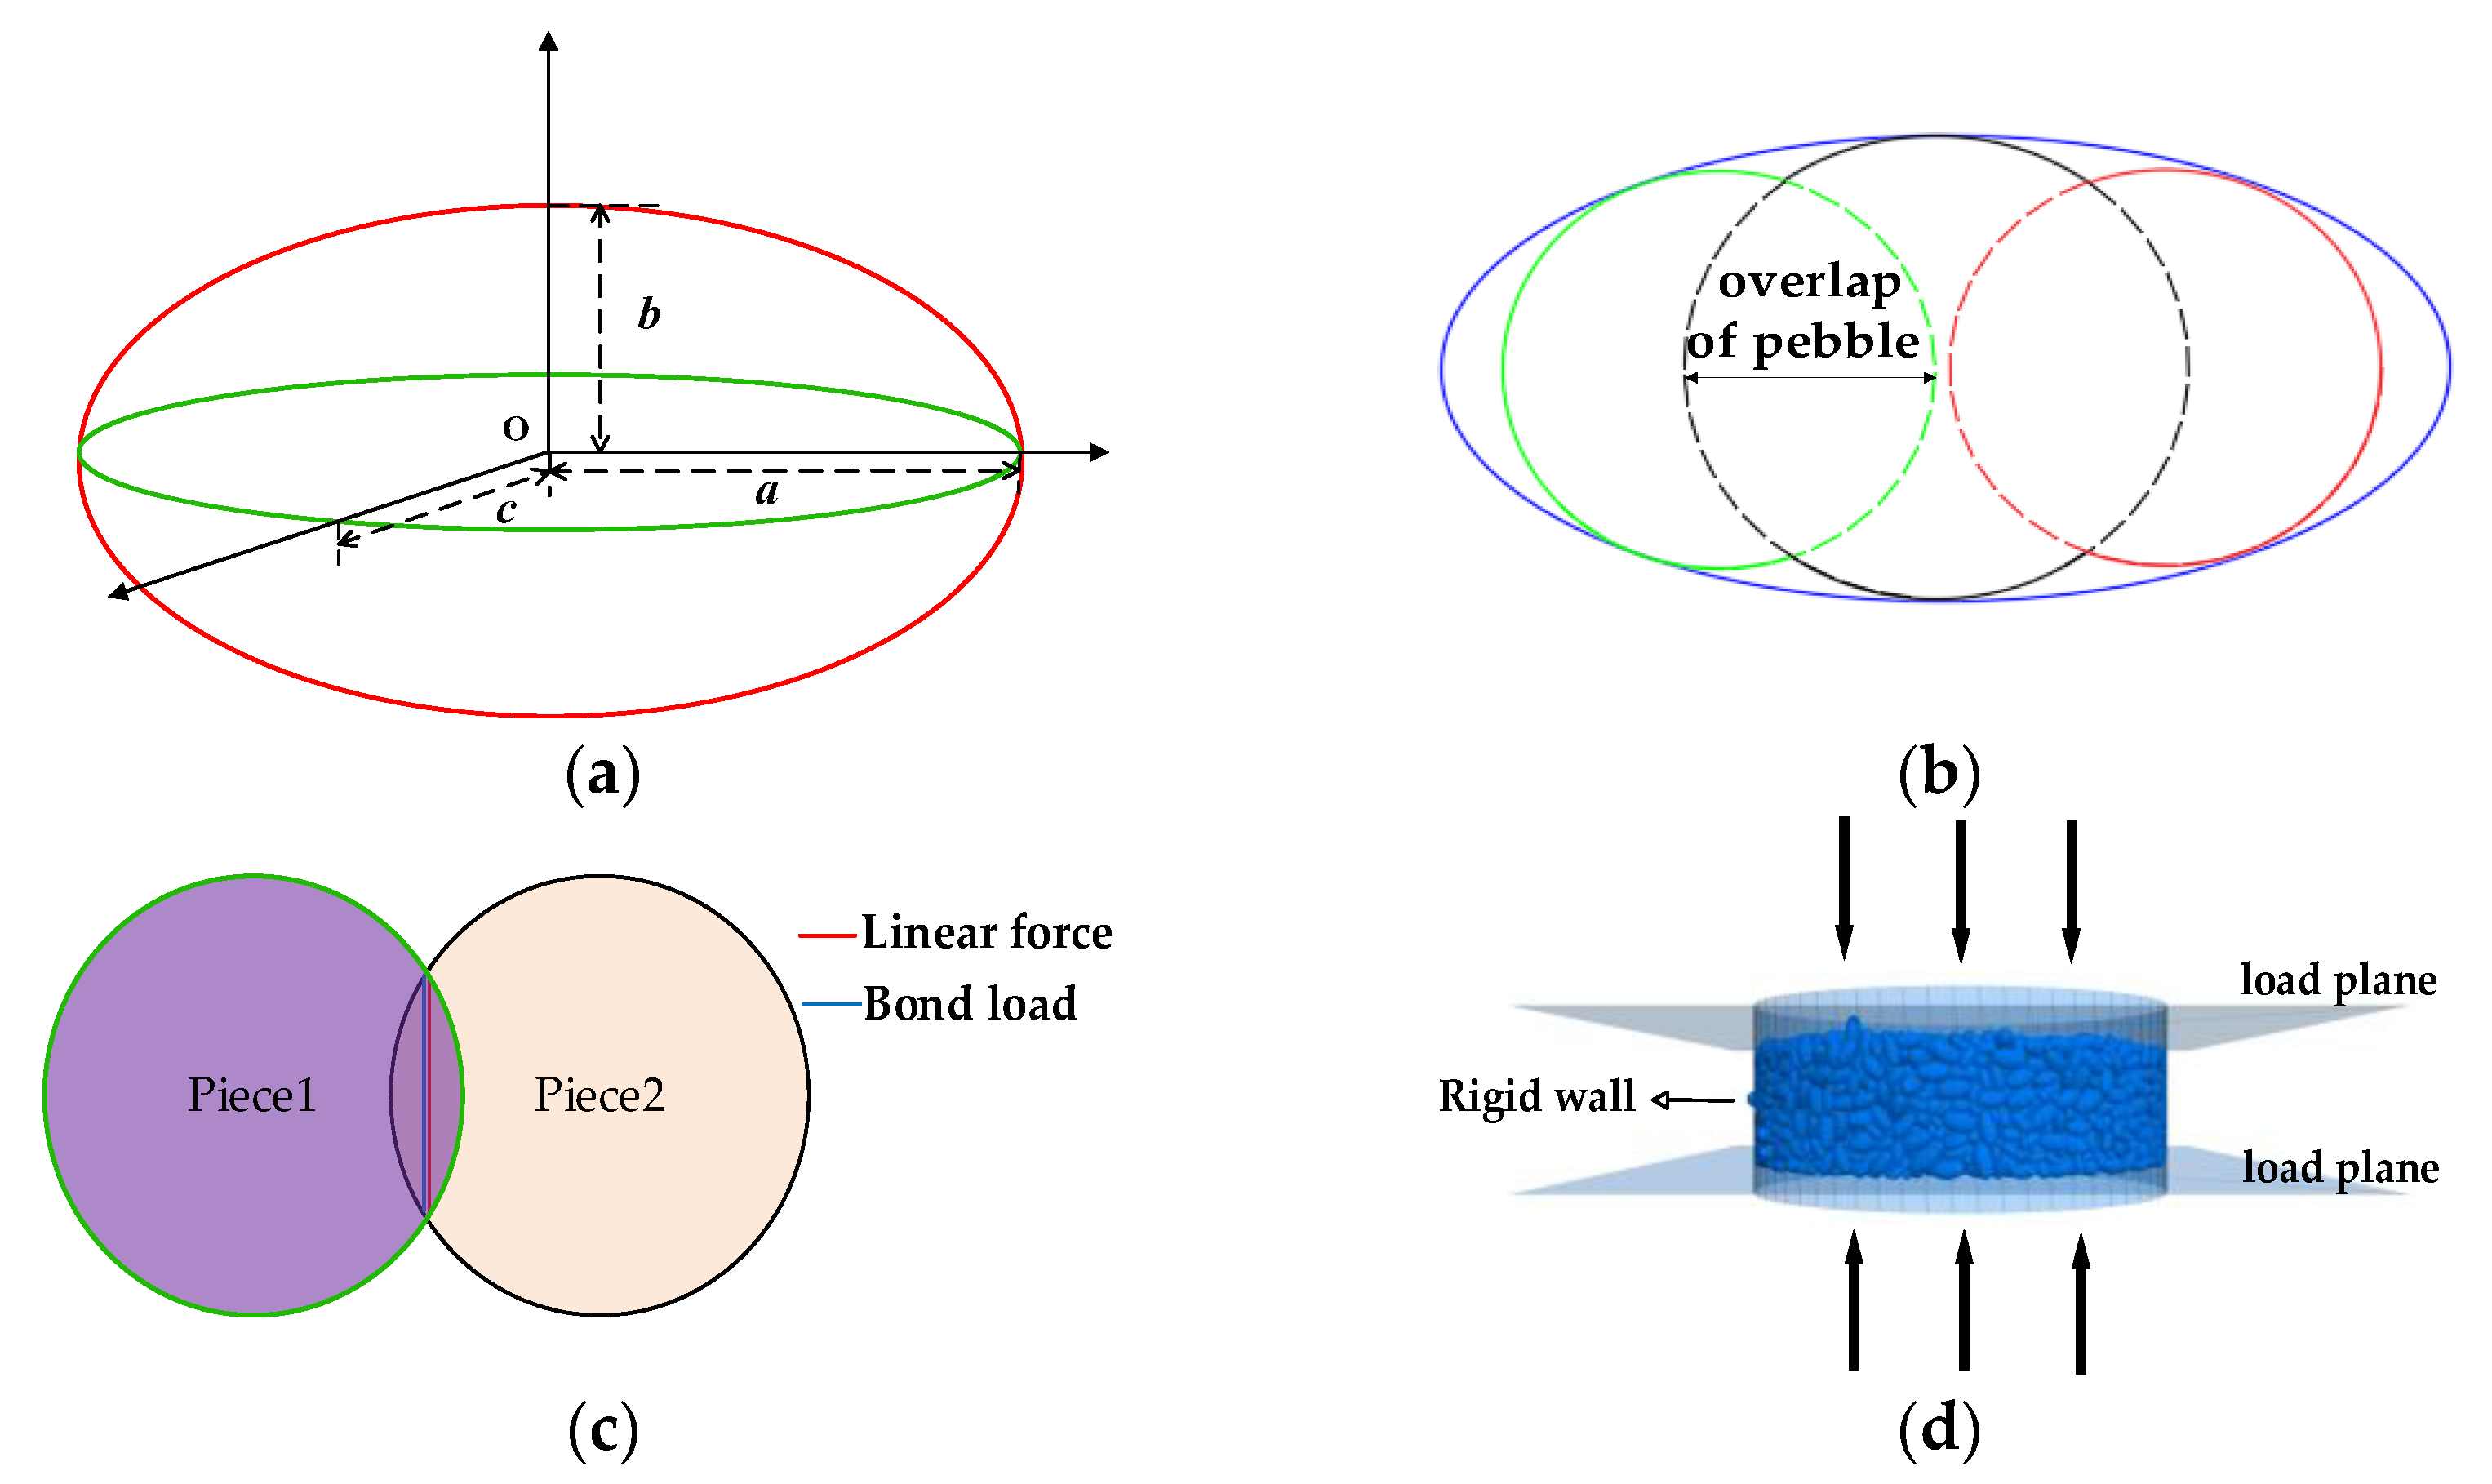
2.2. Sample Preparation and Parameter Setting

PFC3D was employed to generate particles of various shapes with different aspect ratio AR. The smaller AR is closer to the rotation of the sphere, and the effect of the particle shape seems to not be obvious, while the larger AR of the particle will lead to the self-locking of the particle. Therefore, concerning the relatively reliable design, [18] we set the AR = a:b:c to 1.3:1:1, 1.6:1:1, and 1.9:1:1, respectively. The particle size ranges from 1 to 3 mm, and the sample’s height and radius are 17 mm and 30 mm, respectively. Figure 2a,b shows the particle’s geometric shape and internal filling. Ellipsoidal particles pack various sizes of spherical particles. The linearpbond contact model employed between the spherical particles and the microscopic mechanism is shown in Figure 2c. Pieces 1 and 2 in the contact model can bear and transmit shear stress, tension, and torque by parallel contact, which may represent the actual stress in granular material particles. Compared to the linear contact model, the stiffness of the parallel bond model is divided into two parts: the linear normal stiffness K n and tangential stiffness K s , and the bond stiffness K n ¯ and K s ¯ . When the external stress surpasses the given limit, the parallel bond model will degenerate into a linear model. As a result, several researchers utilize the model to simulate particle breakage [29,30,31]. The simulation in this paper concentrates on particle shape’s effect and does not consider particle breakage, there is no relative deformation between the balls inside the particles, and only a linear contact model between the particles is set.
Table 1 shows the related parameter. The linear contact model is used to describe the behavior between particles, which produces a linear force through the normal and tangential stiffness. The linear force is not tension. Therefore, the Coulomb criterion is applied to the shear force through the friction coefficient to meet the slip condition. The damping coefficient is set to make the particle aggregate in a quasi-static equilibrium state. The sample can remain stable after being subjected to force. The corresponding parameter values are set concerning previous studies on coarse-grained soil [23,25]. During sample preparation, the command ‘clump distribution porosity’ is used to generate particle aggregates. The software will automatically calculate the current void ratio according to the pore volume and the total volume of the sample when generating the sample. When the set value is reached, the generation of particles will be stopped. The gravity acceleration was set to 9.8 m/s2, and the particle’s natural deposition process to reach the particles balanced. During sample preparation, the particles naturally deposit horizontally. The long axis of the particles is randomly dispersed in the horizontal direction, and some particles are not horizontal. As a result, constant vertical pressure is supplied to the model to replicate the consolidation of geomaterials under hydrostatic pressure, as shown in Figure 2d. After the sample particles are balanced under the consolidation stress conditions, the rigid wall and lade plane in Figure 2d will be deleted, to generate the laminar sidewall and top wall in Figure 1c at the same position. The sample will be sheared at a specific horizontal speed until the shear strain reaches 25%; to reduce the dynamic influence between model elements [25], the horizontal speed of the laminar sidewall is set according to the method described in Figure 1c, and is converted to the angular speed of the rotation of the vertical wall shown in Figure 1a, which is 2 × 10⁻⁴ rad/s.

2.3. Test Scheme and Variable Monitoring

To investigate the effect of particle shape on the stress–strain relationship, nine groups of simple shear tests with various particle aspect ratios, numbered T01–T09, were modeled. The spherical particles were generated using the number T10 to prepare the samples as the control group, and the cell pressure was set at 200, 400, and 600 kPa. Table 2 shows the scheme’s additional parameters.
To calculate the deformation of the sample through the displacement, the laminar sidewall is modeled by rigid walls and the diameter is constant, the diameter of the sample is also a constant in the shear. The volumetric strain ε v can be written as Equation (1), ε i   ( i = x ,   y ,   z ) is the principal strain in the three-dimensional space, and h 0 is the initial height of the sample. The stress can be obtained directly in PFC3D.
ε v = ε x + ε y + ε z = ε z = d h h 0
The microstructure of the sample is described by contact force and contact fabric. The contact force can be directly measured in PFC3D. The measurement of contact fabric is complicated, which can be quantified by fabric tensor and used to describe anisotropy. As in Oda [32], given the fabric tensor expression as shown in Equation (2), n is the unit vector of the contact normal on the integral interval Ω = 4 π , the physical meaning is shown in Figure 3a. n i and n j are the components of the unit vector n along three axes, E ( n ) is the probability density function of the spatial distribution of unit vector n , and it satisfies Ω E ( n ) d Ω = 1 .
F i j = Ω n i n j E ( n ) d Ω           ( i , j = 1 , 2 , 3 )
On the basis of Equation (2), Li [33] deduced the fabric expression of three-dimensional space (Equation (3)) which is used to describe fabric evolution in this paper, the derivation process is no longer described. Equation (3) describes the expression of orthogonal anisotropy, F1, F2, and F3 represent the fabric components in three orthogonal directions, it represents the difference of geomaterial properties in various directions. When F1 = F2 = F3, it shows that the material is isotropic and exhibits the same stress–strain characteristics when loaded in different directions. When the three components are different, the deformation in various directions is different under the same stress condition. To characterize this difference in theoretical calculation, different strain components are often obtained by combining with the fabric tensor, which reflects the anisotropy of geomaterials. Where a1 and a2 are the anisotropic amplitude parameters on the two orthogonal planes in the Cartesian coordinate system, and the values range from 0 to 1, the value of a i ( i = 1 , 2 , 3 ) can be used to represent the difference of material properties in different directions and can measured through experiment. a is the anisotropic parameter of the transverse-isotropic fabric (Equation (4)), and the value ranges from 0 to 1. The fabric is isotropic when a = 0 and anisotropic when a ≠ 0. The expression of a i ( i = 1 , 2 , 3 ) is shown in Equation (5), N is the number of unit vectors and n in the measurement range. θ 1 ( k ) and α ( k ) are the angles between the k th unit vector n and the x1 and x3 axes, as shown in Figure 3b. In the shear process of discrete element samples, the unit vector of normal contact between particles is obtained at each timestep. The evolution of particle contact fabric can be investigated with Equations (3) and (5), which simplifies the complex process of fabric calculation and makes the physical meaning clearer.
F ij = F 1 0 0 0 F 2 0 0 0 F 3 = 1 + a 1 + a 2 + a 1 a 2 3 + a 1 + a 2 a 1 a 2 0 0 0 1 + a 1 a 2 a 1 a 2 3 + a 1 + a 2 a 1 a 2 0 0 0 1 a 1 + a 2 a 1 a 2 3 + a 1 + a 2 a 1 a 2
F i j = 1 3 a 1 + a 0 0 0 1 a 0 0 0 1 a
a 1 = 1 2 N k = 1 2 N cos 2 θ 1 ( k ) sin 2 θ 1 ( k ) cos 2 α ( k ) 2 + k = 1 2 N sin 2 θ 1 ( k ) cos α ( k ) 2 1 2 a 2 = 1 2 N k = 1 2 N cos 2 θ 1 ( k ) sin 2 θ 1 ( k ) sin 2 α ( k ) 2 + k = 1 2 N sin 2 θ 1 ( k ) sin α ( k ) 2 1 2 a 3 = 1 2 N k = 1 2 N sin 2 θ 1 ( k ) cos 2 α ( k ) 2 + k = 1 2 N sin 2 θ 1 ( k ) sin 2 α ( k ) 2 1 2

3. Results and Analysis

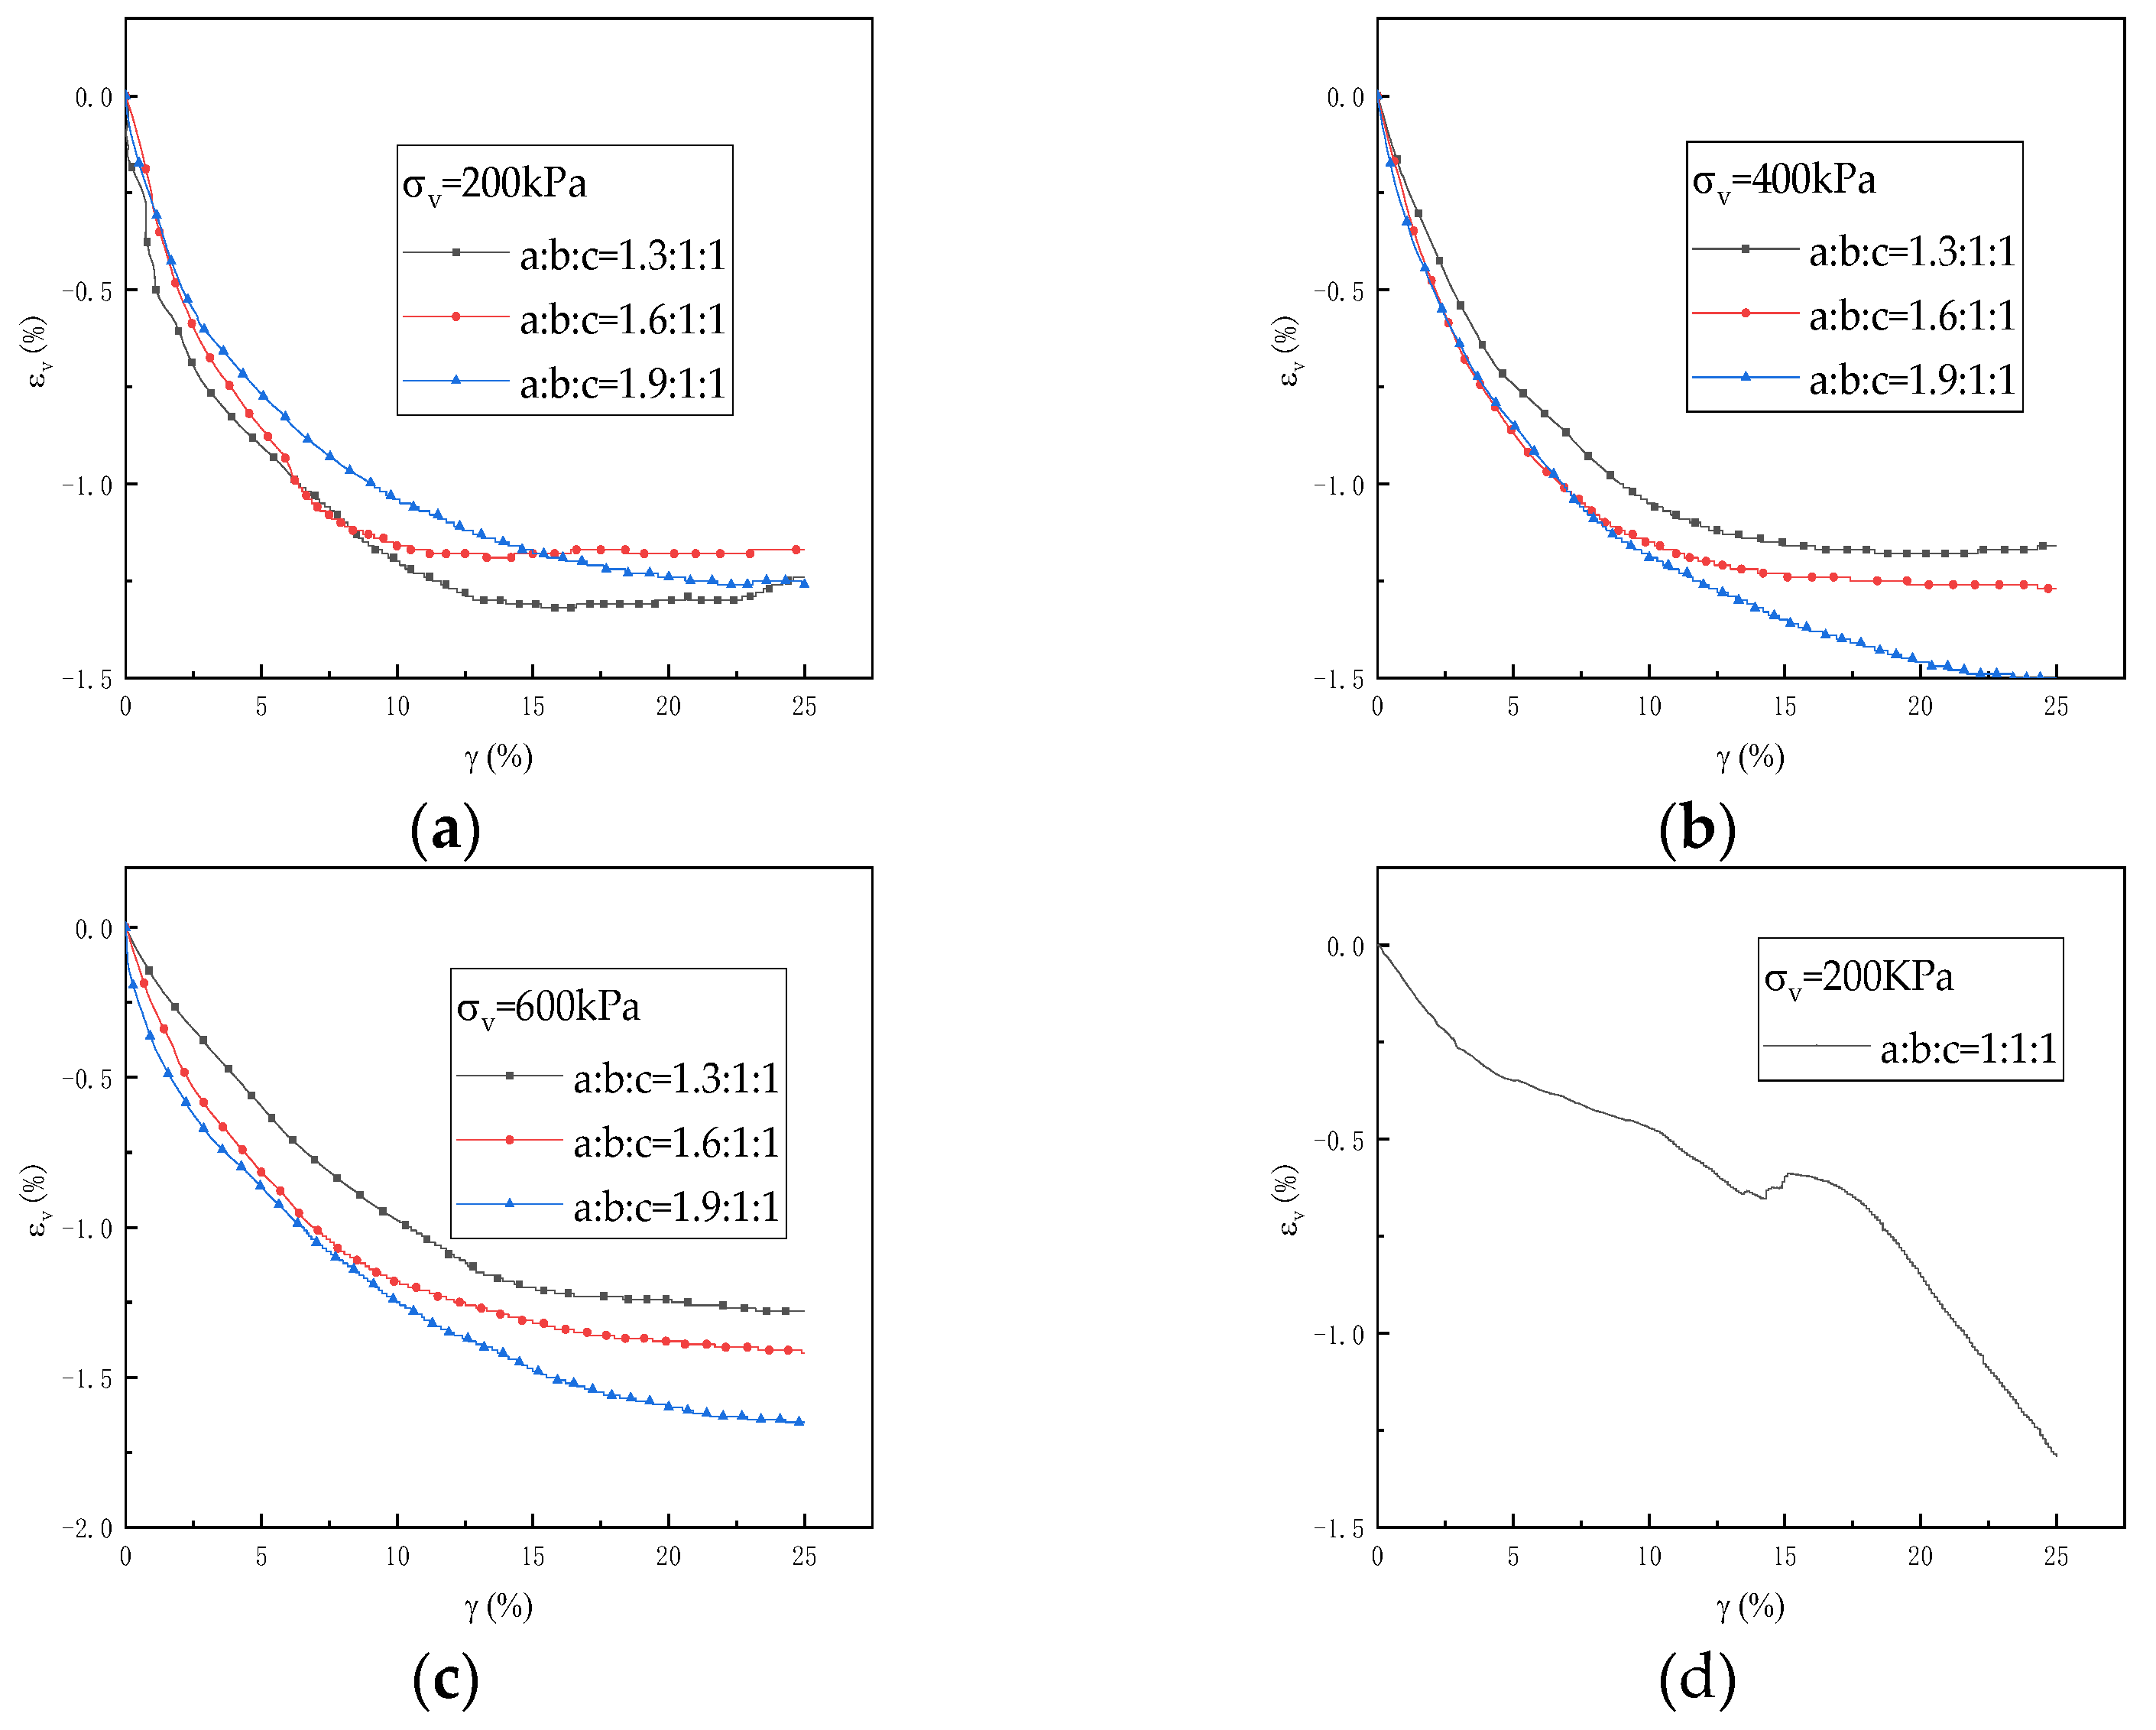
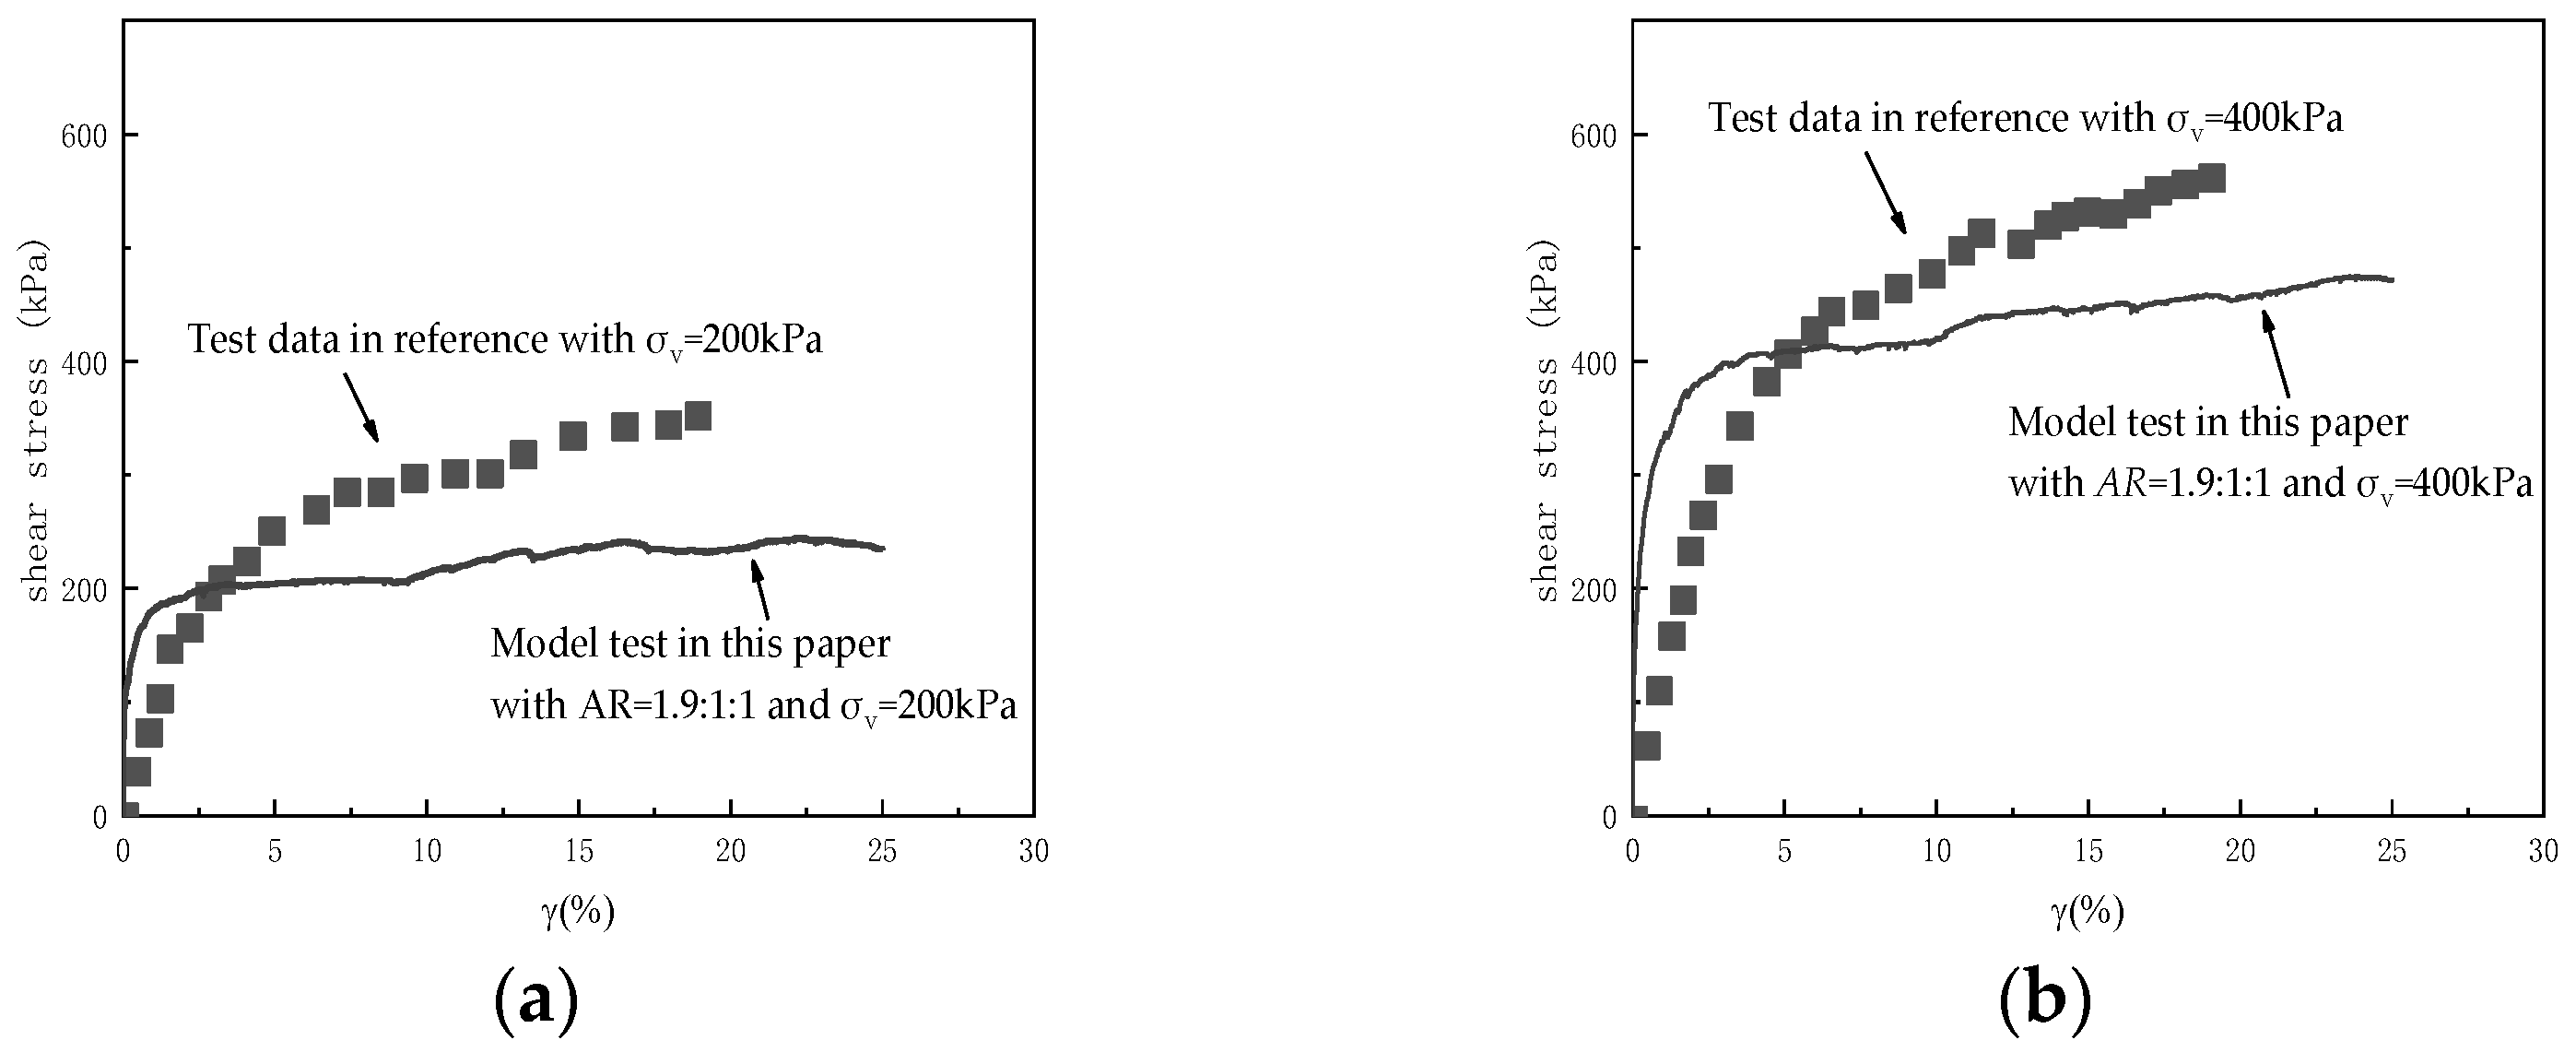
3.1. Stress–Strain Relationship

Figure 4a–d shows the σxy-γ curves with different vertical stress and particle shapes that indicate strain hardening, in the legend, a, b, and c represent the axial lengths of the three orthogonal directions of the particles, as shown in Figure 2a. Figure 5 shows volumetric compression, which is similar to the result observed in Li’s [34] simple shear tests on loose and medium-density sand. Peak stress and shear modulus increase as the particle aspect ratio increases, which has a noticeable effect on stress–strain. The shear stress σxy and shear modulus are maximal when AR = 1:1:1.9. The effect of particle shape on shear modulus becomes increasingly apparent as confining pressure increases, and the disparity in shear modulus of samples is higher. Under low pressure, particle shape has little effect on the volumetric strain. As confining pressure increases, the effect of particle shape is more prominent, and the volumetric contraction becomes increasingly apparent as the particle aspect ratio AR increases.
Figure 6 shows the result of the comparison with the test of coarse-grained soil in reference [34]. Because the test materials and loading stress have certain differences, we choose the same vertical pressure of test data for qualitative comparison to verify the rationality of the model in this paper. It can be seen that the coarse-grained soil exhibits strain-hardening characteristics, which is consistent with the model test results in this paper. Through qualitative analysis, it can be seen that there are also some differences. For example, the slightly larger shear modulus of the stress-strain curve in this paper may be caused by the difference in mesoscopic parameters, but it can be seen that the law of the stress-strain curve is similar on the whole.

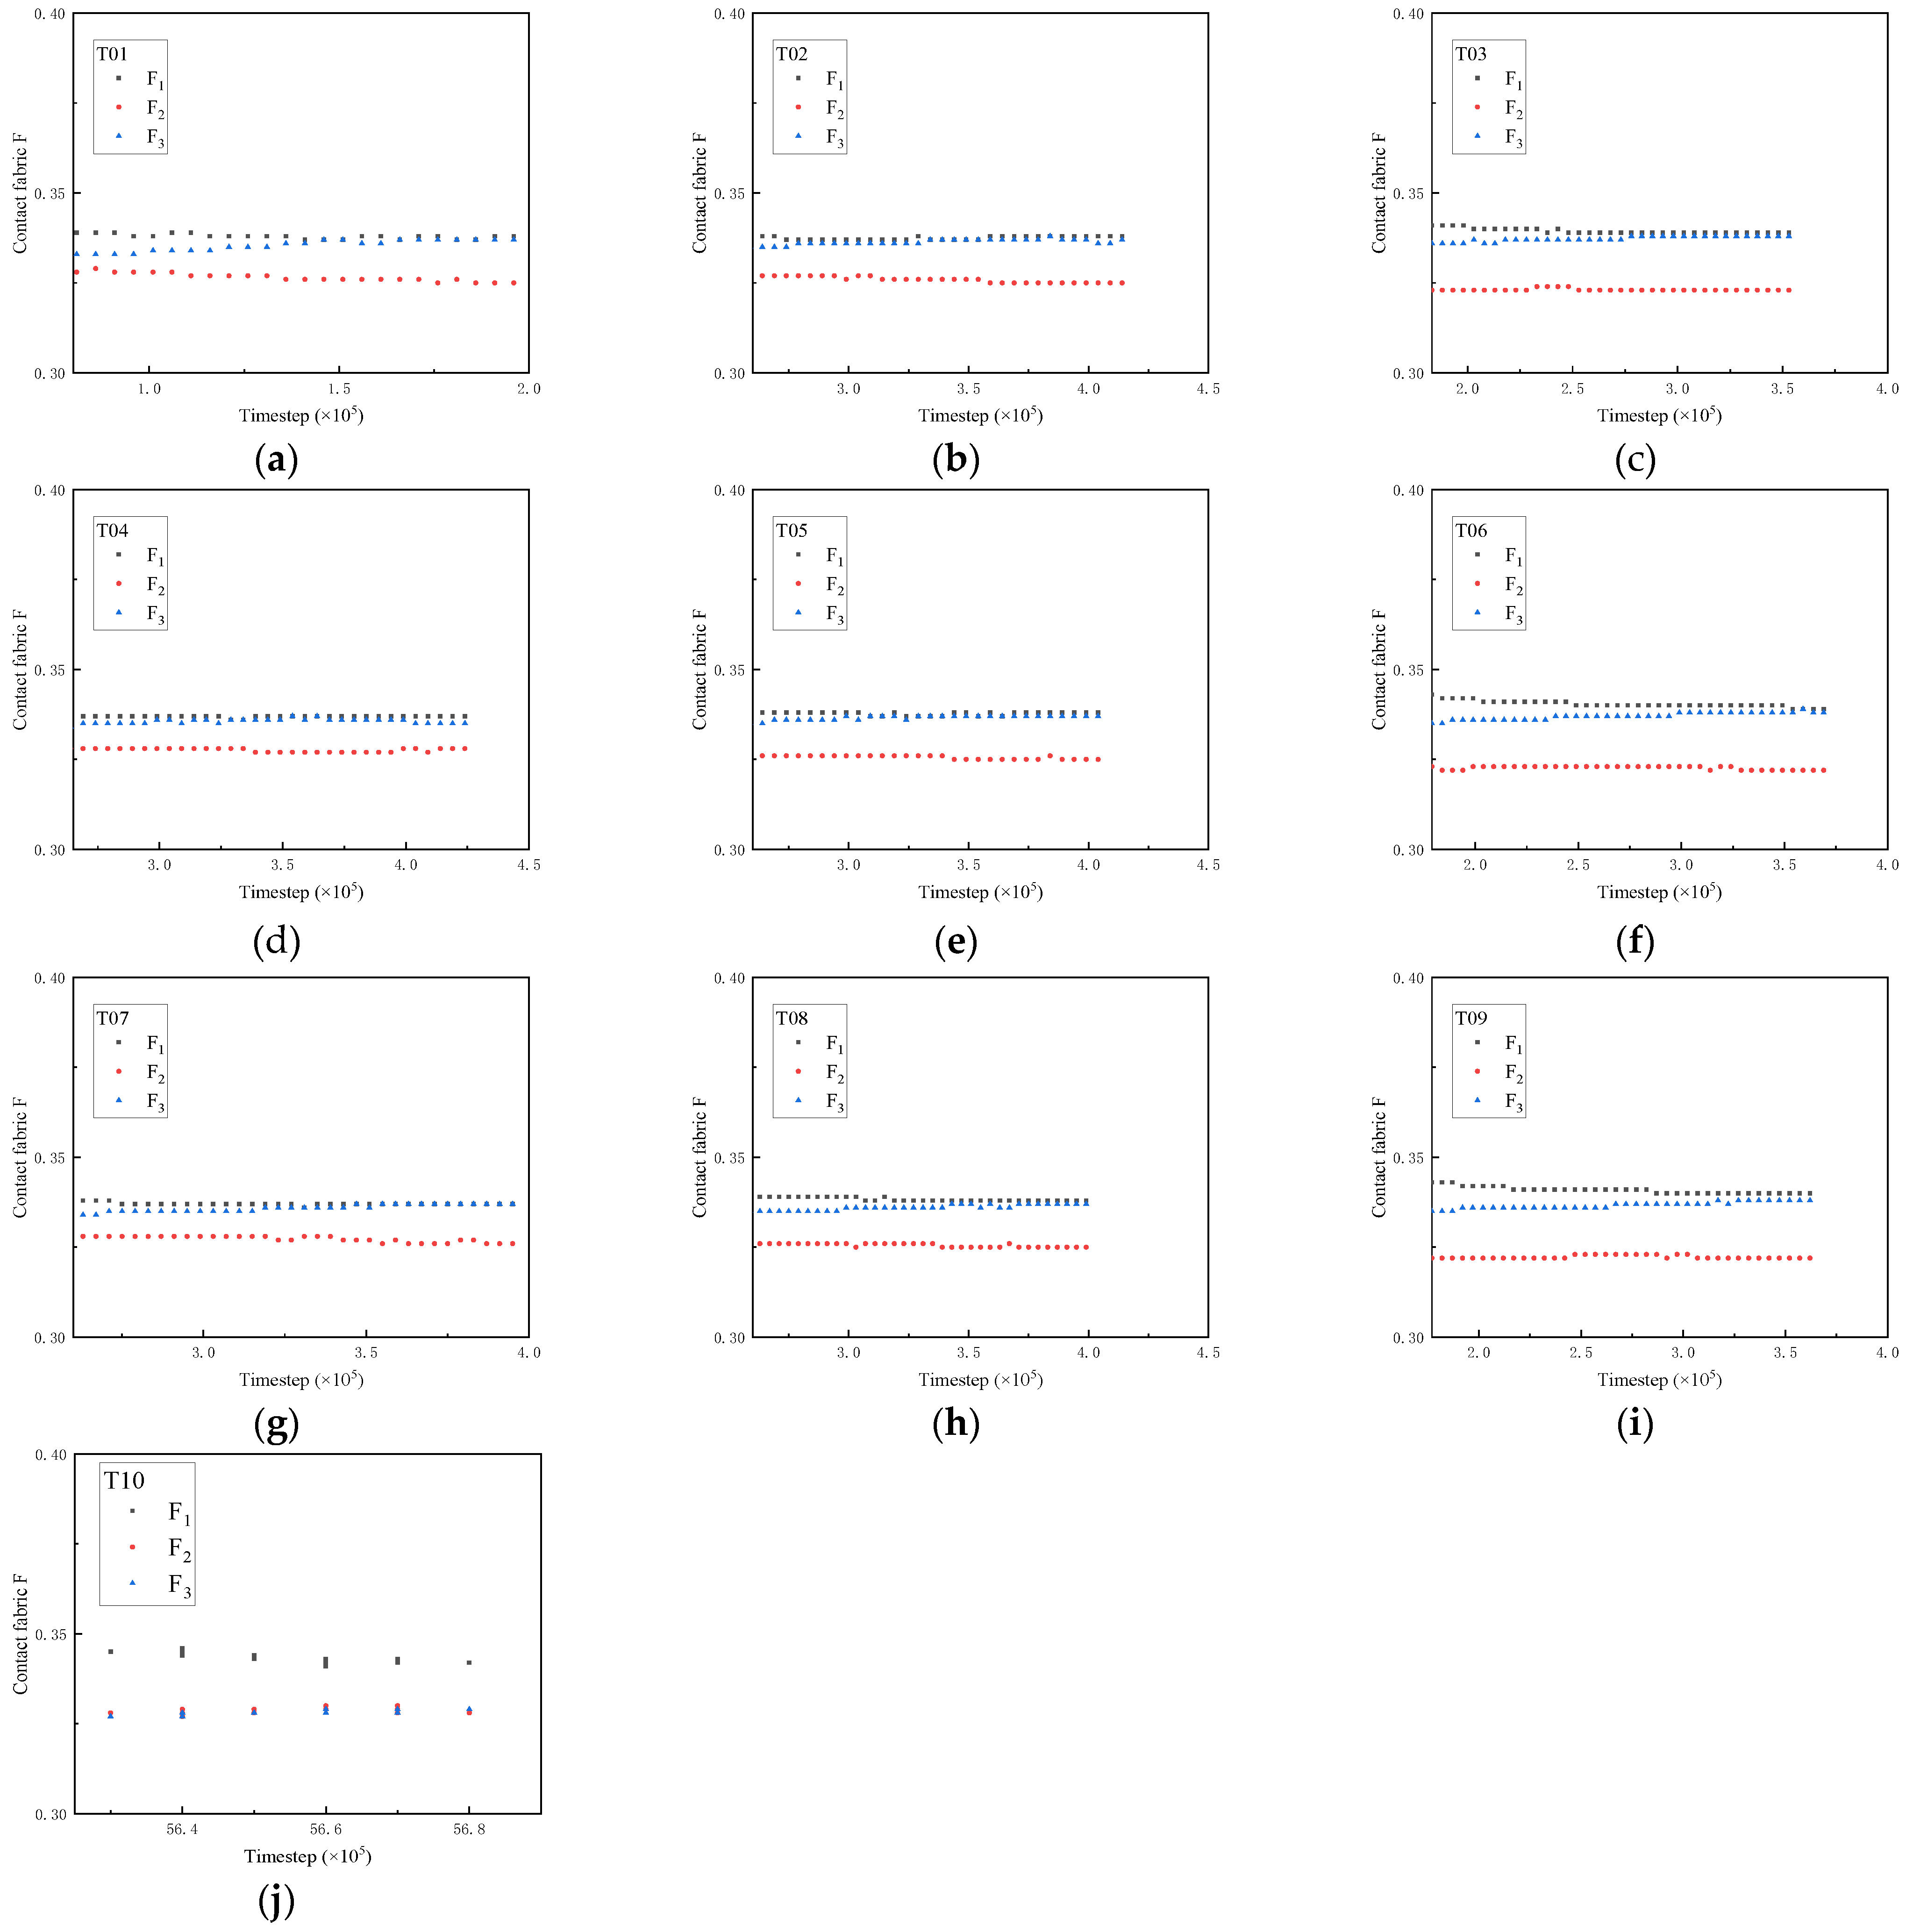
3.2. Micro Mechanical Properties
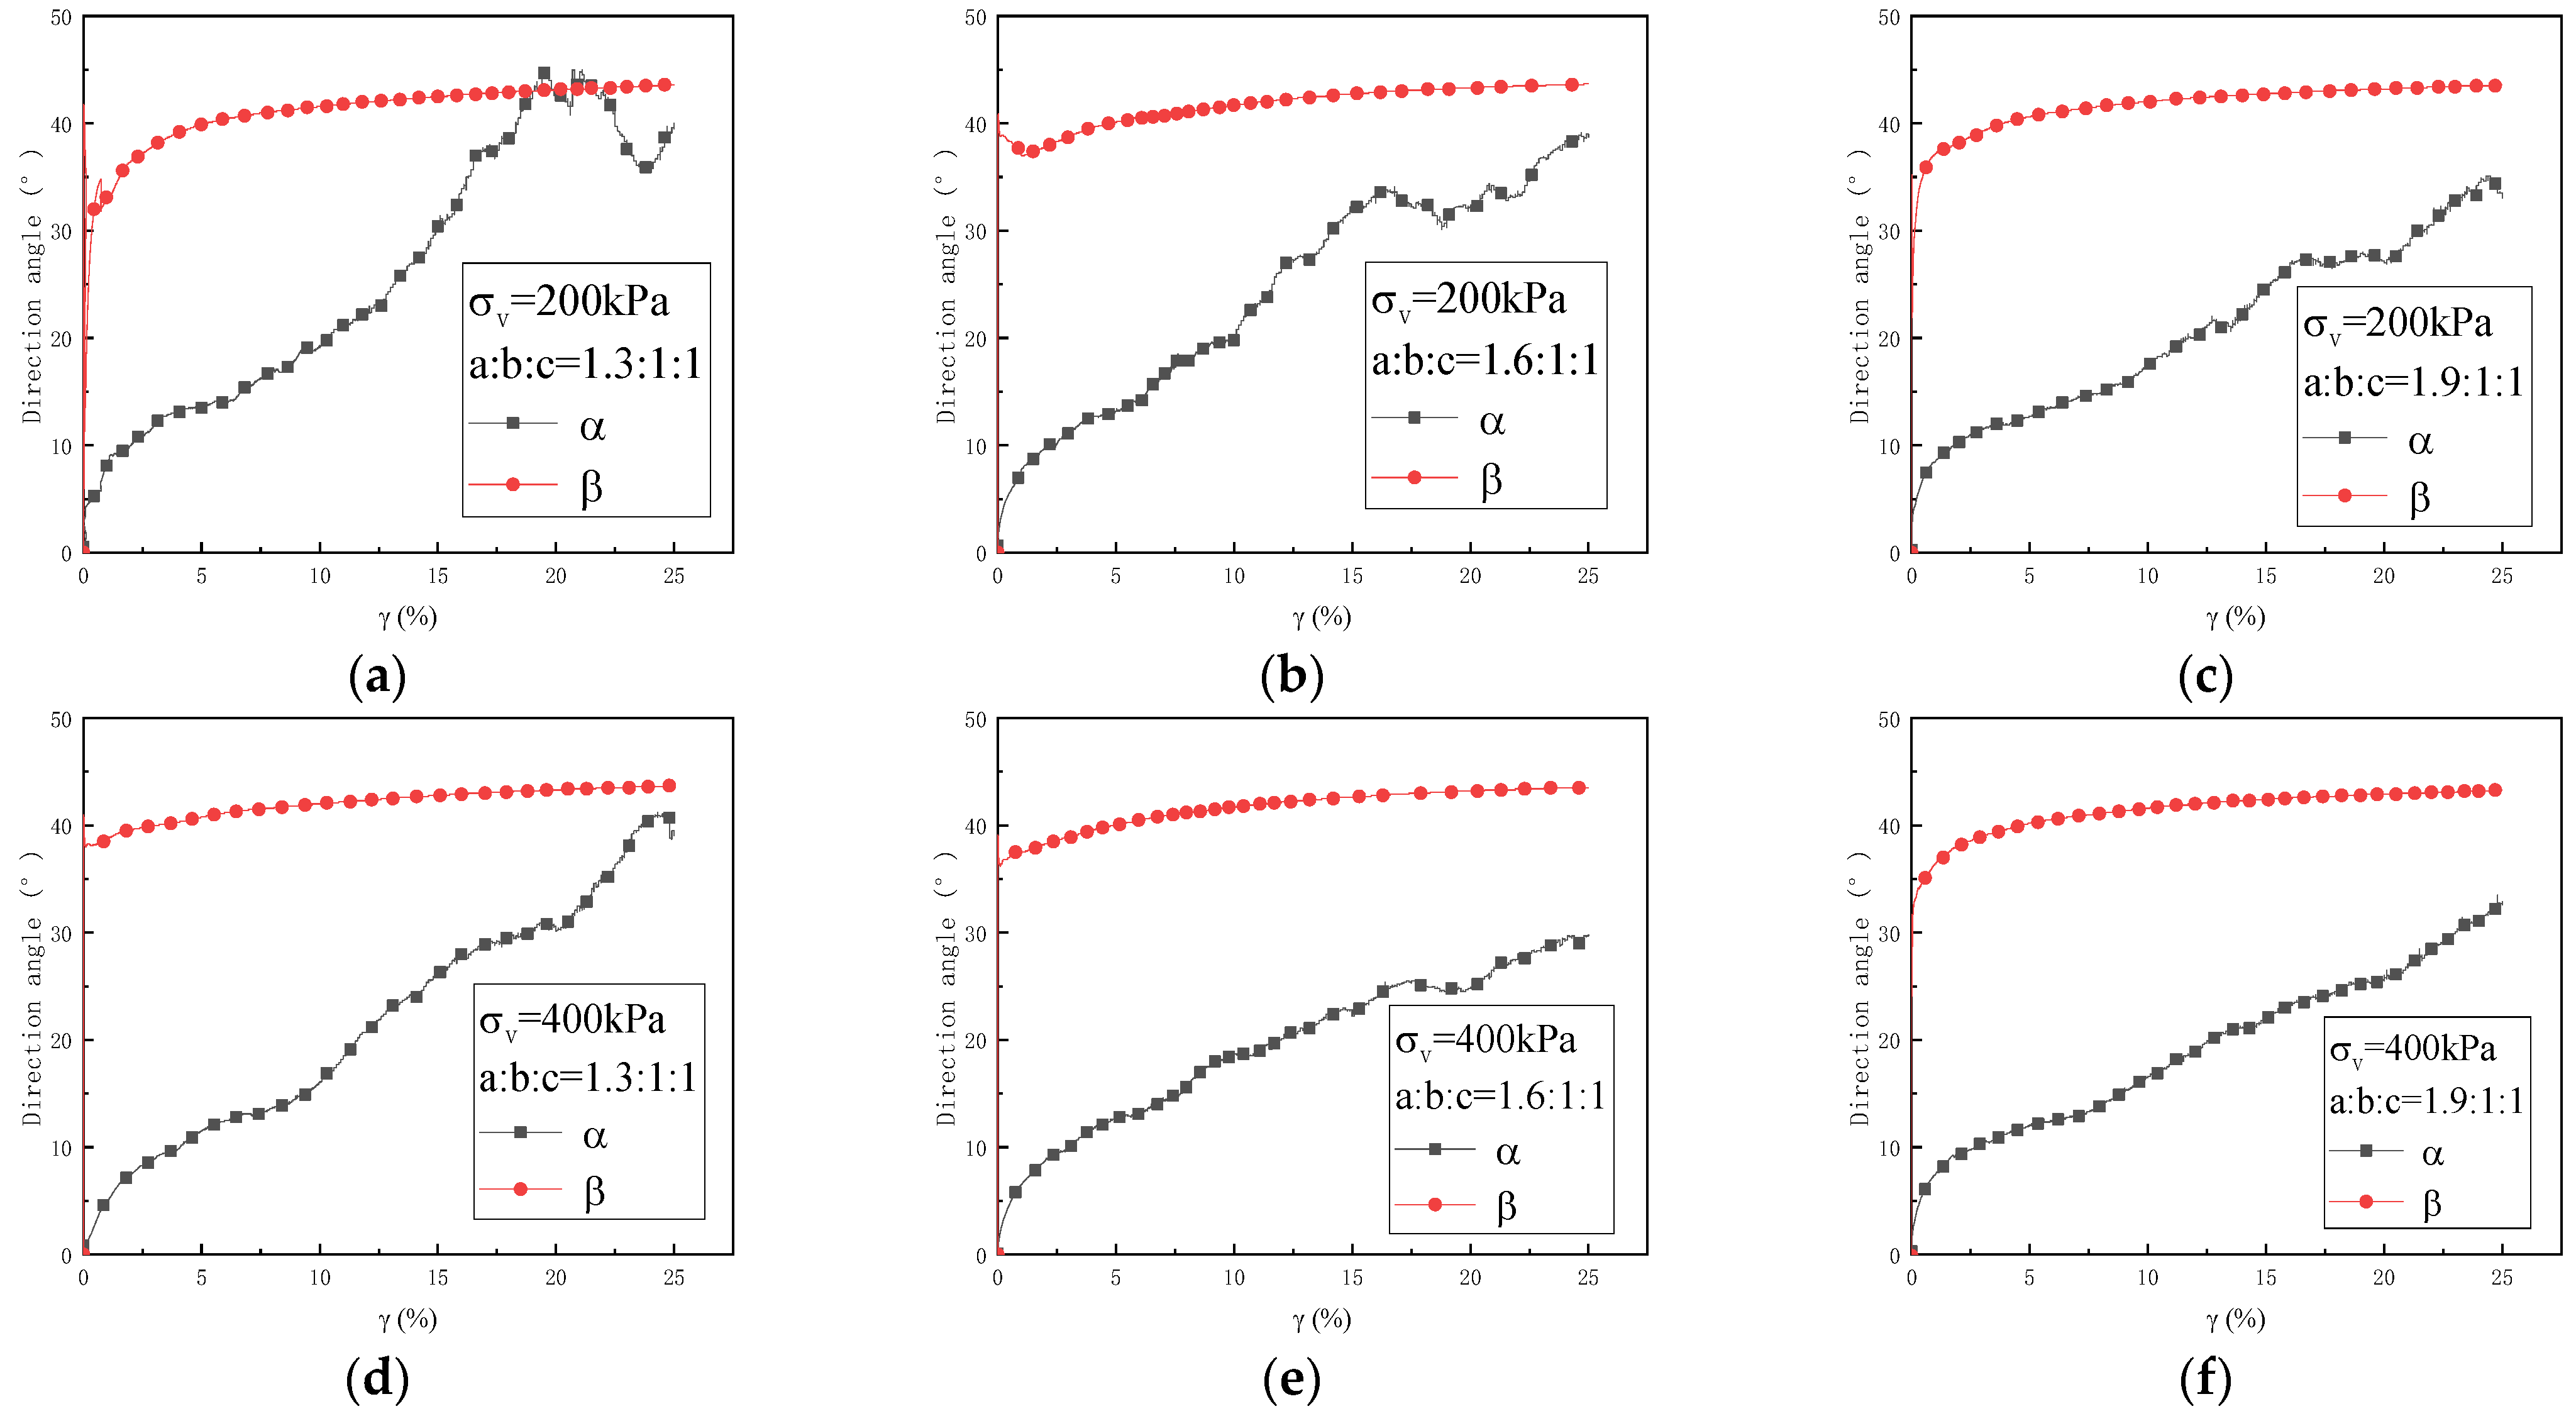
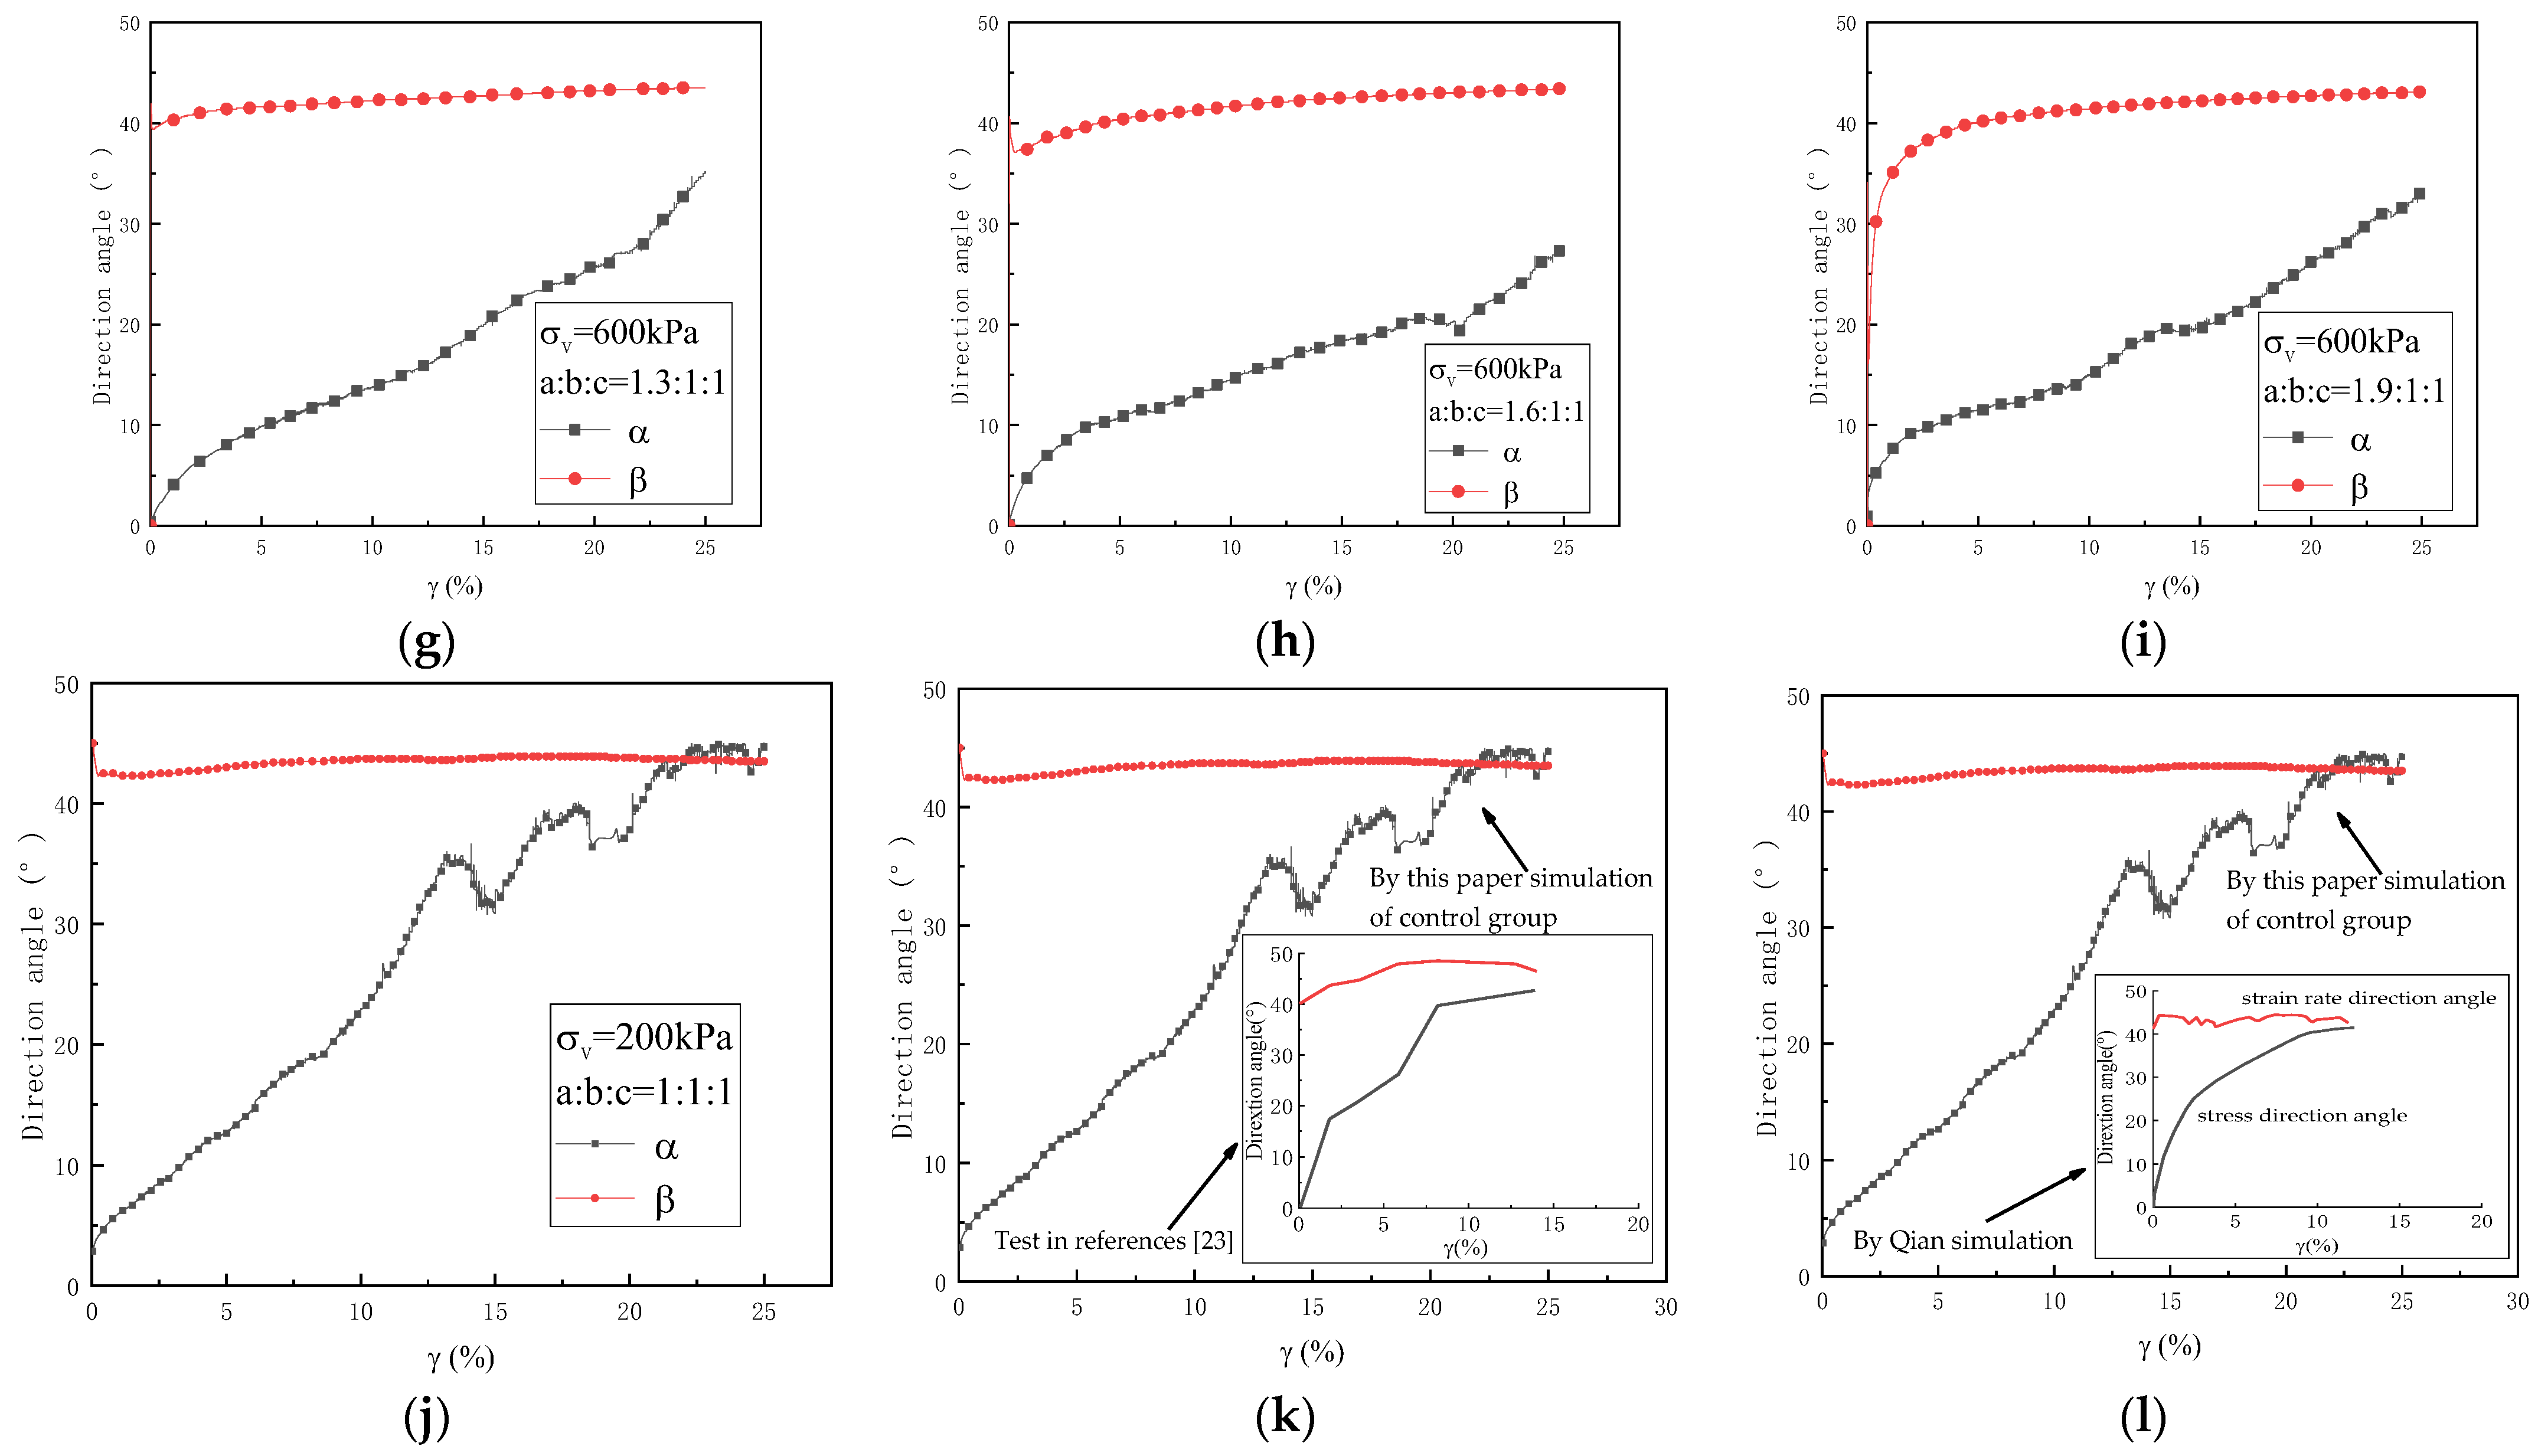
Because stress between particles is transmitted via contact, it is reasonable to investigate micromechanical behaviors via contact. Figure 7 illustrates the rose diagram of the contact number and normal contact force in the X-Z plane when the shear strain reaches 25%. Figure 7a–c show the contact number distribution, revealing that the direction with the highest amount of contacts deviates from 90°, indicating that the stress between the particles is rotated. The distribution of normal contact force in Figure 7d shows that the particle fabric is anisotropic under stress rotation. The normal contact force is higher along the principal stress vector than in the other directions, and the contact force distribution appears ellipsoidal. The anisotropy of the test group with ellipsoidal particles is apparent compared to spherical particles. Because spherical particles rotate more easily than ellipsoidal particles and have uniform contact points, the contact force distribution of spherical particles (T10) in the X-Z plane is more consistent and closer to the isotropy.
Figure 8 illustrates the evolution of the fabric tensor Fij as confining pressures and aspect ratios alter. When combined with Figure 8, it is clear that ellipsoidal particles are orthotropic initially. F1 and F3 increasingly coincide as the principal stress rotates, suggesting that the particles are rearranged after being subjected to force and are close to isotropy on the action surface with major principal stress. Compared to the T01–T03 (or T04–T06, T07–T09) test group, inherent anisotropy is more apparent as the aspect ratio increases, and the evolution of fabric is slightly slower. When the aspect ratio AR is constant, the evolution of the fabric is delayed with increasing vertical pressure, as illustrated in Figure 8a,d,g, a similar evolution pattern can be seen in Figure 8b,e,h.
Compared to ellipsoidal particles, spherical particles are transverse-isotropic (Equation (4)). The difference between F1 and F2 (F3) reduces when the principal stress rotates, similarly with ellipsoidal particles. The stress–strain relationship is noncoaxial due to fabric anisotropy [35]. However, the anisotropy of the fabric after evolution is no longer noticeable in the later stages of loading, and the influence on the macroscopic mechanical characteristics is no longer significant [36]. The stress and strain rate directions are coaxial in the high stress ratio area.

3.3. Noncoaxiality

Figure 9 illustrates the stress direction angle (Equation (6)) and strain rate direction angle (Equation (7)) during the shear process at various aspect ratios and vertical pressures, Figure 9k,l are the comparison with experiments and numerical simulations in reference [23]. The stress rotation angle is dispersed in the 27–45° range. The rotation of the principal stress is most noticeable in spherical particles; as the aspect ratio increases, the reaction of the rotation angle of the principal stress grows slower. Similarly, as the aspect ratio increases, the response of the strain rate direction slows. The reaction of the strain rate and stress directions is the most delayed when the aspect ratio AR = 1:1:1.9. The evolution of stress direction follows a slower rule as vertical stress increases. Figure 9 also illustrates that the noncoaxial angle (Equation (8)) increases as the particles’ nonspherical properties become more prominent, similar to the behavior reported in reference [37]. At the same time, the vertical pressure is higher, the noncoaxial phenomena are more noticeable, and the stress direction delay is apparent. By comparing with the previous research, it can be seen that the variation law of the stress direction angle and the strain rate direction angle in this paper is similar to the previous research. The stress direction angle gradually approaches the strain rate direction angle, indicating that the discrete element model in this paper is used to study the noncoaxiality is reliable in the simple shear test.
α = 1 2 arctan 2 σ x y σ y σ x
β = 1 2 arctan 2 d ε x y p d ε y p d ε x p
Δ = α β

4. Conclusions

This paper employed the PFC3D to model a three-dimensional simple shear test and integrated particle morphologies. In the loading, the principal stress axes are rotated, the aim is to investigate the influence of particle morphologies on the stress–strain relationship, noncoaxiality response, and fabric evolution. The following is a summary of the key outcomes of the simulation:
(1) The particle shape significantly affects the stress–strain relationship under the complex stress path of principal stress rotation. The nonspherical feature of particle shape is more prominent, the peak stress is higher, and the volume contraction is significant under high confining pressure. The shear modulus shows a similar rule, which is larger with the nonspherical feature more prominent;
(2) The particle shape significantly affects the contact force between particles and the evolution of contact fabric at the microscopic level. Larger aspect ratio particles rotate more slowly than minor aspect ratio particles, which causes the evolution of fabric to be slower, and the stress rotation angle is relatively small at the same shear strain;
(3) The noncoaxiality is apparently affected by particle shape, which is more noticeable with the aspect ratio increase. The reaction of the stress direction is delayed with a larger aspect ratio, and the direction of strain rate is delayed at the shear start as the aspect ratio increases.

Author Contributions

Conceptualization, X.L. and H.Z.; methodology, H.Z.; software, X.L. and H.Z.; validation, Q.Y.; formal analysis, H.Z. and Q.Y.; investigation, H.Z. and L.L.; resources, Q.Y.; data curation, Q.Y.; writing—original draft preparation, H.Z. and Q.Y.; writing—review and editing, X.L. and L.L.; visualization, H.Z. and Q.Y.; supervision, X.L.; project administration, X.L.; funding acquisition, X.L. All authors have read and agreed to the published version of the manuscript.

Funding

This research was funded by the Projects for Leading Talents of Science and Technology Innovation of Ningxia (No. KJT2019001), the National Natural Science Foundation of China (No. 12162028), and the innovation team for multi-scale mechanics and its engineering applications of Ningxia Hui Autonomous Region (2021), and these supports are gratefully acknowledged.

Institutional Review Board Statement

Not applicable.

Informed Consent Statement

Not applicable.

Data Availability Statement

The data used to support the findings of this study are available from the corresponding author upon request.

Conflicts of Interest

The authors declare no conflict of interest.

References

  1. Pradel, D.; Ishihara, K.; Gutierrez, M. Yielding and flow of sand under principal stress axes rotation. Soils Found. 1990, 30, 87–99. [Google Scholar] [CrossRef]
  2. Hu, P.; Teng, Y.; Ma, S.K.; Liu, Y.; Zhang, X.W.; Chen, Y.L. Non-proportional loading deformation characteristics of silty fine sand under principal stress rotation. J. Shandong Univ. (Eng. Sci.) 2022, 52, 89–95. [Google Scholar]
  3. Kjellman, W. Testing the shear strength of clay in Sweden. Geotechnique 1951, 2, 225–232. [Google Scholar] [CrossRef]
  4. Mortezaie, A.R.; Vucetic, M. Effect of frequency and vertical stress on cyclic degradation and pore water pressure in clay in the NGI simple shear device. J. Geotech. Geoenviron. Eng. 2013, 139, 1727–1737. [Google Scholar] [CrossRef]
  5. Oda, M.; Konishi, J. Microscopic deformation mechanism of granular material in simple shear. Soils Found. 1974, 14, 25–38. [Google Scholar] [CrossRef] [PubMed]
  6. Xiong, H.; Guo, L.; Cai, Y.Q. Effect of non-coaxiality on dilatancy of sand involving principal stress axes rotation. Rock Soil Mech. 2017, 38, 133–140. [Google Scholar]
  7. Ishihara, K.; Towhata, I. Sand response to cyclic rotation of principal stress direction as induced by wave loads. Soils Found. 1983, 23, 11–16. [Google Scholar] [CrossRef]
  8. Zhao, J.; Gao, Z. Unified anisotropic elastoplastic model for sand. J. Eng. Mech. 2015, 142, 4015056. [Google Scholar] [CrossRef]
  9. Gutierrez, M.; Ishihara, K. Non-coaxiality and energy dissipation in granular materials. Soils Found. 2000, 40, 49–59. [Google Scholar] [CrossRef]
  10. Lashkari, A.; Latifi, M. A non-coaxial constitutive model for sand deformation under rotation of principal stress axes. Int. J. Numer. Anal. Methods Geomech. 2008, 32, 1051–1086. [Google Scholar] [CrossRef]
  11. Li, X.F.; Yuan, Q.; Wang, X. A critical state anisotropic model with state-dependent of sand. J. Civ. Archit. Environ. Eng. 2015, 37, 70–78. [Google Scholar]
  12. Li, X.F.; Huang, M.S.; Qian, J.G. Failure criterion of anisotropic sand with method of macro-meso incorporation. Chin. J. Rock Mech. Eng. 2010, 29, 1885–1892. [Google Scholar]
  13. Zhang, D.; Liu, Y.; Wu, S.C. Simulation of strength characteristics of granular materials in true triaxial test for different stress paths and its mesoscopic mechanism analysis. Rock Soil Mech. 2016, 37, 509–520. [Google Scholar]
  14. Li, K.F.; Li, X.F. On non-coaxiality and fabric evolution of granular media in circular shear simulated by DEM. Granul. Matter 2023, 25, 48. [Google Scholar] [CrossRef]
  15. Thornton, C.; Zhang, L. A numerical examination of shear banding and simple shear non-coaxial flow rules. Philos. Mag. 2006, 86, 3425–3452. [Google Scholar] [CrossRef]
  16. Lin, J.; Wu, W. A comparative study between DEM and micropolar hypoplasticity. Powder Technol. 2016, 293, 121–129. [Google Scholar] [CrossRef]
  17. Jiang, M.J.; Liu, J.D.; Arroyo, M. Numerical evaluation of three non-coaxial kinematic models using the distinct element method for elliptical granular materials. Int. J. Numer. Anal. Methods Geomech. 2016, 40, 2468–2488. [Google Scholar] [CrossRef]
  18. Jiang, M.J.; Li, T.; Shen, Z.F. Fabric rates of elliptical particle assembly in monotonic and cyclic simple shear tests: A numerical study. Granul. Matter 2016, 18, 54. [Google Scholar] [CrossRef]
  19. Ruan, X.; Chen, S.; Li, S. Structural evolution and breakage of dense agglomerates in shear flow and Taylor-Green vortex. Chem. Eng. Sci. 2019, 211, 115261. [Google Scholar] [CrossRef]
  20. Maqsood, Z.; Koseki, J.; Ahsan, M.K.; Shaikh, M.; Kyokawa, H. Experimental study on hardening characteristics and loading rate dependent mechanical behaviour of gypsum mixed sand. Constr. Build. Mater. 2020, 262, 119992. [Google Scholar] [CrossRef]
  21. Maqsood, Z.; Koseki, J.; Miyashita, Y.; Xie, J.; Kyokawa, H. Experimental study on the mechanical behaviour of bounded geomaterials under creep and cyclic loading considering effects of instantaneous strain rates. Eng. Geol. 2020, 276, 105774. [Google Scholar] [CrossRef]
  22. Xu, X.; Wei, H.Z.; Meng, Q.S.; Wei, C.F.; Ai, D.H. Effects of shear rate on shear strength and deformation characteristics of coarse-grained soils in large-scale direct shear tests. Chin. J. Geotech. Eng. 2013, 35, 728–733. [Google Scholar]
  23. Qian, J.G.; Huang, Z.P.; Huang, M.S. Anisotropic characteristics of granular materials under simple shear. J. Cent. South Univ. 2013, 20, 2275–2284. [Google Scholar] [CrossRef]
  24. Zabihi, N.; Athanasopoulos-Zekkos, A. Discrete Element Modelling of Large Scale Stacked-Ring Simple Shear Test of Steel Spheres. In Proceedings of the Geo-Congress, Minneapolis, MN, USA, 25–28 February 2020; American Society of Civil Engineers: Reston, VA, USA, 2020. [Google Scholar] [CrossRef]
  25. Shi, D.D.; Xue, J.F.; Zhao, Z.Y.; Shi, J.Y. A DEM investigation on simple shear behavior of dense granular assemblies. J. Cent. South Univ. 2015, 22, 4844–4855. [Google Scholar] [CrossRef]
  26. Cheng, Z.; Hou, M.; Wang, J.F. Discrete element modeling of the mechanical behaviour of cemented carbonate sand consider the effects of particle shape and breakage. Chin. J. Comput. Mech. 2022, 39, 315–323. [Google Scholar]
  27. Asadzadeh, M.; Soroush, A. Fundamental investigation of constant stress simple shear test using dem. Powder Technol. 2016, 292, 129–139. [Google Scholar] [CrossRef]
  28. Shen, C.K.; O’Sullivan, R.; Jardine, R.J. A micromechanical investigation of drained simple shear tests. In Proceedings of the International Symposium on Deformation Characteristics of Geomaterials, Seoul, Republic of Korea, 1–3 September 2011; pp. 314–321. [Google Scholar]
  29. Zhou, L.L.; Chu, X.H.; Xu, Y.J. Breakage behavior of sand under true triaxial stress based on discrete element method. Chin. J. Geotech. Eng. 2017, 39, 839–847. [Google Scholar]
  30. McDowell, G.R.; Harireche, O. Discrete element modelling of soil particle fracture. Geotechnique 2002, 52, 131–135. [Google Scholar] [CrossRef]
  31. Wang, J.F.; Yan, H.B. DEM analysis of energy dissipation in crushable soil. Soils Found. 2012, 52, 644–657. [Google Scholar] [CrossRef]
  32. Oda, M. Initial fabrics and their relations to mechanical properties of granular materials. Soils Found. 1972, 12, 17–36. [Google Scholar] [CrossRef]
  33. Li, X.F.; Wang, Q.; Liu, J.F.; Wu, W.; Meng, F.C. Quantitative Description of Microscopic Fbric Based on Sand Particle Shapes. China J. Highw. Transp. 2016, 29, 29–53. [Google Scholar]
  34. Li, Y.; Yang, Y.M.; Yu, H.S.; Roberts, G.; Li, A. Principal stress rotation under bidirectional simple shear loadings. KSCE J. Civ. Eng. 2018, 22, 1651–1660. [Google Scholar] [CrossRef]
  35. Huang, M.S.; Sun, H.Z.; Qian, J.G. Non-coaxial behavior of coarse granular aggregates simulated by DEM. J. Hydraul. Eng. 2010, 2, 173–181. [Google Scholar] [CrossRef]
  36. Yamada, Y.; Ishihara, K. Anisotropic Deformation Characteristics of Sand Under Three Dimensional Stress Conditions-Science Direct. Soils Found. 1979, 19, 79–94. [Google Scholar] [CrossRef] [PubMed]
  37. Yang, Y.; Fei, W.; Yu, H.-S.; Ooi, J.; Rotter, M. Experimental study of anisotropy and non-coaxiality of granular solids. Granular Matter. 2015, 17, 189–196. [Google Scholar] [CrossRef]
Figure 1. Stress element of simple shear test and model of DEM: (a) lode of simple shear test, (b) the boundary of sample, and (c) model of DEM.
Applsci 13 11382 g001
Figure 2. Particle shape and internal filling: (a) ellipsoid particles, (b) particle filled, (c) microscopic contact of spherical particles, and (d) sample preparation of simple shear test.
Applsci 13 11382 g002
Figure 3. Contact normal unit vector diagram: (a) normal contact unit vector and (b) the angle between unit vector and coordinate axis.
Applsci 13 11382 g003
Figure 4. Shear stress and shear strain of different particle shapes: (a) σv = 200 kPa, (b) σv = 400 kPa, (c) σv = 600 kPa, and (d) σv = 200 kPa, AR = 1:1:1.
Applsci 13 11382 g004aApplsci 13 11382 g004b
Figure 5. Volumetric strain of different particle shapes: (a) σv = 200 kPa, (b) σv = 400 kPa, (c) σv = 600 kPa, and (d) σv = 200 kPa, AR = 1:1:1.
Applsci 13 11382 g005
Figure 6. Stress–strain relationship comparison with reference [34]: (a) σv = 200 kPa and (b) σv = 400 kPa.
Applsci 13 11382 g006
Figure 7. Distribution of contact fabric: (a) normal contact number of vertical pressure 200 kPa, (b) normal contact number of vertical pressure 400 kPa, (c) normal contact number of vertical pressure 600 kPa, and (d) normal contact force.
Applsci 13 11382 g007
Figure 8. The distribution of contact fabric: (a) contact fabric of T01, (b) contact fabric of T02, (c) contact fabric of T03, (d) contact fabric of T04, (e) contact fabric of T05, (f) contact fabric of T06, (g) contact fabric of T07, (h) contact fabric of T08, (i) contact fabric of T09, and (j) contact fabric of T10.
Applsci 13 11382 g008
Figure 9. The rule of stress direction and strain rate direction angle: (a) direction angle of T01, (b) direction angle of T02, (c) direction angle of T03, (d) direction angle of T04, (e) direction angle of T05, (f) direction angle of T06, (g) direction angle of T07, (h) direction angle of T08, (i) direction angle of T09, (j) direction angle of T10, (k) comparison with test data in references [23], and (l) comparison with simulation data in references [23].
Applsci 13 11382 g009aApplsci 13 11382 g009b
Table 1. Model mesoscopic parameters.
ParametersValues
Clump_normal stiffness/(kPa)1 × 107
Clump_tangential stiffness/(kPa)1 × 107
Porosity/(%)0.45
Density/(Kg/m3)2.7 × 103
Elastic modulus/(kPa)1 × 107
Coefficient of friction0.5
Damp/(Pa∙s)0.7
Table 2. Scheme of simple shear test.
Test NumberARCell Pressure (kPa)Clump Number
T011.3:1:120016,536
T021.6:1:120022,088
T031.9:1:120027,310
T041.3:1:140016,536
T051.6:1:140022,088
T061.9:1:140027,310
T071.3:1:160016,536
T081.6:1:160022,088
T091.9:1:160027,310
T101:1:12001011
Disclaimer/Publisher’s Note: The statements, opinions and data contained in all publications are solely those of the individual author(s) and contributor(s) and not of MDPI and/or the editor(s). MDPI and/or the editor(s) disclaim responsibility for any injury to people or property resulting from any ideas, methods, instructions or products referred to in the content.

