Article

Aerodynamic Analysis of the Opening Hood Structures at Exits of High-Speed Railway Tunnels

1
Key Laboratory of Transportation Tunnel Engineering, Ministry of Education, Southwest Jiaotong University, Chengdu 610031, China
2
School of Civil Engineering, Southwest Jiaotong University, Chengdu 610031, China
*
Author to whom correspondence should be addressed.
Appl. Sci. 2023, 13(20), 11365; https://doi.org/10.3390/app132011365
Submission received: 14 September 2023 / Revised: 11 October 2023 / Accepted: 15 October 2023 / Published: 16 October 2023
(This article belongs to the Special Issue Advances in Aerodynamics of Railway Train/Tunnel System)

Abstract

:

Featured Application

Currently, most studies on hood structures have concentrated on the aerodynamic impact of hood structures installed at tunnel entrances, with limited attention given to a systematic exploration of the mitigation mechanisms for exit hood structures. The findings of this paper related to the exit hood structure hold significant guiding implications for the design and optimization of hoods, providing novel design perspectives for both tunnel entrance and exit hood structures.

Abstract

As train operating speeds increase, the aerodynamic characteristics of the train within the tunnel become more pronounced, and effectively addressing the issue of micro-pressure wave (MPW) over-limits becomes especially crucial. This paper utilized the control volume method to investigate the key influencing parameters of tunnel exit hoods on the mitigation effectiveness of MPWs. Additionally, numerical simulation methods were used to validate these crucial parameters. The analysis considered various opening ratios, different opening forms, and the influence of hoods at tunnel entrances and exits on the amplitude and spatial distribution patterns of MPWs. A design methodology that comprehensively takes into account the advantages of tunnel entrance and exit hoods was proposed. The results showed that a higher opening ratio of tunnel exit hoods led to lower MPW amplitudes. Compared to without opening in the hood, when the opening ratio of the exit hood reached 90%, the maximum amplitude of MPWs at a distance of 20 m from the hood outlet decreased by 48.7%. Various opening forms of exit hoods resulted in distinct spatial distribution patterns of MPW amplitudes, with amplitudes near the openings notably higher than in other areas. There were differences in the mitigation mechanisms between entrance and exit hoods. In comparison to entrance hoods, exit hoods exhibited higher mitigation efficiency within a specific range of MPW amplitudes. Additionally, when both entrance and exit hoods were installed, they achieved the most effective mitigation of MPWs.

1. Introduction

High-speed railway transportation offers distinct advantages in terms of energy conservation and carbon emission reduction. Against the backdrop of increasingly severe environmental and energy challenges, many countries are actively promoting the development of high-speed railways. With the continuous increase in train operating speeds, the issue of train-tunnel aerodynamic effects becomes more prominent, especially the problem of exceeding the micro-pressure wave limit. Based on field-measured data, Gawthorpe [1] indicated that the pressure amplitude of MPWs at tunnel exits is directly proportional to the cube of the train’s entry speed into the tunnel. Furthermore, as the train speed increases, the amplitude of MPWs will also experience a significant rise. MPWs not only pose a severe threat to the internal structure of the tunnel but also affect the lives of the surrounding residents [2]. Additionally, the pressure fluctuations generated by high-speed flowing air also impact the stability of trains during operation [3,4]. Therefore, addressing the issue of MPWs holds significant importance for ensuring the safety and efficient operation of high-speed railways.
Previous studies have indicated that installing hoods at the tunnel entrance area to decrease the pressure gradient of the compression waves can effectively control the micro-pressure waves [5,6]. Numerous scholars have extensively investigated the alleviating effects of tunnel entrance hoods on the MPWs. Howe et al. [7,8] conducted a detailed analysis of the aerodynamic effects of compression waves generated by trains passing through various hoods. They established a relationship between the wavefront shape and the hood structure. Additionally, the study utilized acoustic theory to predict compression waves within the tunnel, and the reliability of these theoretical calculations was confirmed through experimental methods. Wang et al. [9] conducted a study on the variations in pressure gradient after implementing single and double-seam opening hoods at tunnel entrances. Through model experiments and on-site testing, they confirmed the pressure gradient alleviation effect of seam hoods on compression waves. These research findings provide a fresh perspective on optimizing hood design.
Xiang et al. [10] systematically investigated the mechanism by which hood structure openings influence the pressure gradient of compression waves. They thoroughly considered factors such as opening position and area under varying train speed conditions and their impact on the pressure gradient of compression waves. Wang et al. [11,12] employed a two-dimensional axisymmetric numerical simulation model to simulate the propagation of compression waves. They achieved this by introducing a pressure inlet boundary at the upstream tunnel boundary. Consequently, they summarized the effects of tunnel exit hoods on the propagation and reflection characteristics of MPWs.
Through on-site testing and numerical simulation, Fukuda et al. [13] discovered that the installation of snowshed structures with openings between tunnel clusters has a mitigating effect on the MPWs. Saito et al. [14] conducted a study on the aerodynamic effects of dividing-type hoods at tunnel exits. They substantiated the effective alleviation of MPWs by this structure through model experiments. Utilizing acoustic theory, Miyachi [15] derived a predictive formula for MPWs that takes into account the topographical factors. They also outlined the impact of surrounding topography on the MPWs at tunnel exits. Zhang et al. [16] used a two-dimensional axisymmetric simulation model to simulate the generation and propagation process of MPWs. They investigated the mitigation effects of MPWs concerning the geometric shapes of various tunnel exits and summarized the relationship between tunnel exit topography and the effective solid angle coefficient.
While scholars have extensively researched hood structures, most of these studies have focused on the aerodynamic impact of hoods installed at tunnel entrances, leaving a systematic exploration of the mitigation mechanism of exit hoods lacking. With the increase in tunnel construction length and train operating speed, relying solely on entrance hoods as a design standard presents certain limitations in terms of geographical conditions and economic costs. For instance, in some mountainous tunnel cases where the tunnel entrance or exit is connected to a bridge, it is not feasible to construct large-scale hoods. Consequently, trains must reduce their speed when passing through the tunnel, which significantly reduces the transport efficiency of high-speed railway lines.
To address these concerns, this paper employs a combination of theoretical analysis and three-dimensional numerical simulation research methods. A comprehensive aerodynamic simulation model involving the train–tunnel–hood–air interaction is established. By comparing the mitigation effects of exit hoods with different opening ratios on the MPWs, the study validates that the opening ratio is a critical influential parameter for exit hoods. It separately calculates the impact of various opening forms of hoods on the spatial distribution pattern of MPWs and deduces the influence pattern of opening forms on the effective solid angle. Additionally, the aerodynamic characteristics of MPWs after the installation of hoods at tunnel entrances and exits are analyzed. The research findings hold significant guiding implications for the design and optimization of hoods, offering novel perspectives for the design of tunnel entrance and exit hoods.

2. Theoretical Analysis of Key Parameters for Exit Hoods

When a train enters a tunnel at high speed, the confinement of the tunnel walls causes the air ahead to generate compression waves. These compression waves propagate forward within the tunnel at the speed of sound. Upon reaching the tunnel exit, they generate MPWs that radiate into external space. However, when an opening hood is placed at the exit, the compression waves passing through the opening area release a portion of their pressure in advance. This physical phenomenon is analogous to gas leakage from a sealed container. Hence, the thermodynamic model of the exit hood can be simplified to that of gas leakage in a rigid, sealed container. Moreover, the controlled volume method is utilized to analyze the key factors influencing pressure changes within the air area. The simplified thermodynamic system of the tunnel exit hood is shown in Figure 1.
Taking V 1 , V 2 , and V 3 as control volumes from Figure 1, the analysis process follows the following assumptions:
  • The air within the control volumes is treated as an ideal gas, and the total energy change of the system is attributed to thermodynamic energy.
  • The tunnel walls act as adiabatic boundaries, and the system does not perform mechanical work on the external environment.
  • The specific enthalpy entering and exiting through the opening interface is equal to the average specific enthalpy of the air within the control volume at that moment.
  • The change in mass within the control volume during differential processes is entirely caused by variations in the mass of the air.
The energy equation [17] (pp. 46–49) for the opening hood structure system is given by Equation (1). Substituting h = p v + u into Equation (1) and simplifying the calculation in conjunction with the assumptions yields Equation (2) [18]:
δ Q = d E C V + h o u t δ m o u t h i n δ m i n + δ W i
m d u = p v d m
where δ Q is the energy received by the system from the external environment, d E C V is the change in total energy of the system, h i n , h o u t is the enthalpy of the infinitesimal working substance flowing into and out of the system, δ m i n , δ m o u t is the mass of the infinitesimal working substance flowing into and out of the system, δ W i is the mechanical work done by the system on the external environment, h is the average specific enthalpy of the air within the control volume, p is the transient average pressure within the control volume, v is the specific volume, u is the specific thermodynamic energy, m is the total mass of the air within the control volume, and d m is the net mass of air flowing in and out of the control volume through its interfaces.
When an ideal gas within the control volume is in equilibrium, Equations (3)–(5) can be derived from the Clapeyron equation. Equation (5) is the differential form of the Clapeyron equation:
p v = R g T
p V = m R g T
d p p + d V V = d m m + d T T
where R g is the gas constant, T is temperature, and V = V 1 + V 2 + V 3 is the volume of the entire system.
The equation for the specific heat capacity of an ideal gas [17] is given by Equation (6). By substituting Equations (3) and (6) into Equation (2), we can derive Equation (7). In Equation (7), since the control volume of the entire system remains constant, combining the Clapeyron equation with Equation (7) leads to the average pressure change caused by mass variation within the exit hood system, as shown in Equation (8). Due to the influence of the thermal motion of air molecules, it can be estimated in the subsequent analysis that each point on the opening cross-section of the hood structure has the same flow velocity. The unit time is taken in the analysis process, so Equation (8) can be rewritten as Equation (9):
d u = R g γ 1 d T
d m m = 1 γ 1 d T T
d p = γ R g T ρ a v e V d V o u t
d p = γ R g T ρ a v e V d A o u t s
where ρ a v e is the average density of the air flowing out through the opening of the hood, d V o u t is the change in volume of the air within the system, A o u t is the area of the opening in the hood, s is the flow velocity at the cross-section of the opening in the hood, and γ is the specific heat ratio.
In conclusion, for an exit hood structure in a tunnel, when the temperature within the system and the flow velocity at the opening cross-section of the hood remain constant, the pressure variation near the exit of the hood structure is directly proportional to the opening area.

3. Methodology for Numerical Simulation

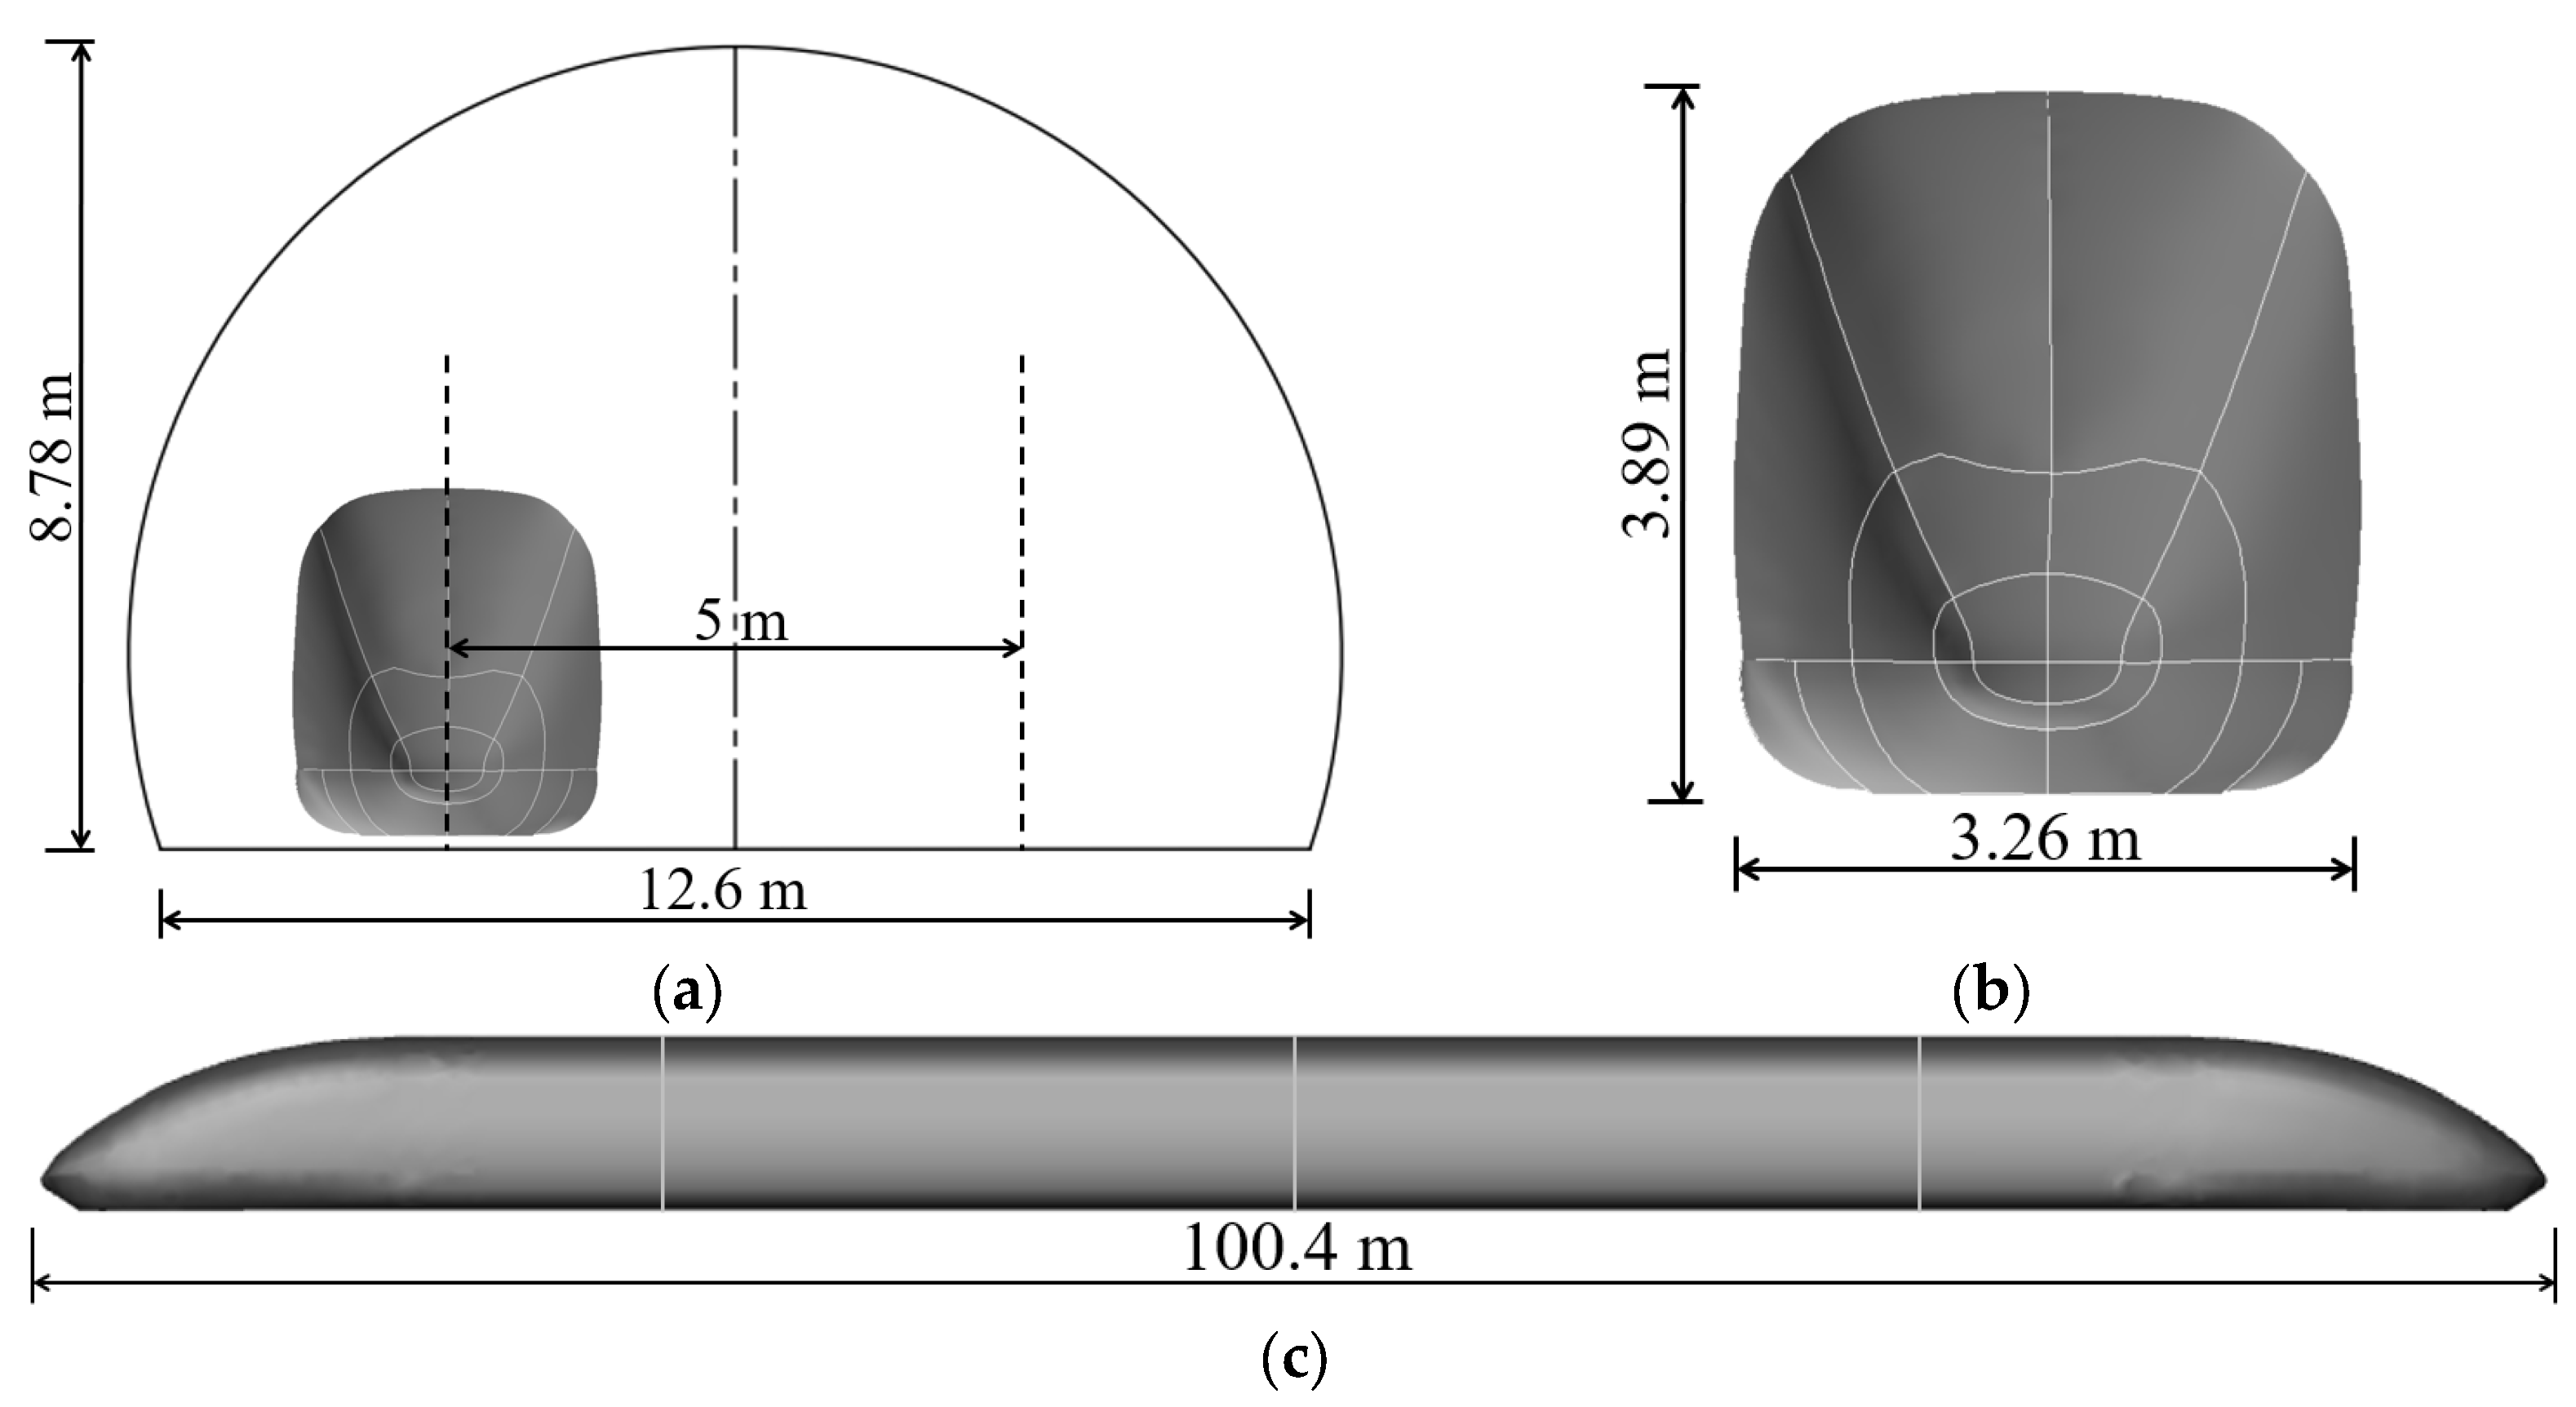
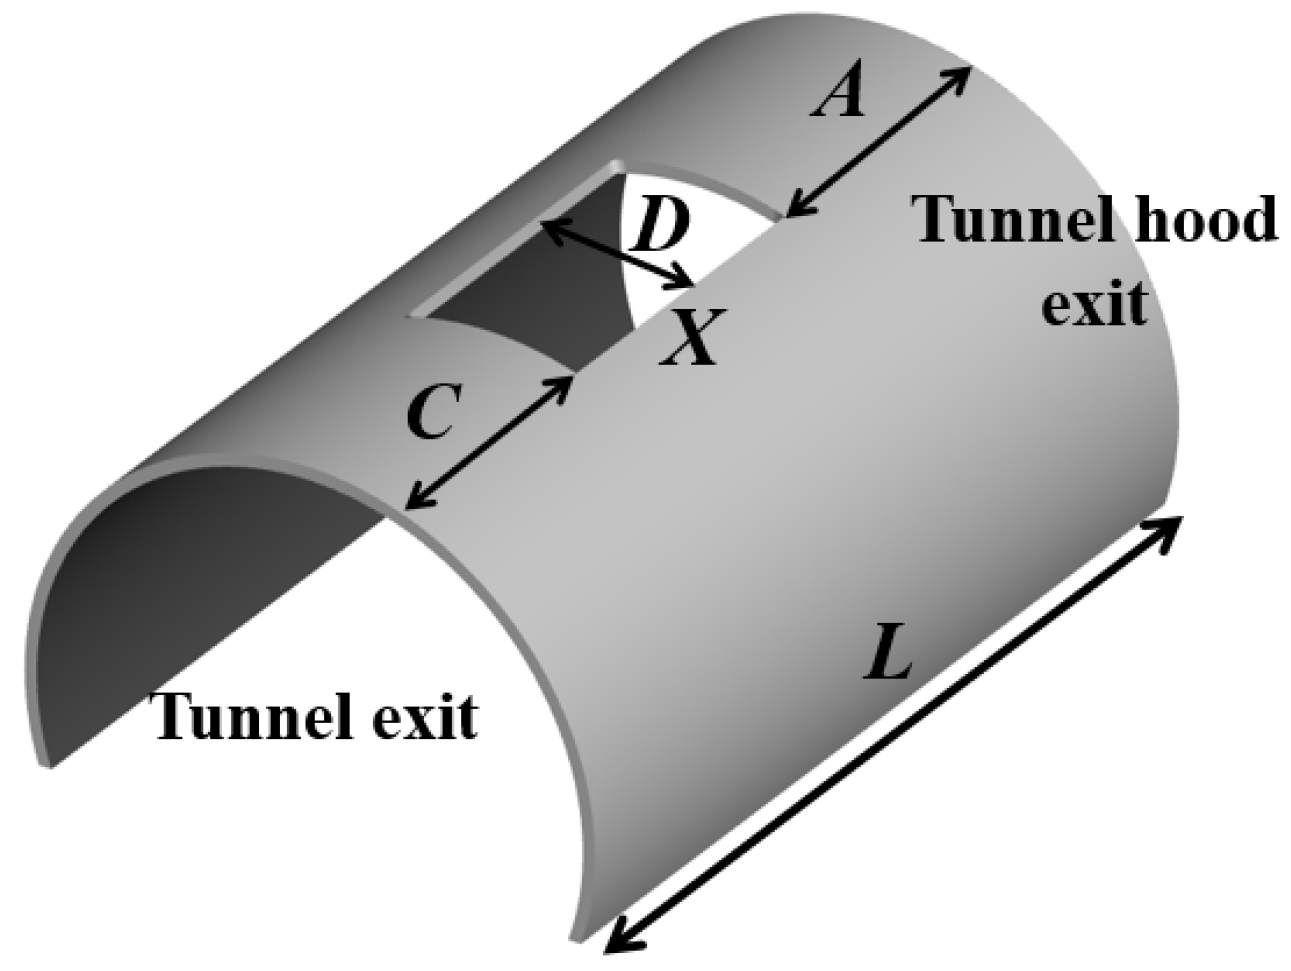
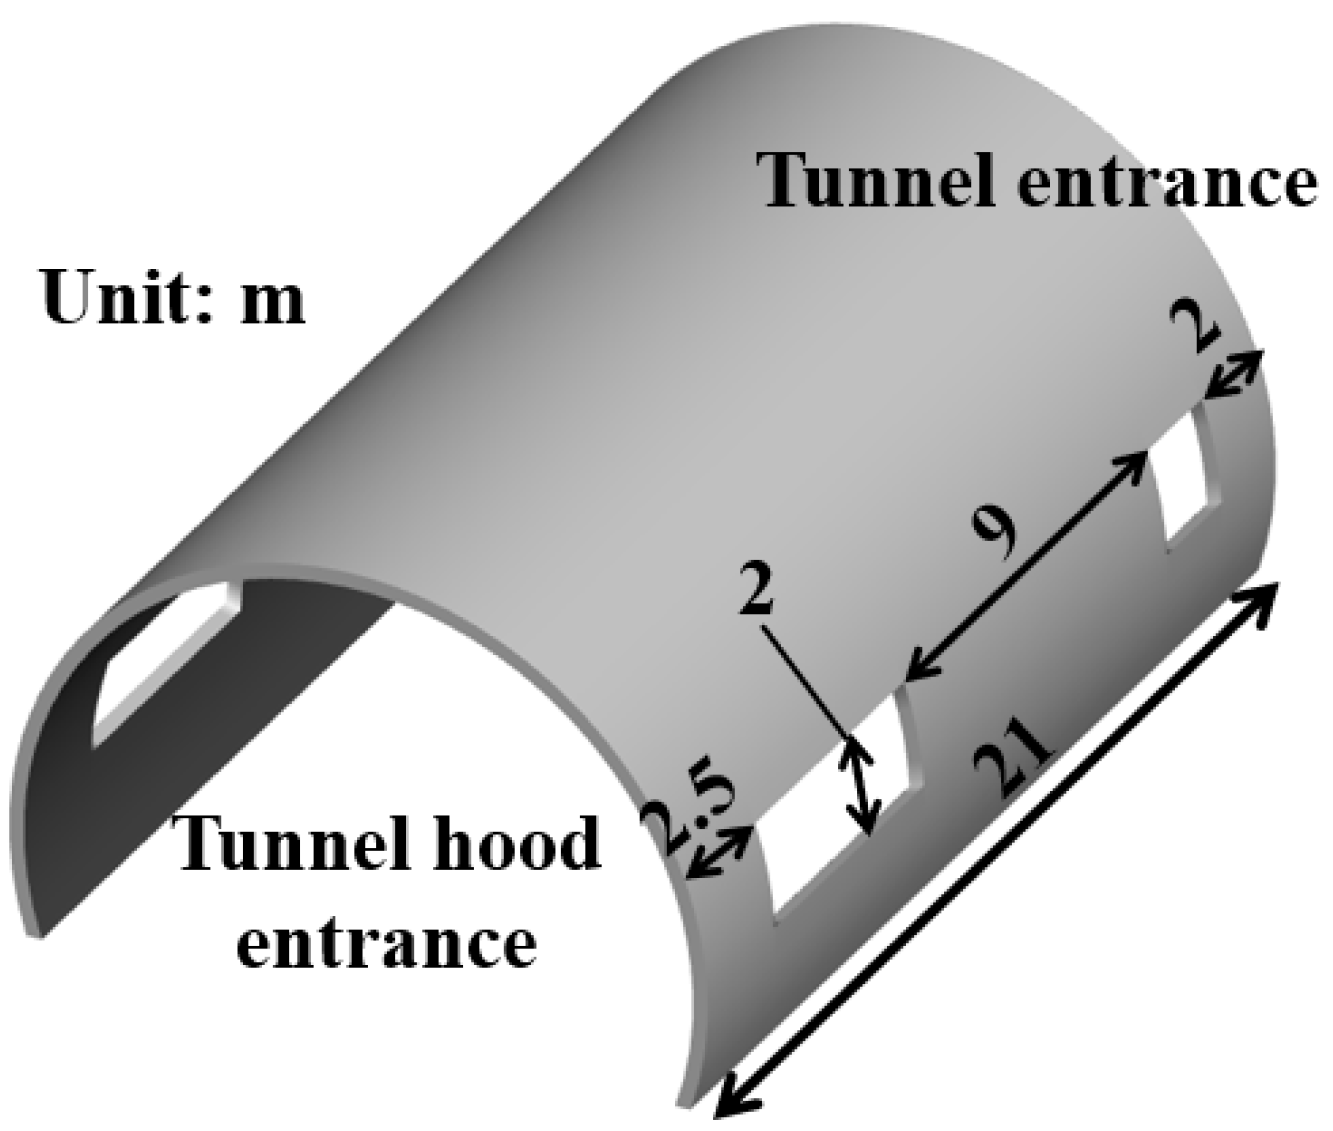
3.1. CFD Geometric Model

In this study, the Chinese standard high-speed train CRH380B is selected as the numerical simulation model. The train model consists of a head car, a tail car, and two middle cars. The head and tail cars share identical structures. The train has a dimension of 3.26 m in width, 3.89 m in height, and 100.4 m in length. The cross-sectional area of the train body is 11.62 m2, and the train operates at a speed of 400 km/h. The pressure amplitude of MPWs is closely related to the shape of the front part of the train. Hence, the train model was moderately simplified in its simulation process by leaving out some auxiliaries such as bogies and pantographs [9,19]. The study focuses on double-track tunnels of the Chinese high-speed railway. The cross-sectional area of both the tunnel and the hood structure models is 100 m2. The blockage ratio between the train and the hood is 0.116. The distance between the two tracks is 5 m, the train will operate along the left track of the tunnel, and the tunnel length is 500 m. Dimensions of the computational model are shown in Figure 2.

3.2. Numerical Setups

The simulations mentioned in this paper were performed using the commercial CFD solver ANSYS Fluent by solving the governing equations with the finite volume method. In typical scenarios, when a train enters and travels within a tunnel, the flow field characteristics in the vicinity of the train and inside the tunnel manifest a three-dimensional, unsteady, and turbulent state [20]. When the Mach number of the train’s operating speed exceeds 0.3, the air is considered compressible. In this study, the train’s speed is 400 km/h (111.11 m/s), which exceeds a Mach number of 0.3. Therefore, the compressibility of the air was considered in the subsequent simulations [21]. Compression waves radiate outward from the tunnel exit, leading to the generation of MPWs. These MPWs induce pressure discontinuities in the air surrounding the exit, subsequently causing airflow disturbances and generating aerodynamic noise. Currently, numerous studies have employed large-eddy simulation (LES) models to simulate aerodynamic noise and micro-pressure waves. Furthermore, the computed results have demonstrated favorable consistency with real-world data [22,23,24]. Therefore, in this study, the combination of three-dimensional, unsteady, compressible Navier–Stokes equations, and the LES model are chosen for simulating MPWs. The flow-solver type chosen for the simulation is the pressure-based solver. The coupled algorithm was selected to update the pressure–velocity coupling fields, while the Green–Gauss node-based method was used to control the gradients. The second-order upwind scheme was adopted for the density and energy equations, while the transient formulation was solved using a first-order implicit algorithm. The time step was set at 5 × 10⁻⁴ s. For each time step, the maximum number of iterations is 50, and the residuals for all equations are set at 1 × 10⁻³ [24], which is consistent with Fluent’s default convergence criteria.
Given the complex geometry of the train’s frontal section, an unstructured grid strategy is employed in this study to discretize the geometry model of the train’s frontal part, while a structured grid strategy is adopted for the other part. When the train enters the tunnel and generates a compression wave, this wave propagates forward along the tunnel at the speed of sound. The airflow around the train body has a relatively minor influence on the propagation of compressional waves thanks to the significantly higher speed of sound compared to the velocity of the train. Therefore, volume cells are directly employed to discretize the area around the train in the simulation to conserve computational resources. This meshing strategy has been widely applied in simulating the aerodynamic effects of MPWs in high-speed railways [5,25]. In the critical areas of the computational model, the grid size is refined with a minimum grid size of 0.05 m near the hood, train, and micro-pressure wave measurement points and a minimum grid size of 0.1 m in the tunnel area. The grid gradually becomes sparser at locations away from the critical areas, with a maximum grid size of 0.8 m. The computational domain grid is shown in Figure 3.
In this study, the sliding mesh and dynamic mesh techniques provided by Fluent 15.0 software were employed to accurately simulate the relative motion between the train and the tunnel [26,27,28]. The computational domain was divided into two independent areas: the stationary area and the moving area. The stationary area comprises the left atmospheric domain, right atmospheric domain, and tunnel domain. The moving area consists of the train and the surrounding air, moving at the speed of the train during its operation. Information exchange between the two computational areas is achieved through an interface. The mountain near the entrances and exits of the tunnel is simplified as a vertical plane. At the initial moment, the distance between the tip of the train’s head and the tunnel entrance is 133.3 m. The train enters the tunnel after running in the atmospheric domain for approximately 1.2 s. This interval ensures the stability of the surrounding flow field conditions when the train enters the tunnel and reduces the impact of boundaries on the flow field. Numerical simulations are conducted using a full-scale model. The dimensions of the atmospheric domain were set to 350 m (length) × 120 m (width) × 75 m (height). The sides, top, front and rear ends of the atmospheric domain model are bounded by the “Pressure-far-field”. The surfaces of the train, tunnel, hood, ground, and mountain are treated with “Wall” boundary conditions. To fully observe the generation and propagation of MPWs, the total simulation duration is set to 3 s. The specific computational domain and boundary conditions are shown in Figure 4.

3.3. Layout of Monitoring Points

Previous studies mainly evaluated the mitigation effects of hood structures by monitoring the pressure gradient of compression waves within the tunnel [5,6]. However, the pressure gradient within the tunnel remains unchanged if a hood is installed at the exit or not. Therefore, a series of measurement points are placed in the vicinity of the hood exit area, as shown in Figure 5, to investigate the mitigation effect of the hood structure on the MPW at the exit, as well as the distribution patterns of MPW. A circular arrangement of monitoring points is established by using the midpoint of the hood exit as the center and at a height of 2 m above the ground, which is approximately half the height of the train. These points are created at 45° intervals along the zoy plane (top) and the zox plane (side) with a specific radius of r. The pressure amplitude of the MPWs exhibits a symmetric distribution along the tunnel’s centerline. Therefore, for monitor points on the same plane, it’s sufficient to monitor only half of the circular range. Based on the evaluation norm for MPWs in countries such as China, Japan, and Germany, the radius of 20 m and 50 m are chosen respectively for analysis. When r = 20 m, the variation range α , β is from 0° to 135°. When r = 50 m, the variation range α , β is from 0° to 90° due to some monitor points being located within the mountains.

4. Numerical Validation

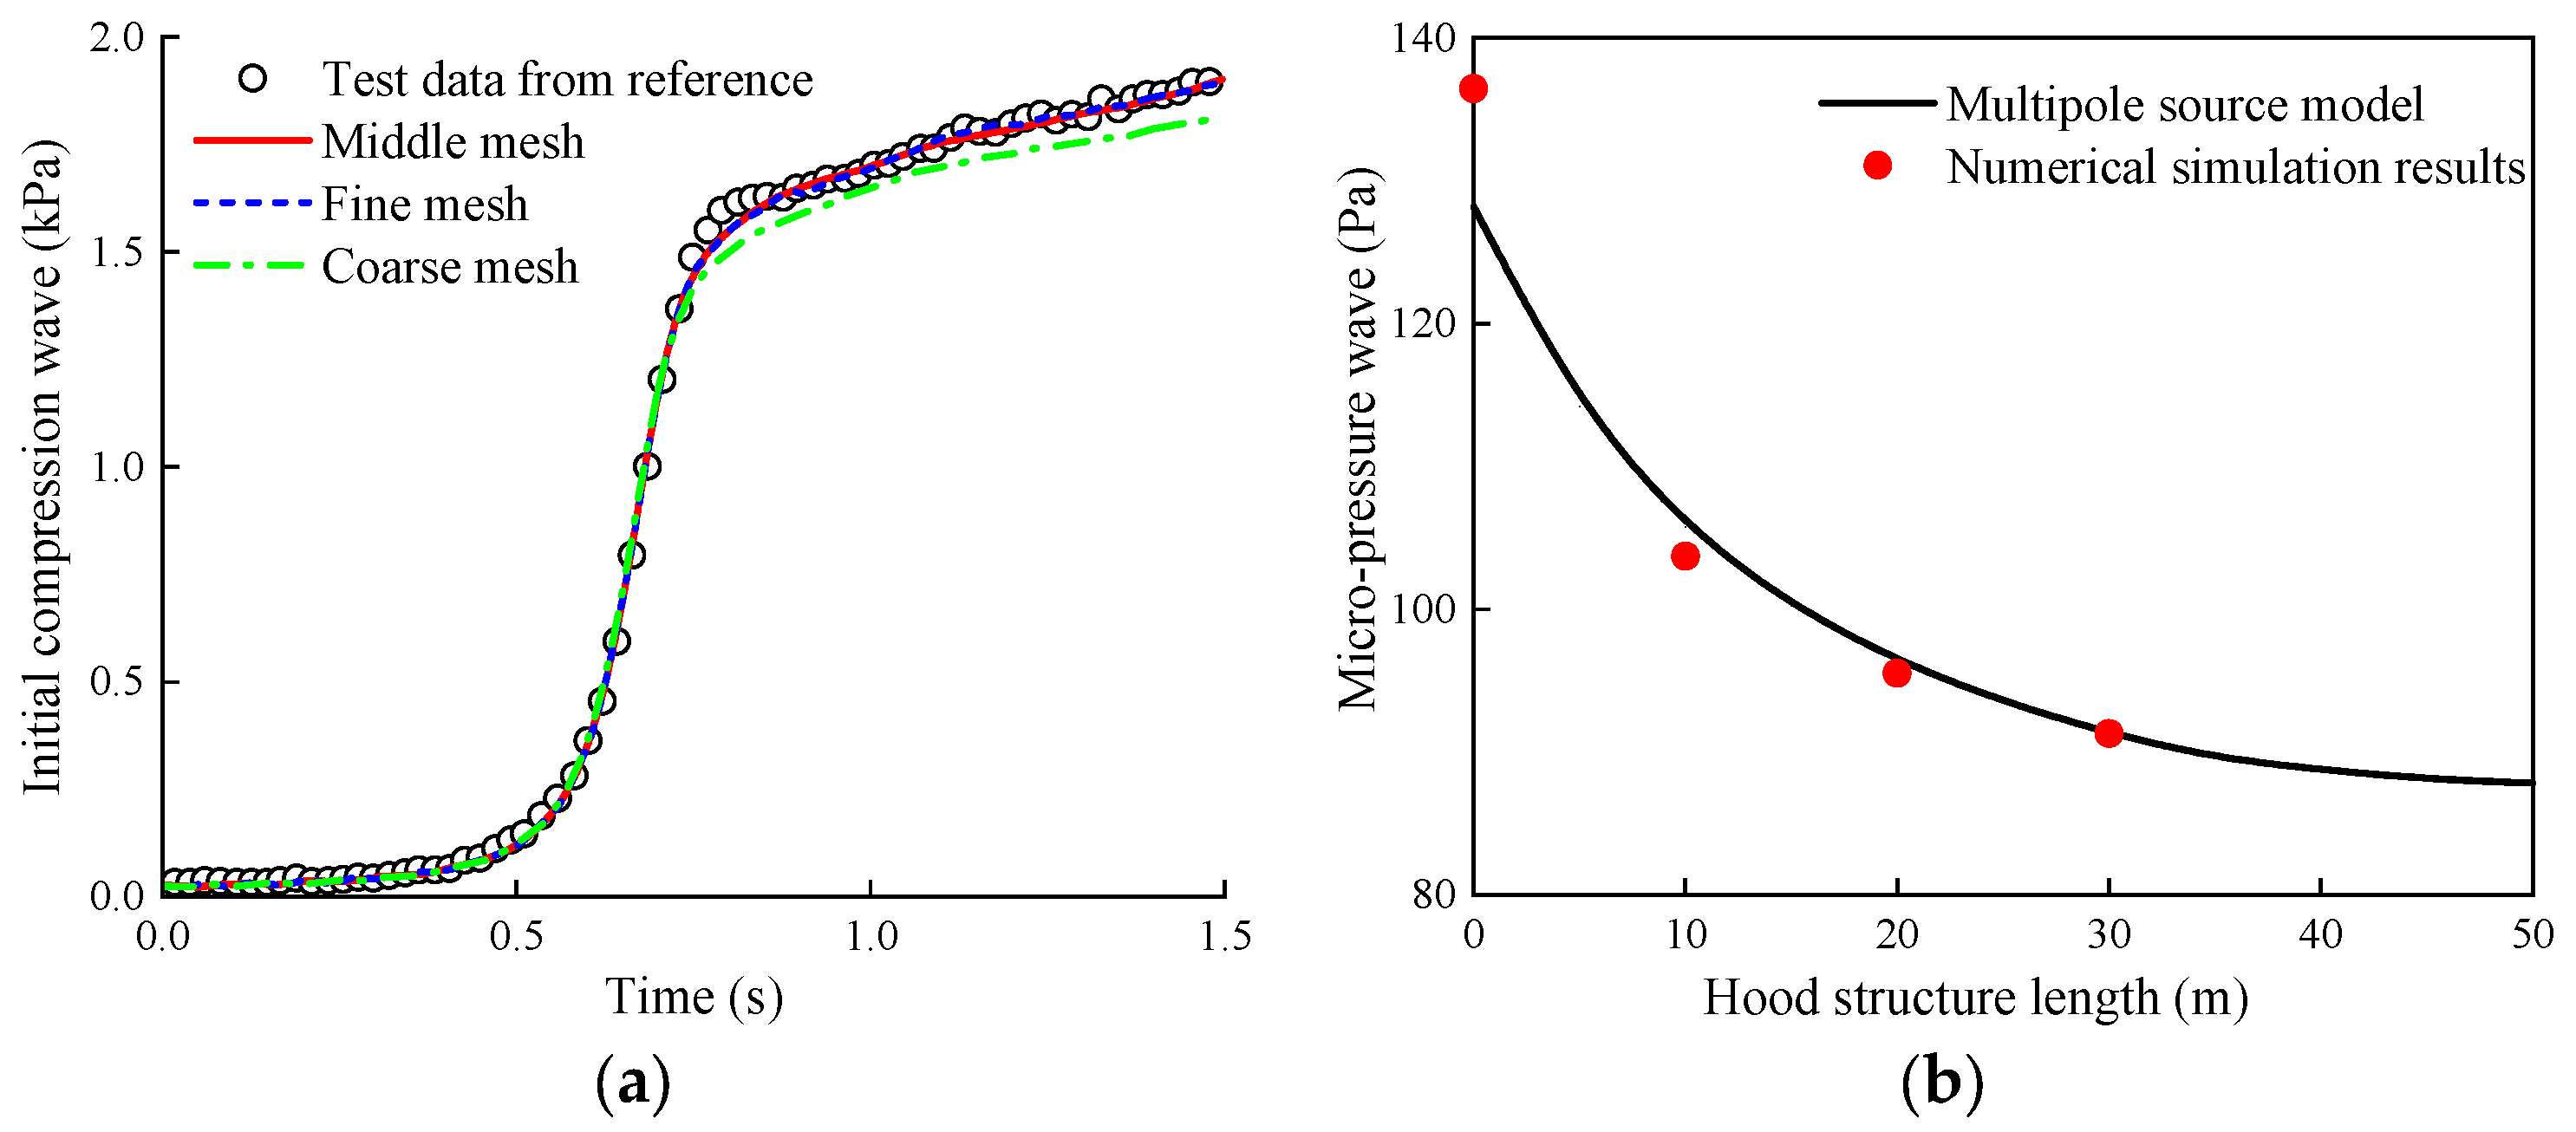
4.1. Grid-Independence Study

To validate the reliability of the grid size settings, three different mesh strategies are employed: fine mesh, middle mesh, and coarse mesh (with approximately 28 million, 18 million, and 10 million cells, respectively). Among these, the grid size of the middle mesh corresponds to the subsequent numerical simulation grid in this paper. A comparison between the simulated results of this study and the pressure data obtained from field measurements at 100 m from the tunnel entrance, as presented in Ref. [29], is conducted to validate the grid independence of the simulated results in this study.
The tunnel’s cross-sectional area is 61.9 m2, with a total length of 25.8 km. The train operates at a speed of 256 km/h and the numerical simulation settings are consistent with those described in Section 3.2 of this paper. The comparison between the field-measured data and the simulation results is shown in Figure 6a. The numerical simulation results exhibit a similar trend in the variation of the compression wave compared to the field-measured data. The simulation results of the middle and fine mesh show a favorable agreement with the measured data, while the results from the coarse mesh show significant discrepancies. Compared to the middle mesh, the deviations for the fine and coarse meshes are 1.3% and 4.1%, respectively, indicating the rationality of the grid size adopted in this study. Thus, the middle mesh is used for the subsequent research to balance the calculation accuracy and computing resources.

4.2. Validation of Numerical Method

To further validate the accuracy of the numerical simulation method in simulating MPWs, the extended radiation solid angle prediction formula proposed in Ref. [15] (multipole source model) was employed to verify the micro-pressure wave results obtained from the numerical simulations. The geometric model dimensions and the setups for the simulation are consistent with Section 3.1 and Section 3.2 of this paper. Different lengths of hoods without openings were chosen, and the variation in the amplitude of MPWs at measurement points ahead of the tunnel exit centerline (r = 20 m, α , β = 0) was analyzed concerning the length of the hood. Figure 6b shows the comparison between the predictive formula and the simulation results.
The trend of MPW amplitude variation with the length of the hood, as predicted by the Multipole Source Model formula, is consistent with the conclusion in Ref. [30]. The MPWs obtained from the simulations exhibit good agreement with the predicted results from the Multipole Source Model formula for all cases except the one without the hood. When there is no hood at the tunnel exit, the dominant effect on the MPWs is the phenomenon of reflection near the mountain [30]. The Multipole Source Model formula did not consider this reflection phenomenon; thus, errors were caused in the calculated results for the case without a hood. When a hood without an opening is placed at the tunnel exit, there is a certain reduction in the pressure of the MPW. However, the hood has a critical length (Lcr) of approximately 20 m [30]. When the length of the hood without an opening exceeds 20 m, the variation in the amplitude of the MPW is minimally influenced by the change in length. When the length of the hood increases from 20 m to 30 m, the reduction ratio of the MPW amplitude is approximately 4.8%. The numerical simulation results in this study are relatively close to the MPW amplitude without a hood, as reported in the existing paper [28]. When the hood length is 10 m, compared to the results from the predictive formula, the maximum error is approximately 1.9%. Therefore, the numerical simulation method employed in this study can effectively predict the aerodynamic effects of MPWs and can be utilized for subsequent analysis.

5. Results and Discussion

This section explores the impact of the exit hood on the propagation and evolution characteristics of MPWs, as well as the spatial distribution patterns of MPW amplitudes near the exit and the influence of exit hood structures on the effective radiation solid angle. Furthermore, an analysis of how the exit opening hoods affect MPWs is presented, providing a theoretical foundation for future studies in the design of hoods.

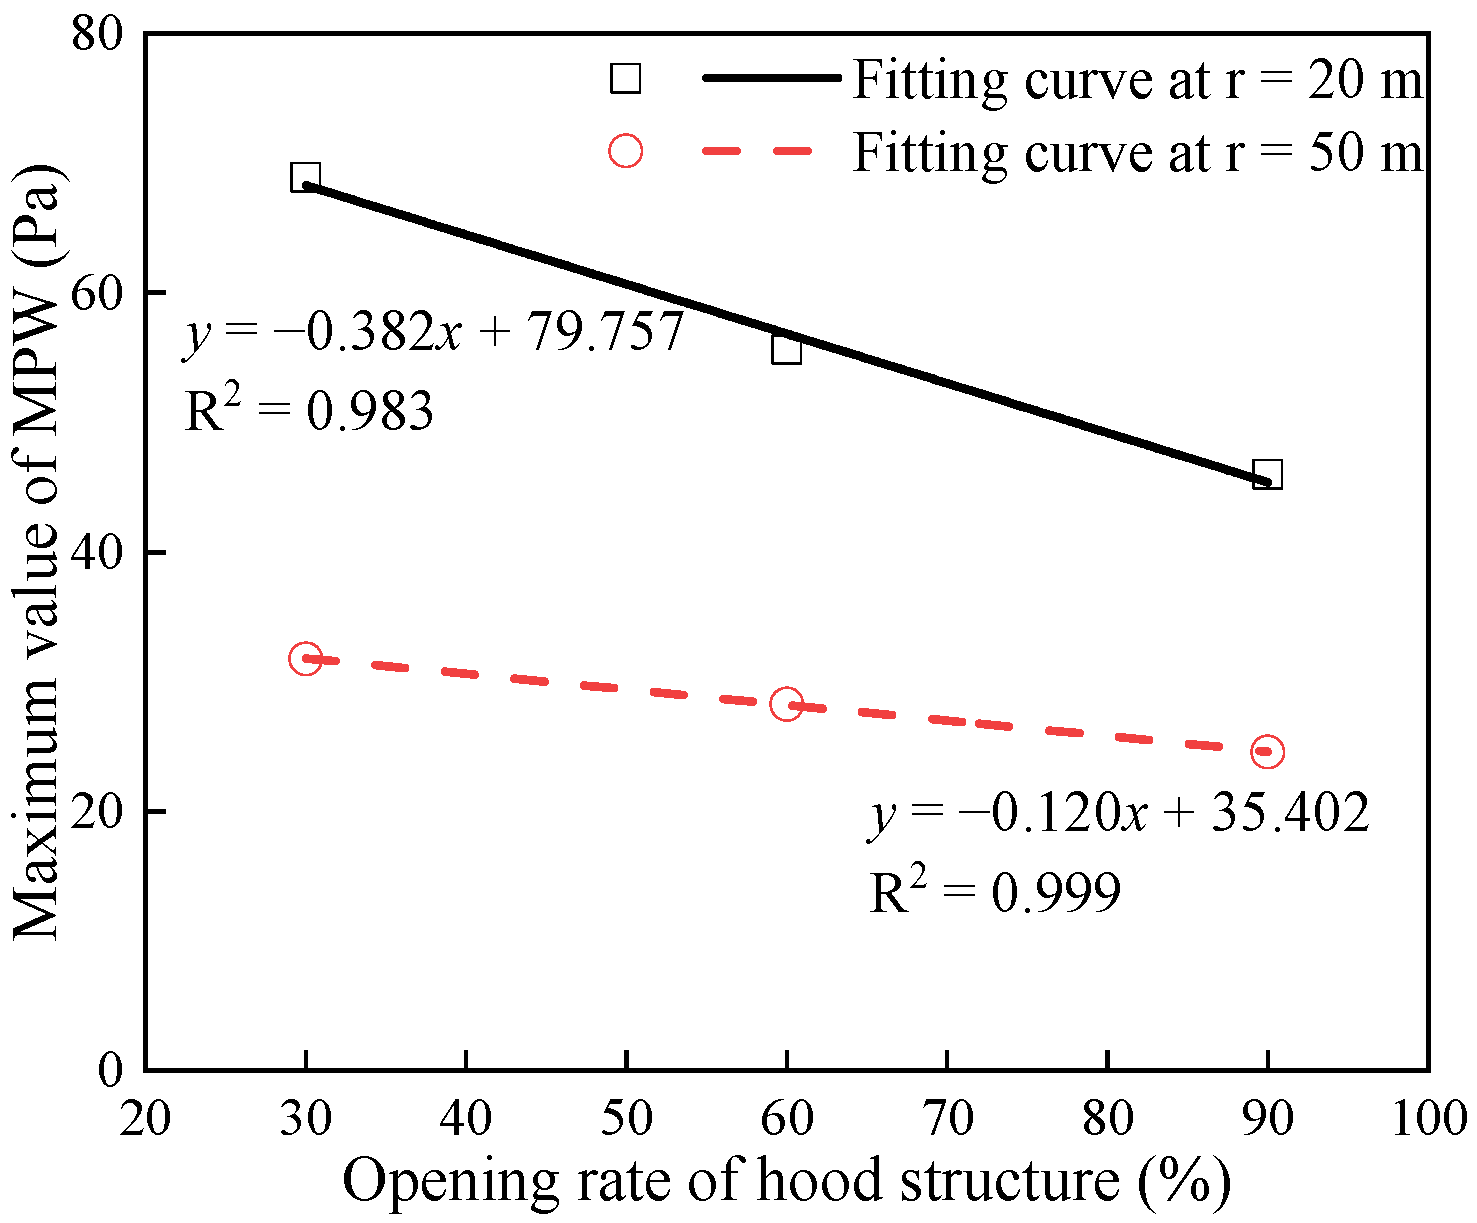
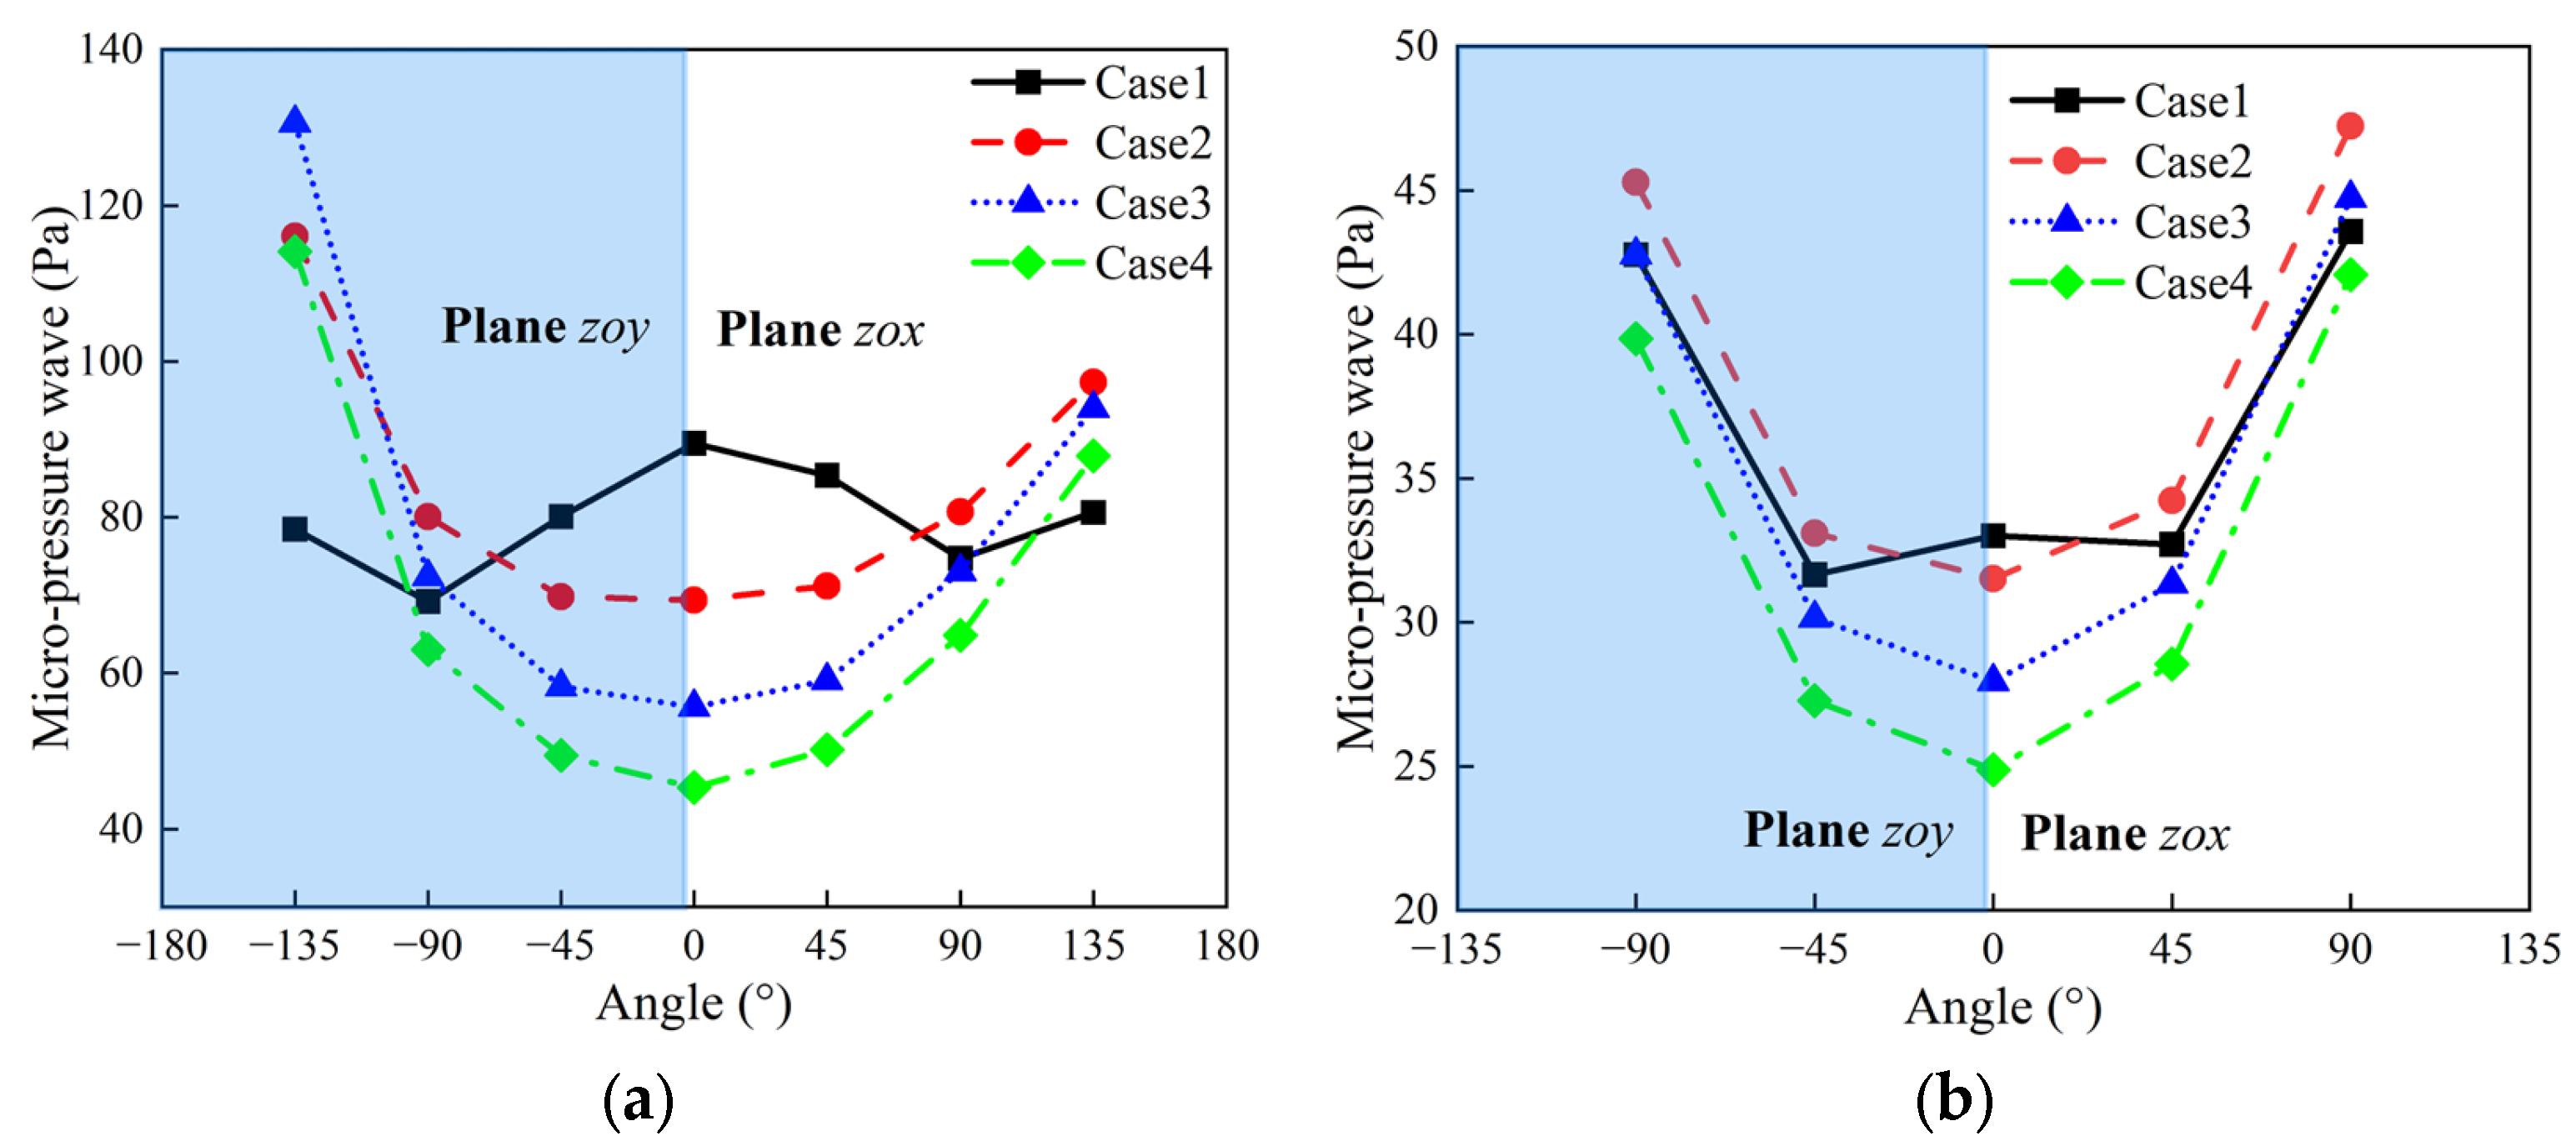
5.1. Analysis of the Impact of Exit Hood Opening Ratio

For this section, four different hoods were selected to investigate the influence of the opening ratio of the exit hood on the MPW. In the subsequent analysis, the hood without an opening (Case 1) was chosen as the control group, with specific parameters shown in Table 1. The specific parameter settings for the exit hood are shown in Figure 7. During the simulation process, the fixed circumferential arc length (D) of the opening is 4 m. The distance between the opening and the exit of the hood (A) is 7 m, while the distance between the opening and the tunnel exit (C) is 6.5 m. By changing the length of the opening (X), the total opening ratio of the hood (the opening area divided by the cross-sectional area of the hood) can be adjusted. The total length of the hood is L. Furthermore, all the hoods in this paper have a total length (L) greater than 20 m. Based on the conclusions in Section 4.2 of this paper, subsequent analysis could disregard the impact of variations in the total length of the hoods on the amplitude of the MPWs.
As indicated by existing research findings [16,30,31], micro-pressure waves manifest directionality when radiating outward from the tunnel exit. The MPW amplitudes recorded at monitor points directly in front of the exit axis ( α , β = 0) are noticeably higher than those at other points. To investigate the influence of the exit hood on the MPWs in the area directly in front of the exit axis, the time–history curve of MPWs is shown in Figure 8 for the case when the radiation radius is r = 20 m. With the installation of the exit hood, the waveform of the MPWs at point F1 remained unchanged. However, the peak values of the MPWs at this point decreased as the opening ratio of the hood increased. Table 2 shows a comparison of the MPW amplitudes at point F1 under different circumstances. With a radiation radius of r = 20 m, Case 1 exhibited the highest MPW amplitude at point F1, with a value of 89.5 Pa. However, upon the installation of the exit hood with an opening, the minimum MPW amplitude was reduced to 45.9 Pa. Compared to Case 1, setting an opening significantly reduces the MPW amplitude at point F1. The reduction can reach a maximum of 48.7%. Hence, setting an opening in the exit hood leads to a higher efficiency in mitigating MPWs. The fitting curve of MPW amplitude concerning the opening ratio of the hood is shown in Figure 9. At point F1, the amplitude of the MPW decreased as the opening ratio of the hood structure increased. A negative linear function was employed to fit the relationship between the MPW and the opening ratio of the exit hood under different radiation radii. The fitting correlation coefficients R2 were all greater than 0.98. At point F1, the maximum amplitude of MPWs occurs when there is no opening in the hood. However, when the opening ratio reached 90%, the minimum amplitude of MPWs was observed. This trend holds under various radiation radii. Furthermore, both the amplitude and attenuation ratio of MPWs decreased as the radiation distance increased, which is consistent with previous research findings [5].
To further investigate the impact mechanism of exit hoods on the MPWs, this study will analyze the pressure distribution characteristics of MPWs under different exit hoods. Figure 10 shows the generation, propagation, and evolution process of MPWs on the x = 0 m (tunnel centerline) plane. However, Figure 10a,c,e,g,i correspond to the condition without an opening in the hood (Case 1), while Figure 10b,d,f,h,j correspond to the condition with an opening at the top of the hood (Case 2). When t = 2.2 s, the compression wave reached the vicinity of the tunnel exit, and the exit of the hood starts generating a positive pressure zone and radiating MPWs outward. Currently, the pressure change is relatively small. In Case 2, the compression wave, in the presence of the opening, was released outward earlier, resulting in a lower pressure amplitude at the exit of the hood compared to Case 1. This situation led to a lower pressure gradient at the exit. Simultaneously, the radiation distance of the MPW is greater at the same moment compared to Case 1, as shown in Figure 10a,b. When t = 2.2–2.3 s, the pressure amplitude of the MPW outside the tunnel rapidly increased. In Case 1, the MPW approximately radiated outward from the exit of the hood in a semi-spherical shape. However, when obstructed by the topography near the mountain, the MPW gradually transformed into a 1/4 spherical shape and continued to propagate outward. In Case 2, both the opening and the exit of the hood released pressure outward. In these two areas, MPWs were generated and propagated outward, respectively. When the MPWs propagated to a certain radiation radius, the two waves superimposed and rapidly evolved into a 1/4 ellipsoidal shape, continuing to propagate further, as shown in Figure 10c–f. The results of this study are consistent with previous research findings [16], demonstrating that micro-pressure waves exhibit elliptical propagation characteristics. When t = 2.5 s, in Case 1, the MPW propagated outward and reached the vicinity of the mountain where reflection occurs. The reflected wave superimposed with the MPW radiated from the outlet and evolved into a 1/4 ellipsoidal shape, continuing its propagation, as shown in Figure 10g. When t = 2.6 s, the release of the compression wave was essentially complete, and the MPW maintained a certain front and continued to propagate further. As the propagation distance increased, the amplitude of the MPW weakened, and the fluctuations gradually dispersed in three-dimensional space, as shown in Figure 10i,j. In conclusion, when an opening hood was employed at the tunnel exit, it is possible to reduce the pressure amplitude and pressure gradient at the exit of the hood by releasing a portion of pressure in advance. Furthermore, the exit hood can disperse the release area of the compression wave and enlarge the radiating area of the MPW, thus effectively mitigating the impact of MPWs.
Based on the research findings, the installation of the exit hood can effectively reduce the amplitude of MPWs. However, there may be an increase in pressure amplitude in the vicinity of the hood’s opening. Therefore, further research is essential for a better understanding of the distribution pattern of MPW amplitudes around the exit hood.
To provide a more precise description of the impact of factors such as tunnel exit topography on the MPWs, Miyachi [32] introduced the concept of the effective radiation solid angle and presented Equation (10). The effective solid angle is a parameter that quantifies the influence of tunnel exit topography on the radiation area of MPWs, as shown in Figure 5c. When assessing the influence of the surrounding topography on the MPWs within the spherical range of radiation, it can be achieved by calculating the effective solid angle ( Φ ) at each measurement point. The effective solid angle ( Φ ) in Equation (10) is closely related to the maximum pressure gradient at the tunnel exit and the maximum value of MPWs. Based on the calculation results, the representative wavelength of the compression wave is approximately 45 m. Therefore, the maximum pressure gradient of the compression wave within a range of 50 m from the tunnel exit is selected for further analysis. To describe the relationship between different hoods and an infinite plane, we introduce a correction coefficient denoted as k = Φ / 2 π . This correction coefficient represents the ratio between the effective solid angle with a hood and the radiation solid angle under the assumption of an infinite plane. In the case of an infinite plane, the radiation solid angle is 2 π .
Φ = ( 1 + r cos θ ) 2 S [ P M W ] max c r p [ p t ] max
where t is time, P M W is the micro-pressure wave, p is the pressure of the compression wave, r p is the distance from the center of the hood outlet to the monitor point, Ω is the spatial solid angle, S is the cross-sectional area at the tunnel exit, c is the speed of sound, θ is the angle between the monitor point and the centerline of the tunnel exit, is the end correction factor, and the coefficient cos θ / r is used to represent the directional correction of the dipole effect in Equation (10).
Figure 11 shows the spatial distribution pattern of MPWs near the exit. According to the results in Figure 11a, for the MPW radiating with a radius of 20 m, the maximum amplitude is observed at the F1 monitor point in Case 1. Simultaneously, the MPW amplitude at measurement points located in front of the exit plane of the hood ( α , β < 90°) shows a decreasing trend as the azimuth angle increases. Conversely, for measurement points located behind the exit plane ( α , β > 90°), the MPW amplitude increased with the increment of the azimuth angle. This phenomenon is primarily attributed to the dominant role of MPW reflection near the mountainous terrain [27]. Due to the influence of opening the hood, in Cases 2–4, the MPW amplitudes on the side plane (Plane zox) and the top plane (Plane zoy) increased with the azimuth angle. However, the recorded MPW amplitudes at points in front of the hood exit plane are smaller than those in Case 1. Except for the T3 measurement point, the MPW amplitudes at all measurement points show a decreasing trend with the increase in opening ratio. Behind the hood exit plane, the MPW amplitudes on the side and top of Cases 2–4 are greater than in Case 1. Additionally, the MPW amplitude at the top of the hood structure was significantly higher than that on the side. This phenomenon is attributed to the proximity of the measurement points behind the hood to the opening. The compression wave directly released a portion of the pressure at the opening, and simultaneously, the MPW experienced reflection near the mountain. These combined effects resulted in significantly higher MPW amplitudes in the top area of the hood compared to other areas.
In Figure 11b, when the radiation radius (r) is 50 m, the trend of decreasing MPW amplitude with increasing opening ratio remains evident. However, the MPW amplitudes at the top and sides of the hood were relatively close, indicating that after propagating a certain distance, phenomena like wave reflection and superposition have already occurred. The MPW has fully developed into an ellipsoidal wavefront and is propagating towards a distant location, with pressure amplitudes nearly identical at different positions on the same ellipsoidal wavefront. Furthermore, when the radiation radius is 50 m, the dimensions of the hood without an opening at the exit are smaller than the MPW’s radiation radius; Case 1 does not follow the previously described directional pattern of the MPW. Therefore, for precise control of the MPW amplitude within a specific radiation radius, it is essential to ensure that the total length of the tunnel exit hood exceeds the mentioned radiation radius.
Based on the pressure amplitude of the MPW at various measurement points, correction coefficients k for the effective radiation solid angle were calculated. The correction coefficients k for different cases are shown in Table 3 and Table 4. According to Equation (10), it is observed that the k-values are inversely proportional to the amplitude of the MPW. Hence, the lower the pressure amplitude of the MPW at a measurement point, the higher the calculated value of k obtained. When the radiation radius is 20 m, the minimum k for Case 1 is located at measurement point F1. For Cases 2–4, the minimum k are all located at measurement point T3. Moreover, for Case 2 and Case 3, the k at T3 are both lower than that of Case 4. This indicates that measurement points near the openings of the hoods are more susceptible to pressure fluctuations. When the radiation radius is 50 m, the values of k exhibited a symmetric distribution along the sides and top of the hood. At the F1 location, the k-values showed the most variation with changes in the hood structure’s opening ratio, indicating that the F1 measurement point is more susceptible to pressure fluctuations under the condition of a 50 m radiation radius. When k 1, it indicates that the amplitude of the MPW at that point is equal to or smaller than that on an infinite plane. The values of k for the measurement points in front of the hood structure’s exit plane are all greater than 1, indicating that setting an opening in the hood can effectively disperse the pressure relief area of the compression wave, expand the radiating area of the MPW in front of the exit plane, and thereby achieve an alleviating effect on the MPW.
In conclusion, by incorporating openings into the exit hood, it becomes possible to pre-release pressure and reduce the pressure amplitude at the tunnel exit. Simultaneously, this expands the radiating area of the MPW, thereby increasing the effective solid angle of radiation. This accomplishes the objective of mitigating the impact of the MPW within a certain radius. This validates the conclusion in Section 2, emphasizing the pivotal role of the opening ratio in influencing the alleviation efficiency of the exit hood, and the decrease in MPW amplitude in front of the exit hood plane is directly proportional to the opening ratio.

5.2. Analysis of the Effects of Different Exit Hood Opening Form

The above research indicates that when an opening is introduced into the hood at the tunnel exit, it results in an increase in pressure amplitude in the vicinity of the hood’s opening area. To investigate the influence of different opening forms of exit hoods on the spatial distribution pattern of MPWs, three distinct opening forms are selected for comparative analysis: top opening, side opening and seam opening, as shown in Figure 12. The dimensions of the hoods are as follows: the cross-sectional area of the hood is the same as that of the tunnel, and the total length is 21 m for all cases, with an opening ratio of 30%. In the subsequent analysis, Case 1 is taken as a reference case for comparison.
The spatial distribution of the MPW amplitudes is shown in Figure 13. When the MPW has a radiation radius of 20 m, the spatial distribution pattern in the condition without an opening (Case 1) is consistent with the previous conclusion. The MPW distribution patterns in front of the exit plane ( α , β < 90°) for the top-opening hood, side-opening hood, and seam-opening hood exhibited similar spatial trends. Additionally, the MPW amplitudes in these three conditions are relatively close, and they increased with the increase in observation angle. At the F1 measurement point, the MPW amplitude for the seam-opening hood is 66.6 Pa, representing a reduction of 25.6% compared to the condition without an opening. At measurement points behind the exit plane ( α , β > 90°), the MPW amplitudes for these three opening cases exhibited distinct spatial distribution patterns. Among them, the variation in MPW amplitudes is most pronounced at points S3 and T3. The top-opening hood exhibited the highest MPW amplitude at measurement point T3, with a value of 116.1 Pa, while the lowest MPW amplitude was observed at measurement point S3, with a value of 97.3 Pa. For the side-opening hood, the MPW amplitude reached its maximum at measurement point S3, with a value of 116.1 Pa, while the minimum amplitude was recorded at measurement point T3, with a value of 93.9 Pa. In the case of the seam-opening hood, the amplitude of the MPW was relatively similar at measurement points T3 and S3, with values of 106.3 Pa and 105.4 Pa, respectively. This phenomenon happens because of the compressional wave releasing a portion of its pressure as it passes through the opening, which is installed in the hood structure. The varied opening forms led to pressure release occurring at different positions, and subsequently influenced the spatial distribution patterns of the micro-pressure waves in the vicinity of the hoods.
When the radiation radius is 50 m, the four different opening cases of the hoods exhibited similar spatial distribution patterns of MPWs, and the MPW amplitudes were relatively close. This is consistent with the conclusion drawn in Section 5.1 of this paper. From the results shown in Figure 13, it can be concluded that when the opening form of the exit hood changes, there is almost no impact on the MPW in front of the exit plane. However, it only has a significant influence on the amplitude of the MPW in the vicinity of the opening. Combining the results from Figure 11, it is once again confirmed that the opening ratio is a crucial parameter affecting the mitigation effectiveness of the hood structure against MPWs.
Effective radiation solid angles for different forms of hoods are shown in Table 5 and Table 6. The correction factor k for effective radiation solid angles near the hoods falls within the range of 0.6 < k < 1.7, which closely aligns with the results by Miyachi [30]. When the radiation radius is 20 m, different opening forms of the hoods yield k > 1 in front of the exit plane. After the openings were installed, compared to Case 1, the correction factor k increased slightly. However, the variation in opening forms does not significantly alter the k in front of the exit plane. On the other hand, there is a noticeable change in k behind the exit plane of the hood, and different opening forms lead to variations in the distribution of effective solid angles at different positions. Setting openings at the top of the exit hood increases the amplitude of the MPWs in the upper area. However, it does not directly impact residents since this area is not inhabited in practical terms. On the other hand, setting an opening on the side of the hood results in an increase in the amplitude of MPWs on the lateral side. Given that these areas might have residential zones or critical facilities, it is necessary to pay close attention to this area. Since the elongated circumferential opening in the seam hood is much larger than its longitudinal dimension, compression waves can be evenly radiated outward into the external space at the opening. As a result, under the condition of the same azimuth angle of measurement points, the k remains relatively consistent. When the radiation radius is 50 m, the four different opening forms of hoods exhibit similar k values in front of the exit plane, and the spatial distribution pattern of MPWs remains consistent. Therefore, it is necessary to consider the relative importance of various positions outside the tunnel, such as residential areas, important facilities and other densely populated areas, when designing the opening form of hoods for a specific tunnel. This ensures the design of hoods can minimize the impact on residents and crucial facilities to the greatest extent.

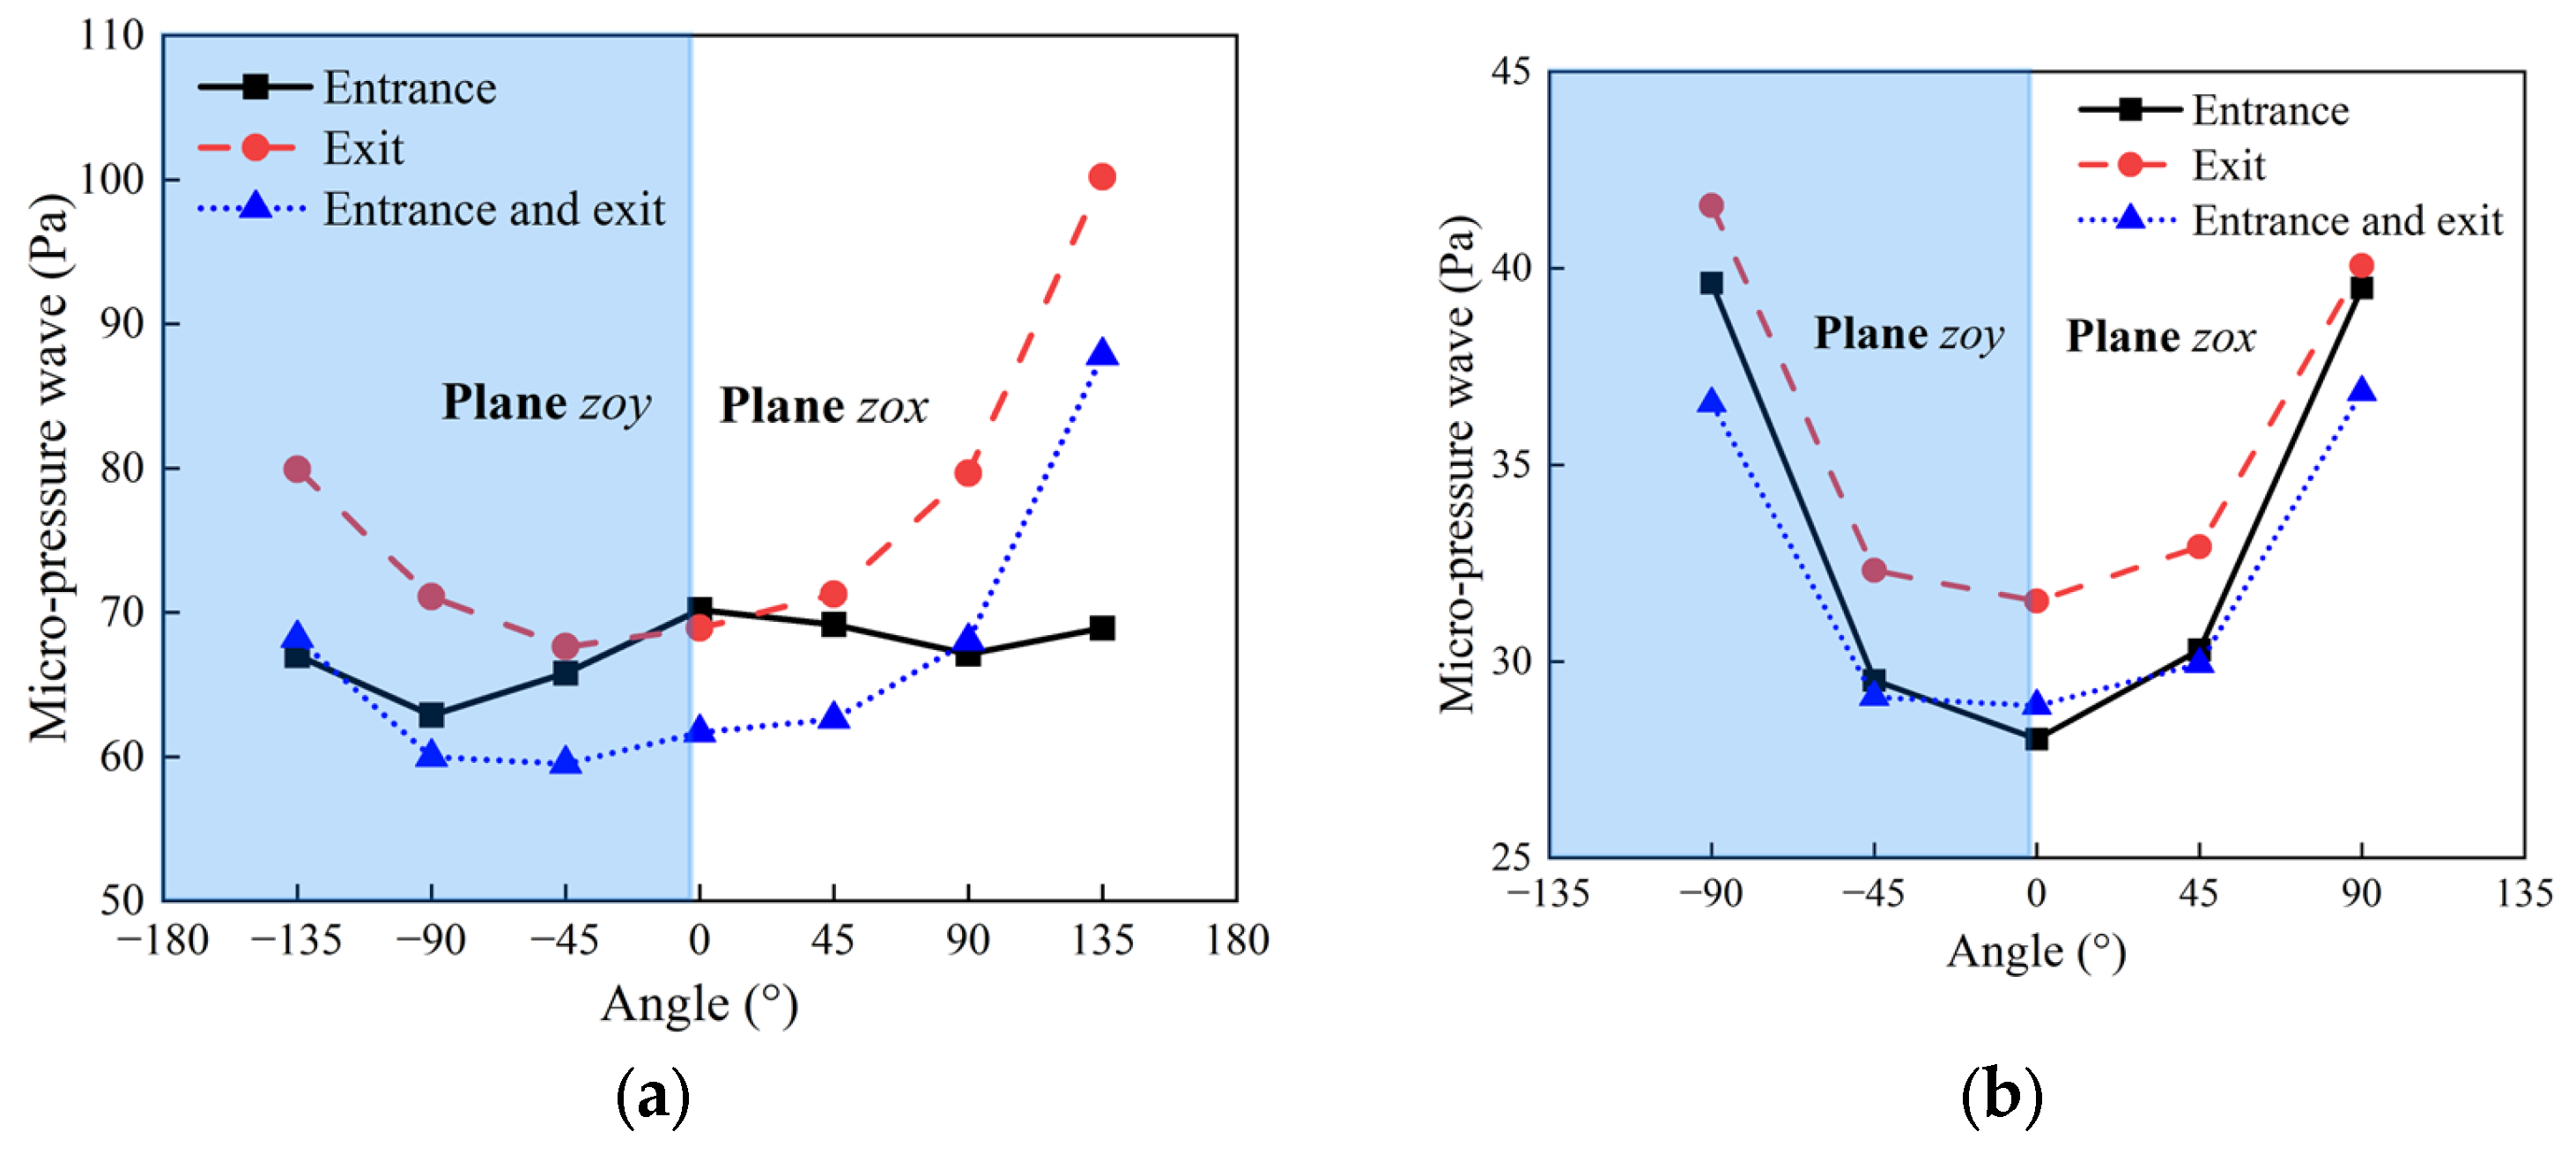
5.3. Analysis of the MPW Mitigation Effects by Entrance and Exit Hood

The entrance hood primarily mitigated the MPWs at the tunnel exit by extending the initial rise time of the compression wave, thereby reducing the maximum pressure gradient. This effectively alleviates the impact of MPWs at the tunnel exit. Designing the entrance hood is relatively simple, and that is why most of the previous research has been focusing on optimizing it. However, the aforementioned study indicated that the exit hood also has a certain mitigating effect on the MPWs. Therefore, this section will comprehensively compare the mitigation effects of the entrance and exit hood structures on the MPWs.
One study [32] investigated the optimization methods for multi-opening entrance hoods and obtained the following conclusions: the opening location and area of the hood are key optimization parameters influencing the amplitude of MPWs, and the relationship between the number of pressure gradient curve peaks M and the number of openings N is M = N + 1. When several peaks of the pressure gradient are close under the influence of the hood, it can be assumed that an optimally designed opening hood structure will have the highest level of performance (i.e., the smallest maximum value of MPW). In this section, we adopt the typical Japanese hoods from Ref. [32] as the research subject. By optimizing the opening position and opening area of the hood, we obtain the time–history curve of the compression wave at 50 m from the tunnel exit, as shown in Figure 14. After setting up the entry hood, the peak values of the first, second, and third waves of the pressure gradient are 12.2 kPa/s, 12.4 kPa/s, and 12.6 kPa/s, respectively. The three peak values of the pressure gradient can be approximately considered equal. Compared to the case without a hood, the reduction in the pressure gradient is the highest. Therefore, the arrangement of the entrance hood openings shown in Figure 15 is considered optimal. The hood shown in Figure 15 is placed at the tunnel entrance, exit, and entrance/exit, respectively. If hoods are only placed at the exit or entrance, equal-length hoods without openings will be installed at the other portal of the tunnel. The parameters for setting up the entrance/exit hood structures are presented in Table 7.
Figure 16 shows the influence of different entrance and exit hoods on the spatial distribution pattern of MPW amplitudes. When the radiation radius is 20 m, the implementation of entrance or exit hoods in the tunnel provided a certain degree of mitigation effect on the MPWs. However, various installation approaches of hoods have distinct impacts on the amplitude and spatial distribution of the MPWs. The greatest variation in the amplitude of the MPWs occurred when only an opening hood was set at the exit. The MPW amplitude was highest at measurement point S3, reaching 100.2 Pa. Compared to the case with only a single opening on the side of the hood (as described in Section 5.2), the MPW amplitude decreased by 13.7%. This indicates that increasing the number of openings in the exit hood can disperse the pressure relief area, effectively reducing the MPW amplitude near the openings of the hood structure. The difference in the distribution of MPW amplitudes is the smallest when only an opening hood structure is set at the entrance. This is because the entrance hood alleviates MPWs by reducing the pressure gradient of the compression wave without affecting the spatial distribution pattern of MPW amplitudes.
If only an opening hood is set at the tunnel entrance or exit, the MPW amplitudes for the two cases are relatively close when the observation azimuth angle ( α , β ) does not exceed 45°. This indicates that both cases have similar effects on mitigating MPWs within a certain range in front of the exit plane of the hood. However, when an opening hood is placed at the tunnel entrance, it can effectively reduce the pressure gradient of the compression wave generated by the train entering the tunnel. Meanwhile, setting a hood at the tunnel exit can increase the effective radiation solid angle of MPWs. In contrast, setting a hood without opening with equal cross-sections at the tunnel entrance does not reduce the pressure gradient. Only the opening hood set at the tunnel exit can increase the effective solid angle by effectively releasing some pressure in advance, which helps to achieve the mitigation effect on the MPWs. Therefore, the installation of a hood at the exit provides a higher efficiency in mitigating the effects of MPWs compared to the installation at the entrance. When hoods with openings are installed at both the tunnel entrance and exit, the MPW amplitudes in front of the exit plane of the hood are the lowest among the three cases. This suggests that the installation of hoods with openings at both entrance and exit provides the highest efficiency in mitigating the effects of MPWs. At measurement point S3, the MPW amplitude under the case of entrance and exit hoods still experiences an increase. However, compared to the case with only an opening hood at the exit, the MPW amplitude decreased by 12.3%.
When the radiation radius is 50 m, the spatial distribution pattern of MPW amplitudes is largely consistent with the previously mentioned results. However, the MPW amplitude for the case with an exit hood is slightly higher than the other two cases. In the case where only the exit hood is installed, the MPW amplitude at the F1 measurement point is 31.5 Pa. Compared to the conditions where only the entrance hood is installed and where both the entrance and exit hood are installed, the MPW amplitudes have increased by 11.1% and 8.4%, respectively. According to Equation (10), the maximum amplitude of the MPW is directly proportional to the maximum value of the pressure gradient. As a result, setting up entrance hoods in the tunnel can lead to effective mitigation of MPWs across varying radiation radii.

5.4. Design Methodology for Entrance and Exit Hood Structures

In previous studies on the design of entrance and exit hoods for tunnels, the typical approach has been to select optimization parameters based on the optimal conditions of entrance hoods [33,34,35]. Additionally, hoods are symmetrically positioned at the entrance and exit of the tunnel. However, the findings from the aforementioned research reveal that setting hoods with openings at the exit can effectively mitigate the impact of MPWs. Furthermore, the best mitigation results for MPWs are achieved when hoods are installed at both the entrance and exit. From the analysis results, it can be observed that past designs failed to consider the impact of exit hoods on mitigating MPWs, revealing flaws in their methodology. Therefore, in the subsequent design of hoods, comprehensive consideration will be taken on the influence of entrance and exit hoods on the MPWs, as well as the surrounding topography of tunnel exits.
Based on previous research findings, tunnel entrances utilize hoods to prolong the time required for compression waves to reach their peak, thus alleviating the impact of MPWs. However, the mitigation effect of entrance hoods is significantly influenced by factors such as cross-sectional area, opening area, opening location, and opening form. Under the combined influence of multiple factors, the relationship between pressure gradient and opening area is no longer purely linear. Additionally, existing research faces challenges in rapidly optimizing entrance hood parameters due to the influence of multiple variable factors [10]. Currently, artificial intelligence and deep learning algorithms have a unique advantage in addressing such complex nonlinear engineering problems [36,37]. Scholars have put forward various algorithmic approaches for optimizing complex parameters in engineering [38,39,40]. Additionally, some scholars have proposed that [41,42] using deep learning algorithms to solve fluid dynamics problems can enhance the computational efficiency of numerical simulations. However, there has been no systematic research on optimizing the parameters of high-speed railway tunnel entrance hoods using deep learning algorithms to date. In contrast, exit hoods release pressure in advance to reduce the pressure amplitude at the exit and expand the radiating area of the MPW, thereby increasing the effective radiation solid angle and consequently achieving the mitigation of MPWs. Furthermore, the key parameters influencing the amplitude and spatial distribution pattern of MPWs in exit hoods are the opening ratio and opening form, with relatively more singular controlling factors.
Hence, for single-track tunnels, an approach involving asymmetric entrance and exit hoods can be employed in the design process. When designing entrance hood structures, the tunnel’s internal pressure gradient should serve as a control criterion, and design cases with pressure gradient peaks that are relatively close to each other should be selected. For the exit hood, direct pressure release is achieved. Therefore, the total opening ratio should be increased while avoiding excessively large individual opening areas. Through the above design approaches, it is possible to effectively reduce the amplitude of MPWs in front of the exit plane and enhance the mitigation efficiency of the single-track tunnel hoods.
For double-track tunnels, adopting the aforementioned asymmetric hood has certain limitations. When trains operate in reverse, the exit hood’s opening ratio is relatively low, and this limits its effectiveness. On the other hand, having excessively large individual opening areas in the entrance hood can reduce the efficiency of alleviating the pressure gradient of the compression wave, thereby increasing the amplitude of the MPW. Therefore, in the design of hoods for double-track tunnels, it is advisable to arrange them symmetrically at the tunnel entrances and exits while increasing the overall opening ratio of the hoods to fully leverage the advantages of the exit hood in mitigating MPWs. Simultaneously, opting for a configuration with multiple smaller openings (e.g., the discrete window shown in Ref. [32]) and strategic positioning of the openings can mitigate the adverse effects of excessively large individual openings during reverse train travel. This approach enhances the efficiency of double-track tunnel hoods in alleviating MPWs. Furthermore, when selecting the opening form for hoods, reliance solely on traditional single-point assessment methods should be avoided. Instead, a comprehensive evaluation should be conducted, taking into account the MPW amplitudes at various locations in the tunnel exit area. Particularly, careful attention needs to be paid to the impact of MPWs on sensitive areas such as residential zones or critical facilities. This approach ensures precise control over the mitigation of MPWs.

6. Conclusions

This study investigates the impact of the exit hoods on the amplitude and spatial distribution of MPWs in high-speed railway tunnels, and the following conclusions are made:
(1)
The influence parameters of the exit opening hood are theoretically analyzed using the control volume method, and the results are validated through three-dimensional numerical simulation. The research findings indicate that the opening ratio is a key parameter influencing the mitigation effectiveness of the exit hood on the MPWs. The amplitude of MPWs shows an inverse proportionality relationship with the opening ratio. Setting up a hood with openings at the tunnel exit can reduce the pressure amplitude at the exit of the hood, increasing the effective radiation solid angle of the MPWs and consequently enhancing the mitigation effectiveness of the exit hood on the MPWs.
(2)
Different opening forms have a relatively minor impact on the pressure amplitude of MPWs in front of the hood exit plane. However, they do affect the spatial distribution of MPWs and the effective solid angle in the vicinity of the openings. Hence, when determining the opening form and placement of hoods, reliance solely on past single-point evaluation methods should be avoided. It is crucial to comprehensively consider the relative significance of various positions outside the tunnel, ensuring that the design of hoods maximally mitigates the impact on residents and critical facilities.
(3)
The installation of hoods at the entrance and exit of a tunnel significantly influences the mitigation of MPWs, with distinct mechanisms governing the alleviation effects of entrance and exit hoods. Compared to entrance hoods, exit hoods exhibit a more significant efficiency in mitigating the amplitude of MPWs within a certain range in front of the hood exit plane. When both the tunnel entrance and exit are equipped with opening hoods, the amplitude of MPWs is minimized, resulting in the highest efficiency in mitigating MPWs.
(4)
When conducting hood design, it is essential to consider the impact of entrance and exit hoods on the MPWs. For single-track tunnels, opening hoods can be asymmetrically placed at the tunnel entrance and exit. The entrance hood should be designed using cases that ensure the proximity of pressure gradient peaks. For the exit hood, it is important to increase the total opening ratio to enhance its efficiency in mitigating MPWs.
(5)
For the design of opening hoods in double-track tunnels, a symmetrical arrangement should be adopted at both the entrance and exit while simultaneously increasing the overall opening area. Meanwhile, the hoods should adopt a design with small, numerous openings, and the positioning of these openings should be carefully planned. This strategy aims to prevent any adverse effects on the mitigation of MPWs when trains operate in both directions.
The tunnel exit hood structure has a certain alleviating effect on the MPWs. However, current research has only explored the alleviating mechanism of opening hoods on the MPWs at tunnel exits. Therefore, investigating the alleviating effects of different forms of exit hoods on the MPWs and assessing the impact of exit hoods on the pressure comfort of trains inside the tunnel will be the focus of future research.

Author Contributions

H.S. conceived and designed the analysis, collected and analyzed data, and wrote and revised the paper; Y.W. conceived and designed the analysis, provided funding, and revised the paper; X.J. provided guidance on the numerical simulation software (Fluent 15.0); H.L. wrote and edited the paper and provided supervision; Y.L. conducted verification and formal analysis. All authors have read and agreed to the published version of the manuscript.

Funding

This research was funded by the by the Technological Key Research and Development Program of China Railway Corporation [P2021G053] and National Natural Science Foundation of China, grant numbers [51778539]. The authors are grateful to all the study participants. The funder had no role in the experimental design, model establishment, data analysis, manuscript writing, or decision to submit this article for publication.

Institutional Review Board Statement

Not applicable.

Informed Consent Statement

Not applicable.

Data Availability Statement

Not applicable.

Acknowledgments

The authors thank the anonymous reviewers who provided valuable suggestions that improved the manuscript. We thank Xiaoxiao Xu for language assistance and valuable suggestions in the manuscript.

Conflicts of Interest

The authors declare no conflict of interest.

References

  1. Gawthorpe, R.G. Aerodynamics of trains in tunnels. Railw. Eng. Int. 1978, 4, 41–47. [Google Scholar]
  2. Raghunathan, R.S.; Kim, H.D.; Setoguchi, T. Aerodynamics of high-speed railway train. Prog. Aerosp. Sci. 2002, 38, 469–514. [Google Scholar] [CrossRef]
  3. Duan, F.C.; Song, Y.; Gao, S.B.; Liu, Y.H.; Chu, W.P.; Lu, X.B.; Liu, Z.G. Study on aerodynamic instability and galloping response of rail overhead contact line based on wind tunnel tests. IEEE Trans. Veh. Technol. 2023, 72, 7211–7220. [Google Scholar] [CrossRef]
  4. Song, Y.; Wang, Z.W.; Liu, Z.G.; Wang, R.C. A spatial coupling model to study dynamic performance of pantograph-catenary with vehicle-track excitation. Mech. Syst. Signal Process. 2021, 151, 107336. [Google Scholar] [CrossRef]
  5. Zhang, J.; Wang, Y.G.; Han, S.; Wang, F.; Gao, G.G. A novel arch lattice-shell of enlarged cross-section hoods for micro-pressure wave mitigation at exit of maglev tunnels. Tunn. Undergr. Space Technol. 2023, 132, 104859. [Google Scholar] [CrossRef]
  6. Zhang, L.; Kerstin, T.; Norbert, S.; Liu, H. Influence of the geometry of equal-transect oblique tunnel portal on compression wave and micro-pressure wave generated by high-speed trains entering tunnels. J. Wind. Eng. Ind. Aerodyn. 2018, 178, 1–17. [Google Scholar] [CrossRef]
  7. Howe, M.S.; Iida, M.; Fukuda, T. Influence of an unvented tunnel entrance hood on the compression wave generated by a high-speed train. J. Fluids Struct. 2003, 17, 833–853. [Google Scholar] [CrossRef]
  8. Howe, M.S. Design of a tunnel-entrance hood with multiple windows and variable cross-section. J. Fluids Struct. 2003, 17, 1111–1121. [Google Scholar] [CrossRef]
  9. Wang, Y.X.; Chang, Q.L.; Ren, W.Q.; Zhang, L.X. Seam opening tunnel large Eddy structure aerodynamic characteristics research. J. Railw. Eng. Soc. 2018, 15, 17–23. (In Chinese) [Google Scholar]
  10. Xiang, X.T.; Xue, L.P.; Wang, B.L.; Wang, Z. Mechanism and capability of ventilation openings for alleviating micro-pressure waves emitted from high-speed railway tunnels. Build Env. 2018, 132, 245–254. [Google Scholar] [CrossRef]
  11. Wang, H.L.; Alan, E.V.; Dubravka, P. Pressure radiation from a perforated duct exit region. J. Sound Vib. 2015, 351, 29–42. [Google Scholar] [CrossRef]
  12. Wang, H.L.; Alan, E.V.; Dubravka, P. Perforated exit regions for the reduction of micro-pressure waves from tunnels. J. Wind. Eng. Ind. Aerodyn. 2015, 146, 139–149. [Google Scholar] [CrossRef]
  13. Fukuda, T.; Saito, S.; Iida, M. Countermeasure Against the Micro-Pressure Wave by a Shelter link Neighboring Tunnel. In Proceedings of the 15th International Symposium on Aerodynamics, Ventilation and Fire in Tunnels, Barcelona, Spain, 18–20 September 2013. [Google Scholar]
  14. Satio, S.; Miyachi, T.; Iida, M. Countermeasure for reducing micro-pressure wave emitted from railway tunnel by installing hood at the exit of tunnel. Q. Rep. RTRI 2013, 54, 231–236. [Google Scholar] [CrossRef]
  15. Miyachi, T. Acoustic model of micro-pressure wave emission from a high-speed train tunnel. J. Sound Vib. 2017, 391, 127–152. [Google Scholar] [CrossRef]
  16. Zhang, G.; Kim, D.H.; Kim, H.D. Numerical studies on the radiation of train-tunnel impulse waves. Tunn. Undergr. Space Technol. 2018, 80, 211–221. [Google Scholar] [CrossRef]
  17. Shen, W.D.; Tong, J.G. Engineering Thermodynamics, 5th ed.; Higher Education Press: Beijing, China, 2016; pp. 46–49. (In Chinese) [Google Scholar]
  18. Wang, H.L. Compression Wavefront Evolution During the Propagation of Compression Wave and Micro-Pressure Wave. Ph.D. Thesis, Southwest Jiaotong University, Chengdu, China, 2016. (In Chinese). [Google Scholar]
  19. Li, F.L.; Lou, J.J.; Wang, L.; Wang, D.K.; Gao, L.P. Wave effects of high-speed trains passing through different tunnel lining types. J. Wind. Eng. Ind. Aerodyn. 2022, 224, 104971. [Google Scholar] [CrossRef]
  20. Li, W.H.; Liu, T.H.; Huo, X.S.; Chen, Z.W.; Guo, Z.J.; Li, L. Influence of the enlarged portal length on pressure waves in railway tunnels with cross-section expansion. J. Wind. Eng. Ind. Aerodyn. 2019, 190, 10–22. [Google Scholar] [CrossRef]
  21. Takanobu, O.; Kozo, F. Numerical investigation of three-dimensional compressible flows induced by a train moving into a tunnel. Comput. Fluids 1997, 26, 565–585. [Google Scholar] [CrossRef]
  22. Sahan, H.W.; Rupert, C.S.; Stuart, E.N.; John, E.C. Aeroacoustic noise prediction for wind turbines using large eddy simulation. J. Wind. Eng. Ind. Aerodyn. 2015, 145, 17–29. [Google Scholar] [CrossRef]
  23. Xiao, Y.G.; Qun, Y.; Sun, L.; Shi, Y. Longitudinal type-line optimization of high-speed train for low aerodynamic noise. J. Cent. South Univ. 2014, 21, 2494–2500. [Google Scholar] [CrossRef]
  24. Wang, Y.X.; Ren, W.Q.; Luo, Y. Analysis of Effect of Cross Adit on Train-Tunnel Aerodynamic Multiple Peak Characteristics. J. Southwest Jiaotong Univ. 2018, 53, 428–433. (In Chinese) [Google Scholar]
  25. Niu, J.Q.; Zhou, D.; Liang, X.F.; Liu, T.H.; Liu, S. Numerical study on the aerodynamic pressure of a metro train running between two adjacent platforms. Tunn. Undergr. Space Technol. 2017, 65, 187–199. [Google Scholar] [CrossRef]
  26. Li, F.L.; Luo, J.J.; Wang, L.; Guo, D.L.; Gao, L.P. Analysis of aerodynamic effects and load spectrum characteristics in high-speed railway tunnels. J. Wind. Eng. Ind. Aerodyn. 2021, 216, 104729. [Google Scholar] [CrossRef]
  27. Luo, J.J.; Wang, L.; Shang, S.Y.; Li, F.L.; Guo, D.L.; Gao, L.P.; Wang, D.K. Study of unsteady aerodynamic performance of a high-speed train entering a double-track tunnel under crosswind conditions. J Fluids Struct 2023, 118, 103836. [Google Scholar] [CrossRef]
  28. Wang, T.T.; Hu, C.; Gong, Y.F.; Yang, M.Z.; Xiong, X.H.; Zong, J.L.; Lu, Y.B. Mitigation of micro-pressure wave at 400 km/h railway tunnel exit by oblique enlarged tunnel-hood. Acta Aerodyn. 2021, 39, 151–161. (In Chinese) [Google Scholar]
  29. Fukuda, T.; Ozawa, S.; Iida, M.; Takasaki, T. Distortion of compression wave propagating through very long tunnel with slab tracks. JSME Int. J. 2006, 49, 1156–1164. [Google Scholar] [CrossRef]
  30. Miyachi, T. Theoretical model for micro-pressure wave emission considering the effect of topography around the tunnel portal. Q. Rep. RTRI 2011, 52, 117–122. [Google Scholar] [CrossRef]
  31. Miyachi, T.; Fukuda, T. Experimental Investigation of the effect of topography around the tunnel portal on Micro-pressure Waves. Q. Rep. RTRI 2014, 55, 235–240. [Google Scholar] [CrossRef]
  32. Miyachi, T.; Fukuda, T. Model experiments on area optimization of multiple openings of tunnel hoods to reduce micro-pressure waves. Tunn. Undergr. Space Technol. 2021, 115, 103996. [Google Scholar] [CrossRef]
  33. Yang, W.C.; Li, G.Z.; He, H.; Liu, Y.K.; Deng, E.; Luo, L.S. Optimization of ventilation window of combined buffer structure in 400 km/h high-speed railway tunnel. J. Railw. Eng. Soc. 2022. accepted (In Chinese) [Google Scholar] [CrossRef]
  34. Mei, Y.G.; Li, J.H.; Hu, X.; Du, J.T. Propagation characteristics of initial compression wave in cave and portal micro-pressure waves characteristics when 600 km·h−1 maglev train entering tunnels. J. Traffic Transp. Eng. 2021, 21, 150–162. (In Chinese) [Google Scholar]
  35. Wu, J.; Shi, X.M.; Wan, X.Y. Study on intensification and mitigation methods of micro pressure wave of double track tunnel in 300 to 350 km/h high speed railway. China Civ. Eng. J. 2017, 50, 209–214. (In Chinese) [Google Scholar]
  36. Zhang, Z.M.; Luca, G.D.; Archambault, B.; Chavez, J.M.; Rice, B. Traffic Dataset and Dynamic Routing Algorithm in Traffic Simulation. J. Artif. Intell. Technol. 2022, 2, 111–122. [Google Scholar] [CrossRef]
  37. Du, H.M.; Du, S.G.; Li, W. Probabilistic time series forecasting with deep non-linear state space models. CAAI TRIT 2023, 8, 3–13. [Google Scholar] [CrossRef]
  38. Chen, J.J.; Yu, S.H.; Wei, W.J.; Ma, Y. Matrix-based method for solving decision domains of neighbourhood multigranulation decision-theoretic rough sets. CAAI TRIT 2022, 7, 313–327. [Google Scholar] [CrossRef]
  39. Hsiao, I.H.; Chung, C.Y. AI-infused semantic model to enrich and expand programming question generation. J. Artif. Intell. Technol. 2022, 2, 47–54. [Google Scholar] [CrossRef]
  40. Zhao, H.M.; Ma, L.W. Several rough set models in quotient space. CAAI TRIT 2022, 7, 69–80. [Google Scholar] [CrossRef]
  41. Kutz, J.N. Deep learning in fluid dynamics. J. Fluid Mech. 2017, 814, 1–4. [Google Scholar] [CrossRef]
  42. Kjetil, O.L.; Siddhartha, M.; Deep, R. Deep learning observables in computational fluid dynamics. J. Comput. Phys. 2020, 410, 109339. [Google Scholar] [CrossRef]
Figure 1. Schematic diagram of control volume method analysis of tunnel exit hood.
Applsci 13 11365 g001
Figure 2. Geometric model of train and tunnel: (a) high-speed railway tunnel; (b) front view of the train; and (c) side view of the train.
Applsci 13 11365 g002
Figure 3. Grid model of train and tunnel hood: (a) train head model and (b) mesh model of tunnel hood.
Applsci 13 11365 g003
Figure 4. Geometric dimensions and boundary conditions.
Applsci 13 11365 g004
Figure 5. Location of monitoring points: (a) arrangement of monitoring points on the zox plane; (b) arrangement of monitoring points on the zoy plane; and (c) schematic diagram of the radiation of MPW.
Applsci 13 11365 g005
Figure 6. Comparison of calculation results: (a) field measurement—numerical simulation comparison (compression waves); and (b) formula prediction—numerical simulation comparison (micro-pressure waves).
Applsci 13 11365 g006
Figure 7. Exit hood structure opening layout diagram.
Applsci 13 11365 g007
Figure 8. Time–history curve of micro-pressure waves at F1 (r = 20 m).
Applsci 13 11365 g008
Figure 9. Fitting curves between MPW amplitudes and the opening ratio of the hood.
Applsci 13 11365 g009
Figure 10. Comparison of the pressure contours at different times: (a) t = 2.2 s in Case 1; (b) t = 2.2 s in Case 2; (c) t = 2.3 s in Case 1; (d) t = 2.3 s in Case 2; (e) t = 2.4 s in Case 1; (f) t = 2.4 s in Case 2; (g) t = 2.5 s in Case 1; (h) t = 2.5 s in Case 2; (i) t = 2.6 s in Case 1; and (j) t = 2.6 s in Case 2. (Unit: Pa).
Applsci 13 11365 g010
Figure 11. Micro-pressure wave amplitudes at measurement points under different opening ratios: (a) radiation radius r = 20 m; and (b) radiation radius r = 50 m.
Applsci 13 11365 g011
Figure 12. Hood structures with different opening forms: (a) top opening hood; (b) side opening hood; and (c) seam opening hood.
Applsci 13 11365 g012
Figure 13. Micro-pressure wave amplitudes at monitoring points under different opening forms: (a) Radiation radius r = 20 m; (b) Radiation radius r = 50 m.
Applsci 13 11365 g013
Figure 14. Time–history curves of compression waves under the influence of entrance hood: (a) initial compression wave; and (b) pressure gradient.
Applsci 13 11365 g014
Figure 15. Optimal conditions of entrance hood structure.
Applsci 13 11365 g015
Figure 16. Micro-pressure wave amplitude at monitoring points affected by the entrance and exit hood: (a) radiation radius r = 20 m; and (b) radiation radius r = 50 m.
Applsci 13 11365 g016
Table 1. Numerical simulation parameters of tunnel hood.
Hood ParametersCase 1Case 2Case 3Case 4
X (m)7.51522.5
Total length of the hood (m)212128.536
Opening ratio of the hood (%)306090
Table 2. Comparison of micro-pressure waves at monitoring points F1.
Simulation CasePmpw (Pa)Reduction Ratio (%)
r = 20r = 50r = 20r = 50
Case 189.533.0
Case 268.931.823.03.6
Case 355.628.337.814.2
Case 445.924.648.725.5
Table 3. Correction coefficients of effective radiation solid angle under different opening ratios (r = 20 m).
Azimuth Angle (°)The Opening Ratio of Hood (%)Observation Plane
0306090
1351.00.60.60.7Top
(Plane zoy)
901.31.11.31.4
451.11.51.82.1
01.01.62.02.5
451.11.51.82.1Side
(Plane zox)
901.21.11.21.4
1350.90.80.80.9
Table 4. Correction coefficients of effective radiation solid angle under different opening ratios (r = 50 m).
Azimuth Angle (°)The Opening Ratio of Hood (%)Observation Plane
0306090
900.80.80.80.9Top
(Plane zoy)
451.21.21.31.4
01.21.31.41.6
451.21.11.21.4Side
(Plane zox)
900.80.80.80.9
Table 5. Correction coefficients of effective radiation solid angle under different opening forms (r = 20 m).
Azimuth Angle (°)The Opening Form of the Tunnel HoodObservation Plane
withoutTopSideSeam
1351.00.60.80.7Top
(Plane zoy)
901.31.11.21.2
451.11.51.61.6
01.01.61.71.7
451.11.51.51.5Side
(Plane zox)
901.21.11.11.1
1350.90.80.60.7
Table 6. Correction coefficients of effective radiation solid angle under different opening forms (r = 50 m).
Azimuth Angle (°)The Opening Form of the Tunnel HoodObservation Plane
withoutTopSideSeam
900.80.80.80.8Top
(Plane zoy)
451.21.21.21.2
01.21.31.31.3
451.21.11.21.2Side
(Plane zox)
900.80.80.80.8
Table 7. The setting of entrance and exit hood structure opening ratio.
Hood ParametersEntranceExitEntrance and Exit
Opening ratio of entrance hood (%)3030
Opening ratio of exit hood (%)3030
Length of the hoods (m)212121
Disclaimer/Publisher’s Note: The statements, opinions and data contained in all publications are solely those of the individual author(s) and contributor(s) and not of MDPI and/or the editor(s). MDPI and/or the editor(s) disclaim responsibility for any injury to people or property resulting from any ideas, methods, instructions or products referred to in the content.

