Article

Investigation of Microseismic Monitoring of and Precursor Information on Roof Collapse

1
School of Resources and Safety Engineering, Central South University, Changsha 410083, China
2
BGRIMM Technology Group, Beijing 100160, China
3
National Centre for International Research on Green Metal Mining, Beijing 102628, China
*
Author to whom correspondence should be addressed.
Appl. Sci. 2023, 13(20), 11307; https://doi.org/10.3390/app132011307
Submission received: 19 September 2023 / Revised: 11 October 2023 / Accepted: 13 October 2023 / Published: 14 October 2023

Abstract

:
Understanding the characteristics and evolution of crack propagation in rock masses is crucial for evaluating their stability. By applying clustering theory to analyze recorded microseismic events, we differentiate the development positions of individual cracks amidst multiple crack formations. Three distinct crack cluster distribution patterns are identified, allowing for the evaluation of regional stability through microseismic event density and ellipsoidal model parameters. The process of crack propagation involves independent development at nucleation positions, mutual influence between adjacent locations, and subsequent crack growth and propagation. Additionally, we examine crack evolution prior to roof collapse and establish a connectivity model between surface and goaf roof cracks. When microseismic events are identified as developing along a plane, it indicates a higher risk of damage in that area. Through the analysis of crack propagation location and angle, our study provides a theoretical foundation for predicting crack direction. Notably, our model’s findings align with onsite observations, demonstrating its practical effectiveness. The results of this research offer valuable insights for collapse prediction and early warning systems for mine roofs, contributing to advancements in mining safety and operations.

1. Introduction

In recent years, the role of microseismic (MS) monitoring in mining and tunnel stability has been extensively studied [1,2,3,4,5]. MS monitoring involves the monitoring of vibration signals generated by rock mass fractures and the calculation of parameters such as the time, spatial location, and source strength of rock mass fractures. Quantitative seismology and statistical seismology research methods are used to analyze the mechanical information of MS events, so as to reflect the stress distribution and deformation of a rock mass in the monitoring area. Successful monitoring of stability and rock burst precursor information by recording induced MS events has been documented [6,7].
When a rock mass is disturbed by excavation unloading, microcracks are generated inside the rock mass, and the stored elastic energy is released in the form of stress waves. Progress has been made in research on the evolution, mechanism, and precursors of rock burst in mines based on MS monitoring [8,9,10,11,12,13]. The spatiotemporal distribution, number of events, and energy of MS activity are often used to estimate the evolutionary characteristics of rock fracture [14,15,16]. Srinivasan et al. [17] established a linear empirical relationship between the seismic energy released by rock burst and the gross tonnage of mined ore, the total number of rock bursts, and seismic events. Cai et al. [18] conducted quantitative research on the damage degree of the crack density calculated from the crack length and the damage degree of the crack density distribution calculated from MS event monitoring data and proposed a method to determine the regional damage state through crack distribution with MS monitoring events as input. Xue et al. [19] applied three-dimensional MS monitoring technology for real-time monitoring of microcracks in tunnel-surrounding rock. The combination of apparent stress, apparent volume, and main frequency value can better characterize the different damage characteristics of the surrounding rock in real-time.
Accurate monitoring and prediction of the rock crack propagation process are of great significance for safe and efficient production in mining and other industries. In general, the fundamental cause of MS behavior is due to tensile fracture, shear failure, or composite failure at the crack tip [20]. Research methods such as the moment tensor method [21,22,23], collapsing method, and cluster analysis [24,25,26] have been successfully applied to MS events. In various stages of strength tests, a series of MS events related to space and time are accumulated into clusters. Clustering may indicate the formation of macroscopic crack planes. Previous investigations have shown that the statistical distribution of time intervals between consecutive MS events is presented in the exponential Poissonian form [27,28].
Although relevant unsupervised machine learning methods have been applied to MS events, there is relatively limited research directly focused on crack identification and localization. This has made it challenging to conduct quantitative studies of the morphology and expansion of individual cracks and has hindered the prediction of crack propagation direction. Machine learning has the capability to process extensive sensor data, enabling the prediction of trends in crack development within materials and structures. This is achieved through the analysis of both historical data and real-time monitoring results. Moreover, machine learning models can be instrumental in uncovering new correlations and patterns when analyzing large datasets associated with crack detection. By monitoring the form and behavior of cracks, these models can also aid in forecasting both the speed and direction of crack propagation.
This article presents a novel approach focused on understanding the development and expansion of roof cracks in the Yakes Mine in Xinjiang, China. The study centers on the deployment of a real-time microseismic (MS) monitoring system to track and analyze microcracks in the mining area. The primary objectives are twofold: first, to investigate the spatiotemporal clustering distribution characteristics of these microcracks and second, to gain insights into the formation and damage status of these cracks. What sets this research apart is its comprehensive three-dimensional morphological analysis, which delves into the spatiotemporal evolution laws governing roof collapse within the goaf area. By conducting this analysis, we uncover the intricate process of crack formation and expansion, providing valuable contributions to the understanding of how cracks develop within a mining environment.

2. Cluster Theoretical Bases

Cluster analysis is an unsupervised machine learning task. Different from supervised learning, clustering algorithms only interpret input data and find natural groups or clusters in the feature space. Clustering is the process of classifying data into different classes or clusters, where objects within the same cluster have significant similarities. Cluster analysis can be applied to the data preprocessing process. For multidimensional data with complex structures, clustering analysis can be used to aggregate the data and standardize data with complex structures.
The Gaussian mixture model (GMM) is selected as the clustering model in 3D space. GMM is a probabilistic clustering model commonly used in unsupervised learning tasks. Each Gaussian distribution represents a cluster in the data, and GMM estimates the parameters of these distributions to assign data points to the cluster. GMM assigns probability or likelihood to each data point in each cluster. This probability represents the degree of correlation between data points and clusters.
The probability distribution of the Gaussian mixture model can be expressed as follows:
P ( x ) = k = 1 K α k ϕ ( x ; μ k , Σ k )
where K is the number of models, x is the column vector of 3D spatial coordinates, µ is the model expectation, Σ is the model variance, and ϕ ( x ; μ k , Σ k ) is the kth component in the mixed model representing the probability distribution of the model.
αk represents the probability of the model and meets the following two conditions:
k = 1 K α k = 1
0 α k 1
First, define the number of K values, and then randomly initialize a set of model parameters for each model k, set each model as a random value, an identity matrix, and ensure that the initial probability of each model is equal. Then, calculate the posterior probability generated by each model K based on the current parameters.
γ i k = α k ϕ ( x i ; μ k , Σ k ) Σ k = 1 K α i ϕ ( x i ; μ k , Σ k )
Then, re-estimate the parameters based on the current γ. The iterative calculation is completed when convergence occurs.
GMM can be used to model data as a combination of multiple Gaussian distributions [29,30]. This proves particularly valuable when dealing with microseismic monitoring signals that may exhibit complex patterns, which may not be well-suited for other clustering methods. GMM is especially advantageous when working with uncertain or noisy microseismic data, as it allows for a more nuanced representation of cluster assignments. In the context of microseismic crack identification, where cracks may overlap, GMM excels in handling overlapping clusters, a challenge that some other methods struggle with. Furthermore, GMM’s scalability to large datasets makes it well-suited for processing extensive collections of microseismic data gathered over time. While other methods may shine in terms of simplicity, noise handling, or the ability to identify clusters with non-Gaussian shapes, the strength of GMM lies in its flexibility and probabilistic modeling.

3. Engineering Situation and MS System

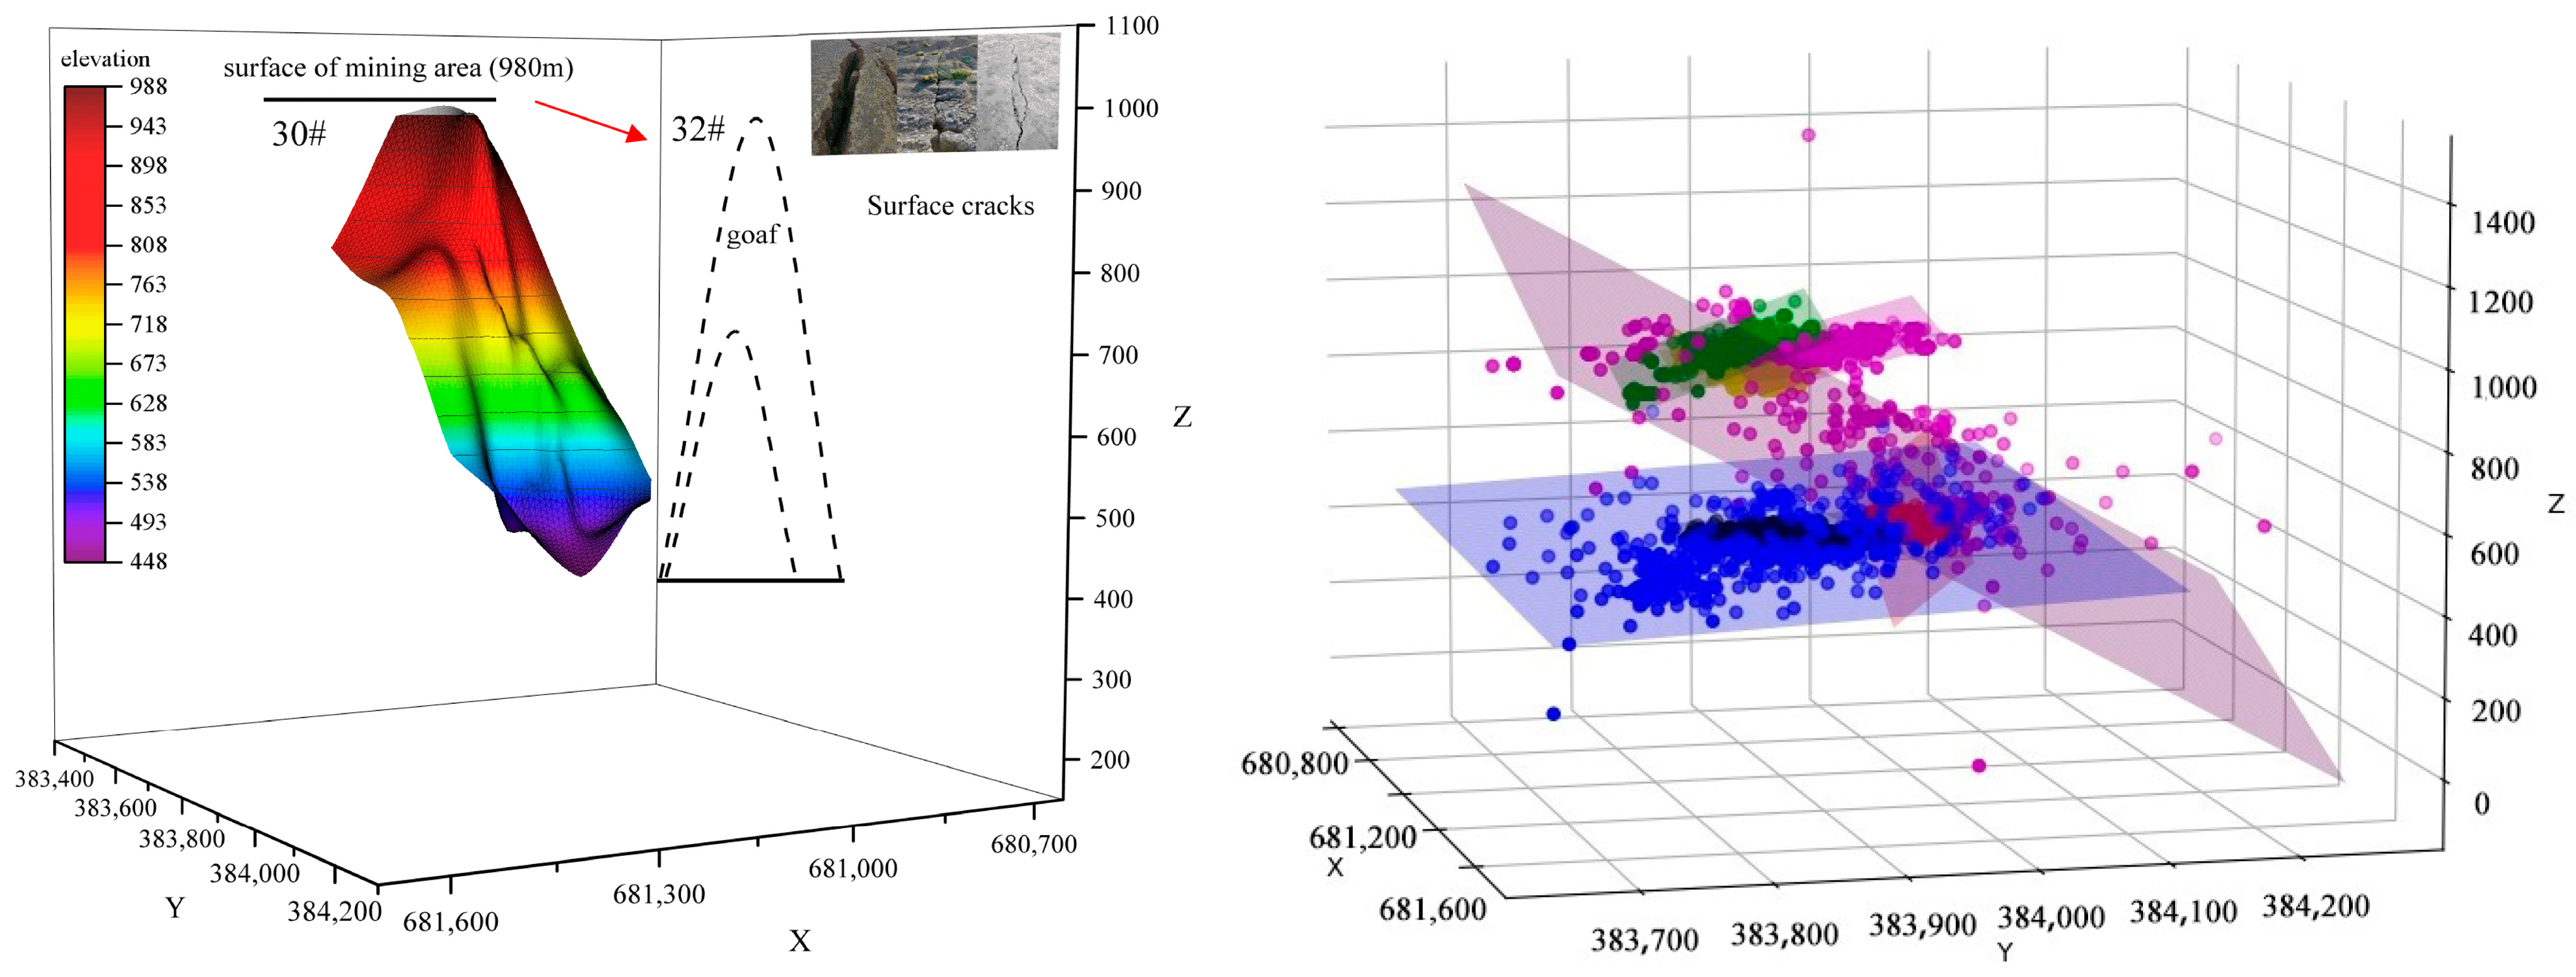
3.1. Geological Conditions

The geological structure of the Yakes mining area is relatively uncomplicated, with well-preserved and stable top and bottom slate layers surrounding the ore body. Within the ore-bearing rocks, there is a diverse range of rock types, primarily comprising dunite, dunite peridotite, and peridotite. Occasionally, there are occurrences of pure peridotite and pyroxenite. The ore body in this region primarily contains copper and nickel. The primary mining method employed is sublevel caving, with the shrinkage stoping method utilized for the thinner ore bodies situated at the edges and corners of the main ore body. The ore body within the designed mining range is buried within the elevation range of 980–277 m, and the design adopts underground mining and vertical shaft development methods. The designed production scale is 1.32 million tons/year, and mining operations are currently being carried out in two layers of the ore body: 430 m and 410 m. During the mining process of the 30# ore body, large gaps between the upper goaf and the top of the goaf are easily formed, resulting in a thin column between the goaf and the 32# ore body, which may intersect. At the same time, the surrounding rock of the bottom structure is significantly broken, has severe mud deposition, and has developed joint surfaces, and local areas have already exhibited slope fragmentation and roof fall.

3.2. MS System Profile

Based on the analysis of the occurrence and mining situation of the 30# ore body, there is a risk of large-scale roof caving in the overlying goaf and rock mass instability caused by goaf penetration in the mining area. In response to these hidden dangers, this plan establishes a 24-channel microseismic monitoring system produced by the Institute of Mine Seismology (IMS) and a 16-channel high-accuracy MS positioning enhancement system to conduct real-time online monitoring of the collapse mining process. Within the monitoring range, there are no apparent fault or joint structures at depths above 530 m.
This plan involves constructing an 8-channel IMS monitoring system (Figure 1e) on the surface and deploying an 8-channel IMS system (Figure 1c) in the middle section at 530 m. The 8-channel IMS monitoring system (Figure 1d) is installed in the middle section at 450 m to form a spatial envelope for comprehensive monitoring of the collapse mining process. Through network analysis, it is shown that under ideal conditions, the positioning error of the IMS monitoring system within the monitoring range is about 10 m, which can basically satisfy the requirements of the monitoring area.
In order to achieve higher measurement accuracy, this plan additionally adopts a 16-channel high-precision MS positioning enhancement system to improve positioning accuracy and reduce positioning errors (Figure 1a). The high-accuracy MS positioning enhancement system is mainly installed in the middle section at 530 m and 450 m to assist in improving the positioning accuracy of the IMS monitoring system. The installation position is the same as that for the IMS monitoring system, i.e., two sensors are installed in the same borehole. Additionally, with the gradual expansion of production into deeper areas, MS sensors at the surface, 530 m, and 450 m can enable the monitoring network to converge to disaster areas. The sensitivity of microseismic systems to earthquake magnitudes is shown in Figure 1b.

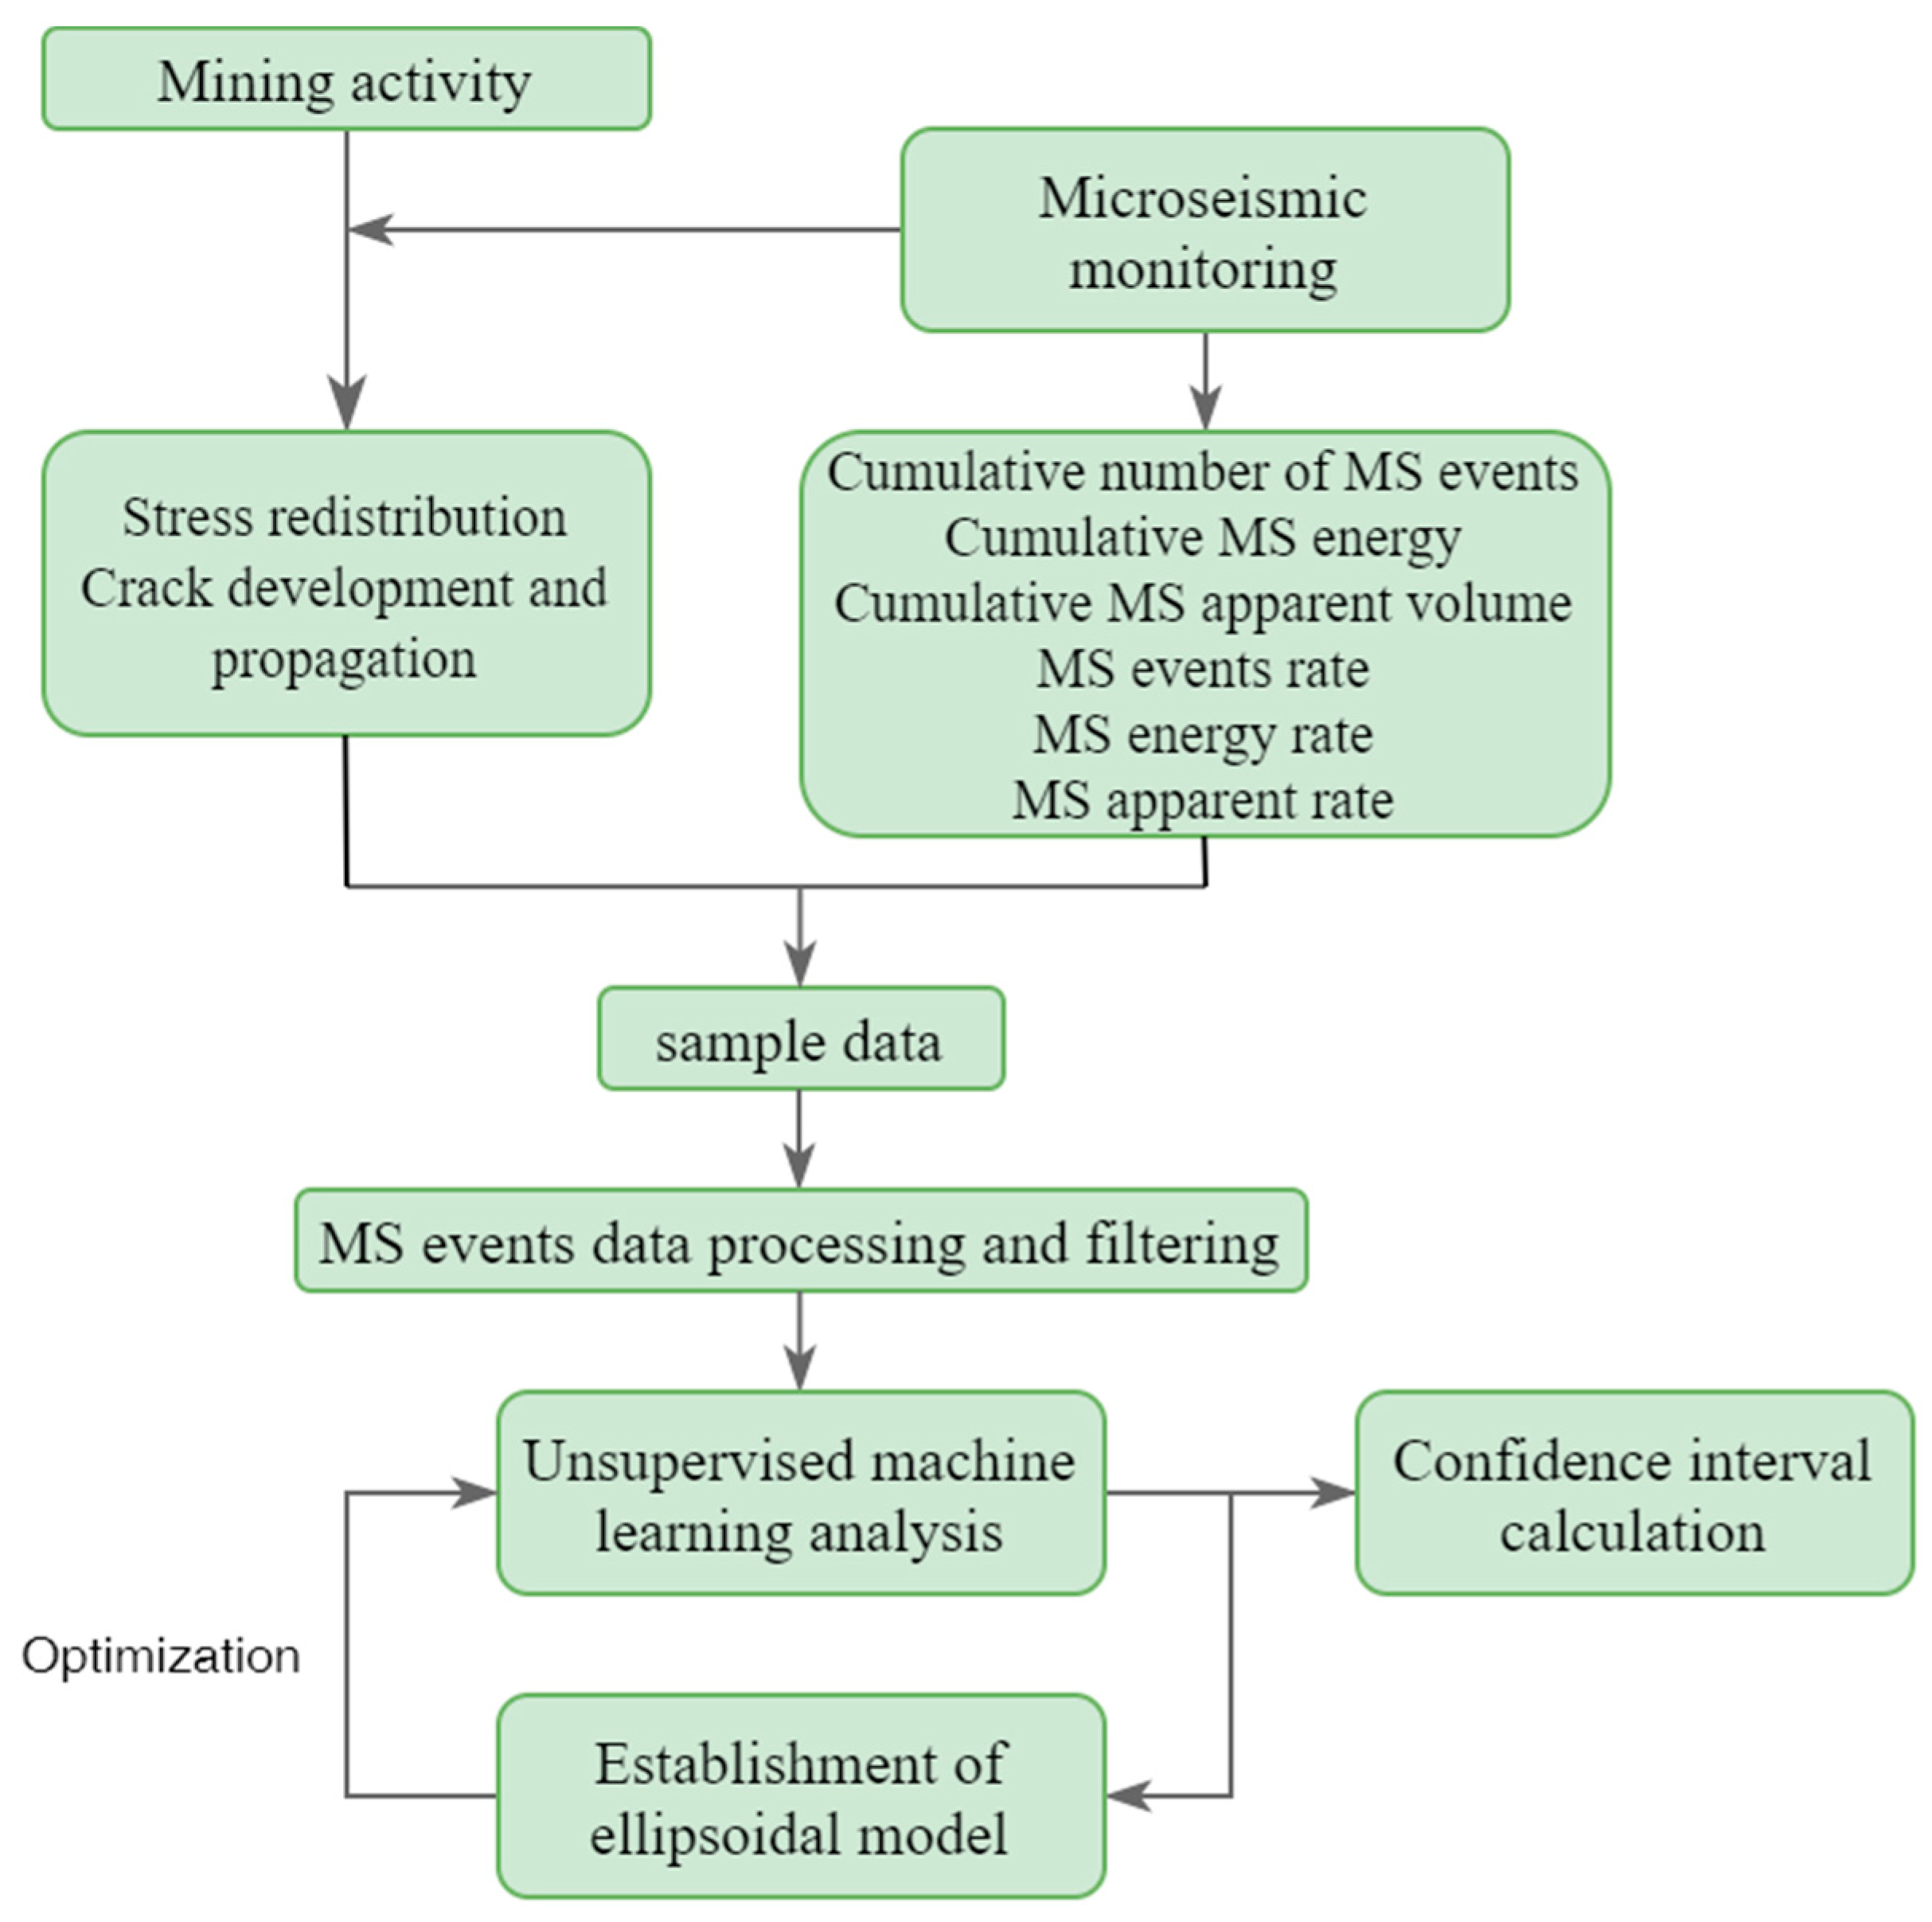
4. Data Analysis and Discussions

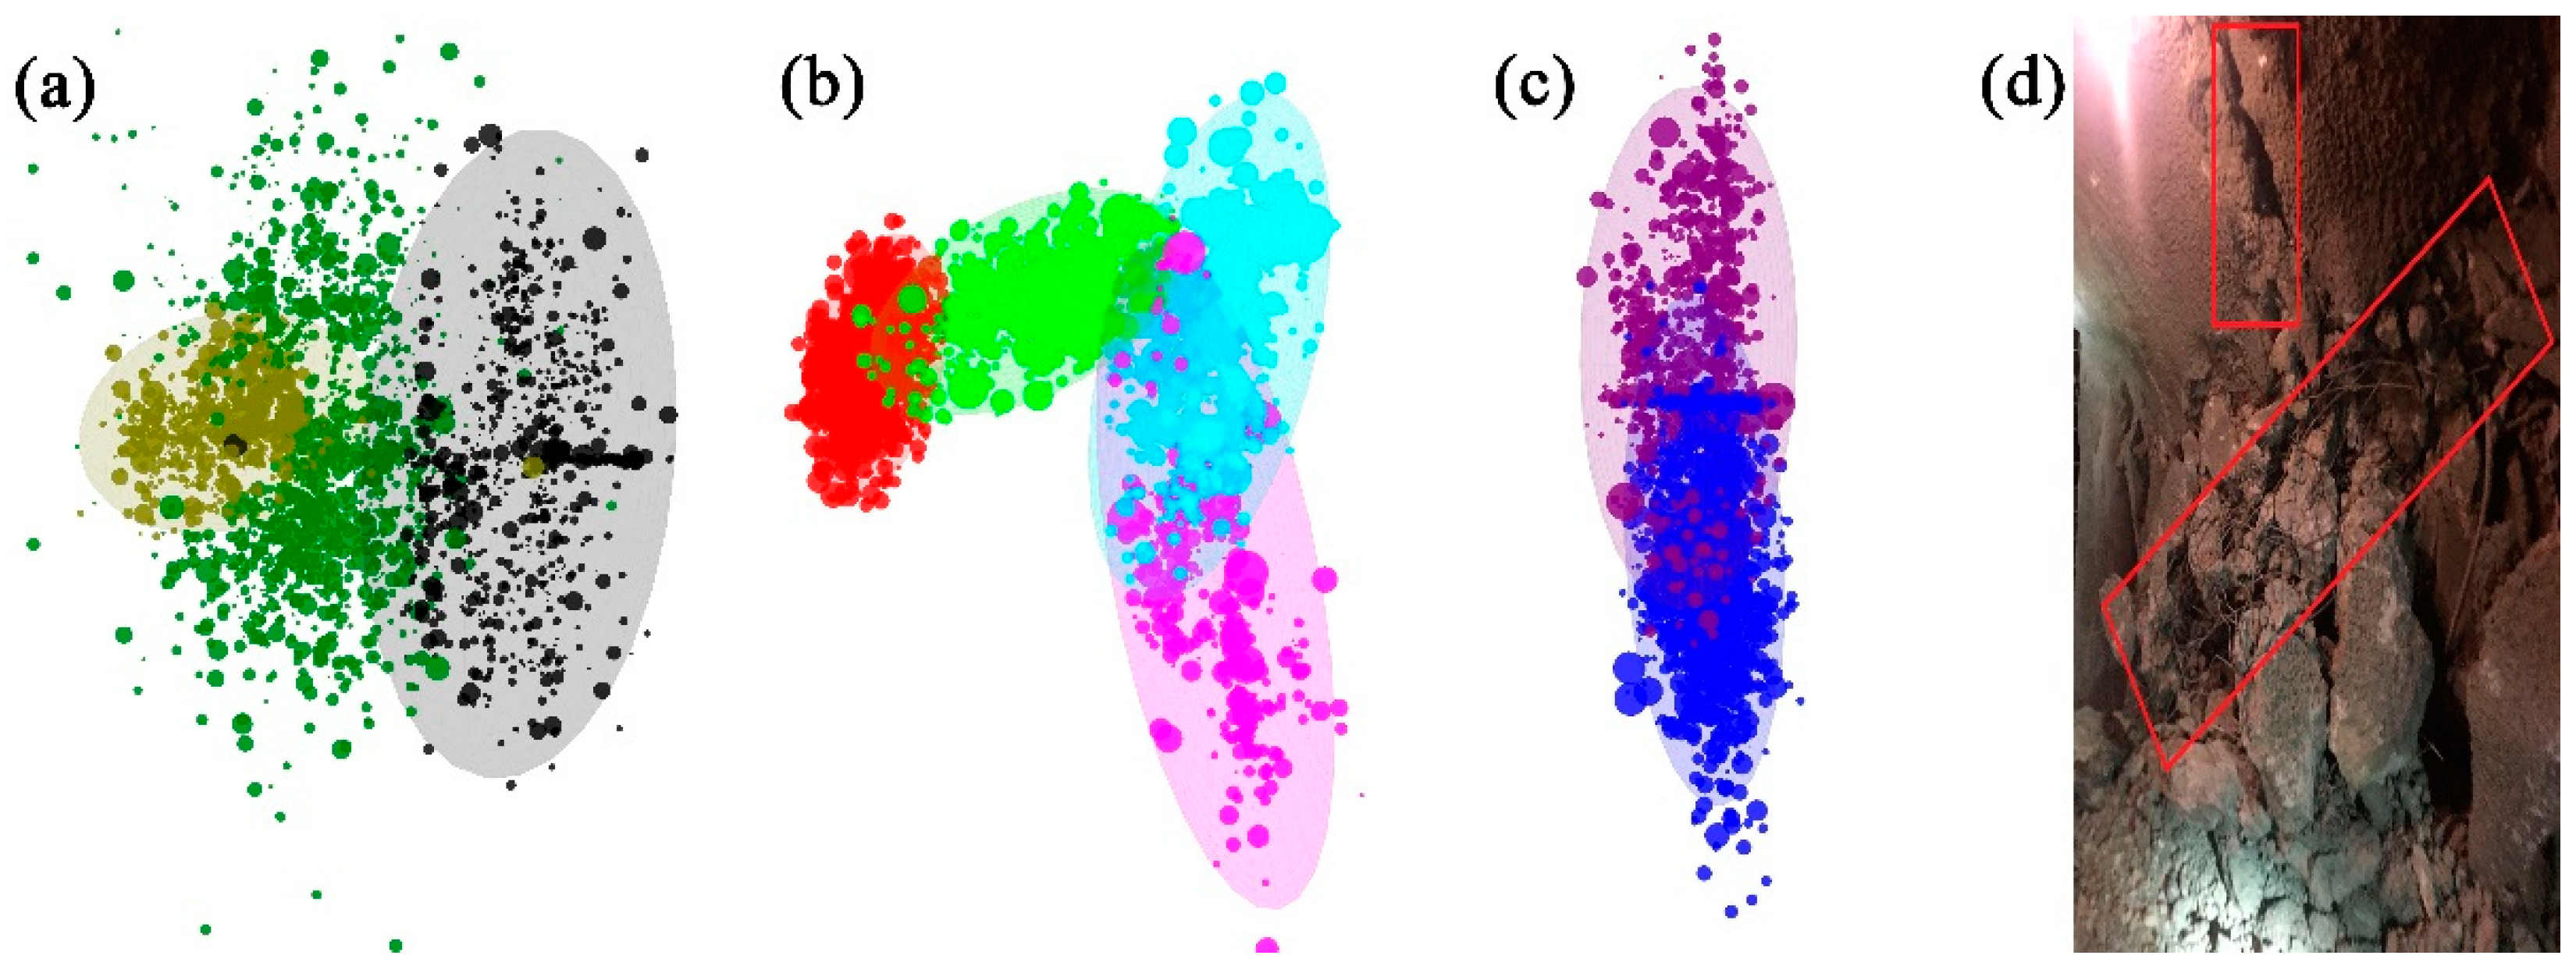
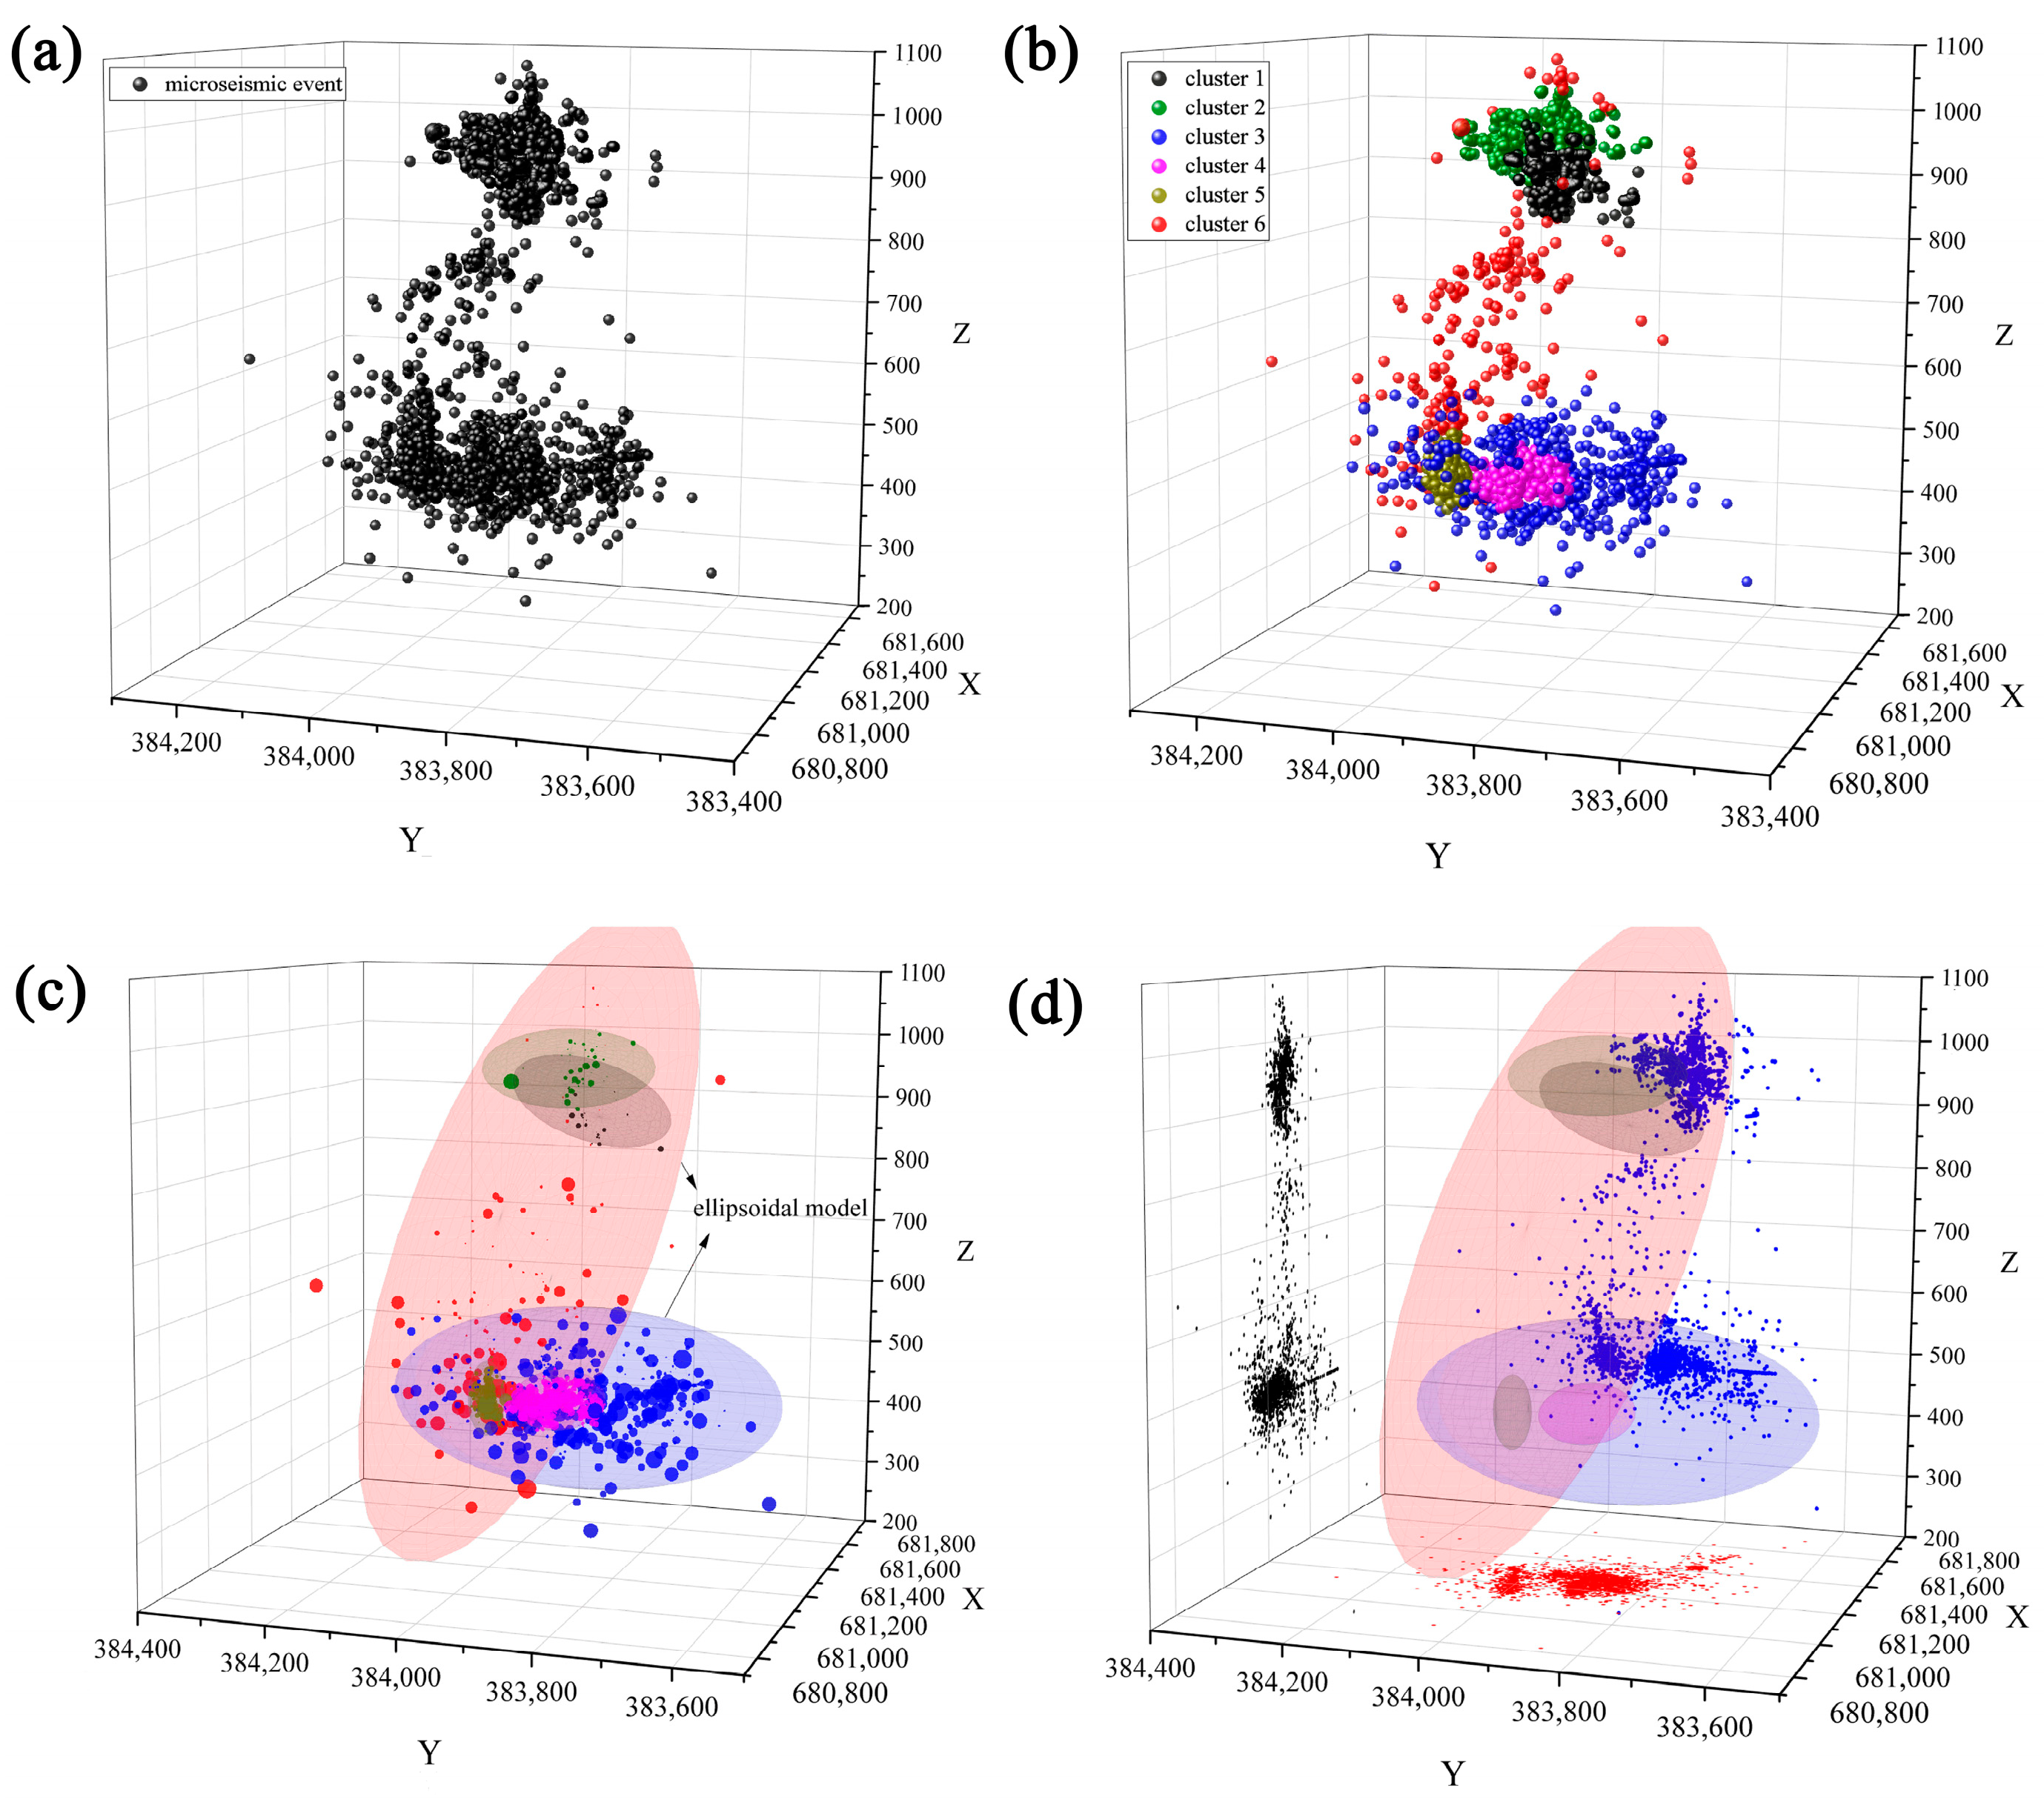
4.1. Machine Learning Clustering Results

The MS monitoring system enables real-time capture of rock mass failure events occurring during the development of roof fractures and provides their location. The variation pattern in MS events reflects the dynamic development process of collapsed ore and the evolution of the rock mass fracture state at the top boundary of the collapsed ore body. The flow of data processing and analysis is shown in Figure 2.
Before conducting clustering calculations, data preprocessing is required to remove obvious outliers and noisy data. At the same time, it is essential to ensure that the processed data exhibit relatively good monitoring performance in at least local locations to guarantee the reliability of the input data.
Traditional methods face challenges in distinguishing the location of crack initiation, particularly in areas with high-density MS events, as depicted in Figure 3a. To overcome this, unsupervised machine learning methods are employed to determine the affiliation of each MS event and identify different clusters of MS events. The Gaussian mixture model (GMM) is utilized, which is a weighted combination of multiple Gaussian distribution models capable of fitting various types of distributions.
The clustering process involves randomly selecting the cluster center, obtaining initial clustering results, adjusting the cluster center based on the results, and iterating until no significant changes in the cluster center occur. The iterative machine learning process calculates the range of event coordinates contained in each event cluster, yielding the final result. The optimal number of clusters is selected based on onsite conditions, and different colors are used to distinguish various types of MS event clusters, as shown in Figure 3b. Additionally, to visualize the influence range of event clusters, the 95% confidence interval ellipsoid for each cluster is calculated, as depicted in Figure 3c. The calculation results indicate that the long axis “a” of the MS event cluster is predominantly parallel to the z-axis, suggesting a vertical concentration and development of cracks. The projection of MS events in various directions is shown in Figure 3d.
Table 1 presents the ellipsoidal parameters of different clusters, revealing significant differences in their distribution patterns and ranges. Clusters 1 and 2 exhibit relatively small differences in the lengths of their three main axes and have larger curvature in the confidence interval ellipsoid model. In the case of Clusters 5 and 10, even though the length difference between the a-axis and b-axis is relatively small, the significant difference between the c-axis and the ab-plane suggests that microseismic events in these clusters may exhibit a tendency to occur along a particular plane. The selection of Clusters 5 and 10 based on the c-axis orientation is motivated by the hypothesis that microseismic events may exhibit preferential planes of occurrence, and this choice serves as a starting point for a more in-depth investigation into the geological and structural factors influencing crack propagation and event behavior.
When MS events are located on a plane, they may indicate precursors to cracks and rock mass instability. Microseismic events, which are often associated with the release of stress and energy in the subsurface, can occur along planes where stress concentrations are prominent. These stress concentrations can result from geological structures, discontinuities, or pre-existing fractures in the rock mass. Microseismic events can signify the initiation of small cracks or fractures within the rock. When these events cluster along a specific plane or region, it suggests that the stress or pressure within that area has reached a critical point, potentially leading to the development of larger cracks or fractures. Therefore, Clusters 5 and 10 are considered more dangerous than Clusters 1 and 2. The number of microseisms per unit volume also reflects the stability of the region. During the calculation process, it was observed that the logarithms of event density are mostly concentrated around −2. A low density of MS events can result from either dispersed distribution within the cluster or a large recognition range of the cluster.
The clustering effect can be evaluated using the silhouette coefficient (sc) to assess the quality of clustering, but it is primarily applicable when cracks are fully developed. In the intermediate process where ideal clustering conditions may not be met, the sc value tends to be low. Hence, determining the number of clusters should be based on the actual onsite situation.

4.2. Distribution Characteristics of Crack Clusters
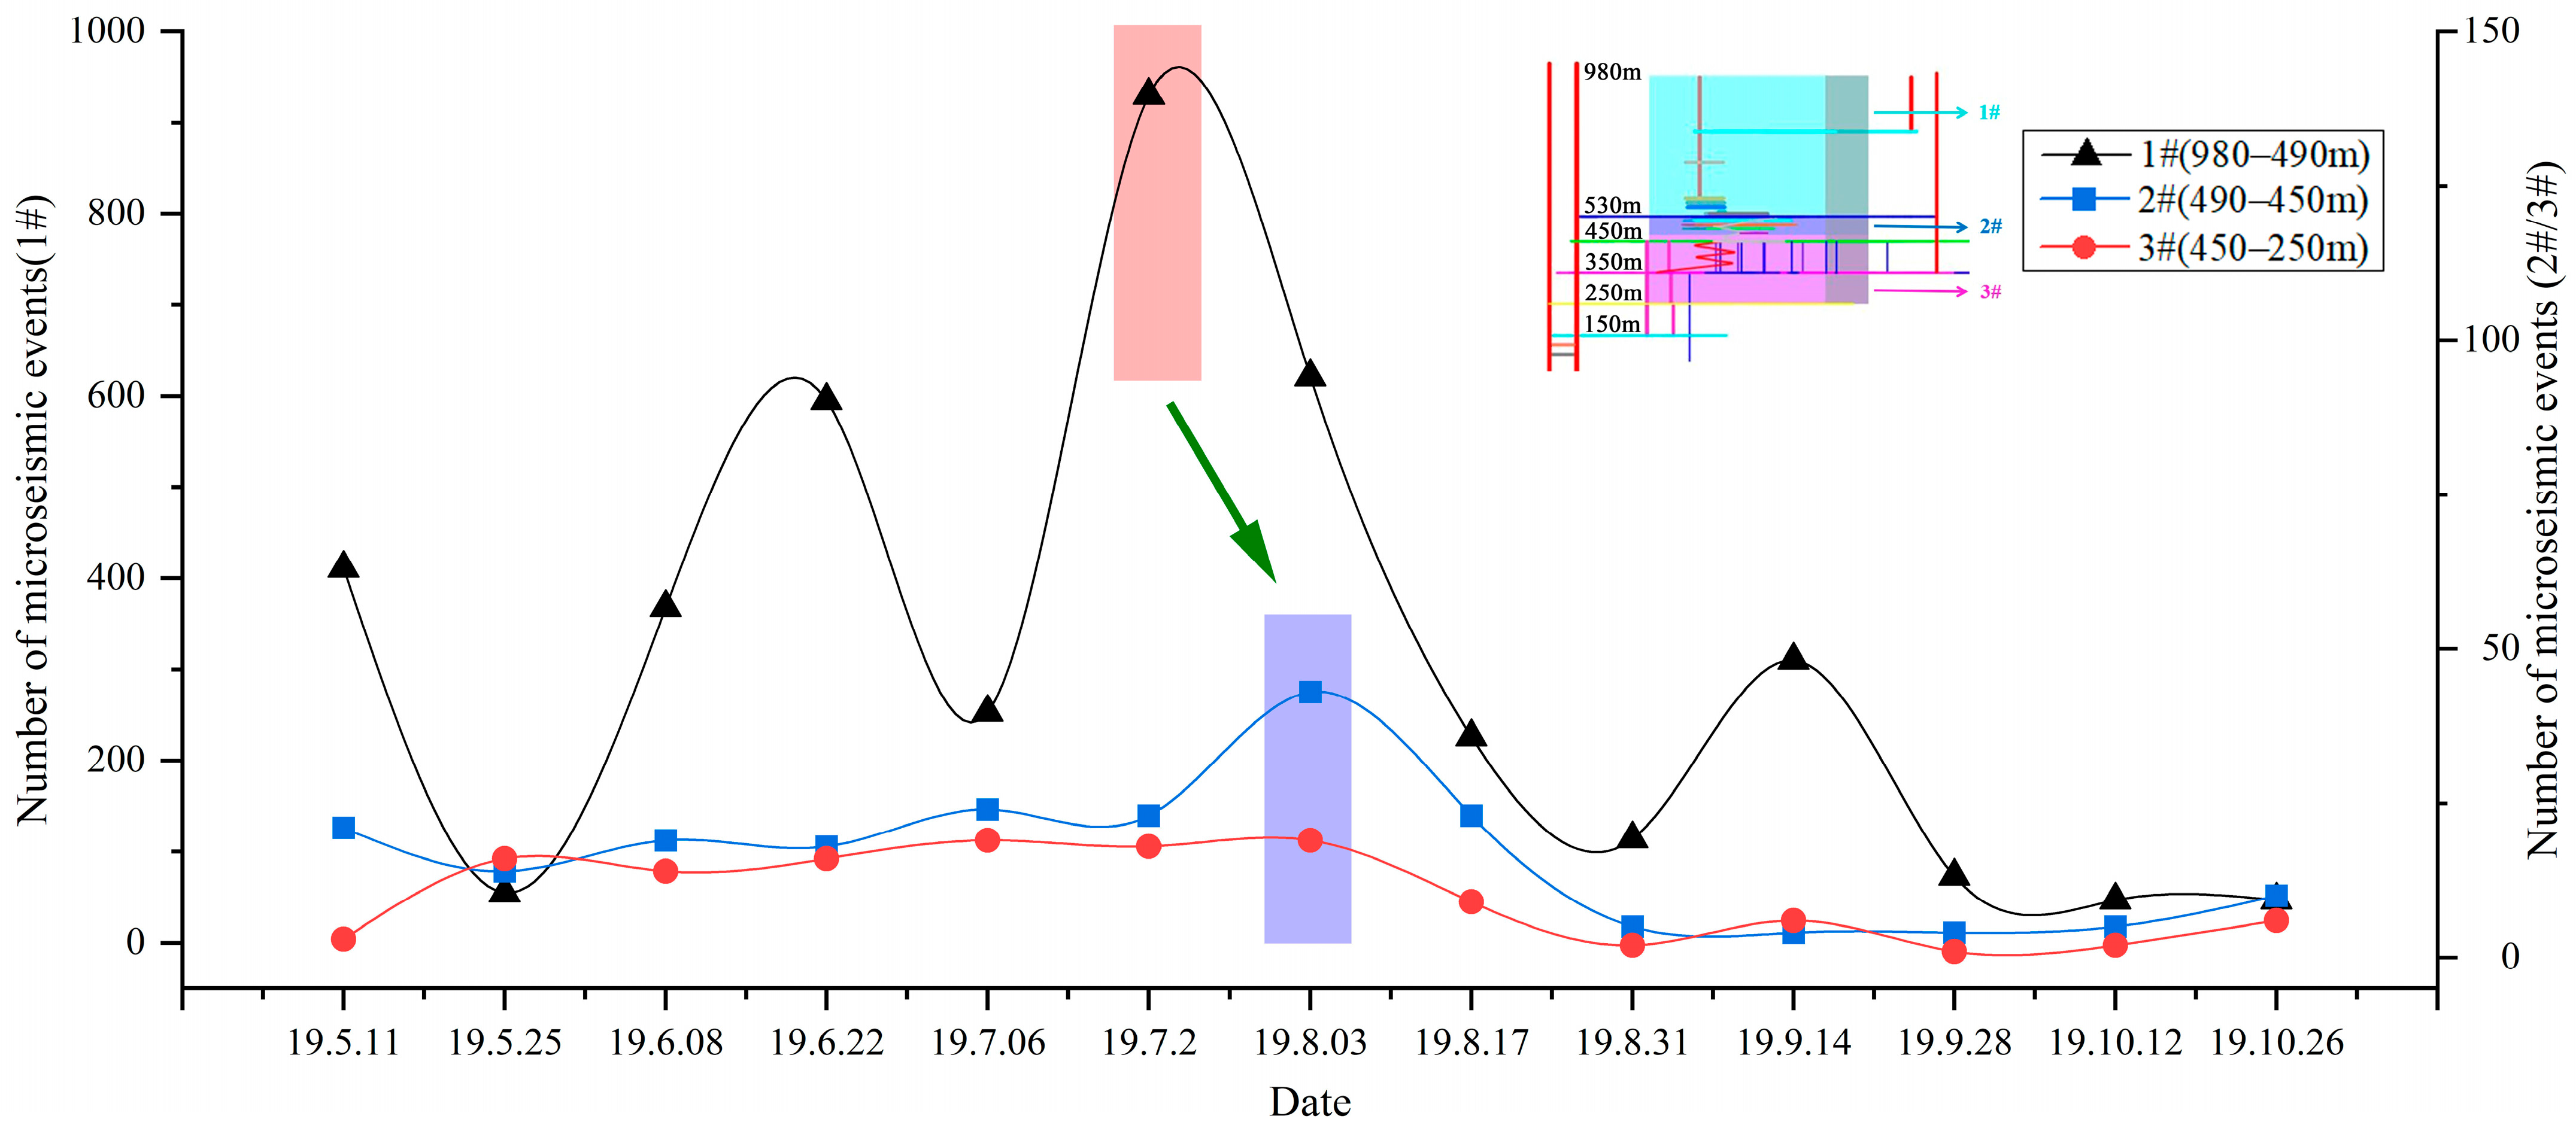
The different forms of crack clusters can reflect the complexity of crack development in the region. The distribution patterns of the identified crack clusters are relatively diverse and can be divided into three stages. The first stage is that each cluster is independent of the others, and the influence range is not superimposed, as shown in Figure 4a. The boundary contour of the crack cluster is clear and easy to distinguish. In the second stage, there is a small amount of overlap between the clusters, as shown in Figure 4b. The boundary contour of the crack clusters is relatively clear, mostly overlapping at the beginning and end of the ellipsoidal model. The third stage is where there are large overlapping influence areas between each cluster, as shown in Figure 4c. Under the first two conditions, the development of crack clusters is relatively independent and has little mutual influence. When a large area of overlap occurs in the crack cluster, the cracks are considered to have penetrated. When new crack clusters appear around the overlapping crack clusters and surround them, the penetrating cracks begin to expand, expanding the scope of influence. Figure 4d shows a comparison between the clustering results and onsite cracks, indicating that obvious cracks have appeared in the roadway and are spreading horizontally.
The size of the MS event sphere in Figure 3 is positively correlated with its magnitude. The energy of the MS events at both ends of the ellipsoidal model is relatively small, while the central position exhibits relatively large energy. Based on statistical analysis, the energy distribution of the crack cluster follows a Gaussian model and can serve as a criterion for identifying individual cracks. The spatiotemporal correlation between adjacent clusters is stronger, with the long axis “a” representing the crack length, the long axis “b” representing the crack width, and the long axis “c” representing the crack’s range of influence. Clusters with a higher MS event density and a concentrated range of influence (shorter “c”-axis length) are more prone to macroscopic cracks. The clustering results of MS events demonstrate the dynamic evolution process of the rock mass, including independent development from the nucleation location, mutual influence between adjacent locations, crack growth, and crack propagation.

4.3. Case Study

Between May and August 2019, a significant number of MS incidents were detected near the surface, leading to roof collapse accidents. Figure 5 illustrates the spatiotemporal evolution of the MS event distribution above 530 m during this period. By analyzing the range of roof collapse and surface fractures, the collapse boundary was determined. According to the monitoring results, in May 2019, the overlying goafs of the 30# and 32# ore bodies had not yet connected. Roof fractures occurred within a certain range between 8 May and 30 May and again from 31 May to 10 June. However, the extent of the roof fractures was smaller than the previous occurrence, suggesting an impending connection. MS events near the surface exhibited significant concentration, propagating from the middle of the 30# ore body toward the 32# collapse area and east. In July 2019, the two goaf areas gradually connected, leading to further upward collapse of the roof.
From Figure 5e, it is evident that after the roof crack penetration in 2019, MS events occurred around the penetrated crack, particularly at the 980 m surface location. The mining activity caused the original goaf of the 30# ore body to be influenced by the mining of the 32# ore body, leading to gradual crack expansion. This resulted in the connection of the 32# roof with the goaf, subsequently impacting the surface. As mining operations continue, surface cracks will continue to deepen and expand. Therefore, further assessment and treatment of crack zoning within the 980 m elevation area are necessary.

5. Discussion

5.1. Cluster Analysis of Roof Collapse MS Events

A machine learning method was employed to analyze the MS events, and the results are presented in Figure 6. The MS events at the caving through the roof are identified as Cluster 6, represented by the red shadow. The identification results align with the field observations, validating the practical application of this analysis method. Cluster 6 is spatially surrounded by surface Clusters 1 and 2, indicating that it is the outcome of further crack propagation and penetration under its influence. In the elevation range of 450–530 m, MS events continue to gather, and the emergence of Cluster 5 indicates a strengthening connection between the mining area and the surface fractures.
Variance analysis was used to assess the differences between different clusters [31,32,33,34,35]. Pairwise comparisons between different clusters were conducted using t-tests, and the results are presented in Table 2. In the data comparisons, the t-statistic values are all relatively large, and the p-values are all close to 0, indicating that these differences are statistically significant. The p-value for the comparison between Cluster 2 and Cluster 6 is 0.2252, suggesting nonsignificance, likely because Clusters 2 and 6 overlap spatially. Based on the field measurements, it can be concluded that the grouping of these two components is reasonable.
As shown in Figure 7, after July, the number of MS events detected at positions 2# (490–450 m) and 3# (450–250 m) also slightly increased due to the influence of crack Cluster 6. The trend for the MS events in the three regions becomes more consistent after August, indicating the downward extension of the crack’s influence range. Prior to the penetration of roof cracks in early May and late June, there was a slight increase in the number of MS events within the range of 1# (980–490 m). Based on the distribution characteristics of the MS events in Cluster 6, it can be observed that the energy of the events is greater in the middle and lower parts. Therefore, it can be inferred that crack Cluster 6 will continue to have a downward impact, leading to the occurrence of small energy MS events.

5.2. Crack Spatiotemporal Evolution Features

Using Cluster 6 as an example, we analyze the propagation law of crack clusters. We divide the detected microseismic events into six stages in chronological order for statistical data analysis. From Figure 8, it is evident that the crack cluster primarily extends outward from the center of an ellipsoid. The confidence interval area of the expansion continues to increase, indicating a continuous increase in the propagation radius. In terms of the expansion direction, during the first three stages, there is linear expansion without any deviation in direction. However, starting from stage 4, the upper cracks start to dominate and lean toward the direction of surface crack development. By stage 6, the influence range of the crack clusters expands horizontally, with the lower cracks now dominating and leaning toward the direction of mining crack development. The trend in the propagation direction provides a basis for crack prediction. The center of gravity gradually shifts upward in the first five stages, indicating a significant contribution from the upper impacts and dominance of surface cracks. However, starting from stage 6, the center of gravity shifts downward, indicating an increase in the proportion of lower impacts.
The three-dimensional crack morphology has been reconstructed based on MS data, as depicted in Figure 9. MS events gather and generate on a plane, forming a crack propagation plane. From the results, it is observed that the cracks primarily extend upward, beginning to contract at an elevation of 800 m and eventually connecting to the surface at 980 m. The contraction of the crack surface downward at 530 m is caused by the MS activity in the mining area and provides further insight into the direction of crack development. The fluctuation characteristics in cracks between 530 and 800 m indicate that the crack plane within this range may be formed by multiple cracks penetrating through. The formation of the goaf of the 32# ore body has alleviated the constraint stress on the adjacent rock mass of the 30# original mining area, resulting in the downward extension of cracks from the surface toward the mining area. By increasing the number of local clusters in microseismic data analysis, the ability to identify and characterize individual fractures and their propagation can be improved. Actual engineering weight may not be able to directly observe the discontinuities in situ, but this method can help distinguish and analyze the behavior of fractures in rock masses.

6. Conclusions

In this paper, the spatial distribution of crack clusters has been analyzed using the microseismic monitoring technique. Through clustering analysis, the temporal and spatial evolution of cracks has been examined, providing valuable insights into the mechanism of crack propagation and instability. The study also validates the applicability of this method through a case study on roof caving. Based on the findings, the following conclusions can be drawn:
  • Microseismic equipment proves to be an effective tool for monitoring the crack evolution of rock masses. By utilizing machine learning methods, it becomes possible to classify and characterize individual cracks. Furthermore, when microseismic events are located on a plane, they are considered to be potential precursors to cracks and rock mass instability.
  • Different morphologies of crack clusters reflect the complexity of crack development in the analyzed region. The identified crack development can be categorized into three distinct types, illustrating the dynamic evolution process of the rock mass. This process involves independent development at nucleation positions, mutual influence between adjacent locations, and subsequent crack growth and propagation.
  • The proposed model is demonstrated to effectively predict the direction and angle of crack propagation. Its successful engineering application provides valuable guidance for studying rock mass stability and informing related research efforts.

Author Contributions

Conceptualization, Y.C.; methodology, Z.C.; software, Z.C.; investigation, Z.C., P.W., Z.L. and Y.C.; resources, P.W. and Z.C.; data curation, Y.C.; writing—original draft preparation, Y.C., Z.C. and Z.L.; writing—review and editing, Y.C., Z.C. and Z.L.; supervision, Z.L. and P.W. All authors have read and agreed to the published version of the manuscript.

Funding

This research was funded by the Youth Science and Technology Innovation Fund, BGRIMM Technology Group (Grant No. 04-2228), and the National Key Research and Development Program of China (Grant No. 2022YFC2903804).

Institutional Review Board Statement

Not applicable.

Informed Consent Statement

Not applicable.

Data Availability Statement

The data used to support the findings of this study are available from the corresponding author upon request.

Conflicts of Interest

The authors declare no conflict of interest.

References

  1. Fischer, T.; Kühn, D.; Roth, M. Microseismic events on the Åknes rockslide in Norway located by a back-projection approach. J. Seismol. 2020, 24, 55–74. [Google Scholar] [CrossRef]
  2. Barla, G.; Antolini, F.; Barla, M.; Mensi, E.; Piovano, G. Monitoring of the Beauregard landslide (Aosta Valley, Italy) using advanced and conventional techniques. Eng. Geol. 2010, 116, 218–235. [Google Scholar] [CrossRef]
  3. Wang, C.L.; Chen, Z.; Liao, Z.F.; Hou, X.L.; Li, H.T.; Wang, A.W.; Li, C.F.; Qian, P.F.; Li, G.Y.; Lu, H. Experimental investigation on predicting precursory changes in entropy for dominant frequency of rockburst. J. Cent. South Univ. 2021, 28, 981. [Google Scholar] [CrossRef]
  4. Wang, Y.C.; Tang, C.A.; Cai, M.; Tang, L.X.; Ma, T.H.; Zhang, S.C.; Li, L.M.; Li, Y.B. Microseismicity evolution related to two extremely intense rockbursts in a water diversion tunnel. Int. J. Rock Mech. Min. 2023, 164, 105359. [Google Scholar] [CrossRef]
  5. Chen, Z.; Zhang, D.; Zuo, C.; Wang, P.; Liu, Q.; Shi, F. Investigation of the microseismic response characteristics of a bottom structure’s ground pressure activity under the influence of faults. Appl. Sci. 2023, 13, 3796. [Google Scholar] [CrossRef]
  6. Ma, T.H.; Tang, C.A.; Liu, F.; Zhang, S.C.; Feng, Z.Q. Microseismic monitoring, analysis and early warning of rockburst. Geomat. Nat. Haz. Risk. 2021, 12, 2956–2983. [Google Scholar] [CrossRef]
  7. Wang, P.; Zhao, Z.; Zhang, D.; Chen, Z. Investigation of microseismic characteristics of rock burst based on fractal theory. Appl. Sci. 2023, 13, 4613. [Google Scholar] [CrossRef]
  8. Young, R.P.; Maxwell, S.C.; Urbancic, T.I.; Feignier, B. Mining-induced microseismicity: Monitoring and applications of imaging and source mechanism techniques. Pure Appl. Geophys. 1992, 139, 697–719. [Google Scholar] [CrossRef]
  9. Srinivasan, C.; Arora, S.K.; Benady, S. Precursory monitoring of impending rockbursts in Kolar gold mines from microseismic emissions at deeper levels. Int. J. Rock Mech. Min. Sci. 1999, 36, 941–948. [Google Scholar] [CrossRef]
  10. Zhang, C.; Jin, G.H.; Liu, C.; Li, S.G.; Xue, J.H.; Cheng, R.H.; Wang, X.L.; Zeng, X.Z. Prediction of rockbursts in a typical island working face of a coal mine through microseismic monitoring technology. Tunn. Undergr. Sp. Tech. 2021, 113, 103972. [Google Scholar] [CrossRef]
  11. Zhang, H.; Zeng, J.; Ma, J.; Fang, Y.; Chen, Z. Time series prediction of microseismic multi-parameter related to rockburst based on deep learning. Rock Mech. Rock Eng. 2021, 54, 6299–6321. [Google Scholar] [CrossRef]
  12. Cai, W.; Dou, L.M.; Si, G.Y.; Cao, A.Y. A new seismic-based strain energy methodology for coal burst forecasting in underground coal mines. Int. J. Rock Mech. Min. Sci. 2019, 123, 104086. [Google Scholar] [CrossRef]
  13. Shen, B.T.; Duan, Y.; Luo, X. Monitoring and modelling stress state near major geological structures in an underground coal mine for coal burst assessment. Int. J. Rock Mech. Min. Sci. 2020, 129, 104294. [Google Scholar] [CrossRef]
  14. Feng, G.L.; Feng, X.T.; Xiao, Y.X.; Yao, Z.B.; Hu, L. Characteristic microseismicity during the development process of intermittent rockburst in a deep railway tunnel. Int. J. Rock Mech. Min. Sci. 2019, 124, 104135. [Google Scholar] [CrossRef]
  15. Li, P.X.; Feng, X.T.; Feng, G.L.; Xiao, Y.X.; Chen, B.R. Rockburst and microseismic characteristics around lithological interfaces under different excavation directions in deep tunnels. Eng. Geol. 2019, 260, 105209. [Google Scholar] [CrossRef]
  16. Liu, Q.S.; Wu, J.; Zhang, X.P. Microseismic monitoring to characterize structuretype rockbursts: A case study of a TBM-excavated tunnel. Rock Mech. Rock Eng. 2020, 53, 2995–3013. [Google Scholar] [CrossRef]
  17. Srinivasan, C.; Arora, S.K.; Yaji, R.K. Use of mining and seismological parameters as premonitors of rockbursts. Int. J. Rock Mech. Min. Sci. 1997, 34, 1001–1008. [Google Scholar] [CrossRef]
  18. Cai, M.; Kaiser, P.K. Assessment of excavation damaged zone using a micromechanics model. Tunn. Undergr. Sp. Tech. 2005, 20, 301–310. [Google Scholar] [CrossRef]
  19. Xue, R.; Liang, Z.; Xu, N. Rockburst prediction and analysis of activity characteristics within surrounding rock based on microseismic monitoring and numerical simulation. Int. J. Rock Mech. Min. Sci. 2021, 142, 104750. [Google Scholar] [CrossRef]
  20. Zhang, B.; Tian, X.P.; Ji, B.X.; Zhao, J.Z.; Zhu, Z.M.; Yin, S. Study on microseismic mechanism of hydro-fracture propagation in shale. J. Petrol. Sci. Eng. 2019, 178, 711–722. [Google Scholar] [CrossRef]
  21. Enoki, M.; Kishi, T. Theory and analysis of deformation moment tensor due to microcracking. Int. J. Fract. 1988, 38, 295–310. [Google Scholar] [CrossRef]
  22. Vera, R.I.; Stanchits, S.; Burghardt, J. Data-driven, in situ, relative sensor calibration based on waveform fitting moment tensor inversion. Rock Mech. Rock Eng. 2017, 50, 891–911. [Google Scholar] [CrossRef]
  23. Wei, S.; Wu, S.C. A study of crack initiation and source mechanism in the Brazilian test based on moment tensor. Eng. Fract. Mech. 2021, 246, 107622. [Google Scholar] [CrossRef]
  24. Corral, A. Long-term clustering, scaling, and universality in the temporal occurrence of earthquakes. Phys. Rev. Lett. 2004, 92, 108501. [Google Scholar] [CrossRef]
  25. Li, Y.H.; Liu, J.P.; Zhao, X.D.; Yang, Y.J. Experimental studies of the change of spatial correlation length of acoustic emission events during rock fracture process. Int. J. Rock Mech. Min. Sci. 2010, 47, 1254–1262. [Google Scholar] [CrossRef]
  26. Zhang, Z.; Liu, X.; Zhang, Y.H.; Qin, X.Y.; Khan, M. Comparative study on fracture characteristics of coal and rock samples based on acoustic emission technology. Theor. Appl. Fract. Mec. 2020, 111, 102851. [Google Scholar] [CrossRef]
  27. Gerd, M. Application of the cluster analysis and time statistic of acoustic emission events from tensile test of a cylindrical rock salt specimen. Eng. Fract. Mech. 2018, 210, 84–94. [Google Scholar] [CrossRef]
  28. Duxbury, P.M.; Leath, P.L. Failure probability and average strength of disordered systems. Phys. Rev. Lett. 1994, 72, 2805–2808. [Google Scholar] [CrossRef]
  29. Mouret, F.; Hippert-Ferrer, A.; Pascal, F.; Tourneret, J.Y. A Robust and Flexible EM Algorithm for Mixtures of Elliptical Distributions with Missing Data. IEEE Trans. Signal Process. 2023, 7, 1669–1682. [Google Scholar] [CrossRef]
  30. Pernkopf, F.; Bouchaffra, D. Genetic-based EM algorithm for learning Gaussian mixture models. IEEE Trans. Pattern Anal. 2005, 27, 1344–1348. [Google Scholar] [CrossRef]
  31. Feng, G.; Lin, M.; Yu, Y.; Fu, Y.A. Microseismicity-Based Method of Rockburst Intensity Warning in Deep Tunnels in the Initial Period of Microseismic Monitoring. Energies 2020, 13, 2698. [Google Scholar] [CrossRef]
  32. Liu, G.; Jiang, Q.; Feng, G.; Chen, D.; Chen, B.; Zhao, Z. Microseismicity-based method for the dynamic estimation of the potential rockburst scale during tunnel excavation. Bull. Eng. Geol. Environ. 2021, 80, 3605–3628. [Google Scholar] [CrossRef]
  33. Liu, J.; Zhang, J.; Wei, D.; Li, F.; Shi, H.; Si, Y. Quantitative risk assessment for deep tunnel failure based on clustering and logistic regression at the Ashele copper mine, China. Int. J. Min. Reclam. Env. 2022, 36, 688–709. [Google Scholar] [CrossRef]
  34. Ma, C.; Jiang, Y.; Li, T. Gravitational Search Algorithm for Microseismic Source Location in Tunneling: Performance Analysis and Engineering Case Study. Rock Mech. Rock Eng. 2019, 52, 3999–4016. [Google Scholar] [CrossRef]
  35. Yin, X.; Liu, Q.; Pan, Y.; Huang, X. A novel tree-based algorithm for real-time prediction of rockburst risk using field microseismic monitoring. Environ. Earth Sci. 2021, 80, 504. [Google Scholar] [CrossRef]
Figure 1. Positioning accuracy of the MS monitoring system. (a) Positioning error; (b) sensitivity; (c) 530 m microseismic monitoring point; (d) 450 m microseismic monitoring site; (e) surface microseismic monitoring site.
Applsci 13 11307 g001
Figure 2. Data analysis and processing flow chart.
Applsci 13 11307 g002
Figure 3. 3D spatial clustering results of MS events in 2018. (a) MS event data; (b) cluster results; (c) cluster influence range; (d) projection results.
Applsci 13 11307 g003
Figure 4. Typical MS cluster categories. (a) Phase I; (b) Phase II; (c) Phase III; (d) field crack pattern. Different colors represent different clusters.
Applsci 13 11307 g004
Figure 5. Spatial distribution of MS events in the roof of the surface and overlying goaf. (a) Distribution of MS events in May; (b) distribution of MS events in May to June; (c) distribution of MS events in May to July; (d) distribution of MS events in May to August; (e) evolution trend of MS events.
Applsci 13 11307 g005
Figure 6. 3D spatial clustering results of MS events in 2019. (a) MS event data; (b) cluster results; (c) cluster influence range; (d) projection results.
Applsci 13 11307 g006
Figure 7. Time series evolution characteristics of MS event number.
Applsci 13 11307 g007
Figure 8. 2D clustering results.
Applsci 13 11307 g008
Figure 9. Simulation results of three-dimensional crack morphology. The different colors in the right image represent different fracture surfaces.
Applsci 13 11307 g009
Table 1. Ellipsoidal parameters of a single crack.
ClusterabcEllipsoidal Volume/m3Number of MS EventsMS Event Density Logarithm
1157.51150.4995.619,488,279.6571006−3.97
2220.87181.01160.1126,799,466.081616−4.22
348.2730.7222.19137,760.33721062−2.11
482.527.421.45203,001.9422310−1.94
574.5441.9116.32213,449.7195937−2.36
6228.04137.0144.865,868,011.45458−4.11
796.2149.2924.89494,165.37721891−2.42
888.6560.3519.76442,599.9284980−2.65
987.8934.4534.45436,703.1271761−2.39
10685712.13196,839.81761401−2.15
Table 2. Analysis of variance by cluster.
Comparisont-Statisticp-ValueSignificant Difference
cluster1 and cluster 2−40.87320Yes
cluster 1 and cluster 3−16.06520Yes
cluster 1 and cluster 418.47660Yes
cluster 1 and cluster 532.03440Yes
cluster 1 and cluster 6−13.29280Yes
cluster 2 and cluster 3−4.96930Yes
cluster 2 and cluster 4−59.0920Yes
cluster 2 and cluster 576.70930Yes
cluster 2 and cluster 61.21320.2252No
cluster 3 and cluster 4−15.8630Yes
cluster 3 and cluster 516.98060Yes
cluster 3 and cluster 61.99370.0465Yes
cluster 4 and cluster 515.10110Yes
cluster 4 and cluster 6−19.38770Yes
cluster 5 and cluster 625.14450Yes
Disclaimer/Publisher’s Note: The statements, opinions and data contained in all publications are solely those of the individual author(s) and contributor(s) and not of MDPI and/or the editor(s). MDPI and/or the editor(s) disclaim responsibility for any injury to people or property resulting from any ideas, methods, instructions or products referred to in the content.

