Article

Exploring User Experience in Sustainable Transport with Explainable AI Methods Applied to E-Bikes

1
Robert Bosch GmbH, 70839 Gerlingen, Germany
2
Institute of Automotive and Powertrain Engineering, Helmut Schmidt University, 22043 Hamburg, Germany
*
Author to whom correspondence should be addressed.
Appl. Sci. 2023, 13(20), 11277; https://doi.org/10.3390/app132011277
Submission received: 13 September 2023 / Revised: 6 October 2023 / Accepted: 10 October 2023 / Published: 13 October 2023
(This article belongs to the Section Transportation and Future Mobility)

Abstract

:
Sustainable modes of transport are being promoted to achieve global climate goals. The perceived user experience is decisive for the choice of transport mode. To increase the share of sustainable transport in total traffic, the user experience is placed into the spotlight, raising the need for appropriate exploration methods. Machine learning (ML) techniques have become increasingly popular in the transport domain, but the black-box nature of ML models poses significant challenges in interpreting the relationship between model input and output. Explainable AI methods (XAI) can fill this gap by providing post hoc interpretation methods for black-box models. The aim of the present work was therefore to assess the potential of XAI to explore user experience in transport. The introduced method was based on a popular XAI method named SHAP (SHapley Additive exPlanations). Applied to the use case of e-bikes, we aimed to explore factors influencing the riding experience on e-bikes. We applied Gaussian process regression to data collected in a cycling study from 55 e-bike riders including rider behaviour, motor power and riding dynamics. Applying SHAP, we compared the riding experience of four rider types identified by hierarchical cluster analysis. The results provide insights into the riding experience on e-bikes: motor power, rider behaviour and riding dynamics were found to be meaningful predictors differing in their impact between rider types. Our results can be regarded as a proof of concept and demonstrate the potential of XAI to enhance the understanding of user experience in transport.

1. Introduction

The achievement of global climate goals forces society to increase the share of sustainable transport in total traffic [1]. In urban environments, active modes of transport like walking or cycling are especially promoted [1]. As the chosen mode of transport depends on the perceived user experience [2], the user experience of sustainable mobility solutions needs to be brought into focus. Therefore, it becomes necessary to implement user experience and associated assessment methods in the development process of sustainable modes of transport.
However, the subjective assessment of user experience suffers limited validity, as the self-assessment is biased by social desirability [3], measures only conscious processes [4] and is usually measured with a time delay [5]. The objective measurement of user experience is equally considered challenging [6]. Overcoming the disadvantages of the individual use of either subjective or objective methods of measurement, user experience in transport is quantified using objective data. Traditional quantification methods are parametric regression techniques such as multiple linear regression or logistic regression [5,7]. The regression coefficients are considered easy to interpret, allowing to determine how the predictors impact the model output. However, the use of traditional regression techniques is subject to strict assumptions such as linearity between input and output variables, providing only a good fit if these assumptions are met [8]. Complex real-world applications are non-linear and therefore cannot be fully represented by these types of regression [9,10].
Machine learning methods have become increasingly popular for quantification tasks, providing better model performance compared to traditional regression models [11,12]. In transport, several studies applied machine learning methods to predict subjective experiences of cyclists [13,14] or car drivers [15]. However, the improved prediction performance is at the expense of transparency [11,12]. The black-box character of machine learning algorithms leaves the contribution of individual predictors on the model output indefinite. Transport researchers seek a holistic causal understanding to determine how individual predictors contribute to the overall model output [10,16]. To understand the user experience of sustainable transport, the identification of facilitators and barriers is crucial. Explainable AI (XAI) methods can close this gap by providing post hoc methods to improve explainability.
In transport, XAI is receiving increasing attention, offering promising avenues for exploring transport solutions [17,18,19]. Although XAI has become popular for evaluating behavioural or environmental factors in transport, it has just as much potential for improving the user experience of transport solutions. However, to the author’s knowledge, no work has been carried out that evaluates subjective experiences in transport using XAI. Following the need to enhance user experience of sustainable transport solutions, we introduce a novel approach to explore user experience with XAI methods. In the present paper, we applied the method to the specific use case of e-bike riding, being a rapidly growing mode of sustainable transport [20].
In the present study, we explored the riding experience using the popular explainable AI method SHAP (SHapley Additive exPlanations) [21]. We aimed to assess the potential of XAI to explore user experience in transport. Applied to the use case of e-bikes, our goal was to explore factors influencing the riding experience on e-bikes. We chose Gaussian process regression (GPR) to quantify riding experience because of its ability to model a variety of linear and non-linear relationships between input and output variables [22]. In a cycling study, we collected both sensor data including rider behaviour, motor power and riding dynamics and self-assessed riding experience. Taking the heterogeneity of cyclists into account, we calculated riding experience models for four rider types identified through hierarchical cluster analysis.
The present work contributes significantly to a better understanding of user experience in transport. The research emphasises the potential of explainable AI methods to explore user experience in transport. The use of explainable AI methods empowers engineers to improve transport systems, enhancing sustainable transport. Applied to the e-bike use case, the results of the study provide valuable insights into the riding experience on e-bikes for different rider types.

2. Fundamentals and Related Work
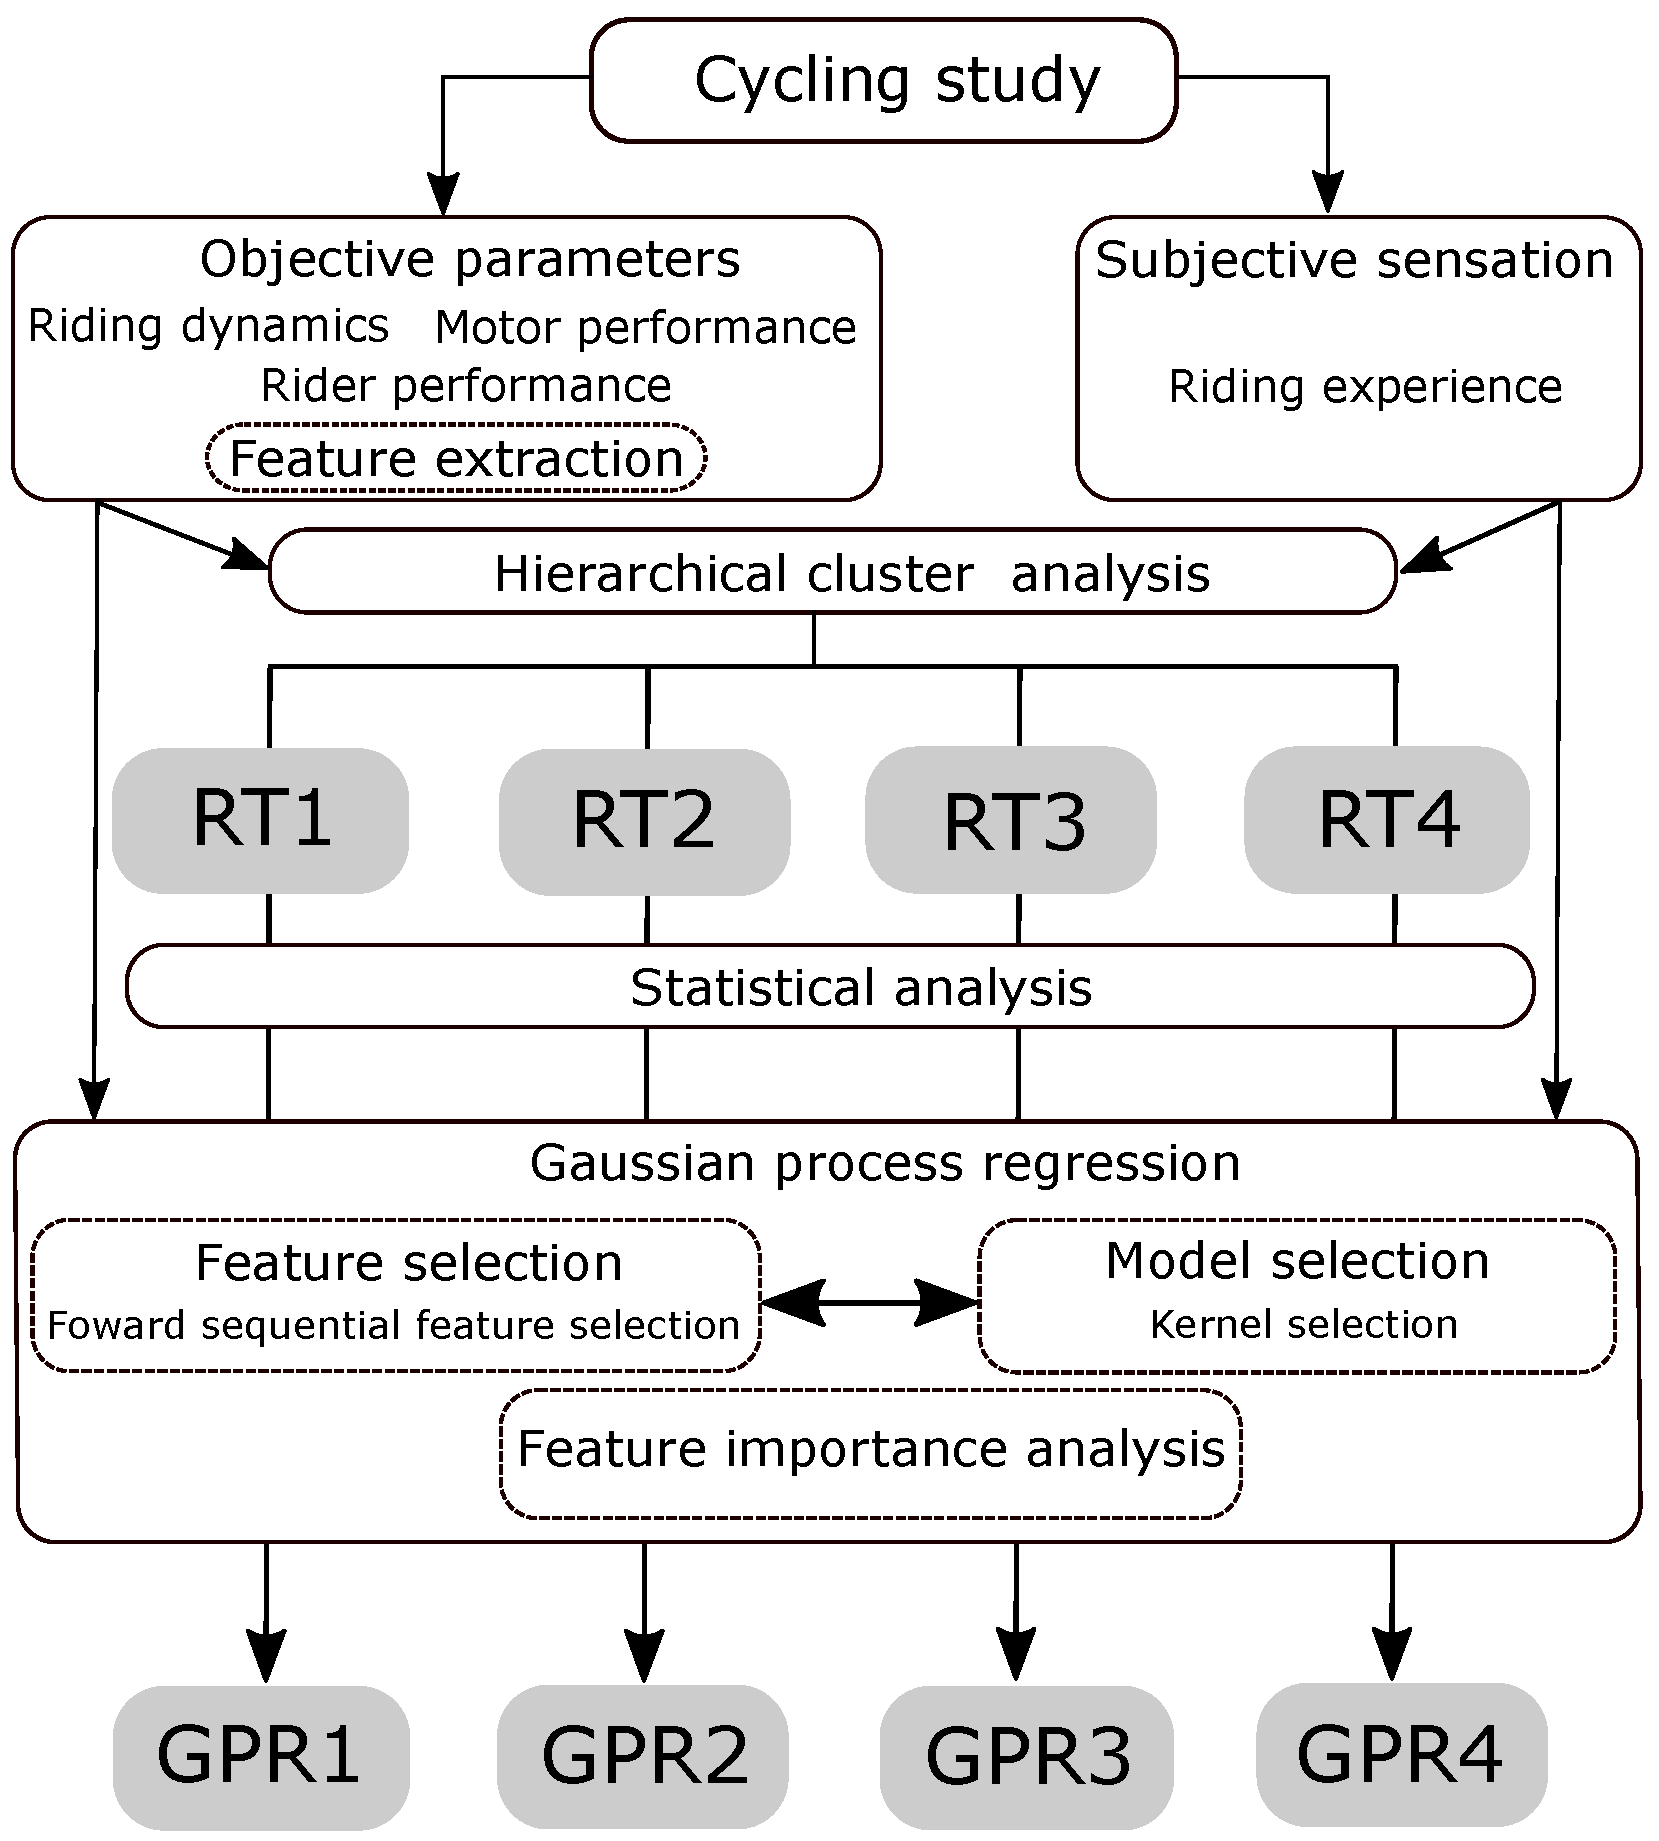
Electric pedal-assist bicycles (EPAC), commonly referred to as e-bikes, became increasingly popular [20] by making cycling attractive to a larger user group including, i.e., commuters [23], utilitarian cyclists [24], elderly people [25] and novice cyclists [26]. E-bikes contribute to sustainable mobility as they have environmental [27] and health [24,28] benefits. E-bikes substitute car journeys [28,29] and facilitate cargo transportation [26]. E-bikes allow riders to cover longer distances [30,31] with less effort [24,32,33]. However, there are still many barriers to cycling such as insufficient cycling infrastructure, leading to bad subjective experiences [34]. User experience on bicycles, referred to as riding experience, is defined by Lim et al. [35] as “cognitive and affective responses to stimuli—events, situations, objects and people in the external environment […]”.
Factors influencing riding experience can be derived from the rider–bicycle interaction [36]. In relation to the rider, riding style [37], riding skills [30,38], attitude [37,39], motivation [40] and sociodemographic characteristics [39,41] were identified as factors influencing the riding experience. In relation to the bicycle, riding dynamics affect the riding experience [30,42]. Cycling was found to be most satisfying at slight lateral and vertical accelerations and angular speeds, as well as speeds above a threshold of 15 km/h [42]. Feizi et al. observed that discomfort results from increasing steering and yaw angles, increasing lateral accelerations and increasing deviations in vertical speed, while perceived comfort increased with higher longitudinal speed. Moreover, while riding uphill, motor power that reduces rider power and increases riding dynamics supports good riding experience [36]. E-bike riders report to enjoy less physical activity [33,36,43], improved rideability [26], higher speed [26,33,36] and good handling [36]. The higher average speed of e-bikes also has a positive effect on the riding experience [23,33,43]. Riding experience can be measured with subjective and objective measurement methods. Common subjective measurement methods are in-traffic questionnaires [44,45], interviews [33,46], online surveys [40,44], travel diaries [47] or signal triggering [48]. Objective measurement methods include the measurement of physiological parameters [5], emotion detection through facial expressions [49] or speech recognition [50] and the measurement of riding dynamics [30,36,42].
Various approaches to model riding experience on bicycles with traditional regression techniques can be found in the literature. Based on an ordered probit model, Feizi et al. [30] developed a cycling comfort index with riding dynamics as input parameters. Logistic regression was used to predict the stress level with physiological data while cycling [51]. Moreover, logistic regression investigated perceived safety and perceived comfort based on riding dynamics data [42]. Laqua et al. [36] applied multiple regression analysis to investigate the impact of rider behaviour, motor power and riding dynamics on the riding experience of e-mountain bike riders. A satisfaction score was predicted using symbolic regression based on bike flow, cycling facilities and traffic situation [52].
The use of ML techniques to model riding experience was also presented in the literature: a decision tree and a multilayer perceptron were used to classify happiness and fear with physiological data [13]. During test rides, physiological parameters and self-assessed happiness and anxiety levels were measured. Dastageeri, Rodrigues, and Silberer [13] outlined the power of modelling emotions with ML techniques while cycling. However, their findings indicated that the prediction of negative emotions was more accurate (85.8%) than the prediction of positive emotions (69.8%). Joo et al. [14] predicted satisfaction with the cycling environment using a binary logistic regression and a support vector machine. Riding dynamics were proven to be suitable predictors providing prediction accuracy of 75.5% (support vector machine) and 68.4%. Moreover, their research showed that the support vector machine outperformed the binary logistic regression by 7%.
Explainable AI (XAI) enables the user to understand the inner process of a model [11]. The aim of XAI is to reveal how the input variables contribute to the overall output of the model. XAI is a post hoc approach that determines information from models that have already been trained [12]. According to Adadi and Berrada [11], there are four main reasons for using XAI: “explain to justify”, “explain to control”, “explain to improve” and “explain to discover”. The main motivations for using XAI in transport are improving interpretability [10,53], increasing trust [54], gaining understanding [53,55] and transparency [56]. The knowledge gained can be used to improve a system or its usability [53,55]. In transport, XAI has been applied to enhance sustainable transport exploring factors of electric vehicle usage [17], understanding travel mode choice [10] and improving the user experience of bike-sharing [19]. Another application domain of XAI is to increase trust in automated driving by explaining the vehicle’s decision making process [54]. To prevent road traffic injuries, XAI has been used to identify risk factors for road traffic injuries [18].
SHAP is a popular XAI method that is theoretically founded through game theory [57]. SHAP belongs to the additive feature attribution methods and allows both local and global interpretation. A SHAP value corresponds to the average impact of a feature, calculated from different feature coalitions, on the model output. SHAP values are determined by an explanation model g ( z ) that locally approximates the original ML model f ( x ) . The explanation model is an interpretable model, which corresponds in its simplest form to a linear regression model:
g ( z ) = ϕ 0 + j = 1 M F e a t ϕ j z j .
The model parameters are ϕ R in Equation (1). The feature coalition subset that serves as input to the explanation model is displayed by z { 0 , 1 } M F e a t with M F e a t corresponding to the number of features. A mapping function h x ( z ) transforms the entries of z into a valid ML model input, where ones are mapped to the original and zeros to averaged feature values.
For each feature coalition subset, the parameters of the explanation model are tuned to minimise a weighted loss function. The loss function compares the model output of the explanation model with the original model. The loss function has the form
L S H A P ( f , g , π x ) = z M D a t a [ f ( h x ( z ) ) g ( z ) ] 2 π x ( z ) .
Predictions are weighted with a weighting kernel π x to evaluate the distance between the instance z and the original model input x i . By minimising the weighting kernel in the loss function, the resulting SHAP values, which are the parameters of the explanation function g ( z ) , are mathematically consistent. The local interpretation of the SHAP values explains the impact of a feature instance on a single prediction. By aggregating, i.e., averaging or summing, the SHAP values of all individual predictions, the contribution of a feature to the model output can be interpreted globally [58].

3. Methods

The research scheme in Figure 1 illustrates our methodological approach including data collection in a cycling study, cluster analysis to derive rider types and Gaussian process regression (GPR) to predict riding experience. The following sections explain our methods in detail. Data preprocessing, statistical analysis, hierachical cluster analysis and Gaussian process regression including their visualisation were carried out in Matlab R2020b version: 9.13.0 [59]. The feature importance analysis was performed in Python using the SHAP package [21]. The cycling study was approved by the ethics committee of the associated institution and was conducted in accordance with the Declaration of Helsinki.

3.1. Cycling Study

In the following three subsections, the study is described, especially the participant characteristics, the material and instruments and the procedure.

3.1.1. Participants

A total of 55 participants, recruited via flyers, personal contacts and social media, took part in the cycling study. Five participants had to be excluded from data analysis due to technical issues during data logging. Participation criteria were a healthy state, an active cycling history and basic experience in e-bike riding. All participants gave written consent to the participation agreement and data privacy policy.

3.1.2. Materials and Instruments

The cycling study took place on a five-kilometer route in a rural area near Stuttgart in autumn 2022. The route was divided into four sections, which differed in their path type, underground and slope. Table 1 and Figure 2 give a detailed overview of the route.
We provided two identical trekking e-bikes, which exclusively differed in their frame size. They were equipped with a Bosch Smart System Performance Line CX providing a weak, a medium and a strong motor assistance. The motor assistance is sensitive to rider torque and rider cadence, resulting in a provided motor power. The e-bikes fulfil the road traffic licensing regulations of Germany (§63a, StVZO), which allow motor assistance up to 25 km/h.
The subjective perception of the riding experience was evaluated with a questionnaire developed by Laqua et al. [36]. The questionnaire is based on the model Joy and Convenience in Activities [61]. The model attributes subjective experiences to the intensity and motivation of action [62]. According to the model, extrinsically motivated actions evoke comfort when relaxed and discomfort when stressed. Intrinsically motivated actions lead to high activation when excited and contrary low activation when bored. On a seven-point semantic differential scale, participants had to indicate the activation (boring/exciting) and comfort level (uncomfortable/comfortable) of the ride. Laqua et al. [36] indicated a high level of both activation and comfort as a high level of riding experience. A low level of activation combined with a high level of comfort was considered as neutral riding experience. Discomfort, however, resulted in a low riding experience. The questionnaire was provided on a smartphone app. The items are displayed in Table 2.
In related work, the objective measurement of riding experience is mainly based on physiological data [5]. However, there is insufficient proof given that physiological parameters can robustly explain the subjective experience while cycling [35,63]. As the prediction of riding experience with riding dynamics parameters already showed promising results [30,36,42], we included rider behaviour, motor power and riding dynamics data in the analysis. We recorded objective parameters with a sample rate of 100 Hz using a CAN-data logger. Riding dynamic parameters were measured with a intertial measurement unit (IMU) installed in the e-bike motor providing three-axis acceleration and gyroscope measurements. The calculation of the velocity of the ride was based on distance measurements by a single-pulse incremental encoder. Bicycle dynamics were estimated with a constrained extended Kalman filter based on state estimation for bicycles [64].

3.1.3. Procedure

In total, the experiment lasted two hours. First, we explained the scope of the study, the procedure and the questionnaires to the participants. We collected data related to demographics, riding skills and riding style. According to the body height, we selected the frame size and adjusted the saddle height. During an initial ride on the test track, participants were accustomed to the e-bike, the questionnaire and the track. The study was prepared as a within-subject-design where participants cycled three times on the test track, being exposed to a different condition in each test ride: weak, moderate or strong motor assistance. The assist mode was set by the experimenter and was not adjusted during a pass. The experimenter always accompanied the participant. Navigation was provided by a smartphone mounted on the handlebar. At the end of each section, participants stopped to evaluate the riding experience of the previous section in the smartphone questionnaire. To prevent fatigue effects, a regeneration break was scheduled between test rides. We excluded sequence effects by sequence randomisation. All participants were instructed to ride in their habitual way. All test rides took place under dry weather conditions and daylight. The temperature was between 12 °C and 18 °C. As a token of gratitude, participants received a bicycle accessory.

3.2. Hierarchical Cluster Analysis

To identify rider types within the participants, we performed a hierarchical cluster analysis [65]. The coefficients of the Pearson correlations between riding experience and objective data (rider power, speed, motor power) were the input parameters of the cluster analysis. The Ward Method was selected as the distance metric, merging clusters with the lowest increase in variance [65]. Using the heterogeneity index, we determined the optimal number of clusters.

3.3. Statistical Analysis

We analysed demography (descriptive analysis), the riding experience (Kruskal–Wallis test), rider behaviour characteristics (one-way ANOVA) and the influence of objective parameters on riding experience (correlation analysis), highlighting similarities and differences between the rider types.

3.4. Gaussian Process Regression

In the following three subsections, the Gaussian process regression is described, especially Gaussian Processes, the feature selection and the model selection.

3.4.1. Gaussian Processes

The Gaussian process regression (GPR) is a probabilistic non-parametric regression that can model non-linear systems. The regression function f ( x ) is determined by a Gaussian probability distribution of an infinite number of functions. Gaussian processes are defined by a mean function m and a covariance function k:
f ( x ) G P ( m ( x ) , k ( x , x ) ) .
Common covariance functions are the Squared Exponential kernel, the Matérn kernel, the Exponential kernel and the Rational Quadratic kernel. The covariance function and its hyperparameters characteristic length scale l and signal variance σ f 2 influence the smoothness and periodicity of the regression function. The hyperparameter noise variance σ n 2 estimates the level of noise in the data [22].
For each rider type, we trained an overall GPR model, including all sections, and a GPR model for the steep uphill section, referred to as the uphill GPR model.

3.4.2. Model Performance

The model performance was assessed using the R 2 -value and the root-mean-squared error (RMSE). Model performance was determined by five-fold cross-validation. Cross-validation is particularly suitable for small data sets, allowing all available data to be used iteratively without the risk of overfitting [66]. The data were divided into five equal partitions. Four groups were used to train the model while a held-out group was used to validate the model. The process was repeated for all combinations. The RMSE score calculated during validation was averaged across all partitions and presented with confidence intervals.

3.4.3. Feature Selection

Feature selection serves the goal to find features that provide good model performance without overfitting the data [67]. We extracted statistical features from the sensor data, excluding physically incoherent features. To determine an optimal subset of features, we performed a forward sequential feature selection algorithm that calculates the GPR model sequentially [67]. In each iteration, the feature that improves the model performance best was added to the model. The subset of features providing the lowest cross-validated RMSE was finally selected as the optimal feature set.

3.4.4. Model Selection

The goal of the model selection is to select a covariance function that fits the data best [22]. The selection of a covariance function influences the form of the posterior function, as the kernel contains information about the smoothness and the periodicity of a function [22]. A commonly used kernel is the Squared Exponential kernel, being characteristic for simple handling and low computational costs [68]. We performed the forward sequential feature selection algorithm with different covariance functions, choosing the kernel that provided the best overall model performance in terms of cross-validated RMSE. Taking the comparable small data set into account, we set the noise variance σ n 2 to s d ( y ) / 2 , aiming to avoid overfitting. The length-scale l and the signal variance σ f 2 were optimised through maximising the marginal log likelihood [22].

3.4.5. Feature Importance

We analysed the feature importance for each rider type using the SHAP Python Package [21]. In the testing phase, during cross-validation, a SHAP value was calculated for each feature and each instance of the data set. The aggregated SHAP values were subsequently displayed in a beeswarm plot. High positive or negative SHAP values indicate a high impact, whereas low SHAP values indicate a low impact on the riding experience. In the beeswarm plot, features are ranked from high to low according to their contribution to the model output. Positive SHAP values indicate a positive impact while negative SHAP values indicate a negative impact of a feature on riding experience.

4. Results

4.1. Hierarchical Cluster Analysis

The correlation analysis revealed a high variability of the correlations between objective data and riding experience. As visualised in Figure 3a, the Pearson correlation coefficients range between 0.87 < r > 0.66 (rider power), 0.35 < r > 0.79 (speed) and 0.56 < r > 0.55 (motor power). With the Pearson correlation coefficients as input parameters of the cluster analysis, we identified four clusters in the dendrogram in Figure 3c, grouping riders to rider type 1 (RT1), rider type 2 (RT2), rider type 3 (RT3) and rider type 4 (RT4). The dendrogram shows that heterogeneity differs between clusters: RT1 and RT2 are most similar while RT4 has the strongest heterogeneity to other rider types. Figure 3b shows the corresponding clusters plotted over the input parameters of the cluster analysis.

4.2. Statistical Analysis

4.2.1. Rider and Rider Behaviour Characteristics

We identified four rider types through hierarchical clustering. Rider type 1 (RT1) and rider type 3 (RT3) consisted of 15 participants, respectively, whereas the remaining 20 participants were evenly allocated to rider type 2 (RT2) and rider type 4 (RT4). Most female participants were grouped to RT1, representing approximately 50% of the group, whereas no female participant could be found in RT2. The mean age of participants did not significantly differ between rider types ( C h i s q u a r e ( 3 ) = 3.06 ,   p = 0.38 ). We observed a similar distribution of self-assessed riding style for RT1/RT3 and RT2/RT4. On average, the riding style of RT3 and RT4 was more sportive compared to the riding style of RT1 and RT3. However, no participant reported a comfortable riding style. The conducted one-way ANOVA revealed no significant differences of rider cadence ( F ( 3 , 46 ) = 1.18 ,   p = 0.33 ), speed ( F ( 3 , 46 ) = 2.33 ,   p = 0.09 ), heart rate ( F ( 3 , 46 ) = 0.55 , p = 0.65 ) and acceleration ( F ( 3 , 46 ) = 2.06 ,   p = 0.11 ). A significant difference of transmitted rider torque ( F ( 3 , 46 ) = 4.29 , p < 0.01 ) was determined between RT1 and RT2. Table 3 gives a detailed overview.

4.2.2. Riding Experience

According to the conducted Kruskal–Wallis tests, riding experience differed significantly between rider types in the downhill section ( C h i s q u a r e ( 3 ) = 13.19 ,   p < 0.001 ), the steep uphill section ( C h i s q u a r e ( 3 ) = 22.60 ,   p < 0.001 ), the moderate uphill section ( C h i s q u a r e ( 3 ) = 18.81 ,   p < 0.001 ) and the hilly section ( C h i s q u a r e ( 3 ) = 18.47 ,   p < 0.001 ). The performed Dunn–Bonferroni post hoc tests revealed a significantly higher riding experience for RT4 in the steep uphill section ( p = 0.04 , p < 0.001 ), the moderate uphill section ( p = 0.08 ,   p < 0.001 ) and the hilly section ( p = 0.03 ,   p < 0.001 ). The riding experience of RT2 and RT3 did not differ significantly in any section ( p > 0.05 ). RT1’s riding experience differed from RT2’s and RT3’s in the downhill section ( p = 0.01 ), from RT4’s in the steep and moderate uphill sections ( p = 0.08 ,   p < 0.01 ) and from RT2’s in the hilly section ( p < 0.01 ). Figure 4a gives a graphical overview.
The correlation of riding experience and objective data differed between rider types. According to Cohen [69], RT1’s riding experience was characterised by a strong negative correlation to rider power and a strong positive correlation to speed and riding experience. Motor power, however, did not directly impact RT1’s riding experience. RT2’s riding experience was distinguished by a moderate negative correlation to both rider power and motor power and a strong positive correlation to bicycle speed. RT3’s riding experience was moderately negatively correlated to rider power, moderately to strongly positively correlated to speed and weakly positively correlated to motor power. For RT4, rider power and bicycle speed had no direct impact on riding experience, while motor power correlated moderately positively with riding experience. The boxplots in Figure 4b visualise the observations.

4.3. Gaussian Process Regression

4.3.1. Feature Selection

Depending on the rider type, we observed that the best performance in terms of lowest mean RMSE and lowest deviation of RMSE was achieved with up to six features. The GPR models performed best with different feature coalitions depending on rider type and model. The feature importance analysis provides information about the impact of each feature on the model output. All selected features were sorted to the categories motor power, rider behaviour, longitudinal dynamics and lateral dynamics displayed in Table 4.

4.3.2. Model Performance

Applied to our data, the GPR performed best with the Squared Exponential kernel. Table 5 summarises the model performance and the R-squared values for all GPR models calculated with the Squared Exponential kernel. The overall GPR model performed best for RT1, indicating a low cross-validated RMSE with a low standard deviation. The overall GPR model of RT3 also performed well but was subject to higher uncertainty. RT1’s and RT3’s prediction models were able to explain 60% and 61% of the data variance, respectively. The calculated models for RT2 and RT4 achieved higher RMSE values and were only able to account for 37% and 27% of the data variance, respectively. Applying GPR on data collected in the steep uphill section, we observed lower RMSE values for all rider types. Due to the smaller data set, the uncertainty of prediction power increased, however. The regression models scored well for RT1, RT3 and RT4, explaining 70% (RT1), 80% (RT3) and 64% of the data variance. However, the prediction model of RT2 could only account for 27% of the data variance.

4.4. Feature Importance Analysis

The feature importance was analysed for each rider type based on SHAP values. Figure 5 displays the SHAP values for features selected through the fowards sequential feature selection algorithm.

4.4.1. Rider Type RT1

In the overall GPR model, the most important predictor of RT1’s riding experience was the mean speed, followed by the mean motor power and the pitch angle. Speed lower than the rider’s mean speed had a stronger impact on the riding experience than speed higher than the rider’s mean. A positive deviation of the rider’s mean speed contributed positively to the riding experience, while a negative deviation reduced the riding experience. Motor power above and pitch angles below the mean affected the riding experience positively. Moreover, both stronger accelerations and decelerations influenced the riding experience positively. However, an increase in rider cadence deviation affected the riding experience negatively. Rider performance such as rider torque did not impact the riding experience. In the uphill GPR model, motor power features were observed as most important. An increase in motor power and its deviation contributed positively to the riding experience. A heart rate above the mean affected riding experience also positively.

4.4.2. Rider Type RT2

The forward sequential feature selection revealed only features that were classified as riding dynamic parameters as meaningful predictors. Among them, the mean speed stood out as the strongest, followed by the pitch angle, the deviation of the roll angle and the braking duration. Equally to RT1, a positive deviation of the mean speed and the pitch angle increased the riding experience. A positive braking duration also affected the riding experience positively. Roll angles below the mean improved tendentially the riding experience in both the overall GPR model and the uphill GPR model. In the uphill GPR model, the mean acceleration was the most important predictor, followed by the mean speed.

4.4.3. Rider Type RT3

Rider torque stood out as the strongest predictor of riding experience, affecting riding experience negatively when above the rider’s mean torque. The increase in motor power deviation, mean speed and mean motor power, however, contributed positively to the riding experience. Strong deceleration and high deviation of the rider cadence impacted the riding experience negatively. In the uphill GPR model, the mean motor power was observed as the most important predictor, followed by the mean rider torque. According to the SHAP values, motor power above and rider torque below the mean lead to positive riding experience in the uphill section.

4.4.4. Rider Type RT4

The overall GPR model reached the lowest RMSE score with motor power deviation, mean speed and deceleration as predictors. A deviation of motor power above the mean, speed around the mean and deceleration below the mean impacted the riding experience positively. Neither rider behaviour nor motor power contributed to the predictability of the overall GPR model. In the uphill section model, however, motor power was identified as the strongest predictor of the riding experience. In the uphill section, we observed that motor power and speed above the rider’s mean influenced the riding experience positively. Heart rate and braking duration below the mean, however, affected riding experience negatively.

5. Discussion

We presented an approach to predict riding experience with objective sensor data and subsequently explored the impact with SHAP values. Our results proved that measurement methods available in everyday cycling can already provide valuable information about the riding experience. We investigated motor power, rider behaviour and riding dynamics as predictors of the riding experience. We identified that predictors and their influence on the riding experience differed between rider types. In the following section, we first discuss the performance of the regression models. Subsequently, we described the rider types based on our findings. Finally, we compare revealed influences to related research.

5.1. Predictability

The GPR models of RT1 and RT3 showed good accuracy, while the overall GPR models of RT2 and RT4 allowed only weak predictability. The uphill GPR models showed good accuracy, with the exception of RT2. The accuracy of the calculated GPR models revealed that the predictability of riding experience differed between rider types. We identified several possible reasons for our observations:
We observed that riding experience differed between rider types while rider behaviour did not. We also identified that the importance of the measured data differed strongly between rider types. Through feature importance analysis, we identified that RT1 and RT3 were more strongly affected by the measured data. We conclude that the measurement of additional objective data could improve the prediction of riding experience.
We also measured more positive than negative riding experience, especially for RT4. We therefore conclude that the weak predictability of RT4’s riding experience might lay in the fact that RT4 perceived constantly positive riding experience independent of the given conditions. Possible explanations are a low potential for negative experience of the selected route, a social desirability bias in self-reported riding experience and the chosen convenience sample that is likely to have a positive attitude towards cycling. The selection of a route with greater potential for all states of riding experience and the consideration of fatigue effects would further enrich the data set.
The present approach used e-bike sensor data as a source of predictors of riding experience. However, subjective riding experience is also influenced by environmental factors such as topography [30], road surface [30], cycling infrastructure [51] and noise conditions [51]. To further improve the prediction of riding experience, objectively measurable environmental parameters should also be considered.
However, models with weak prediction power can still provide information about the impact of factors influencing riding experience. Ozili [70] states that when predicting human behaviour, resulting R-squared values above 0.10 already allow under certain conditions to interpret the impact of a predictor on the model output. This approach is justified by the difficulty of accurately predicting human behaviour, as human behaviour underlays constant changes and depends on a variety of latent variables [70].

5.2. Impact of Predictors on Rider Types

RT1’s riding experience was mainly impacted by riding dynamics and motor power. We revealed that a speed reduction had a strong negative impact on the riding experience while negative pitch angles and increased riding dynamics affected riding experience positively. We conclude that RT1 preferred downhill sections over uphill sections. Increasing motor power and heart rate had a positive effect on RT1’s riding experience. We therefore derive that both motor power and rider input could compensate a decrease in riding experience caused by reduced riding dynamics in uphill sections. We conclude that RT1 are dynamic-oriented riders preferring riding scenarios with speed potential such as downhill sections and high and dynamic motor support, especially in uphill sections.
RT2’s riding experience was solely influenced by riding dynamics. Neither motor power nor rider behaviour impacted RT2’s riding experience. The positive effect of low pitch angles and increasing braking duration revealed the preference for dynamic riding situations. In contrast to RT1, RT2’s riding experience could not be improved through motor assistance. We therefore conclude that RT2 are downhill-oriented riders who enjoy dynamic rides without motor assistance.
RT3’s riding experience was impacted by rider behaviour, motor power and riding dynamics. We observed a preference for high and dynamic riding support, as increasing motor power and speed contributed positively to the riding experience. More importantly, reduced rider torque led to an optimal riding experience. Moreover, the negative effect of rider cadence deviations below the mean showed that RT3 preferred a continuous riding style. We therefore conclude that RT3 are comfort-oriented riders who enjoy motor support to ride faster but with less exertion.
RT4’s riding experience was impacted by riding dynamics and motor power. The positive contribution of motor power deviation, average speed and low decelerations to riding experience revealed that those of RT4 preferred a dynamic and continuous riding style. Additionally, motor support was appreciated to reduce rider input in the uphill section. We therefore conclude that RT4 are endurance-oriented riders who try to avoid peak load.
The impact of the predictors on the riding experience differed between rider types. Compared to the other rider types, RT4’s riding experience was influenced by fewer predictors. In addition, the overall importance of the predictors differed between rider types. We identified a dynamic-oriented, a downhill-oriented, a comfort-oriented and an endurance-oriented rider type. The feature importance analysis showed that the rider types weighted the contributors to riding experience differently. While both RT1 and RT2 focused on dynamic riding, motor power however did not affect RT2’s riding experience. Comfort aspects of ebike riding, such as reduced exertion, solely played an important role for RT3. Interestingly, motor power gained importance in the uphill section, influencing strongly the riding experience of RT1, RT3 and RT4. The reason for the different influence of predictors might lay in personality traits, which affect the perception of riding experience such as riding skills [30], riding style [71], risk behaviour [72] and attitude towards cycling [73]. Moreover, sociodemographics such as age [25] or gender [37] also influence the riding experience. We therefore assume that the different distribution of sociodemographic characteristics among the rider types also influenced our results. These observations confirm the heterogeneity of cyclists, highlighting the importance of differentiating predictions by rider type.

5.3. Impact of Predictors in Related Research

We identified speed as a meaningful predictor of the riding experience. These observations are in line with other studies that showed that higher speed through motor assistance is perceived as more enjoyable [33], more convenient [23,26] and more comfortable [30]. We observed that RT1 and RT2 preferred riding scenarios with speed potential. This observation may be attributed to the higher risk engagement in downhill sections, which was observed as a criterion for pleasure by Roberts, Jones, and Brooks [72]. Motor power was confirmed as another important predictor influencing RT1’s, RT3’s and RT4’s riding experience, especially in uphill sections. Plazier, Weitkamp, and van den Berg [23] also emphasised the possibility to mitigate negative experience in cycling through motor assistance. Exertion had a strong negative effect on RT3’s riding experience and a weak negative effect on RT4’s riding experience. The resulting positive effect of reduced exertion through motor assistance was also investigated in former studies, confirming that less exertion is perceived as more comfortable, leading to higher enjoyment [33,43]. As exertion had a positive effect on RT1’s and no effect on RT2’s riding experience, we assume that for these rider types, comfort while cycling does not matter.

6. Conclusions

We introduced a method to explore user experience in transport with explainable AI (XAI). For the application of e-bikes, we predicted the riding experience on e-bikes with sensor data using Gaussian process regression (GPR). Taking the heterogeneity of e-bike riders into account, we computed GPR models for different rider types identified by hierarchical cluster analysis. Applied to the e-bike use case, we demonstrated that SHAP adds value to the understanding of user experience in transport. SHAP provided valuable insights into the GPR black-box model by identifying meaningful predictors and their impact on the model output. We identified sensor data related to motor power, rider behaviour and riding dynamics as meaningful predictors of the riding experience on e-bikes. Furthermore, SHAP enabled a profound interpretation of the impact of the predictors, revealing differences between rider types. From the feature importance analysis, we derived a dynamic-oriented, a downhill-oriented, a comfort-oriented and an endurance-oriented rider type. The gained knowledge of the interdependencies between model input and output contributed to a better understanding of the rider experience on e-bikes. We therefore conclude that SHAP can be applied to explore the user experience in transport. The use of XAI allows to improve modes of transport in terms of user experience, providing powerful methods to explore factors influencing the user experience. Although the sample of 55 e-bike riders is considered large for field studies, the data set is considered small for ML applications. To increase the robustness of the prediction models against data outliers, more data should be collected in future work. Furthermore, the use of both subjective and objective factors as model input parameters could provide a more holistic understanding of the user experience in transport. Our research should be regarded as a proof of concept, demonstrating the potential of XAI to shed light onto the user experience in transport. However, the application of the proposed method to other transport domains should be investigated in future work.

Author Contributions

Conceptualization, A.L., J.S., J.P. and M.M.; Methodology, A.L., J.S., J.P. and M.M.; Formal analysis, A.L.; Investigation, A.L.; Data curation, A.L.; Writing—original draft, A.L.; Visualization, A.L.; Supervision, M.M. All authors have read and agreed to the published version of the manuscript.

Funding

This research received no external funding. The APC was funded by the Robert Bosch GmbH.

Institutional Review Board Statement

The study was conducted in accordance with the Declaration of Helsinki, and approved by the Ethics Committee of Psychology at the Faculty of Humanities and Social Sciences/Helmut Schmidt University Hamburg on 19/09/23.

Informed Consent Statement

Informed consent was obtained from all subjects involved in the study.

Data Availability Statement

The authors do not have permission to share data.

Conflicts of Interest

The authors declare no conflict of interest.

References

  1. Pastori, E.; Brambilla, M.; Maffii, S.; Vergnani, R.; Gualandi, E.; Skinner, I. Research for TRAN Committee—Modal Shift in European Transport: A Way Forward; European Parliament, Policy Department for Structural and Cohesion Policies: Brussels, Belgium, 2018. [Google Scholar] [CrossRef]
  2. Bier, L.; Joisten, P.; Abendroth, B. Warum nutzt der Mensch bevorzugt das Auto als Verkehrsmittel? Eine Analyse zum erlebten Fahrspaß unterschiedlicher Verkehrsmittelnutzer. Z. Arbeitswissenschaft 2019, 73, 58–68. [Google Scholar] [CrossRef]
  3. Adams, S.A. The Effect of Social Desirability and Social Approval on Self-Reports of Physical Activity. Am. J. Epidemiol. 2005, 161, 389–398. [Google Scholar] [CrossRef]
  4. Scherer, K.R. The dynamic architecture of emotion: Evidence for the component process model. Cogn. Emot. 2009, 23, 1307–1351. [Google Scholar] [CrossRef]
  5. Lim, T.; Kalra, A.; Thompson, J.; Odgers, J.C.; Beck, B. Physiological measures of bicyclists’ subjective experiences: A scoping review. Transp. Res. Part Traffic Psychol. Behav. 2022, 90, 365–381. [Google Scholar] [CrossRef]
  6. Tullis, T.; Albert, B. Measuring the User Experience; Elsevier: Amsterdam, The Netherlands, 2013. [Google Scholar]
  7. Kudritzki, D. Möglichkeiten der Objektiverung subjektiver Beurteilungen des Fahrzeugverhaltens. In Subjektive Fahreindrücke Sichtbar Machen: Korrelation Zwischen CAE-Berechnung, Versuch und Messung von Versuchsfahrzeugen und -Komponenten; Becker, K., Ed.; OCLC: Renningen, Germany, 2000; p. 634088809. [Google Scholar]
  8. Field, A.P.; Miles, J.; Field, Z. Discovering Statistics Using R; Sage OCLC: London, UK; Thousand Oaks, CA, USA, 2012. [Google Scholar]
  9. Ray, S. A Quick Review of Machine Learning Algorithms. In Proceedings of the 2019 IEEE International Conference on Machine Learning, Big Data, Cloud and Parallel Computing (COMITCon), Faridabad, India, 14–16 February 2019; pp. 35–39. [Google Scholar]
  10. Tamim Kashifi, M.; Jamal, A.; Kashefi, M.S.; Almoshaogeh, M.; Rahman, S.M. Predicting the travel mode choice with interpretable machine learning techniques: A comparative study. Travel Behav. Soc. 2022, 29, 279–296. [Google Scholar] [CrossRef]
  11. Adadi, A.; Berrada, M. Peeking Inside the Black-Box: A Survey on Explainable Artificial Intelligence (XAI). IEEE Access 2018, 6, 52138–52160. [Google Scholar] [CrossRef]
  12. Dosilovic, F.K.; Brcic, M.; Hlupic, N. Explainable Artificial Intelligence: A Survey. In Proceedings of the 2018 IEEE 41st International Convention on Information and Communication Technology, Electronics and Microelectronics (MIPRO), Opatija, Croatia, 21–25 May 2018; pp. 210–215. [Google Scholar]
  13. Dastageeri, H.; Rodrigues, P.; Silberer, J. Happy or scared—Detecting emotions of pedelec drivers in urban areas. Isprs Ann. Photogramm. Remote Sens. Spat. Inf. Sci. 2019, IV-4/W9, 27–33. [Google Scholar] [CrossRef]
  14. Joo, S.; Oh, C.; Jeong, E.; Lee, G. Categorizing bicycling environments using GPS-based public bicycle speed data. Transp. Res. Part Emerg. Technol. 2015, 56, 239–250. [Google Scholar] [CrossRef]
  15. Schoeggl, P.; Ramschak, E. Vehicle Driveability Assessment Using Neural Networks for Development, Calibration and Quality Tests; SAE International: Detroit, MI, USA, 2000. [Google Scholar]
  16. Liu, Z.; Lyu, C.; Huo, J.; Wang, S.; Chen, J. Gaussian Process Regression for Transportation System Estimation and Prediction Problems: The Deformation and a Hat Kernel. IEEE Trans. Intell. Transp. Syst. 2022, 23, 22331–22342. [Google Scholar] [CrossRef]
  17. Bas, J.; Zou, Z.; Cirillo, C. An interpretable machine learning approach to understanding the impacts of attitudinal and ridesourcing factors on electric vehicle adoption. Transp. Lett. 2023, 15, 30–41. [Google Scholar] [CrossRef]
  18. Khattak, A.; Almujibah, H.; Elamary, A.; Matara, C.M. Interpretable Dynamic Ensemble Selection Approach for the Prediction of Road Traffic Injury Severity: A Case Study of Pakistan’s National Highway N-5. Sustainability 2022, 14, 12340. [Google Scholar] [CrossRef]
  19. Onen, S.; Ggaliwango, M.; Mugabi, S.; Nabende, J. Interpretable Machine Learning for Intelligent Transportation in Bike-Sharing. In Proceedings of the 2023 IEEE 2nd International Conference on Smart Technologies and Systems for Next Generation Computing (ICSTSN), Villupuram, India, 21–22 April 2023; pp. 1–6. [Google Scholar]
  20. CONEBI. European Bicycle Industry and Market Profile. 2022. Available online: https://www.conebi.eu/bicycle-and-e-bike-sales-continue-to-grow-reaching-record-levels/ (accessed on 31 October 2022).
  21. Lundberg, S.M. SHAP—GitHub Repository. 2018. Available online: https://github.com/shap/shap (accessed on 27 July 2023).
  22. Rasmussen, C.E.; Williams, C.K.I. Gaussian processes for machine learning. In Adaptive Computation and Machine Learning; MIT Press: Cambridge, MA, USA, 2006. [Google Scholar]
  23. Plazier, P.A.; Weitkamp, G.; Berg, A.E.v. “Cycling was never so easy!” An analysis of e-bike commuters’ motives, travel behaviour and experiences using GPS-tracking and interviews. J. Transp. Geogr. 2017, 65, 25–34. [Google Scholar] [CrossRef]
  24. Ling, Z.; Cherry, C.; MacArthur, J.; Weinert, J. Differences of Cycling Experiences and Perceptions between E-Bike and Bicycle Users in the United States. Sustainability 2017, 9, 1662. [Google Scholar] [CrossRef]
  25. Johnson, M.; Rose, G. Extending life on the bike: Electric bike use by older Australians. J. Transp. Health 2015, 2, 276–283. [Google Scholar] [CrossRef]
  26. MacArthur, J.; Dill, J.; Person, M. Electric Bikes in North America: Results of an Online Survey. Transp. Res. Rec. J. Transp. Res. Board 2014, 2468, 123–130. [Google Scholar] [CrossRef]
  27. Baptista, P.; Pina, A.; Duarte, G.; Rolim, C.; Pereira, G.; Silva, C.; Farias, T. From on-road trial evaluation of electric and conventional bicycles to comparison with other urban transport modes: Case study in the city of Lisbon, Portugal. Energy Convers. Manag. 2015, 92, 10–18. [Google Scholar] [CrossRef]
  28. Fishman, E.; Cherry, C. E-bikes in the Mainstream: Reviewing a Decade of Research. Transp. Rev. 2016, 36, 72–91. [Google Scholar] [CrossRef]
  29. Edge, S.; Dean, J.; Cuomo, M.; Keshav, S. Exploring e-bikes as a mode of sustainable transport: A temporal qualitative study of the perspectives of a sample of novice riders in a Canadian city: E-bikes as sustainable transport. Can. Geogr. Géographe Can. 2018, 62, 384–397. [Google Scholar] [CrossRef]
  30. Feizi, A.; Oh, J.S.; Kwigizile, V.; Joo, S. Cycling environment analysis by bicyclists’ skill levels using instrumented probe bicycle (IPB). Int. J. Sustain. Transp. 2020, 14, 722–732. [Google Scholar] [CrossRef]
  31. Hein, M.; Boyen, J.; Stenner, H.T.; Finkel, A.; Protte, G.; Kück, M.; Tegtbur, U. Everyday Pedelec Use and its Effect on Meeting Physical Activity Guidelines. Med. Sci. Sport. Exerc. 2017, 49, 43. [Google Scholar] [CrossRef]
  32. Langford, B.C.; Cherry, C.R.; Bassett, D.R.; Fitzhugh, E.C.; Dhakal, N. Comparing physical activity of pedal-assist electric bikes with walking and conventional bicycles. J. Transp. Health 2017, 6, 463–473. [Google Scholar] [CrossRef]
  33. Popovich, N.; Gordon, E.; Shao, Z.; Xing, Y.; Wang, Y.; Handy, S. Experiences of electric bicycle users in the Sacramento, California area. Travel Behav. Soc. 2014, 1, 37–44. [Google Scholar] [CrossRef]
  34. Xing, Y.; Volker, J.; Handy, S. Why do people like bicycling? Modeling affect toward bicycling. Transp. Res. Part Traffic Psychol. Behav. 2018, 56, 22–32. [Google Scholar] [CrossRef]
  35. Lim, T.; Thompson, J.; Tian, L.; Beck, B. A transactional model of stress and coping applied to cyclist subjective experiences. Transp. Res. Part Traffic Psychol. Behav. 2023, 96, 155–170. [Google Scholar] [CrossRef]
  36. Laqua, A.; Schnee, J.; Pletinckx, J.; Meywerk, M. Identification of factors influencing the riding experience on e-mountain bikes: An analysis of the rider-bicycle interaction. Transp. Res. Part Traffic Psychol. Behav. 2023, 98, 61–72. [Google Scholar] [CrossRef]
  37. Haustein, S.; Møller, M. E-bike safety: Individual-level factors and incident characteristics. J. Transp. Health 2016, 3, 386–394. [Google Scholar] [CrossRef]
  38. Jackson, S.A.; Marsh, H.W. Development and Validation of a Scale to Measure Optimal Experience: The Flow State Scale. J. Sport Exerc. Psychol. 1996, 18, 17–35. [Google Scholar] [CrossRef]
  39. Fitch, D.T.; Carlen, J.; Handy, S.L. What makes bicyclists comfortable? Insights from a visual preference survey of casual and prospective bicyclists. Transp. Res. Part Policy Pract. 2022, 155, 434–449. [Google Scholar] [CrossRef]
  40. Paige Willis, D.; Manaugh, K.; El-Geneidy, A. Uniquely satised: Exploring cyclist satisfaction. Transp. Res. Part F Traffic Psychol. Behav. 2013, 18, 136–147. [Google Scholar] [CrossRef]
  41. Leger, S.J.; Dean, J.L.; Edge, S.; Casello, J.M. “If I had a regular bicycle, I wouldn’t be out riding anymore”: Perspectives on the potential of e-bikes to support active living and independent mobility among older adults in Waterloo, Canada. Transp. Res. Part Policy Pract. 2019, 123, 240–254. [Google Scholar] [CrossRef]
  42. Joo, S.; Oh, C. A novel method to monitor bicycling environments. Transp. Res. Part Policy Pract. 2013, 54, 1–13. [Google Scholar] [CrossRef]
  43. Sperlich, B.; Zinner, C.; Hébert-Losier, K.; Born, D.; Holmberg, H.-C. Biomechanical, cardiorespiratory, metabolic and perceived responses to electrically assisted cycling. Eur. J. Appl. Physiol. 2012, 112, 4015–4025. [Google Scholar] [CrossRef] [PubMed]
  44. Kazemzadeh, K.; Camporeale, R.; D’Agostino, C.; Laureshyn, A.; Hiselius, L.W. Same questions, different answers? A hierarchical comparison of cyclists’ perceptions of comfort: In-traffic vs. online approach. Transp. Lett. 2021, 13, 531–539. [Google Scholar] [CrossRef]
  45. Oehl, M.; Brandenburg, S.; Huemer, A.K. Cyclists’ anger experiences in traffic: The Cycling Anger Scale. Transp. Res. Part Traffic Psychol. Behav. 2019, 62, 564–574. [Google Scholar] [CrossRef]
  46. Dozza, M.; Werneke, J. Introducing naturalistic cycling data: What factors influence bicyclists’ safety in the real world? Transp. Res. Part Traffic Psychol. Behav. 2014, 24, 83–91. [Google Scholar] [CrossRef]
  47. Doorley, R.; Pakrashi, V.; Byrne, E.; Comerford, S.; Ghosh, B.; Groeger, J.A. Analysis of heart rate variability amongst cyclists under perceived variations of risk exposure. Transp. Res. Part Traffic Psychol. Behav. 2015, 28, 40–54. [Google Scholar] [CrossRef]
  48. Beck, B.; Perkins, M.; Olivier, J.; Chong, D.; Johnson, M. Subjective experiences of bicyclists being passed by motor vehicles: The relationship to motor vehicle passing distance. Accid. Anal. Prev. 2021, 155, 106102. [Google Scholar] [CrossRef]
  49. Yamaguchi, R.; Siriaraya, P.; Yoshihisa, T.; Shimojo, S.; Kawai, Y. A Detection System for Comfortable Locations Based on Facial Expression Analysis While Riding Bicycles; ACM: New York, NY, USA, 2023; pp. 306–309. [Google Scholar]
  50. Requardt, A.F.; Ihme, K.; Wilbrink, M.; Wendemuth, A. Towards affect-aware vehicles for increasing safety and comfort: Recognising driver emotions from audio recordings in a realistic driving study. IET Intell. Transp. Syst. 2020, 14, 1265–1277. [Google Scholar] [CrossRef]
  51. Teixeira, I.P.; da Silva, A.N.R.; Schwanen, T.; Manzato, G.G.; Dörrzapf, L.; Zeile, P.; Dekoninck, L.; Botteldooren, D. Does cycling infrastructure reduce stress biomarkers in commuting cyclists? A comparison of five European cities. J. Transp. Geogr. 2020, 88, 102830. [Google Scholar] [CrossRef]
  52. Liang, X.; Zhang, T.; Xie, M.; Jia, X. Analyzing bicycle level of service using virtual reality and deep learning technologies. Transp. Res. Part Policy Pract. 2021, 153, 115–129. [Google Scholar] [CrossRef]
  53. Ferreira, J.J.; Monteiro, M.S. What Are People Doing About XAI User Experience? A Survey on AI Explainability Research and Practice. In Design, User Experience, and Usability. Design for Contemporary Interactive Environments; Marcus, A., Rosenzweig, E., Eds.; Springer International Publishing: Cham, Switzerland, 2020; Volume 12201, pp. 56–73. [Google Scholar]
  54. Ribeiro, M.T.; Singh, S.; Guestrin, C. Why Should I Trust You? Explaining the Predictions of Any Classifier; ACM: New York, NY, USA, 2016; pp. 1135–1144. [Google Scholar]
  55. Haque, A.K.M.; Bahalul, A.K.M.; Islam, N.; Mikalef, P. Explainable Artificial Intelligence (XAI) from a user perspective: A synthesis of prior literature and problematizing avenues for future research. Technol. Forecast. Soc. Change 2023, 186, 122120. [Google Scholar] [CrossRef]
  56. Van der Waa, J.; Schoonderwoerd, T.; van Diggelen, J.; Neerincx, M. Interpretable confidence measures for decision support systems. Int. J. Hum. Comput. Stud. 2020, 144, 102493. [Google Scholar] [CrossRef]
  57. Shapley, L.S. A Value for N-Person Games; RAND Corporation: Santa Monica, CA, USA, 1952. [Google Scholar]
  58. Lundberg, S.M.; Lee, S. A Unified Approach to Interpreting Model Predictions. In Proceedings of the 31st International Conference on Neural Information Processing Systems, NIPS’17, Long Beach, CA, USA, 4–9 December 2017; Curran Associates Inc.: Red Hook, NY, USA, 2017; pp. 4768–4777. [Google Scholar]
  59. The MathWorks Inc. MATLAB Version: 9.13.0 (R2022b); The MathWorks Inc.: Natick, MA, USA, 2022; Available online: https://www.mathworks.com (accessed on 10 June 2023).
  60. OpenStreetMap Contributors. Map from OpenStreetMap, License CC-BY-SA 2.0 (Map) and ODbL (Data). 2023. Available online: https://www.openstreetmap.de/karte/ (accessed on 10 June 2023).
  61. Engeln, A.; Engelbrecht, A.; Kieninger, C. Joy and convenience of driving. In Proceedings of the 4th International Congress of Traffic and Transport Psychology (ICTTP), Washington, DC, USA, 31 August–4 September 2008. [Google Scholar]
  62. Engelbrecht, A. Fahrkomfort und Fahrspass bei Einsatz von Fahrerassistenzsystemen; Disserta Verlag: Berlin, Germany, 2013. [Google Scholar]
  63. Kalra, A.; Lim, T.; Pearson, L.; Beck, B. Methods used to capture subjective user experiences in adults while riding bicycles: A scoping review. Transp. Rev. 2023, 43, 453–477. [Google Scholar] [CrossRef]
  64. Gabriel, D.; Baumgärtner, D.; Görges, D. Accurate and robust state estimation for bicycles. Veh. Syst. Dyn. 2022, 61, 2338–2351. [Google Scholar] [CrossRef]
  65. Murtagh, F.; Contreras, P. Algorithms for hierarchical clustering: An overview. Wires Data Min. Knowl. Discov. 2012, 2, 86–97. [Google Scholar] [CrossRef]
  66. Bishop, C.M. Pattern Recognition and Machine Learning; Information Science and Statistics; Springer: New York, NY, USA, 2006. [Google Scholar]
  67. Chandrashekar, G.; Sahin, F. A survey on feature selection methods. Comput. Electr. Eng. 2014, 40, 16–28. [Google Scholar] [CrossRef]
  68. Schulz, E.; Speekenbrink, M.; Krause, A. A tutorial on Gaussian process regression: Modelling, exploring, and exploiting functions. J. Math. Psychol. 2018, 85, 1–16. [Google Scholar] [CrossRef]
  69. Cohen, J. Statistical Power Analysis for the Behavioral Sciences, 2nd ed.; L. Erlbaum Associates: Hillsdale, NJ, USA, 1988. [Google Scholar]
  70. Ozili, P.K. The Acceptable R-Square in Empirical Modelling for Social Science Research. SSRN Electron. J. 2022. [Google Scholar] [CrossRef]
  71. Agrícola, P.M.D.; da Silva Machado, D.G.; de Farias Junior, L.F.; do Nascimento Neto, L.I.; Fonteles, A.I.; da Silva, S.K.; Chao, C.H.; Fontes, E.B.; Elsangedy, H.M.; Okano, A.H. Slow Down and Enjoy: The Effects of Cycling Cadence on Pleasure. Percept. Mot. Ski. 2017, 124, 233–247. [Google Scholar] [CrossRef]
  72. Roberts, L.; Jones, G.; Brooks, R. Why Do You Ride?: A Characterization of Mountain Bikers, Their Engagement Methods, and Perceived Links to Mental Health and Well-Being. Front. Psychol. 2018, 9. [Google Scholar] [CrossRef]
  73. Dill, J.; McNeil, N. Four Types of Cyclists?: Examination of Typology for Better Understanding of Bicycling Behavior and Potential. Transp. Res. Rec. J. Transp. Res. Board 2013, 2387, 129–138. [Google Scholar] [CrossRef]
Figure 1. Methodological approach of the present work. RT = rider type; GPR = Gaussian process regression.
Applsci 13 11277 g001
Figure 2. Elevation profile (a) and selected route (b) of the test track. The test track was divided into four sections highlighted with colours in the map. The red dot represents the start and end point. (Source of (b): map data ©OpenStreetMap contributors (ODbL) [60]).
Applsci 13 11277 g002
Figure 3. Boxplots of the Pearson correlation coefficients of the riding experience against the rider power, speed and motor power including N = 50 riders (a). Relation of the Pearson correlation coefficients of riding experience against rider power, speed and motor power, respectively (b). Dendrogram of the derivation of rider types resulting from hierachical cluster analysis (c). RT1(N = 10); RT2(N = 15); RT3(N = 15); RT4(N = 10).
Applsci 13 11277 g003
Figure 4. Overview of the perceived riding experience. Boxplots of the riding experience grouped by sections per rider type (a). Boxplots of Pearson correlation coefficients of the riding experience against the rider power, speed and motor power grouped by rider type (b).
Applsci 13 11277 g004
Figure 5. Feature importance based on SHAP values. In the beeswarm plot, the features are sorted according to their impact on riding experience. Positive SHAP values indicate a positive contribution of a feature to riding experience, while negative SHAP values indicate a negative contribution. The colour displays the original feature value from high to low. The feature importance of the overall GPR models are displayed in the subfigures (a) RT1, (c) RT2, (e) RT3 and (g) RT4. The feature importance of the uphill GPR models are displayed in the subfigures (b) RT1, (d) RT2, (f) RT3 and (h) RT4.
Applsci 13 11277 g005
Table 1. Test track characteristics.
SectionTerrainPath TypeUndergroundSlope [%]Length [m]
1downhillforest pathgravel−41200
2steep uphilllimited traffic zoneasphalt+81100
3moderate uphillforest pathgravel+51100
4hillylimited traffic zoneasphalt+/−1/21600
Table 2. Questionnaire assessing riding performance and riding experience.
Semantic Differential
CategoryItemNegative PolarPositive Polar
Activation
A1Activationboringexciting
Comfort
C1Comfortuncomfortablecomfortable
Table 3. Rider and rider behaviour characteristics.
Rider Type
RT1RT2RT3RT4
N15 (30%)10.00 (20%)15 (30%)10 (20%)
Females nf7 (47%)0 (0%)4 (27%)2 (20%)
Age mean (SD)33.6 (13.1)34.7 (13.1)38.9 (11.8)39.3 (14.6)
Riding style
   Comfortable0 (0%)0 (0%)0 (0%)0 (0%)
   Rather comfortable1 (7%)1 (10%)2 (13%)1 (10%)
   Rather sportive12 (80%)5 (50%)11 (73%)4 (40%)
   Sportive2 (13%)4 (40%)2 (13%)5 (50%)
Objective parameters
   Rider cadence mean (SD) [rpm]72.49 (8.09)77.78 (15.03)74.18 (8.21)79.18 (8.35)
   Rider torque mean (SD) [Nm]15.62 (3.56)20.94 (4.01)18.72 (3.78)19.28 (4.18)
   Heart rate mean (SD) [bpm]135.69 (19.60)143.77 (19.06)138.90 (16.04)134.83 (16.26)
   Speed mean (SD) [km/h]20.98 (2.56)23.56 (3.61)22.22 (1.80)22.82 (2.08)
   Acceleration mean (SD) [m/s2]0.31 (0.05)0.35 (0.04)0.32 (0.04)0.34 (0.03)
Note. The given percentages always refer to the rider type (with the exception of N). Objective parameters were averaged per participant over all test rides.
Table 4. Selected feature space.
Riding Dynamics
Motor PerformanceRider BehaviourLongitudinal DynamicsLateral Dynamics
Motor power meanTorque meanSpeed meanRoll angle deviation
Motor power deviationCadence meanAcceleration meanYaw rate deviation
Heart rate meanDeceleration max
Braking duration
Pitch angle max
Table 5. Model performance and model parameters of Gaussian process regression predicting riding experience.
Overall GPR ModelUphill GPR Model
RT1RT2RT3RT4RT1RT2RT3RT4
Cross-val. RMSE0.610.760.600.820.530.620.530.50
RMSE SD0.040.110.110.100.070.190.110.13
R-squared0.600.370.610.270.700.270.800.64
Note. The overall GPR model contains data from all sections. The uphill GPR model contains data from the steep uphill section.
Disclaimer/Publisher’s Note: The statements, opinions and data contained in all publications are solely those of the individual author(s) and contributor(s) and not of MDPI and/or the editor(s). MDPI and/or the editor(s) disclaim responsibility for any injury to people or property resulting from any ideas, methods, instructions or products referred to in the content.

