
Rotating Target Detection Method of Concrete Bridge Crack Based on YOLO v5


Abstract
:1. Introduction
1.1. Motivation
1.2. Related Work
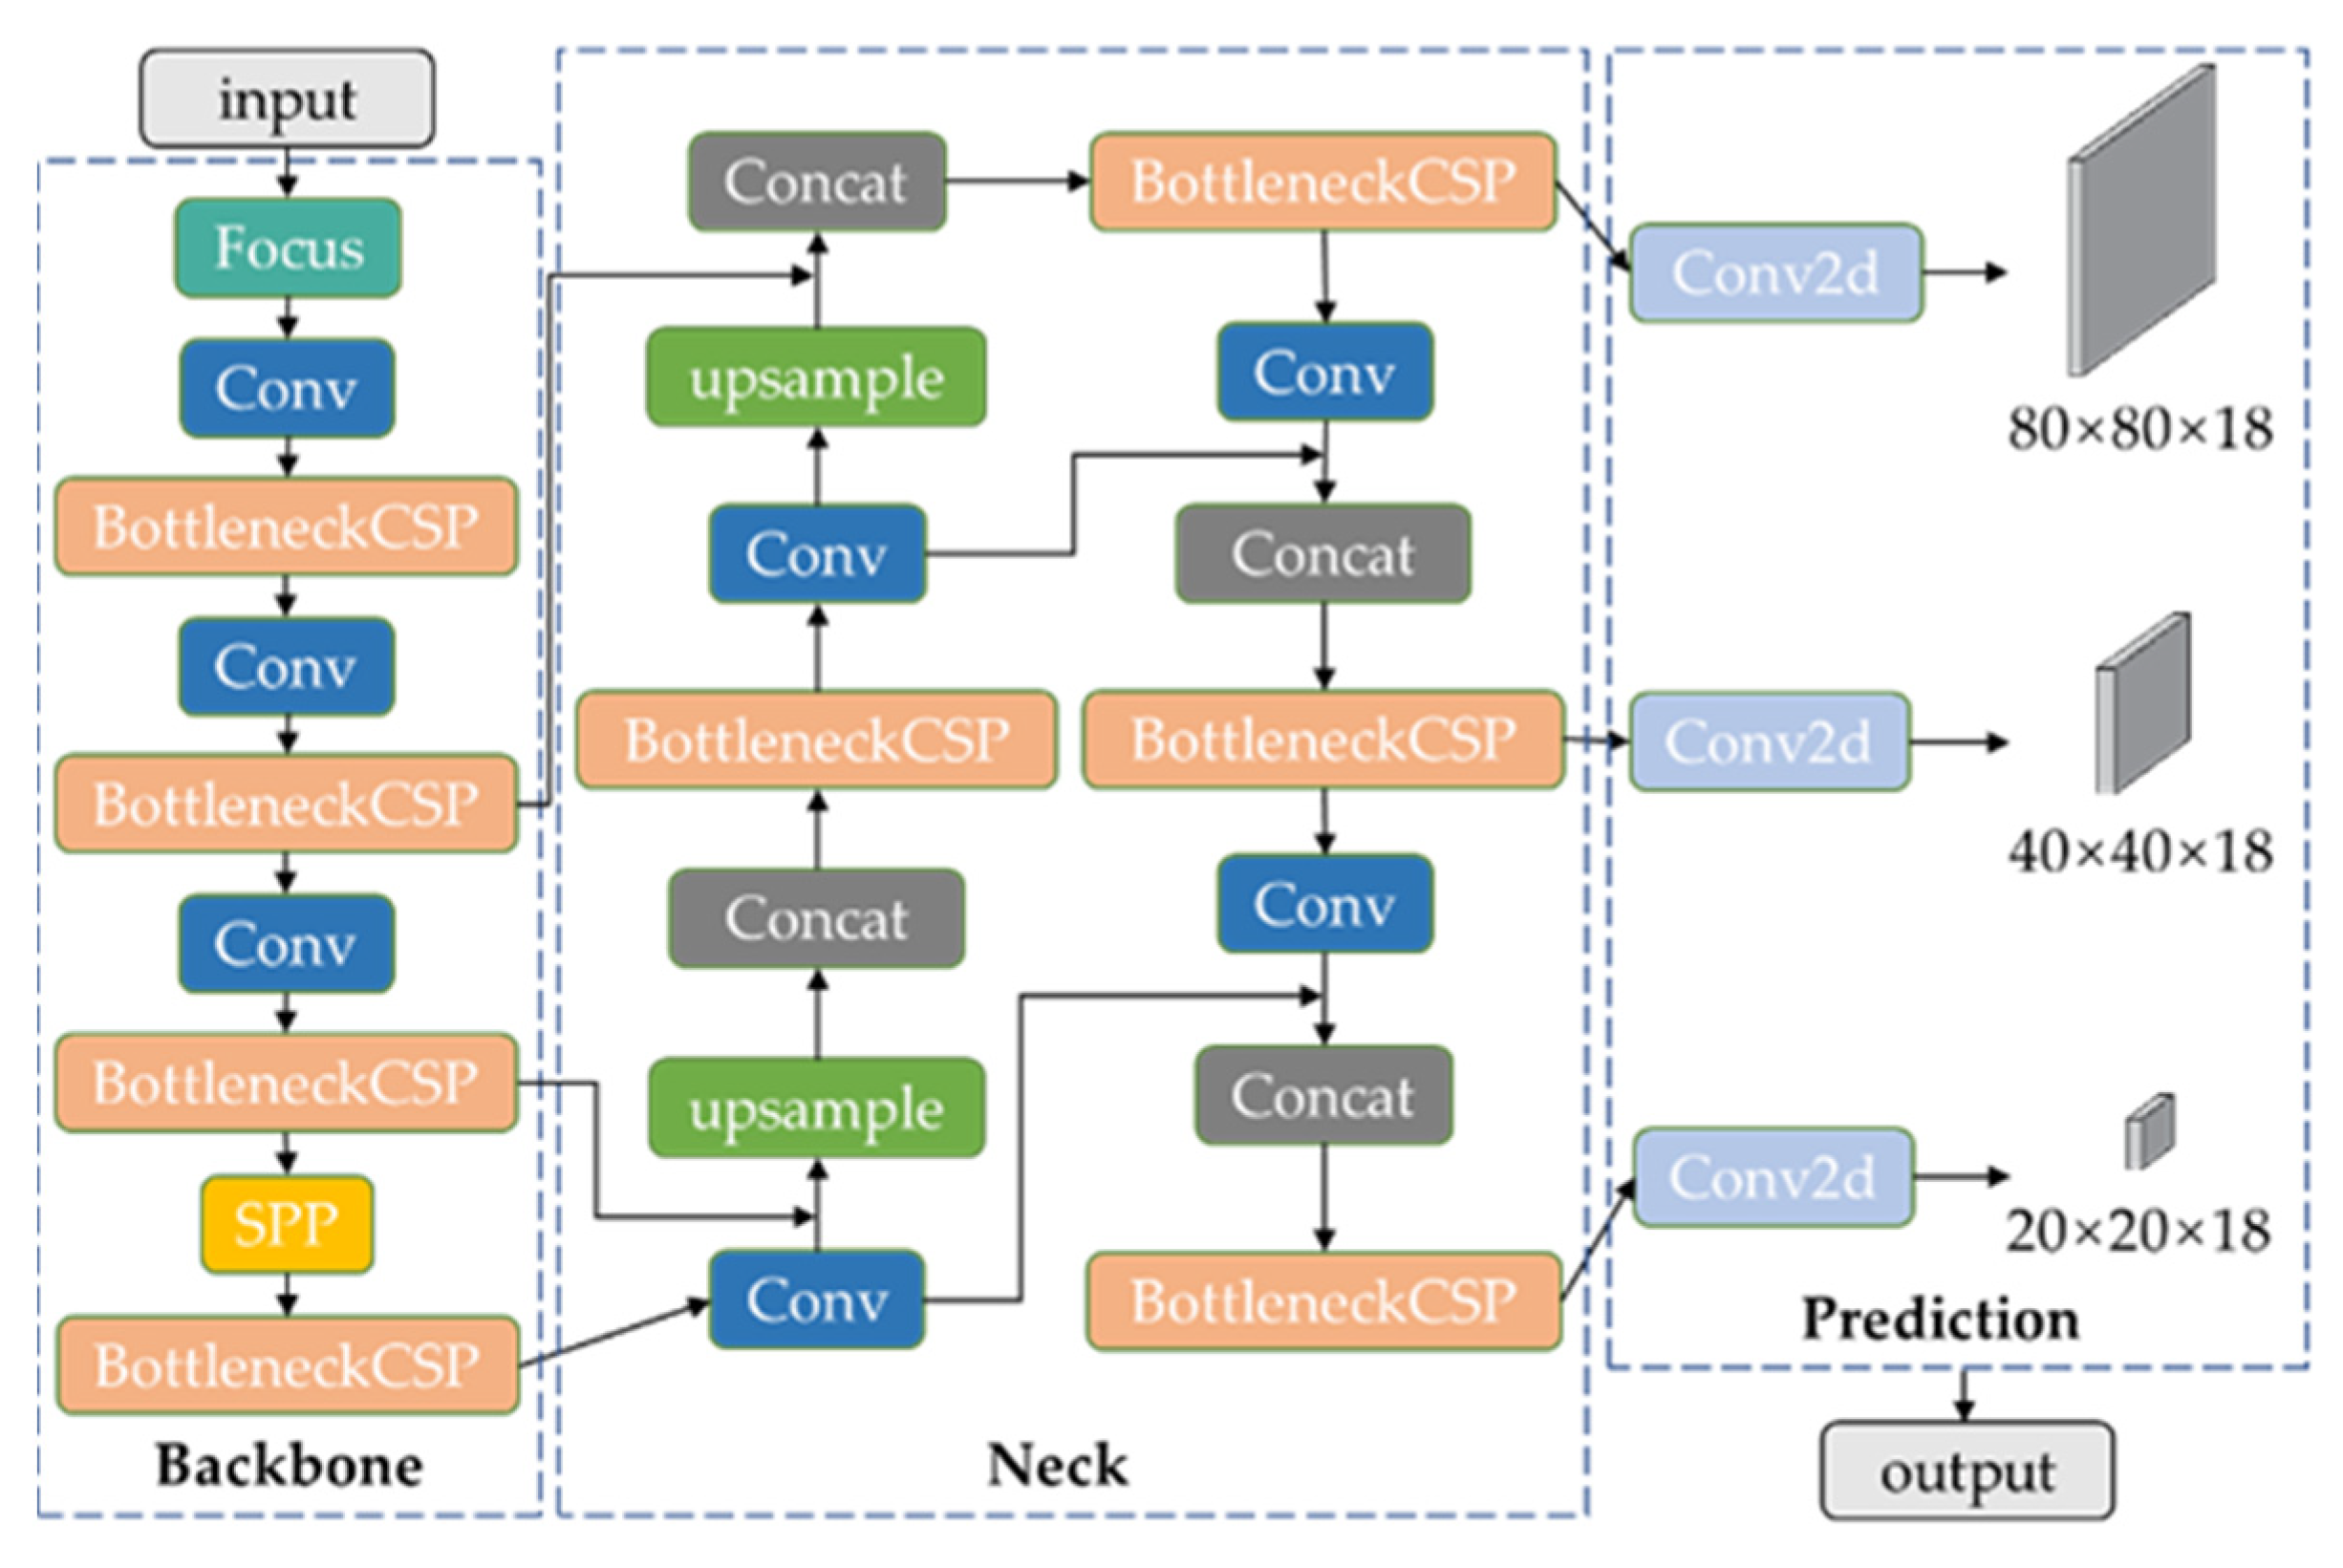
2. YOLO v5 Model
3. Enhanced YOLO v5 Model
3.1. Angle Regression
3.2. Attention Mechanism
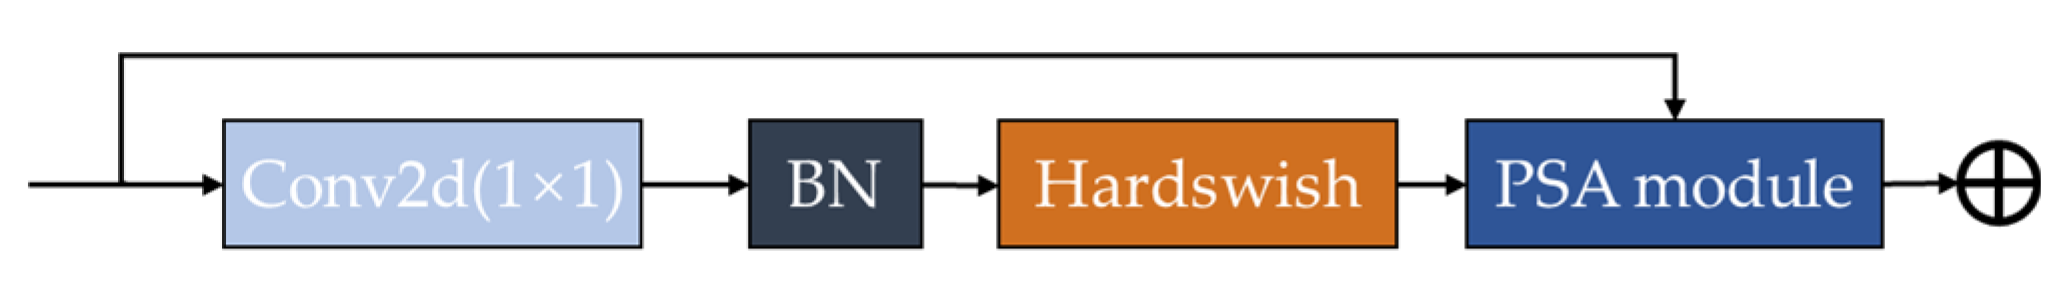
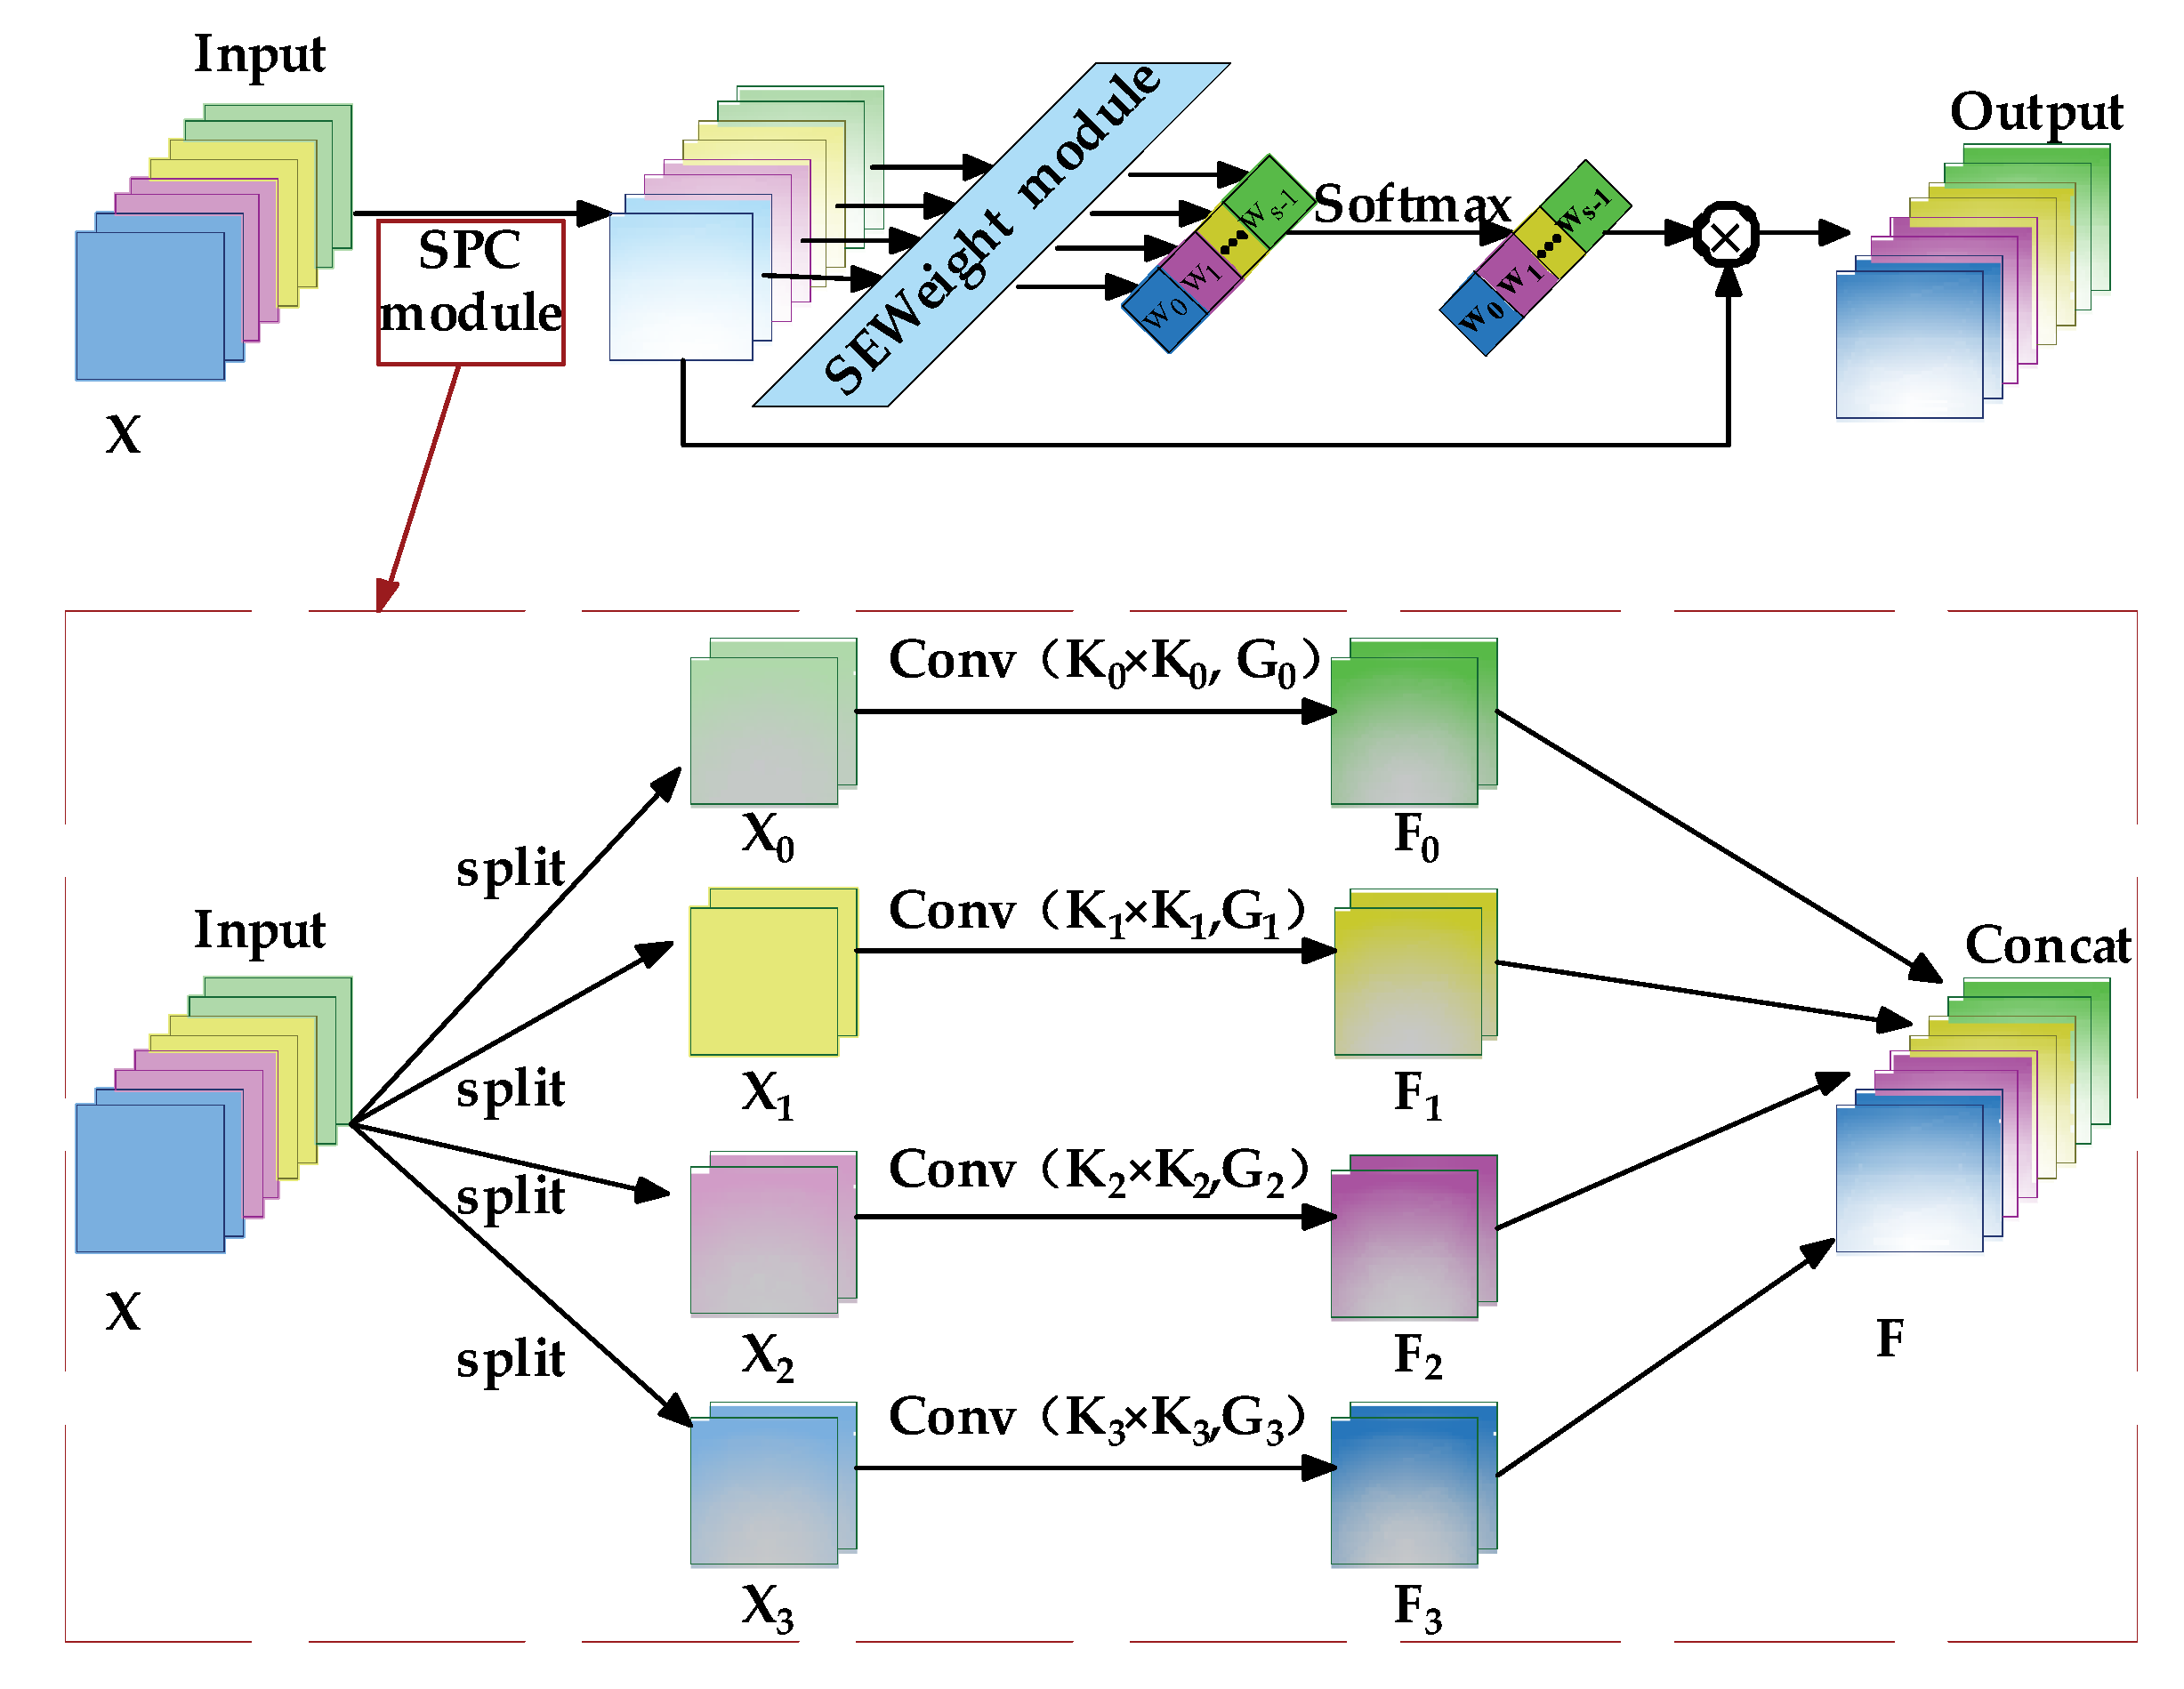
3.2.1. PSA-Neck Module
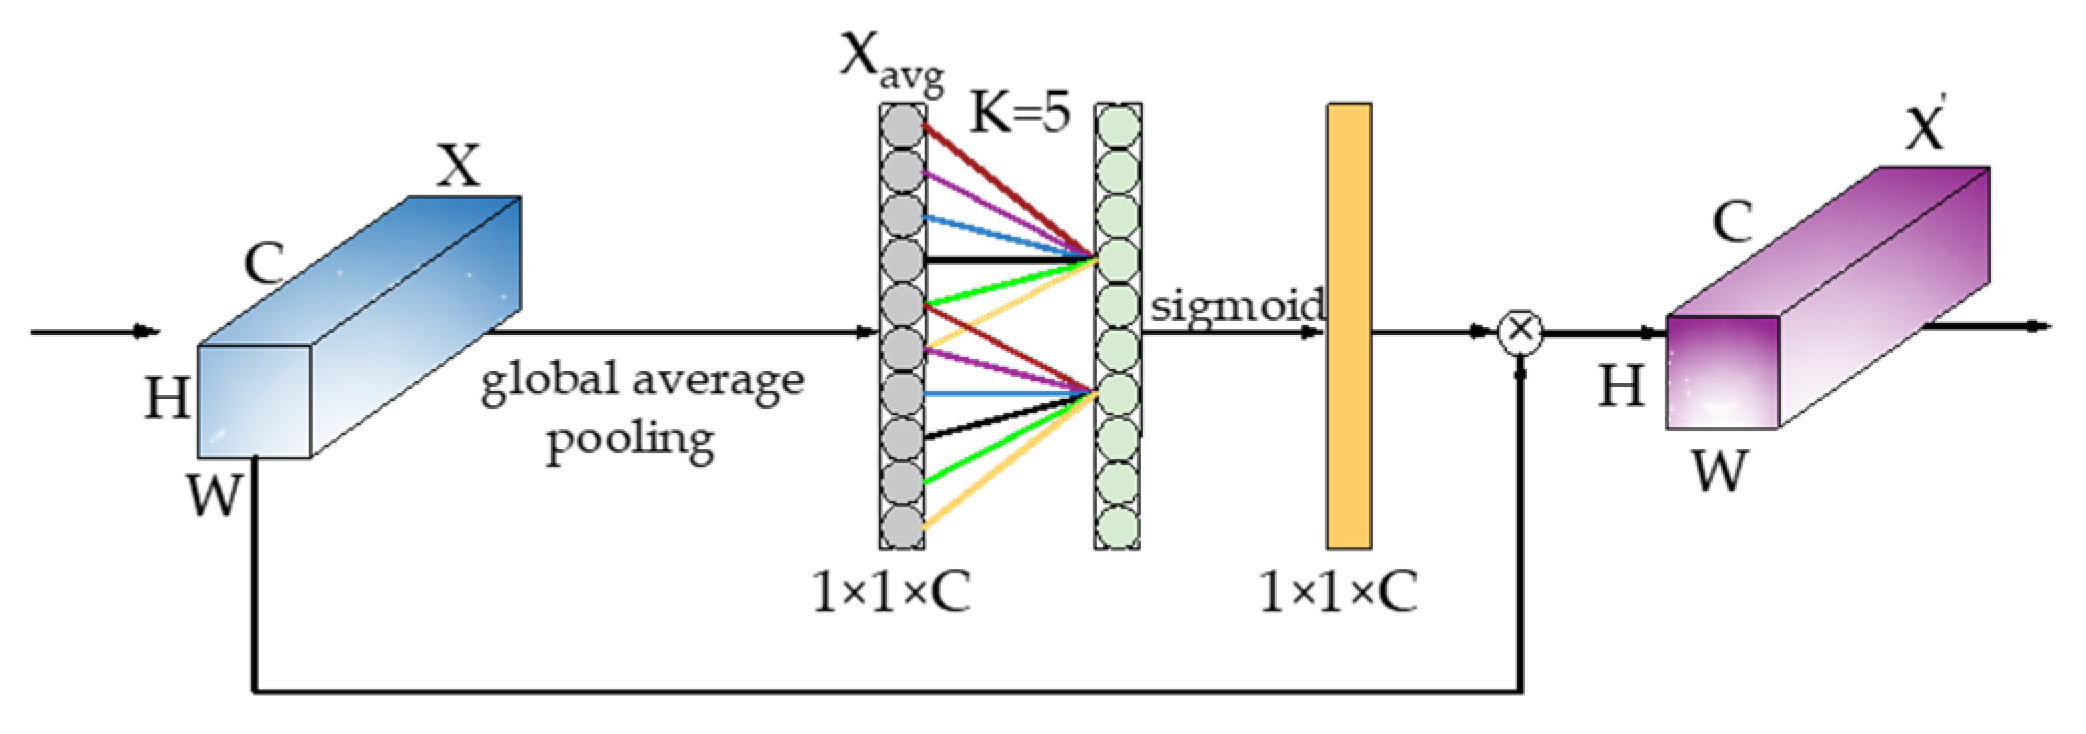
3.2.2. ECA-Layer Module
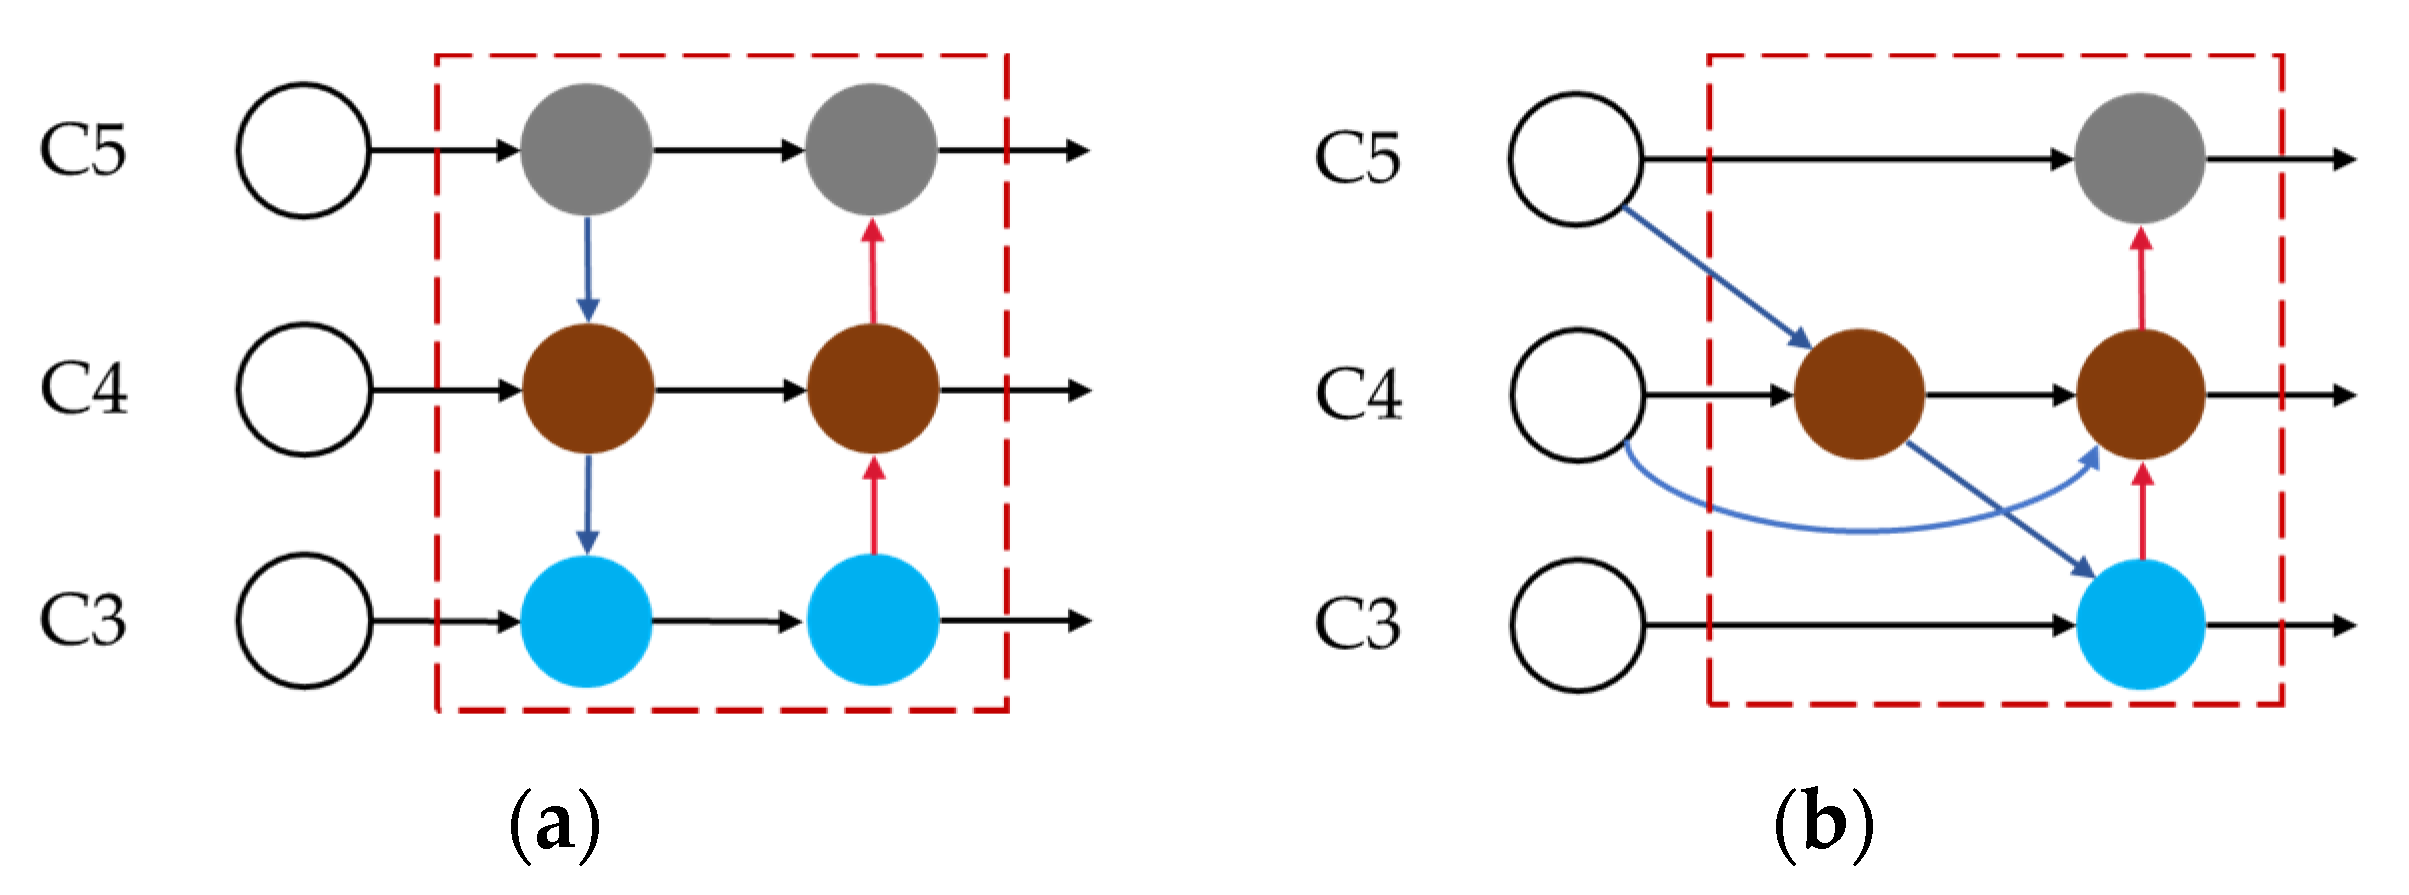
3.3. Enhanced Feature Fusion
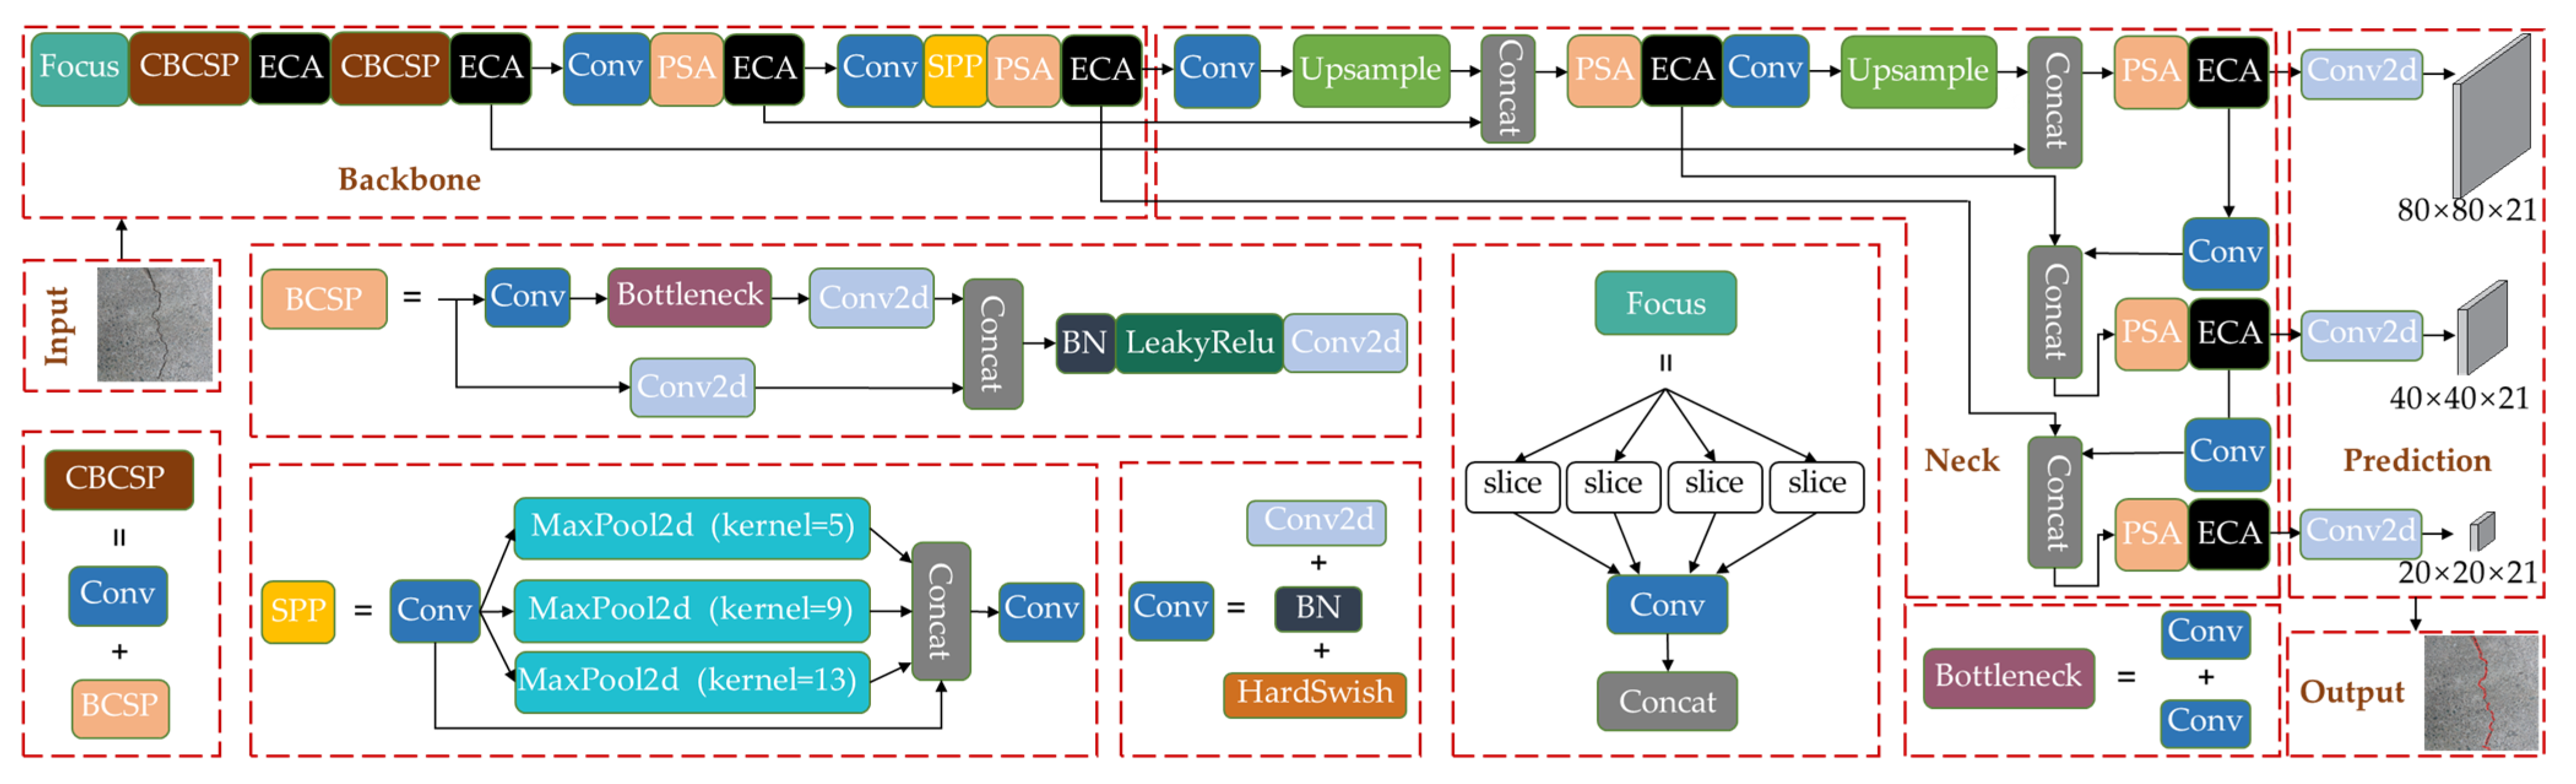
3.4. Improved Network Architecture
4. Experiments
4.1. Datasets
4.2. Evaluation Metrics
4.3. Training
4.4. Results Analysis
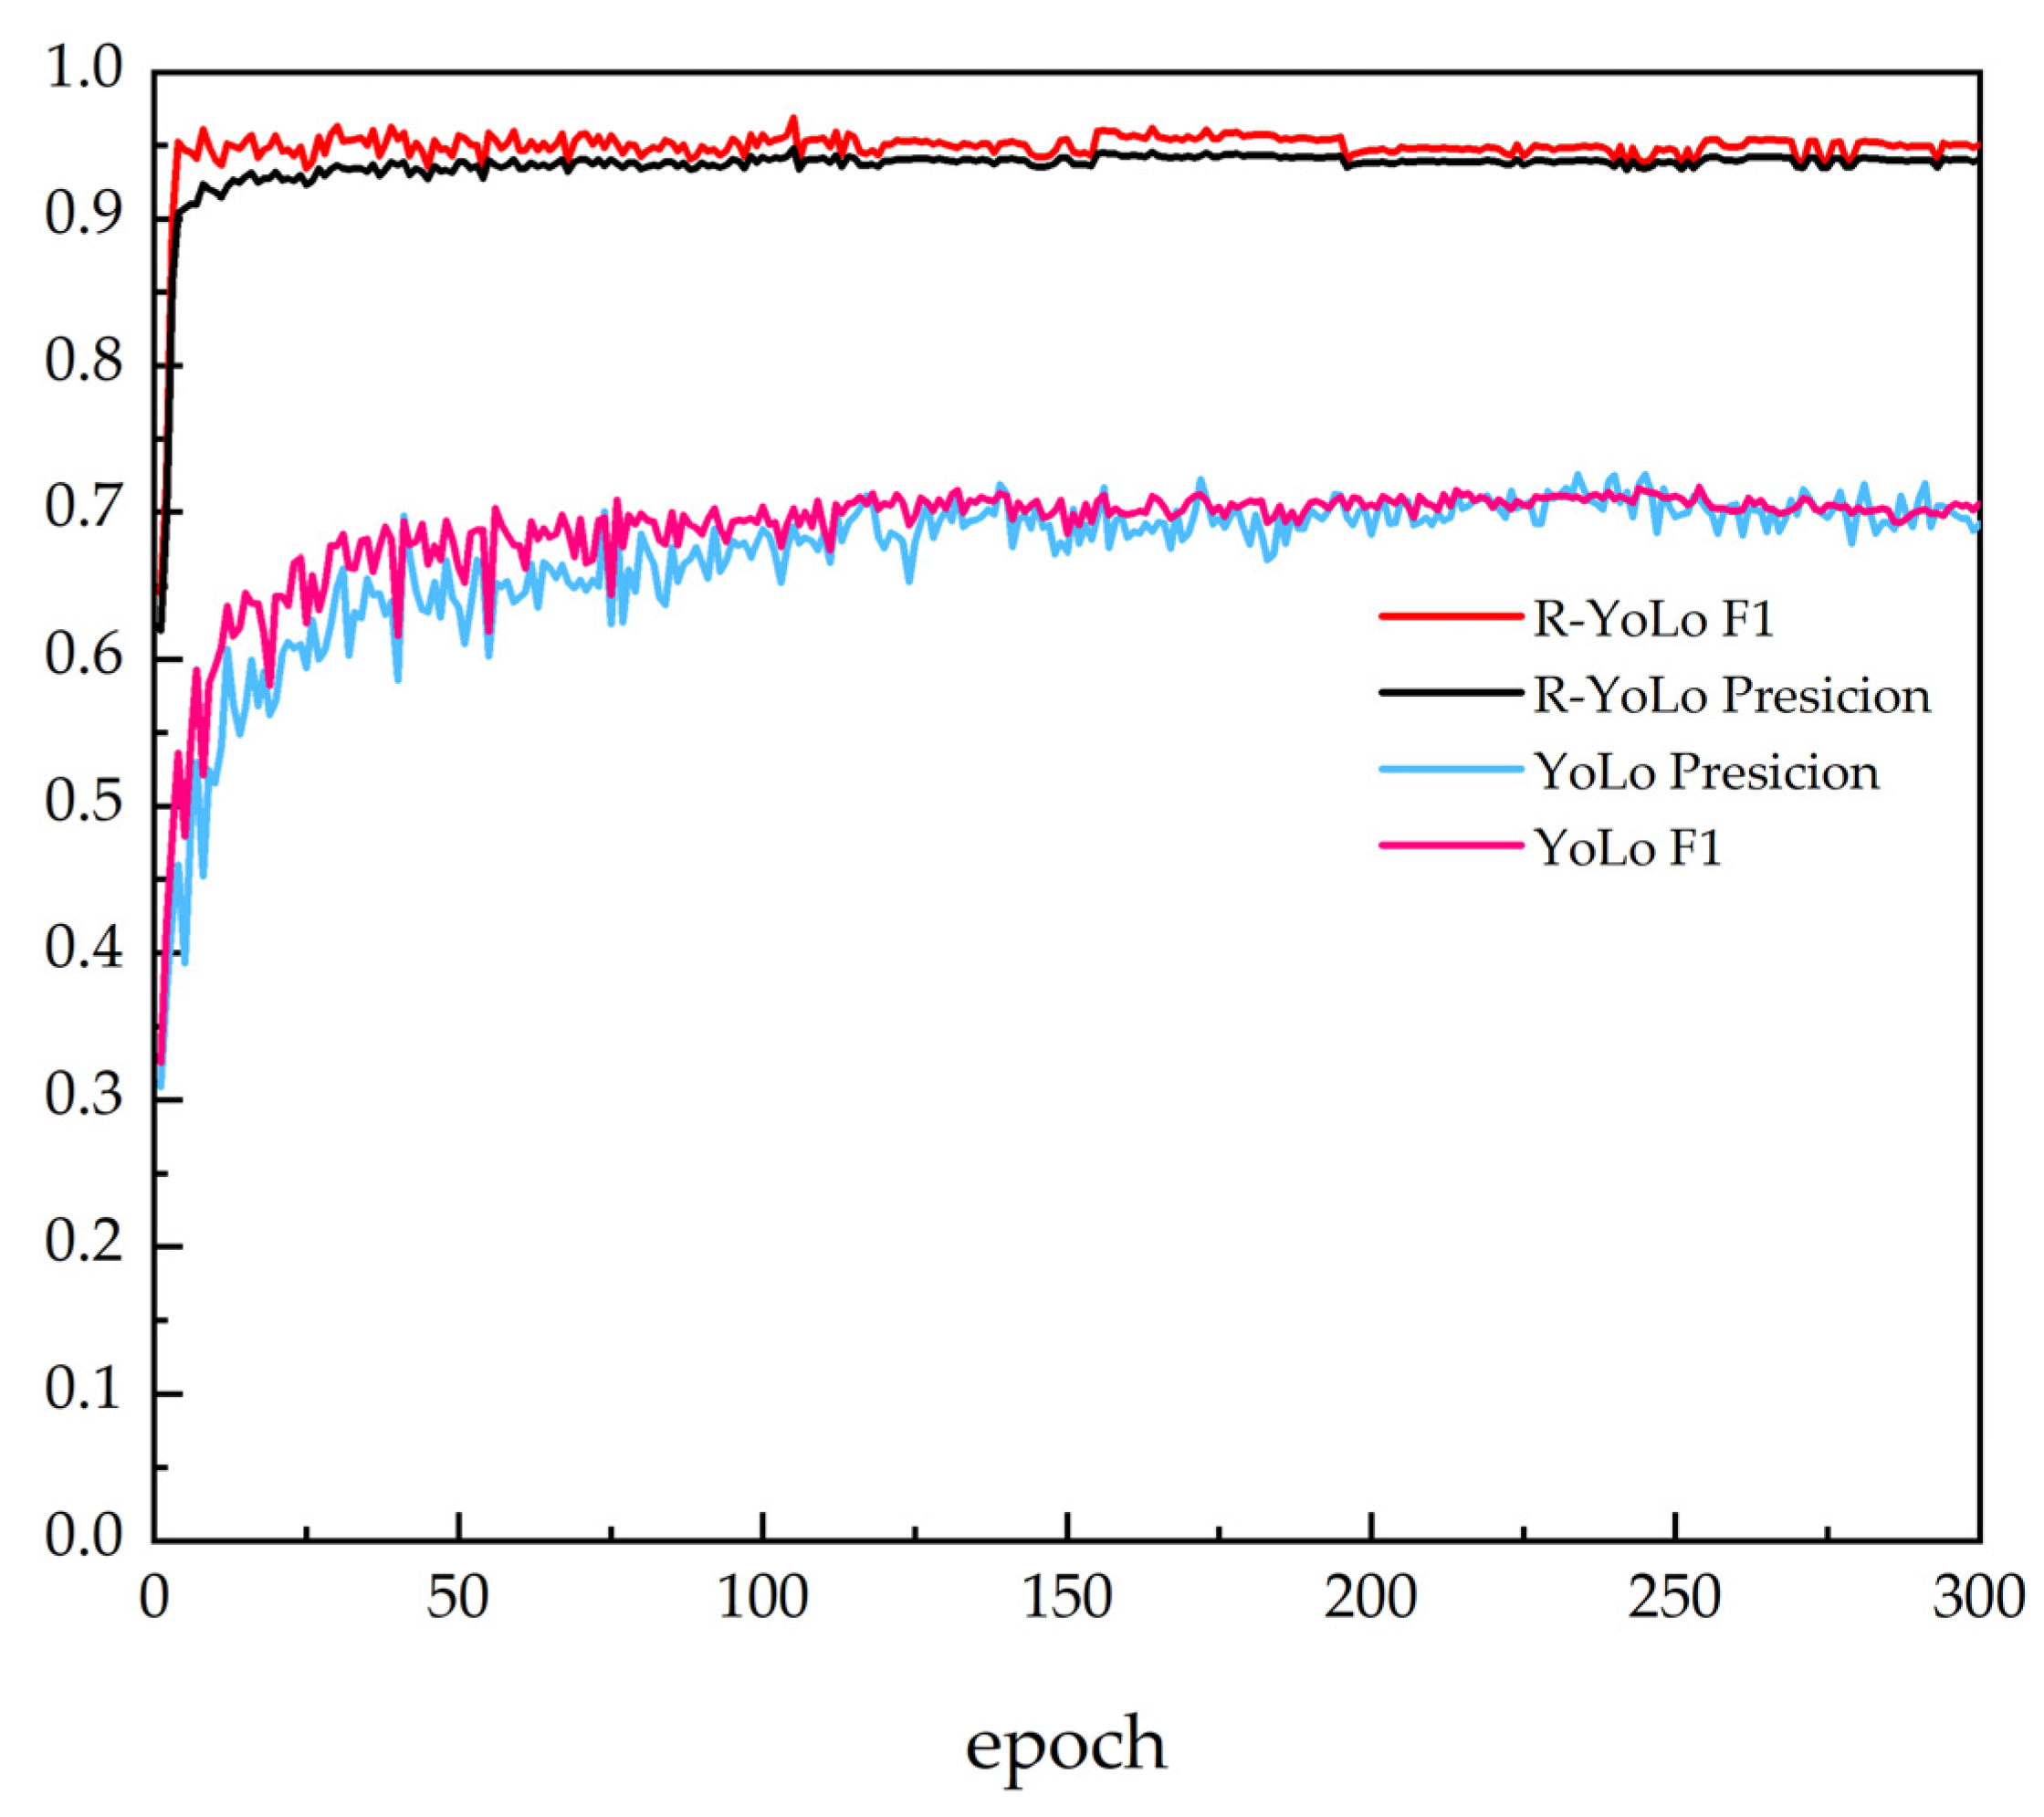
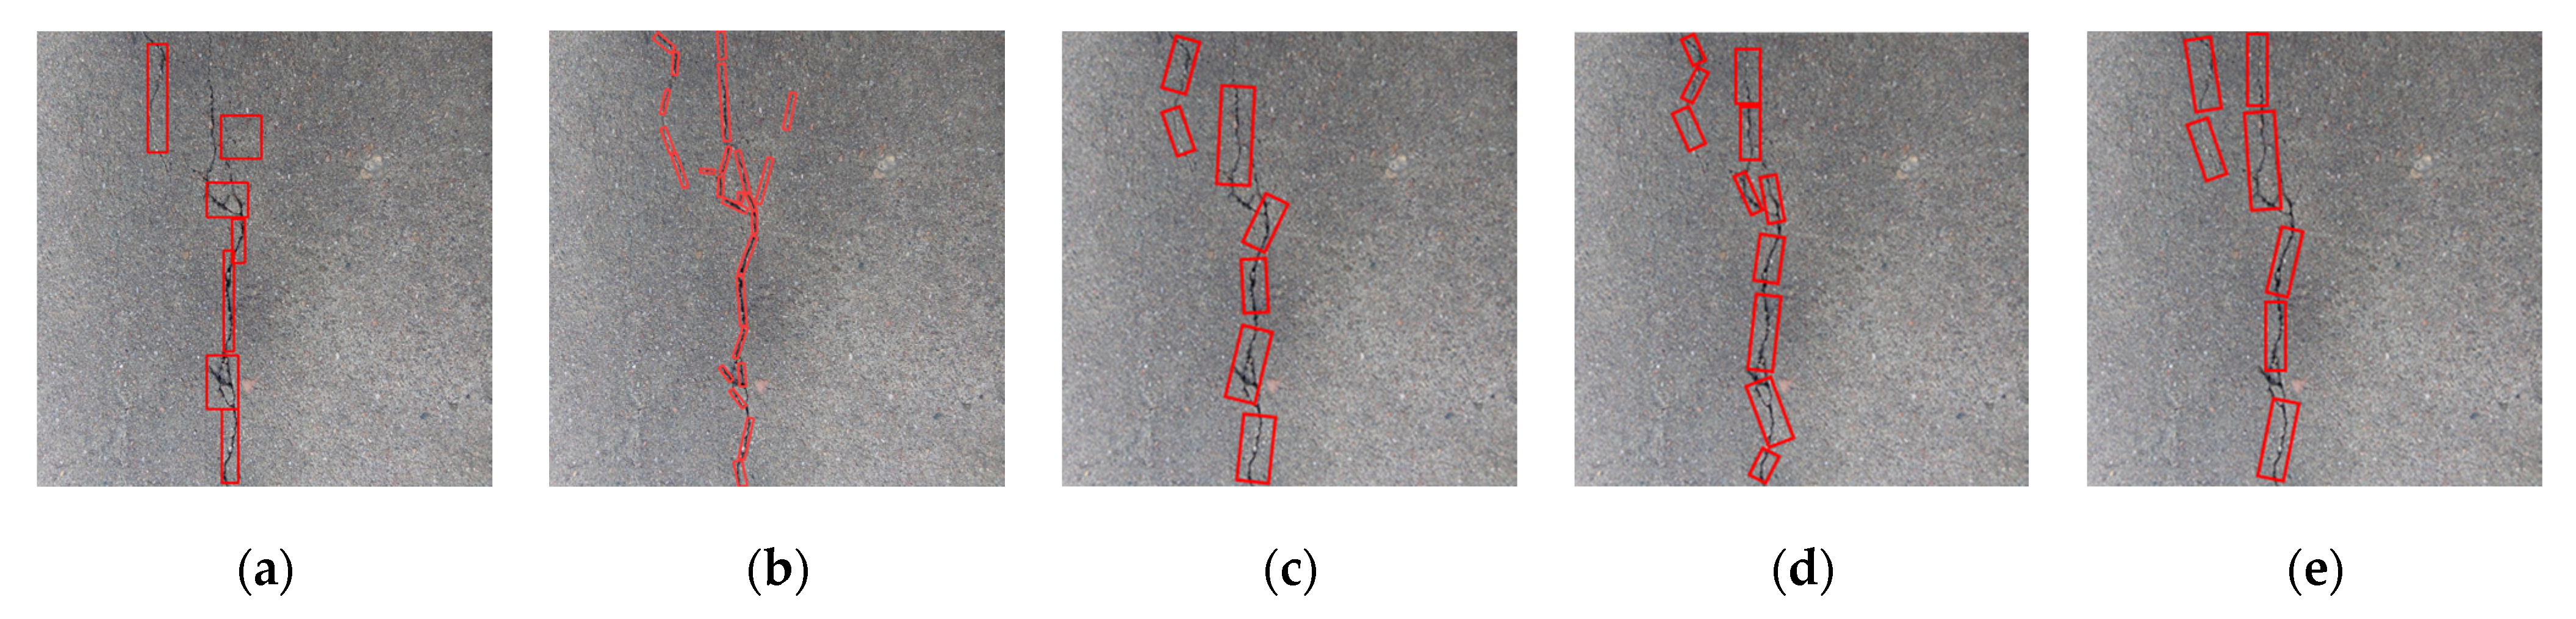
4.5. Performance Comparison
- (1)
- Comparison of Rotational Object Detection Algorithms
- (2)
- Comparison of YOLO v5
5. Conclusions
Author Contributions
Funding
Institutional Review Board Statement
Informed Consent Statement
Data Availability Statement
Conflicts of Interest
References
- Asvitha, V.; Ravi, K. Review on the mechanism and mitigation of cracks in concrete. Appl. Eng. Sci. 2023, 100154, 2666–4968. [Google Scholar]
- Rosso, M.; Marasco, G.; Aiello, S.; Aloisio, A.; Chiaia, B.; Marano, G. Convolutional networks and transformers for intelligent road tunnel investigations. Comput. Struct. 2023, 275, 106918. [Google Scholar]
- Zhou, X.; Zhang, X. Thoughts on the Development of Bridge Technology in China. Engineering 2019, 5, 1120–1130. [Google Scholar] [CrossRef]
- Billie, F.; Vedhus, H.; Yasutaka, N. Advances in Computer Vision-Based Civil Infrastructure Inspection and Monitoring. Engineering 2019, 5, 199–222. [Google Scholar]
- Asjodi, A.; Daeizadeh, M.; Hamidia, M.; Dolatshahi, K. Arc Length method for extracting crack pattern characteristics. Struct. Control Health Monit. 2020, 28, 2653. [Google Scholar]
- Abdlekader, E.; Marzouk, M.; Zayed, T. A self-adaptive exhaustive search optimization-based method for restoration of bridge defects images. Int. J. Mach. Learn. Cybern. 2020, 11, 1659–1716. [Google Scholar]
- Liu, Y.; Fan, J.; Kong, S.; Wei, X. Multi-View Geometric 3D Reconstruction Method for Identifying Structural Defects and Deformations. Eng. Mech. 2020, 37, 103–111. [Google Scholar]
- Sanchez, P.; Ramon, P.; Arrue, B.; Ollero, A.; Heredia, G. Robotic System for Inspection by Contact of Bridge Beams Using UAVs. Sensors 2019, 19, 305. [Google Scholar]
- Keunyoung, J.; Kyu, Y.; Byunghyun, K.; Soojin, C. Automated crack evaluation of a high-rise bridge pier using a ring-type climbing robot. Comput.-Aided Civ. Infrastruct. Eng. 2020, 36, 14–29. [Google Scholar]
- Cha, Y.; Choi, W.; Büyüköztürk, O. Deep Learning-Based Crack Damage Detection Using Convolutional Neural Networks. Comput.-Aided Civ. Infrastruct. Eng. 2017, 32, 361–378. [Google Scholar]
- Kalfarisi, R.; Wu, Z.; Soh, K. Crack Detection and Segmentation Using Deep Learning with 3D Reality Mesh Model for Quantitative Assessment and Integrated Visualization. J. Comput. Civ. Eng. 2020, 34, 04020010. [Google Scholar]
- Cha, Y.; Choi, W.; Suh, G.; Mahmoudkhani, S.; Büyüköztürk, O. Autonomous Structural Visual Inspection Using Region-Based Deep Learning for Detecting Multiple Damage Types. Comput.-Aided Civ. Infrastruct. Eng. 2018, 33, 731–747. [Google Scholar] [CrossRef]
- Laxman, K.; Tabassum, N.; Ai, L.; Cole, C.; Ziehl, P. Automated crack detection and crack depth prediction for reinforced concrete structures using deep learning. Constr. Build. Mater. 2023, 370, 130709. [Google Scholar]
- Redmon, J.; Farhadi, A. YOLOv3: An Incremental Improvement. Computer Vision and Pattern Recognition. arXiv 2018, arXiv:1804.02767. [Google Scholar]
- Ge, Z.; Liu, S.; Wang, F.; Li, Z.; Sun, J. YOLOx: Exceeding YOLO Series in 2021. Computer Vision and Pattern Recognition. arXiv 2021, arXiv:2107.08430. [Google Scholar]
- Zhou, T.; Liu, F.; Ye, X.; Wang, H.; Lu, H. CCGL-YOLOV5: A cross-modal cross-scale global-local attention YOLOV5 lung tumor detection model. Comput. Biol. Med. 2023, 165, 107387. [Google Scholar] [CrossRef]
- Klinwichit, P.; Yookwan, W.; Limchareon, S.; Chinnasarn, K.; Jang, J.; Onuean, A. BUU-LSPINE: A Thai Open Lumbar Spine Dataset for Spondylolisthesis Detection. Appl. Sci. 2023, 13, 8646. [Google Scholar] [CrossRef]
- Mahaur, B.; Mishra, K. Small-object detection based on YOLOv5 in autonomous driving systems. Pattern Recognit. Lett. 2023, 168, 115–122. [Google Scholar]
- Cho, K.; Cho, D. Autonomous Driving Assistance with Dynamic Objects Using Traffic Surveillance Cameras. Appl. Sci. 2022, 12, 6247. [Google Scholar] [CrossRef]
- Zhou, Y.; Chang, B.; Zou, H.; Sun, L.; Wang, L.; Du, D. Online visual monitoring method for liquid rocket engine nozzle welding based on a multi-task deep learning model. J. Manuf. Syst. 2023, 68, 1–11. [Google Scholar] [CrossRef]
- Zhuang, H.; Xia, Y.; Wang, N.; Dong, L. High Inclusiveness and Accuracy Motion Blur Real-Time Gesture Recognition Based on YOLOv4 Model Combined Attention Mechanism and DeblurGanv2. Appl. Sci. 2021, 11, 998. [Google Scholar]
- Liao, Y.; Li, W. Bridged Crack Detection Method Based on Convolutional Neural Networks. Comput. Eng. Des. 2021, 42, 2366–2372. [Google Scholar]
- Cai, F.; Zhang, Y.; Huang, J. Bridge Surface Crack Detection Algorithm Based on YOLOv3 and Attention Mechanism. Pattern Recognit. Artif. Intell. 2020, 33, 926–933. [Google Scholar]
- Yu, J.; Liu, B.; Yin, D.; Gao, W.; Xie, Y. Bridge Crack Intelligent Recognition and Measurement based on YOLOv5 and UNet3+. J. Hunan Univ. 2023, 50, 65–73. [Google Scholar]
- Tan, G.; Ou, J.; Ai, Y.; Yang, R. Bridge Crack Image Segmentation Method based on Improved DeepLabv3+ Mode. J. Jilin Univ. 2022, 1–7. [Google Scholar] [CrossRef]
- He, K.; Zhang, X.; Ren, S.; Sun, J. Spatial Pyramid Pooling in Deep Convolutional Networks for Visual Recognition. IEEE Trans. Pattern Anal. Mach. Intell. 2015, 37, 1904–1916. [Google Scholar] [CrossRef] [PubMed]
- Trinh, H.; Le, D.; Kwon, Y. PANET: PANET: A GPU-based tool for fast parallel analysis of robustness dynamics and feed-forward/feedback loop structures in large-scale biological networks. PLoS ONE 2014, 9, 103010. [Google Scholar]
- Neubeck, A.; Gool, L. Efficient Non-Maximum Suppression. In Proceedings of the 18th International Conference on Pattern Recognition (ICPR’06), Hong Kong, China, 20–24 August 2006; pp. 850–855. [Google Scholar]
- Misra, D. Mish. A Self Regularized Non-Monotonic Neural Activation Function. Machine Learning. arXiv 2019, arXiv:1908.08681. [Google Scholar]
- Zheng, Z.; Wang, P.; Liu, W.; Li, J.; Ye, R.; Ren, D. Distance-IoU Loss: Faster and Better Learning for Bounding Box Regression. Proc. AAAI Conf. Artif. Intell. 2019, 34, 12993–13000. [Google Scholar] [CrossRef]
- Girshick, R. Fast R CNN. In Proceedings of the 2015 IEEE International Conference on Computer Vision, Santiago, Chile, 7–13 December 2015; pp. 1440–1448. [Google Scholar]
- Yang, X.; Yan, J.; Ming, Q.; Wang, W.; Zhang, X.; Tian, Q. Rethinking Rotated Object Detection with Gaussian Wasserstein Distance Loss. In Proceedings of the Proceedings of the 38th International Conference on Machine Learning, Virtual Event, 18–24 July 2021; Volume 139, pp. 11830–11841. [Google Scholar]
- Hu, J.; Shen, L.; Sun, G. Squeeze-and-excitation networks. In Proceedings of the 2018 IEEE/CVF Conference on Computer Vision and Pattern Recognition, Salt Lake City, UT, USA, 18–23 June 2018; pp. 7132–7141. [Google Scholar]
- Yue, D.; Luo, J.; Li, H. The generative adversarial network improved by channel relationship learning mechanisms. Neurocomputing 2021, 454, 1–13. [Google Scholar]
- Li, X.; Wang, C.; Ju, H.; Li, Z. Surface Defect Detection Model for Aero-Engine Components Based on Improved YOLOv5. Appl. Sci. 2022, 12, 7235. [Google Scholar] [CrossRef]
- Cao, Y.; Chen, J.; Zhang, Z. A sheep dynamic counting scheme based on the fusion between an improved-sparrow-search YOLOv5x-ECA model and few-shot deepsort algorithm. Comput. Electron. Agric. 2023, 206, 107696. [Google Scholar] [CrossRef]
- Woo, S.; Park, J.; Lee, J. CBAM: Convolutional Block Attention Module. Comput. Vis.-ECCV. 2018, 11211, 3–19. [Google Scholar]
- Guo, Z.; Yang, J.; Liu, S. Research on Lightweight Model for Rapid Identification of Chunky Food Based on Machine Vision. Appl. Sci. 2023, 13, 8781. [Google Scholar] [CrossRef]
- Tang, X.; Huang, F.; Li, C.; Ban, D. Dayan Ban, SCA-Net: Spatial and channel attention-based network for 3D point clouds. Comput. Vis. Image Underst. 2023, 32, 103690. [Google Scholar] [CrossRef]
- Xu, Y.; Liu, J.; Zhao, X.; Zhu, X. AMS-PAN: Breast ultrasound image segmentation model combining attention mechanism and multi-scale features. Biomed. Signal Process. Control 2023, 81, 104425. [Google Scholar]
- Tan, M.; Pang, R.; Le, Q. EfficientDet: Scalable and Efficient Object Detection. In Proceedings of the 2020 IEEE/CVF Conference on Computer Vision and Pattern Recognition, Seattle, WA, USA, 13–19 June 2020; pp. 10778–10787. [Google Scholar]
- Concrete Road Surface, Bridge Construction, Tunnel Crack and Fracture Detection Dataset. Available online: https://blog.csdn.net/Together_CZ/article/details/128290225?utm_medium=distribute.pc_relevant.none-task-blog-2~default~baidujs_utm_term~default-2-128290225-blog-125138837.235^v38^pc_relevant_sort_base2&spm=1001.2101.3001.4242.2&utm_relevant_index=5 (accessed on 22 September 2023).
- Hou, L.; Lu, K.; Xue, J.; Li, Y. Shape-Adaptive Selection and Measurement for Oriented Object Detection. Proc. AAAI Conf. Artif. Intell. 2022, 36, 923–932. [Google Scholar] [CrossRef]
- Han, J.; Ding, J.; Li, J.; Xia, G. Align Deep Features for Oriented Object Detection. IEEE Trans. Geosci. Remote Sens. 2022, 60, 1–11. [Google Scholar]
- Han, J.; Ding, J.; Xue, N.; Xia, G. Redet: A Rotation-equivariant Detector for Aerial Object Detection. In Proceedings of the IEEE/CVF Conference on Computer Vision and Pattern Recognition, Nashville, TN, USA, 20–25 June 2021; pp. 2786–2795. [Google Scholar]


| Epoch | mAP@0.5 | mAP@0.5:0.95 | Precision | Recall | F1 | Loss |
|---|---|---|---|---|---|---|
| 1 | 0.3741 | 0.1032 | 0.4617 | 0.4332 | 0.4470 | 0.2017 |
| 50 | 0.9402 | 0.5973 | 0.9215 | 0.8881 | 0.9045 | 0.0977 |
| 100 | 0.9401 | 0.6111 | 0.9133 | 0.9122 | 0.9127 | 0.0935 |
| 150 | 0.9413 | 0.6134 | 0.9174 | 0.9034 | 0.9103 | 0.0895 |
| 200 | 0.9412 | 0.6123 | 0.9131 | 0.9073 | 0.9102 | 0.0866 |
| 250 | 0.9402 | 0.6104 | 0.9163 | 0.9048 | 0.9105 | 0.0843 |
| 300 | 0.9403 | 0.6103 | 0.9152 | 0.9054 | 0.9103 | 0.0839 |
| Algorithm | mAP@0.5 | Model Size (Mb) | Inference Time (Per Picture) |
|---|---|---|---|
| SASM | 80.29 | 276 | 0.22 s |
| S2A Net | 78.17 | 291 | 0.25 s |
| ReDet | 89.45 | 233 | 0.47 s |
| R-YOLO v5 | 94.03 | 4.17 | 0.01 s |
Disclaimer/Publisher’s Note: The statements, opinions and data contained in all publications are solely those of the individual author(s) and contributor(s) and not of MDPI and/or the editor(s). MDPI and/or the editor(s) disclaim responsibility for any injury to people or property resulting from any ideas, methods, instructions or products referred to in the content. |
© 2023 by the authors. Licensee MDPI, Basel, Switzerland. This article is an open access article distributed under the terms and conditions of the Creative Commons Attribution (CC BY) license (https://creativecommons.org/licenses/by/4.0/).
Share and Cite
Liu, Y.; Zhou, T.; Xu, J.; Hong, Y.; Pu, Q.; Wen, X. Rotating Target Detection Method of Concrete Bridge Crack Based on YOLO v5. Appl. Sci. 2023, 13, 11118. https://doi.org/10.3390/app132011118
Liu Y, Zhou T, Xu J, Hong Y, Pu Q, Wen X. Rotating Target Detection Method of Concrete Bridge Crack Based on YOLO v5. Applied Sciences. 2023; 13(20):11118. https://doi.org/10.3390/app132011118
Chicago/Turabian StyleLiu, Yu, Tong Zhou, Jingye Xu, Yu Hong, Qianhui Pu, and Xuguang Wen. 2023. "Rotating Target Detection Method of Concrete Bridge Crack Based on YOLO v5" Applied Sciences 13, no. 20: 11118. https://doi.org/10.3390/app132011118
APA StyleLiu, Y., Zhou, T., Xu, J., Hong, Y., Pu, Q., & Wen, X. (2023). Rotating Target Detection Method of Concrete Bridge Crack Based on YOLO v5. Applied Sciences, 13(20), 11118. https://doi.org/10.3390/app132011118