Abstract
For decades, terahertz (THz) microscopic imaging has been limited by the resolution of the system due to the larger wavelength, the power of the source, and the equivalent noise power of the detector, so a lot of research has focused on single-point scanning imaging. With the development of hardware, full-field THz imaging based on high-power continuous-wave THz sources have been developed such as the direct intensity imaging method and lensless coherent imaging. In particular, the THz direct intensity imaging method requires no complicated computational reconstruction, while the high resolution, as a key issue, still needs to be improved. In this paper, the rotating coherent scattering microscopy was applied to THz imaging for the first time. Here, we designed and fabricated a hemisphere lens with high-resistance silicon. The tilted hemisphere lens transformed the incident divergent beam into a plane wave, and the total internal reflection occurred in the planar surface within the hemispherical lens, and generated evanescent waves in the rare medium. At the same time, the sample was placed very close to the plane of the hemispherical lens, so that the sample was illuminated by the evanescent waves. The scattered waves carried high frequency information to the far field, and thus through an objective, the super-resolution imaging was achieved along a single direction. Then, the hemispherical lens was rotated to obtain coherent scattering microscopic images under different evanescent wave illumination angles. Finally, the full-field super-resolution imaging results were obtained through incoherent superposition.
1. Introduction
Terahertz (THz) waves are electromagnetic waves with the wavelengths between 30 µm and 3 mm. They have special properties including a fingerprint spectrum characteristic, superior penetrability to non-metallic and non-polar materials, and low single photon energy being safe to the sample and the operator. Therefore, THz imaging has important potential in characterizing a wide range of materials and the imaging of biological tissues. Both pulsed-wave (PW) THz imaging and continuous-wave (CW) THz imaging have been developed in the last decade [1] to enrich the field of THz research. At the same time, THz medical imaging applications such as biological tissue water content analysis [2], lesion tissue identification [3,4,5], and burn identification [6,7] have been proposed. However, unlike visible light imaging systems, the long wavelength of THz waves and the relative scarcity of available optical components make high-resolution and super-resolution imaging difficult. In particular, the optical field carrying the subwavelength structural information of the sample cannot propagate to the far field, which is one of the limitations of THz imaging in biomedical imaging.
In order to break the diffraction limited resolution, solid immersion lenses [8,9,10,11], super-oscillatory lenses [12], meta lenses [13], and the dielectric sphere [14] are usually used to form a focused spot with a subwavelength size. For PW THz, scattering media are used in wavefront shading to spatio-temporal focusing for THz optical correction systems [15] and ghost imaging [16]. Then, super-resolution imaging can be achieved by scanning the sample point by point by using the focused spot as the illumination beam. Because of the high transmittance and high refractive index of silicon and high resistivity float zone silicon (HRZF-Si) in the THz band, the solid immersion lens is used for point-scanning imaging [17,18,19]. When a dielectric particle of wavelength magnitude is placed in the terahertz wave focus position, a terajet beyond the diffraction limit can be generated, significantly improving the spatial resolution of the terahertz imaging system [20]. In particular, it is easy to generate photonic hooks due to the asymmetry of mesoscale dielectric particle structures such as cylinder, half-cylinder, and cubic particle [21]. In addition to the factor of the imaging resolution, the main reason preventing the wide application of THz imaging is the slow acquisition time of the conventional point-scanning method, and the high-power requirement of the source for the THz full-field imaging. With the development of high-power CW and PW THz sources such as gas lasers, cavity-based photoconductive sources [22], and high-sensitivity area array detectors such as pyroelectric detectors and microbolometers, full-field imaging has become possible. However, the problem of low imaging resolution caused by the long wavelength still exists.
In recent years, the full-field CW-THz imaging technology includes the phase-contrast imaging methods [1,23] and the direct intensity imaging methods. The former is represented by digital holography [24,25], ptychography [26,27,28], and transport-of-intensity equation (TIE) imaging [29]. In these methods, two-dimensional (2D) photosensitive elements are used to record the interference or diffraction pattern of the samples under the THz illumination, and various reconstruction algorithms have been proposed to retrieve the distribution of the complex electromagnetic field in the sample plane. The latter makes use of the parabolic reflectors/spherical lenses or the lens sets. The sample and the 2D photosensitive element are in the object–image conjugate plane of the lens or lens group to satisfy the imaging condition [30].
In the aspect of far-field and full-field direct intensity imaging, assuming the wavelength of the THz wave fixed, when the 2D photosensitive elements are used to record the intensity image, the size of each pixel is often smaller than the wavelength, and therefore the imaging resolution depends on the numerical aperture (NA) of the microscopic objective according to the well-known Abbe’s theoretical resolution formula, which is also related to the recording distance and the effective aperture of the microscopic objective. Microscopic imaging systems with higher NA have a higher resolution. There are usually two methods to improve the spatial resolution: the first is to expand the NA to include more high frequency information in the passband and the second assumes that the NA is fixed and illuminates the sample by the tilted plane wave or the evanescent wave along the surface so that the part of the spatial spectrum of the sample with higher spatial frequencies is shifted into the passband of the imaging system.
In the aspect of improving the NA, since it is equal to be nsinα, where α is the aperture angle of the objective accepting light and n is the object–space refractive index, it can be effectively enhanced by immersion methods. The related advanced work on visible light could inspire research and be helpful for design in the THz band. In 2009, J. Lee et al. reported near-field high resolution by self-assembled nanoscale spherical lenses [31]. In 2011, Z. Wang et al. used microspheres for the first time to improve the resolution of a far-field white light microscopy imaging system [32]. Furthermore, these studies used solid-state microspheres rather than high-refractive index matching liquid media to enhance the resolution of the imaging system. However, the properties of the materials, objects, media, etc. need to be considered, so these methods cannot be directly applied to the THz band. Although it is not practical to find high RI matching liquids in the THz band, recently, we introduced the solid immersion method into the full-field THz direct intensity imaging method and analyzed the imaging properties of a hemispherical solid immersion lens (h-SIL) by ray tracing simulation. The secondary reflection produced an additional inverted image with a small field curvature. By blocking the direct refracted image, high-fidelity imaging was achieved [33].
In another aspect of the super-resolution imaging realized by the tilted illumination shifting frequency, significant progress has been made in visible light. In 2013, X. Hao et al. achieved total internal reflection (TIR) through a triangular prism to generate evanescent waves. Super-resolution imaging was achieved by illuminating a three-directional striped sample deposited directly on the TIR interface with the evanescent waves [34]. On the other hand, fluorescence microscopy imaging methods have gained a lot of research and applications. To suppress the background noise, the fluorescence excitation region is confined to the propagation direction of the evanescent waves by TIR, thus enhancing the contrast of imaging [35]. This has also led to the study of the scattered direct intensity imaging method of non-fluorescent objects illuminated by evanescent waves using TIR fluorescence microscopy (TIRFM) [36,37]. In 2013, P. Olshausen et al. used an inverse TIR fluorescence system to achieve super-resolution images of label-free microspheres [38]. Compared with the prismatic illumination scheme, the objective illumination scheme is able to obtain different angular illumination directions without moving the sample, just simply by loading different grating on the spatial light modulator (SLM). The reconstruction method was acquired by incoherent superposition of the images illuminated by the evanescence wave from 72 different directions to achieve an imaging resolution beyond the diffraction limit. In 2016, the direct intensity imaging method under different transverse wave vectors were recorded in a single image acquisition time by rotating the incident beam direction at a high speed, which has the advantage of real-time recording without the reconstruction process [39], which is named as the rotating coherent scattering (ROCS) microscopy.
Recently, this super-resolution imaging method has received some attention in the field of THz imaging. In 2021, J. Zhao et al. numerically simulated one-dimensional THz spoof surface plasmons (SSP) illuminating a one-dimensional sample [40], and presented the scattered field distribution located at one wavelength distance behind the sample, and obtained high-resolution images by the iterative reconstruction algorithm based on a series of scattered field distributions with nine different frequency shifts. Since the SSP provides only a single direction surface wave, multiple wavelengths are required to fill the Fourier spectrum to reconstruct the complex electromagnetic field distribution. However, a THz far-field and full-field direct intensity imaging method based on the evanescent wave (or the surface waves) illumination has not been proposed yet.
In this paper, we designed and built a THz-ROCS microscopic imaging system. The incident THz divergent beam is transformed by the spherical refractive surface of a hemispherical lens and produces the plane wave inside the lens. Then, the plane wave incidents on the planar interface of the hemispherical lens satisfies the condition of TIR, which generates the evanescent wave. The evanescent wave illuminates the sample immediately adjacent to the interface, producing the scattered waves that carry high-frequency information to propagate to the far-field. An objective collects the scattered waves to form the high-resolution image at its output plane. By rotating the hemispherical lens, multiple images under different high transverse wave vector illuminations can be obtained. Finally, through the incoherent superposition of these images, the full-field image of a 2D grating with a period of 150 μm was achieved experimentally beyond the diffraction-limited resolution.
2. Principle of THz ROCS
The key point of ROCS microscopy is to generate rotatable, highly transverse wave vector illumination. However, unlike visible light, the THz direct intensity imaging method is limited by the sensitivity or scarcity of the optical elements and the detector, making it difficult to modulate the illumination direction by ring illumination or the SLM. Furthermore, in the THz band, there lacks a high RI matching solution and commercial instruments similar to those used in TIRF microscopy. Thus, new illumination schemes need to be developed.
TIR is the most common method to generate evanescence waves. Assuming that the wave vector in air is equal to the free-space wave vector k0 (k0 = 2π/λ), a spherical wave with a small divergence angle is generated outside the hemispherical lens made by HRZF-Si, as shown in Figure 1. Under the paraxial approximation, it could be transformed by the spherical surface into a plane beam in the dense medium, whose propagation direction makes an angle of θ with the normal to the planar surface of the hemispherical lens. This plane wave is reflected at the planar surface, being the interface between HRZF-Si and the air. The RI of the medium of the hemispherical lens and the air are n and 1.0, respectively. Then, the transverse wave vector at the reflecting surface is kx = nsinθk0, according to Maxwell’s boundary conditions, and this transverse wave vector should be the same in both the hemispherical lens medium and in the air medium. The wave vector k0 and the component of the wave vector kz, kx satisfy the Pythagorean theorem kx2 + kz2 = k02. In the case when kx > k0, which also means θ is greater than the critical angle θc of the total internal reflection (θc = arcsin(1/n)). Then, kz2 < 0, which means that it is in the imaginary field. There exists an evanescent wave in the air medium close to the planar surface and cannot be propagated to the far-field. The transverse wave vector of the evanescent wave becomes bigger when continuously increasing the incident angle θ. At the same time, when illuminating the sample by the evanescent wave, the interaction with the sample generates a scattered light field that will shift the spatial spectrum of the sample and propagate the part with higher frequencies to the far field. The scattered waves are then collected by an imaging objective, located above, whose optical axis is parallel to the normal of the planar surface of the hemispherical lens. Here, we analyzed the position relationship between the hemispherical lens and the point source of the divergence beam. The radius of the hemispherical lens with refractive index n is r. Then, the distance along the optical axis from the point source to the planar surface of the hemispherical lens is D, expressed as:
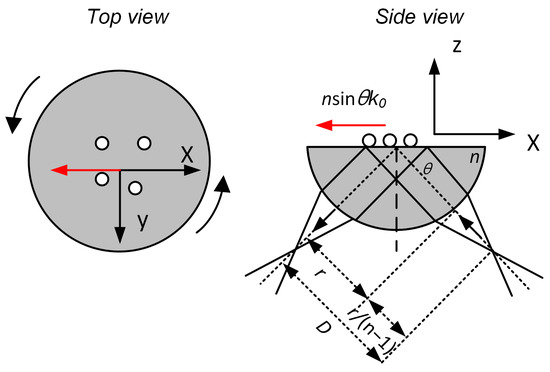
Figure 1.
Top view and side view of the TIR schematic based on a hemispherical lens.
The spatial frequency that can pass through the passband of the system to participate in imaging is shown in Figure 2. In the case of the normal incidence illumination, the NA of the imaging system is determined by the aperture angle α (NA = sinα), and is less than 1. The system can only transfer the spatial frequency information inside the gray circular region, and the highest wave vector is NAk0, as shown in Figure 2 denoted by the blue dashed line. When α = 90°, the cutoff spatial frequency is denoted by the black dashed line, corresponding to the free space wave vector k0. In the case of illumination with the inclined plane wave or the evanescent wave, the transverse wave vector of the illumination beam is no longer equal to zero. The passband will follow the illumination wave vector to shift with the distance kx = nsinθk0, denoted by the red dashed line. At this time, the spatial frequency information in the red region can be received by the system. It is worth noting that when evanescent wave illumination is used, the frequency shift of the passband can exceed k0, then super-resolution imaging can be achieved.
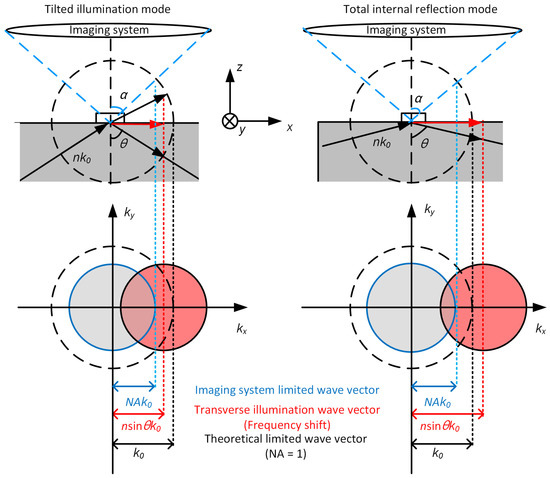
Figure 2.
The relationship between the incidence angle, the aperture angle, and the passband in the wave vector space under the tilted plane wave illumination and the TIR mode, respectively.
When the direction of the incident evanescent wave rotates relative to the sample, the frequency shift direction will be changed accordingly, and the corresponding passband will rotate around the center. Specifically, the direct intensity imaging results under different directions of illumination with the number N are recorded by rotating the hemispherical lens. Here, the ROCS principle is considered for reconstruction, and the super-resolution image is obtained by the direct superimposition of frequency-shifted images, which is recorded as Ifinal [38]:
where r denotes the lateral position in the x–y plane; f is the field distribution of the sample; Em is the electric field function of the evanescent wave incident from the direction of illumination ϕm; hc is the coherent point spread function (PSF) of the imaging system; and ⊗ denotes the convolution operation. Consider the sample as the sum of point scatterers at different positions, then
and set the field image of the jth scatterer to be
This leads to the intensity under the illumination of the one-directional evanescent wave being:
At this time, the total intensity of the final image is:
where φ(r; ϕm) is the phase of the field image that depends on the position r of the scatterer and the direction of illumination ϕm. The former term of the above equation represents the incoherent images of different scatterers, and the latter term represents the cosine sum of the phase differences of the point scatterers in all illumination directions.
3. Simulation and Experimental Results
Numerical simulations were first performed based on Equation (4). A simple sample containing two point scatterers and a complicated sample with several microspheres were selected. For simplification, the magnification of the imaging system was assumed to be a unit. Figure 3 shows the results for the two point scatterers with the distance of 150 μm. The wavelength of the incident THz wave was 119 μm, and the NA of the imaging system was 0.6, which yielded a theoretical resolution of 162.6 μm (d = 0.82λ/NA). Therefore, the scatterer sample could not be distinguished when normally incident by the plane wave, as shown in Figure 3a. When the sample was illuminated by an evanescent wave with a 1.17 k0 transverse wave vector through the TIR, the cross-section of the corresponding image, as shown in Figure 3b, and the two scatterers could be distinguished. It is worth noting that the peaks of the scatterers under high transverse wave vector illumination were 250 μm apart from each other, which indicates that in this case, the imaging resolution was enhanced, and at the same time, the measured distance between two distinct intensity peaks in the image plane was larger than the actual distance between two point scatterers and was an interference effect depending on the phase delay, which is like a kind of aberration under a single illumination angle. Therefore, the ROCS method needs incoherent superposition with different images under as many illuminating directions as possible to obtain an aberration-free result.
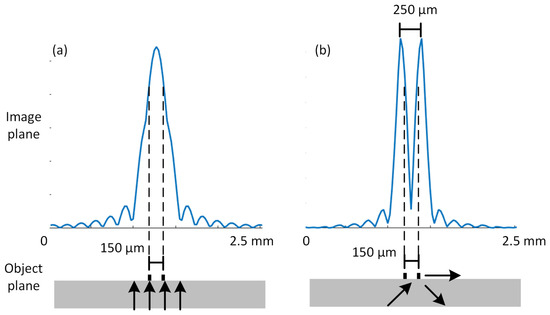
Figure 3.
Simulated images of two point scatterers with a spacing of 150 μm under (a) illumination with the normal incident plane wave and (b) illumination with an evanescent wave of 1.17 k0 transverse wave-vector through TIR.
Figure 4 shows the simulated imaging results of the multiple microsphere samples. The radius of each microsphere was 25 μm, which were assumed to be transparent to the THz wave such as the HRFZ-Si material with an absorption coefficient of 0.04 cm−1 [41], and the other parameters were the same as the previous one. Figure 4a–e depicts five of the direct intensity imaging results under a different illumination direction (represented by the white arrow) every 20° of rotation. According to the principle of ROCS, the intensity of 18 images was superposed to obtain the final result shown in Figure 4f. Compared with the direct intensity imaging result shown in Figure 4g with the normal incident mode, the imaging resolution was greatly improved. From the profile curve in Figure 4f, the two microspheres could be resolved based on the two distinct peaks, even with the low contrast. It is worth noting that more acquisition at different angles will benefit the final superimposed image. However, it will increase the complexity of the setup and acquisition time. Usually, there can be a compromise between the acquisition time and the quality of the final intensity image.
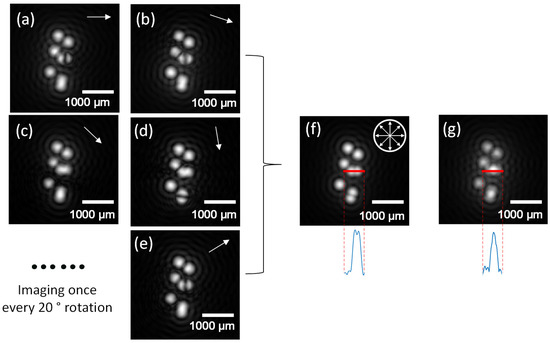
Figure 4.
(a–e) Five simulated imaging results with the high transverse wave vector illumination at 20°, 40°, 60°, 80°, and 340° among the total 18 images, (f) the superimposed final image with 18 different intensity images, and (g) imaging result with the normal-incident illumination.
Then, an experimental verification was performed. The experimental setup is shown in Figure 5. The THz source was an infrared-pumped methanol laser (295-FIRL-HP) with an output frequency of 2.52 THz. The THz wave is a monochromatic coherent light with a small divergence angle about 0.63°, which is a longitudinally polarized Gaussian beam. The power can reach up to 400 mW by adjusting the pump power and the THz laser cavity length. In order to guarantee the optical elements are centered, we adjusted the center of all of the optical elements to the same height with the help of the liquid crystal sheets. The beam passed through a pair of off-axis parabolic mirrors with focal lengths of 50.8 mm and 152.4 mm to expand the radius of the beam from 9 mm to 27 mm. Next, a TPX lens with the diameter of 50.8 mm and focal length of 50 mm converged the parallel beam at the position of 50 mm + 35.9 mm (calculated according to Equation (1)) in front of the hemispherical lens, designed and fabricated with HRZF-Si, whose refractive index n was 3.418 under illumination with a 2.52 THz wave, and the radius r was 25.4 mm. Then, the spherical beam refracted into the helispherical lens and became the plane beam. The total internal reflect occurred on the planar surface of the Si–air plane. Here, the hemispherical lens was fixed by a rotator mount and the sample was fixed to the center of the flat surface of the hemispherical lens with alcohol under van der Waals interaction. When rotating the rotator to an angle of 70° between the plane and the optical axis, the normal angle of the incident beam was about 20°. At this time, the frequency shift was 1.17 k0. A magnified imaging system with an aperture of about 70 mm and a numerical aperture of about 0.6 was placed at a distance of more than 40 mm from the sample to the THz camera with a microbolometer area-array detector. The pixel size of the detector was 35 μm × 35 μm, and arranged into a rectangle with 384 × 288 pixels.
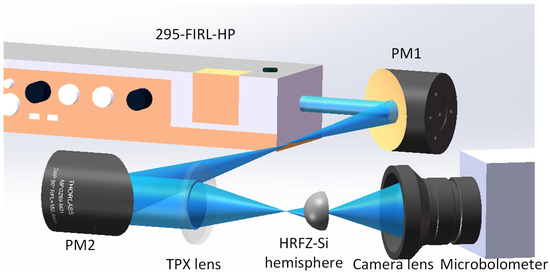
Figure 5.
Schematic of the configuration of the THz-ROCS system.
Here, a HRZF-Si 2D grating with the period of 150 μm (1.26λ), made by deep silicon etching technology, was chosen as the sample. Based on the coherent light imaging, the theoretical resolution is 162.6 μm, so the imaging system cannot resolve the detailed information of this grating when the THz beam illuminates the sample with normal incident mode. Through the evanescent wave illumination, according to the basic principle of the frequency shifting shown in Figure 2, this can be calculated so that it is possible to move the detail information between 55.1 μm and 171.2 μm into the passband of the system.
In the actual experiment, we chose to rotate the sample and not the incident wave for the convenience of operation to achieve illumination of the sample by the evanescent beam from different directions. By rotating the sample, we recorded the direct intensity imaging results under the evanescent wave illumination at 20° intervals. Figure 6a–c shows three of the direct intensity imaging method results for illumination at 60°, 210°, and 300°, which were the angles between the evanescent wave and the sample. The black arrow is the sample orientation and the red arrow is the evanescent wave illumination direction. The interference fringes can be clearly seen, which are related to the cosine item in Equation (6). Then, the images were rotated by taking the black arrow as the baseline, superimposed, and normalized to obtain the final intensity image in Figure 6d, where it can be seen that the sample details containing the concave–convex structure were resolved from the profile curve. The magnification of the imaging system was calculated to be 1.63 by dividing the grating period in the imaging plane by the actual period of the grating.
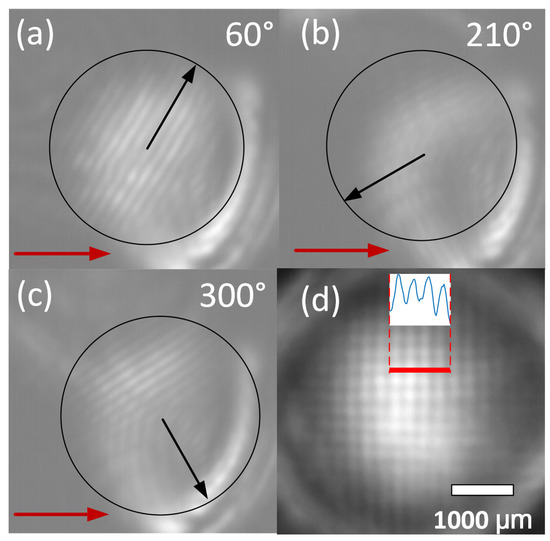
Figure 6.
(a–c) Intensity images at the three rotation angles with a total of 18 angles under the evanescent wave illumination recorded by the microbolometer array detector and (d) the final intensity image through the superimposition of their rotated images.
It can be seen that the final image quality of Figure 6d was not so good. This is related to the type of sample used, and whether the material has a good transmission property to the THz wave. Therefore, it can be treated as a quasi-phase object, which has a concave–convex periodical structure with known spacing. Each cell of the mesh has the width and height with the sidewall angle due to being fabricated by the etching process. Therefore, the intensity image mainly includes the edges on the surface inherently with low contrast. Additionally, as the combination of the hemispherical lens and the sample is manually rotated through the mechanical rotator mount, the resulting angle rotation is not accurate enough. Therefore, when superimposing all of the intensity images, there will be some errors existing in the rotated images. Furthermore, the intensity distribution of the THz beam is not so uniform, which may impose a possible effect of degrading the quality of the final result.
4. Conclusions
Among the full-field THz imaging techniques based on high-power continuous-wave THz sources, direct intensity imaging exhibits advantages due to there being no need for complicated computational reconstruction, while the resolution as a key issue still needs to be improved because of the long wavelength of the THz waves. In this paper, ROCS microscopy was applied to THz imaging for the first time. A specific hemispherical lens was proposed to produce the evanescent wave illumination and to also support the sample. The multi-angle evanescent wave illumination was adopted, and the final result was obtained with the principle of the ROCS method to improve the lateral imaging resolution. a microscopic imaging setup based on a 2.52 THz high-power coherent THz source and an uncooled microbolometer array detector was built, and 2D grating with a period of 150 μm (1.26λ) was successfully resolved. The observed resolution breaks the theoretical diffraction-limited resolution given by Abbe’s formula, which is determined by the wavelength and the numerical aperture of the coherent imaging system. Next, some resolution test targets were employed to calibrate the imaging system and experimentally achieve the diffraction-limited resolution of λ/2. The proposed method achieved THz super-resolution imaging under evanescent wave illumination, and provides a new way for THz full-field microscopic imaging.
Since the pixel size of the THz detector is close to the wavelength, compared with the visible and the infrared band, the current commercial THz image-plane systems are mainly telescopic. In this case, the working distance on the object side is short, usually less than 50 mm. This leads to the difficulty of inserting other optical elements such as hemispherical lens, etc. The hemispherical lens can also be reversely used as a solid immersion lens to further enhance the NA. If possible, the maximum frequency shifting distance generated by the evanescent wave illumination is nk0, and the maximum NA of the system can be improved to nk0. Therefore, the resolution by the evanescent wave illumination can ultimately be 1/2n times that of the diffraction limit.
Author Contributions
D.M.: Methodology, Software, Writing—original draft. J.Z.: Methodology, Data curation, Writing—review & editing. D.W.: Methodology, Data curation, Writing—review & editing, Supervision, Funding acquisition. H.L.: Formal analysis. L.R.: Formal analysis. Y.W.: Formal analysis. S.L.: Formal analysis. All authors have read and agreed to the published version of the manuscript.
Funding
This researched was funded by the National Natural Science Foundation of China (62220106005, 62075001, 62175004); the Science Foundation of Education Commission of Beijing (KZ202010005008); and the Natural Science Foundation of Beijing Municipality (4222061, 4222063).
Data Availability Statement
Data underlying the results presented in this paper are not publicly available at this time but may be obtained from the authors upon reasonable request.
Conflicts of Interest
The authors declare no conflict of interest.
References
- Wan, M.; Healy, J.J.; Sheridan, J.T. Terahertz phase imaging and biomedical applications. Opt. Laser Technol. 2019, 122, 105859. [Google Scholar] [CrossRef]
- Zang, Z.; Li, Z.; Lu, X.; Liang, J.; Wang, J.; Cui, H.-L.; Yan, S. Terahertz spectroscopy for quantification of free water and bound water in leaf. Comput. Electron. Agric. 2021, 191, 106515. [Google Scholar] [CrossRef]
- Li, D.; Yang, Z.; Fu, A.; Chen, T.; Chen, L.; Tang, M.; Zhang, H.; Mu, N.; Wang, S.; Liang, G.; et al. Detecting melanoma with a terahertz spectroscopy imaging technique. Spectrochim. Acta Part A Mol. Biomol. Spectrosc. 2020, 234, 118229. [Google Scholar] [CrossRef] [PubMed]
- Ji, B.Y.; Oh, S.J.; Kang, S.-G.; Heo, J.; Kim, S.-H.; Choi, Y.; Song, S.; Son, H.Y.; Kim, S.H.; Lee, J.H.; et al. Terahertz reflectometry imaging for low and high grade gliomas. Sci. Rep. 2016, 6, 36040. [Google Scholar] [CrossRef]
- Shiraga, K.; Ogawa, Y.; Suzuki, T.; Kondo, N.; Irisawa, A.; Imamura, M. Characterization of Dielectric Responses of Human Cancer Cells in the Terahertz Region. J. Infrared Millim. Terahertz Waves 2014, 35, 493–502. [Google Scholar] [CrossRef]
- Osman, O.; Tan, T.; Henry, S.; Warsen, A.; Farr, N.; McClintic, A.M.; Wang, Y.-N.; Arbabi, S.; Arbab, M.H. Differentiation of burn wounds in an in vivo porcine model using terahertz spectroscopy. Biomed. Opt. Express 2020, 11, 6528–6535. [Google Scholar] [CrossRef] [PubMed]
- Khani, M.; Harris, Z.; Osman, O.; Zhou, J.; Chen, A.; Singer, A.; Arbab, M. Supervised machine learning for automatic clas-sification of in vivo scald and contact burn injuries using the terahertz Portable Handheld Spectral Reflection (PHASR) Scanner. Sci. Rep. 2022, 12, 5096. [Google Scholar] [CrossRef] [PubMed]
- Kim, S.; Murakami, H.; Tonouchi, M. Transmission-Type Laser THz Emission Microscope Using a Solid Immersion Lens. IEEE J. Sel. Top. Quantum Electron. 2008, 14, 498–504. [Google Scholar] [CrossRef]
- Gompf, B.; Gerull, M.; Müller, T.; Dressel, M. THz-micro-spectroscopy with backward-wave oscillators. Infrared Phys. Technol. 2006, 49, 128–132. [Google Scholar] [CrossRef]
- Pimenov, A.; Loidl, A. Focusing of millimeter-wave radiation beyond the Abbe barrier. Appl. Phys. Lett. 2003, 83, 4122–4124. [Google Scholar] [CrossRef]
- Ikushima, K.; Sakuma, H.; Komiyama, S. A highly sensitive scanning far-infrared microscope with quantum Hall detectors. Rev. Sci. Instrum. 2003, 74, 4209–4211. [Google Scholar] [CrossRef]
- Iba, A.; Domier, C.W.; Ikeda, M.; Mase, A.; Nakajima, M.; Pham, A.-V.; Luhmann, N.C. Subdiffraction focusing with a long focal length using a terahertz-wave super-oscillatory lens. Opt. Lett. 2021, 46, 4912. [Google Scholar] [CrossRef]
- Yin, Z.; Zheng, Q.; Wang, K.; Guo, K.; Shen, F.; Zhou, H.; Sun, Y.; Zhou, Q.; Gao, J.; Luo, L.; et al. Tunable dual-band terahertz metalens based on stacked graphene metasurfaces. Opt. Commun. 2018, 429, 41–45. [Google Scholar] [CrossRef]
- Yang, Y.; Liu, H.; Yang, M.; Cui, B.; Zhang, W. Dielectric sphere-coupled THz super-resolution imaging. Appl. Phys. Lett. 2018, 113, 031105. [Google Scholar] [CrossRef]
- Cecconi, V.; Kumar, V.; Pasquazi, A.; Gongora, J.; Peccianti, M. Nonlinear field-control of terahertz waves in random media for spatiotemporal focusing. Open Res. Europe 2022, 2, 32. [Google Scholar] [CrossRef]
- Leibov, L.; Ismagilov, A.; Zalipaev, V.; Nasedkin, B.; Grachev, Y.; Petrov, N.; Tcypkin, A. Speckle patterns formed by broadband terahertz radiation and their applications for ghost imaging. Sci. Rep. 2021, 11, 20071. [Google Scholar] [CrossRef] [PubMed]
- Yue, L.; Yan, B.; Monks, J.N.; Dhama, R.; Wang, Z.; Minin, O.V.; Minin, I.V. A Millimetre-Wave Cuboid Solid Immersion Lens with Intensity-Enhanced Amplitude Mask Apodization. J. Infrared Millim. Terahertz Waves 2018, 39, 546–552. [Google Scholar] [CrossRef]
- Choi, D.; Shin, J.; Lee, I.; Park, K. Investigations on Practical Issues in Solid Immersion Lens Based Sub-Wavelength Te-rahertz Imaging Technique: System Stability Verification and Interference Pattern Removal. Sensors 2021, 21, 6990. [Google Scholar] [CrossRef]
- Chernomyrdin, N.V.; Kucheryavenko, A.S.; Kolontaeva, G.S.; Katyba, G.M.; Dolganova, I.N.; Karalkin, P.A.; Ponomarev, D.S.; Kurlov, V.N.; Reshetov, I.V.; Skorobogatiy, M.; et al. Reflection-mode continuous-wave 0.15 λ-resolution terahertz solid immersion microscopy of soft biological tissues. Appl. Phys. Lett. 2018, 113, 111102. [Google Scholar] [CrossRef]
- Pham, H.H.N.; Hisatake, S.; Minin, O.V.; Nagatsuma, T.; Minin, I.V. Enhancement of spatial resolution of terahertz imaging systems based on terajet generation by dielectric cube. APL Photon. 2017, 2, 056106. [Google Scholar] [CrossRef]
- Minin, O.V.; Minin, I.V. Terahertz microscope with oblique subwavelength illumination: Design principle. Quantum Electron 2022, 52, 13–16. [Google Scholar] [CrossRef]
- Hawecker, J.; Pistore, V.; Minasyan, A.; Maussang, K.; Palomo, J.; Sagnes, I.; Manceau, J.-M.; Colombelli, R.; Tignon, J.; Mangeney, J.; et al. Cavity-based photoconductive sources for real-time terahertz imaging. Photon. Res. 2020, 8, 858. [Google Scholar] [CrossRef]
- Zhang, Y.; Wang, C.; Huai, B.; Wang, S.; Zhang, Y.; Wang, D.; Rong, L.; Zheng, Y. Continuous-Wave THz Imaging for Biomedical Samples. Appl. Sci. 2020, 11, 71. [Google Scholar] [CrossRef]
- Hack, E.; Zolliker, P. Terahertz holography for imaging amplitude and phase objects. Opt. Express 2014, 22, 16079–16086. [Google Scholar] [CrossRef] [PubMed]
- Wang, D.; Ma, D.; Li, K.; Zhang, Y.; Zhao, J.; Wang, Y.; Rong, L. Dynamic full-field refractive index distribution measurements using total internal reflection terahertz digital holography. Photon. Res. 2022, 10, 289. [Google Scholar] [CrossRef]
- Rong, L.; Tang, C.; Wang, D.; Li, B.; Tan, F.; Wang, Y.; Shi, X. Probe position correction based on overlapped object wavefront cross-correlation for continuous-wave terahertz ptychography. Opt. Express 2019, 27, 938–950. [Google Scholar] [CrossRef]
- Wang, D.; Li, B.; Rong, L.; Tan, F.; Healy, J.J.; Zhao, J.; Wang, Y. Multi-layered full-field phase imaging using continuous-wave terahertz ptychography. Opt. Lett. 2020, 45, 1391–1394. [Google Scholar] [CrossRef]
- Rong, L.; Tan, F.; Wang, D.; Zhang, Y.; Li, K.; Zhao, J.; Wang, Y. High-resolution terahertz ptychography using divergent illumination and extrapolation algorithm. Opt. Lasers Eng. 2021, 147, 106729. [Google Scholar] [CrossRef]
- Rong, L.; Wang, S.; Wang, D.; Tan, F.; Zhang, Y.; Zhao, J.; Wang, Y. Transport of intensity equation-based terahertz lensless full-field phase imaging. Opt. Lett. 2021, 46, 5846–5849. [Google Scholar] [CrossRef]
- Lee, A.W.; Hu, Q. Real-time, continuous-wave terahertz imaging by use of a microbolometer focal-plane array. Opt. Lett. 2005, 30, 2563–2565. [Google Scholar] [CrossRef]
- Lee, J.; Hong, B.; Kim, W.; Min, S.; Kim, Y.; Jouravlev, M.; Bose, R.; Kim, K.; Hwang, I.; Kaufman, L.; et al. Near-field focusing and magnification through self-assembled nanoscale spherical lenses. Nature 2009, 460, 498–501. [Google Scholar] [CrossRef]
- Wang, Z.; Guo, W.; Li, L.; Luk’Yanchuk, B.; Khan, A.; Liu, Z.; Chen, Z.; Hong, M. Optical virtual imaging at 50 nm lateral resolution with a white-light nanoscope. Nat. Commun. 2011, 2, 218. [Google Scholar] [CrossRef] [PubMed]
- Ma, D.; Zhao, J.; Wang, D.; Li, Z.; Rong, L.; Wang, Y.; Lin, S. Full-field high-resolution terahertz imaging based on high-resistance silicon solid immersion lens. Appl. Opt. 2022, 61, 7861–7866. [Google Scholar] [CrossRef] [PubMed]
- Hao, X.; Kuang, C.; Li, Y.; Liu, X. Evanescent-wave-induced frequency shift for optical superresolution imaging. Opt. Lett. 2013, 38, 2455–2458. [Google Scholar] [CrossRef] [PubMed]
- Byrne, G.; Pitter, M.; Zhang, J.; Falcone, F.H.; Stolnik, S.; Somekh, M.G. Total internal reflection microscopy for live imaging of cellular uptake of sub-micron non-fluorescent particles. J. Microsc. 2008, 231, 168–179. [Google Scholar] [CrossRef] [PubMed]
- Bon, P.; Barroca, T.; Lévèque-Fort, S.; Fort, E. Label-free evanescent microscopy for membrane nano-tomography in living cells. J. Biophoton. 2014, 7, 857–862. [Google Scholar] [CrossRef]
- Maire, G.; Giovannini, H.; Talneau, A.; Chaumet, P.; Belkebir, K.; Sentenac, A. Phase imaging and synthetic aperture su-per-resolution via total internal reflection microscopy. Opt. Lett. 2018, 43, 2173–2176. [Google Scholar] [CrossRef]
- Olshausen, P.; Rohrbach, A. Coherent total internal reflection dark-field microscopy: Label-free imaging beyond the diffraction limit. Opt. Lett. 2013, 38, 4066–4069. [Google Scholar] [CrossRef] [PubMed]
- Jünger, F.; Olshausen, P.; Rohrbach, A. Fast, label-free super-resolution live-cell imaging using rotating coherent scattering (ROCS) microscopy. Sci. Rep. 2016, 6, 30393. [Google Scholar] [CrossRef]
- Zhao, J.; Yin, L.; Han, F.; Wang, Y.; Huang, T.; Du, C.; Liu, P. Terahertz non-label subwavelength imaging with composite photonics-plasmonics structured illumination. Opt. Express 2021, 29, 36366. [Google Scholar] [CrossRef]
- Dai, J.; Zhang, J.; Zhang, W.; Grischkowsky, D. Terahertz time-domain spectroscopy characterization of the far-infrared absorption and index of refraction of high-resistivity, float-zone silicon. J. Opt. Soc. Am. B 2004, 21, 1379–1386. [Google Scholar] [CrossRef]


Disclaimer/Publisher’s Note: The statements, opinions and data contained in all publications are solely those of the individual author(s) and contributor(s) and not of MDPI and/or the editor(s). MDPI and/or the editor(s) disclaim responsibility for any injury to people or property resulting from any ideas, methods, instructions or products referred to in the content. |
© 2023 by the authors. Licensee MDPI, Basel, Switzerland. This article is an open access article distributed under the terms and conditions of the Creative Commons Attribution (CC BY) license (https://creativecommons.org/licenses/by/4.0/).