Abstract
The article investigates the possibilities for the miscibility and practical use of different concentrations of biofuel rapeseed fatty acid methyl ester (FAME) with aviation kerosene Jet A-1 (or aviation kerosene PL-7 used in the Air Force of the Slovak Republic) in aircraft jet engines. The main objective of this research was the experimental verification of the technical possibilities of reliable operation of the experimental engine SJE-20 in a special laboratory of small jet engines using different concentrations of the mixture of aviation kerosene Jet A-1 and biofuel FAME and their influence on the selected operating parameters of the experimental engine. The motivation for this research is the desire to replace conventional aviation fuels with fuels that can be obtained from renewable sources. Investigation of the possibilities of powering the experimental SJE-20 engine with a mixture of traditional aviation kerosene Jet A-1 (PL-7) and rapeseed fatty acid methyl ester FAME was the subject of the internal project BIOFUEL (Biofuel for Aviation).
1. Introduction
The concept of sustainability has been highly debated over the past decade in all human activities. Therefore, it is natural that the aviation industry does not lag behind, and more and more studies are concerned with the environmental impact of aviation operations, their carbon footprint, their contribution to global warming, and the collateral damage caused to the environment [1]. Based on the life cycle analysis, as well as analysis of the performance and emissions of several jet engines, it was determined that 9% of its environmental impact could be attributed to fuel consumption [2]. Therefore, the topic of sustainable aviation fuels and their possible utilization has been broadly discussed over the past decades among professionals in the aviation industry and in the academic literature. It was determined that to fulfill aviation sector commitments to Net Zero by 2050, there is an essential need for research on and the development of new sustainable energy sources for aviation and the drastic expansion of different biofuel production [3].
An overview of alternative aviation fuels and possible future perspectives was discussed by Braun-Unkhoff and Riedel [4], who focused their research on the ignition delay times and laminar flame speeds for different alternative aviation fuels under different experimental conditions—a range of temperatures, pressure, and fuel–air ratios—concluding that ignition delay times for the alternative fuels and Jet A-1 were almost identical and therefore proving the viability of sustainable fuels as an alternative to the fossil ones. The U.S. department of energy [5] presented their study, which includes an overview of the approved pathways of fuel production and possibilities for its optimization, as well as the possibilities for wider commercialization through cost reduction and improved value proportion and outlines areas on which future research should focus.
Several studies focused on the applicability of different biofuels and feedstock for use in aviation. According to Adeniyi et al. [6], who studied the applicability of algae as a potential feedstock, an artificial cultivation system–photo-bioreactor would be the most effective in terms of the quantity of cultivated product but is confronted by the high operating cost. Girardi et al. [7] analyzed the possibilities of using babassu biofuels based on babassu culture in the aviation sector, concluding several critical factors, such as their high freezing point, make them unusable alone. However, they show good results when mixed with aviation kerosene. Betancourt et al. [8] studied the uses of biofuels such as biokerosene and FAME in aeronautics, focusing on military aviation and pathways of alternative fuel production. Transesterification and hydro-treating were identified as two main processes for obtaining biofuels for aviation through two-level tests to determine alternative fuels’ ability to replace fossil fuels.
Multiple studies have provided research on alternative aviation fuels’ performance and emissions characteristics. Altarazi et al. [9] have provided an overview of the alternative aviation fuels in use over the last 30 years. According to their study, all the studied biodiesels (biodiesel, bioethanol, bio-oil) and their blends have proven their ability to reduce gaseous and particulate matter emissions while improving gas turbine performance.
Many authors have focused on the characteristics of blends of Jet A-1 fuel with various blends and additives [10,11,12,13]. Gawron and Bialecki [10] experimented on the miniature turbojet engine to determine the performance and emission characteristics of the Jet A-1 blend with 48% synthesized paraffinic kerosene. In comparison with neat Jet A-1, HEFA fuel showed a decrease in thrust and a reduction in fuel consumption caused by the higher heat of combustion and lower density of the HEFA fuel. Mendez et al. [11] studied the effects of Jet A-1 blends with butanol on the performance of gas turbine engines. The thrust, fuel combustion, turbine inlet temperature, exhaust gas temperature, and emissions characteristics were studied. The ratios of butanol ranged from 25% to 75%. It was determined that the operational thrust range of the engine was decreasing with the blends, and so were NOx and C.O. emissions. Manigandana et al. [12] conducted an experiment on a micro gas turbine to determine the changes in combustion, emission, and performance characteristics when Jet A-1 fuel is blended with various additives. For their experiment, blends of Jet A-1 with biofuels from rapeseed and canola-sunflower oil were used with various ratios of ethanol and pentanol additives. All the blends showed higher static thrust with reduced fuel consumption and a reduction in NOx, CO, H.C., and other emissions compared to neat Jet A-1 fuel. Habib et al. [13] studied the effects of Jet A-1 50% blends with biofuels to prove biofuels’ potential. Reduction in static thrust and thrust-specific fuel consumption was observed, while thermal efficiency was increased. The reduction was also observed in C.O. and NO emissions. Reksowardojo et al. [14] compared gas turbine engine performance and emissions for pure Jet A-1 and 20% blend with soap-derived bio-kerosene. Both fuels have similar performance parameters when looking at engine efficiency, specific fuel combustion, turbine inlet temperature, and exhaust gas temperature.
However, an increase in C.O. and H.C. emissions and differences in NOx were registered. In their research, Boomadevi et al. [15] looked at the emission and performance characteristics of the blends of Jet A-1 and Spirulina biofuel with a blend ratio ranging from 20% to 100% using a small experimental engine. It was concluded that lower blending rations had positive results in terms of both emissions and performance, and a higher proportion of biofuel resulted in an undesirable decrease in energy. Cican et al. [16] studied the performance and emission characteristics of blends of Jet A-1 fuel with biodiesel with a blending ratio ranging from 10% to 30%, with the addition of 5% of Aeroshell Oil 500. The experiment was conducted on the JETCAT P80 micro-engine at three working regimes. It was concluded that all three blends have shown reduced emissions and proved to be stable for utilization at all three engine regimes. Reham et al. [17] have reviewed information related to biofuel emulsions, focusing on the preparation of stable emulsion, the effects of water and its fuel properties, and methods for improving its performance and emission characteristics.
If we look at the academic literature concerning emissions from alternative aviation fuels, in their work, Chen et al. [18] present a classification of alternative fuels and their gaseous and particulate matter (PM) emissions as compared with fossil fuels. They concluded that while researched alternative jet fuels have great potential in alleviating carbon emissions, their gaseous emissions vary and are highly dependent on numerous factors. Jasiński et al. [19] conducted the experiment comparing the PM emissions from a small turbofan for neat Jet A-1 and 5, 20, and 30% blends with alcohol to synthetic jet kerosene. As expected, the experiment concluded that the lowest PM number emission index was achieved with the ATJ 30% blend, and the highest was for neat Jet A-1. Anderson et al. [20] analyzed the performance and emission characteristics of Jet A-1 fuel blend with canola and solid waste pyrolysis oils. The reduction in fuel consumption is linked to an increase in static thrust. Higher proportions of ethanol lead to an increase in thermal efficiency and oxygen content. A reduction in C.O., CO2, and NOx emissions was observed, which can be further optimized by the addition of hydrogen.
Focusing on the performance of engines running on alternative aviation fuels, Mazlan et al. [21] studied the effects of the heat capacity and density of biofuels on aircraft engine performance. The study was based on the simulations using Jatropha Bio-synthetic Paraffinic Kerosene (JSPK) and Camelina Bio-synthetic Paraffinic Kerosene (CSPK) biofuels focusing on the thrust and fuel consumption. The simulations recorded an increase in the engine thrust and a reduction in fuel consumption with a rising percentage of biofuel in the mixture. Yakovlieva, Boichenko, and Lejda [22] evaluated jet engine operational parameters while using conventional and alternative aviation fuels. Their bench test concluded that using fuels with plant oil additives provides more energy efficient operation as it improves jet engine thrust and reduces fuel flow. Moreover, blends with alternative fuels result in the decrease in NOx emissions and increased resistance of engine materials and structure against high temperatures.
In their study, Salmaz et al. [23] conducted an experiment to determine the effects of Jet A-1, diesel fuel, and their various blends on combustion and engine performance in a direct injection diesel engine. It was determined that Jet A-1 aviation fuel can be used in diesel engines when mixed with diesel fuel, resulting in a decrease in ignition delay time and NOx emissions and an increase in brake torque and C.O. emissions. Brusca et al. [24] conducted an experiment to compare the performance of gas turbines running on biofuels and methane using a mathematical model of a gas turbine via GateCycle software. Although the decrease in performance was confirmed when using biofuels, the overall efficiency has increased. The test of Budami et al. [25] was focused on the impact of alternative aviation fuels on the performance of a small-scale turbojet engine. Three types of fuels were used for the experiment—Jet-A kerosene, a synthetic Gas to Liquid (GTL), and a blend of Jet-A with 30% of Jatropha Methyl Ester (JME). The overall performance characteristics were fairly similar. With the JME, there is a need for improvements in the freezing point before its use in aviation. As expected, GTL and JME showed a decrease in emissions.
When it comes to FAME fuel, which is also the subject of this paper, it is important to mention its certification status. The implementation of alternative aviation fuels for use in blends with conventional aviation kerosene requires extensive testing. To guarantee appropriate engine performance, fuel compatibility with aircraft systems, the safety of storage, and optimal fuel performance during all aircraft operations, extensive assessments are necessary. The ASTM controls the fuel standards for the aviation industry. FAME fuel additives so far have not been approved as safe for use in blends with any type of aviation fuel, as it is often regarded as a pollutant in jet fuel and is only allowed at the proportion of 5 mg/kg [26]. This is due to the fact that FAME changes fuel’s physical characteristics. There are even rising concerns across the aviation industry about the possibility of the accidental contamination of jet fuel in facilities that carry multiple fuels, as the demand for FAME additives to diesel is rising [27]. On the other hand, FAME can have some advantages, as they, in contrast to other alternative fuels, have oxygen in their molecular structure [28] and therefore lower the fuel’s carbon content, which in turn lowers its carbon footprint and also lowers the fuel’s soot emissions and hence can lower particulate matter emissions by roughly 40%. These positive characteristics have already been demonstrated in experimental and computational studies and therefore give a base for other studies to be conducted and look further for its potential use as an additive to aviation fuels [29]. The aim of the experimental measurements carried out is to determine the influence of various mixtures of FAME biofuel and Jet A-1 aviation kerosene on the operating characteristics of an experimental small jet engine in the specialized laboratory of small jet engines at the Department of Aviation Engineering at the Faculty of Aeronautics of the Technical University of Košice.
2. Materials and Methods
The effect of different blends of FAME biofuel and Jet A-1 aviation kerosene were measured on an experimental SJE-20 small jet engine created from the original TS-20 turbine starter Figure 1. Cut way of TS-20 turbine launcher [30] (Figure 1) of the AL-7F-1 engine. The period of the launch cycle of the engine was 50 s.
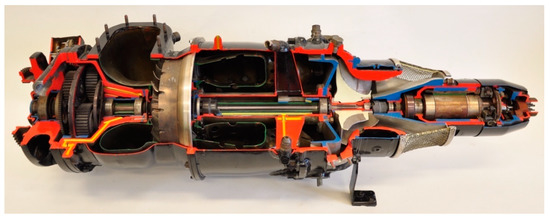
Figure 1.
Cut way of TS-20 turbine launcher (Engine AL-7F-1, Technical description, Let-21-33/1, MNO Prague 1968) [30].
The SJE-20 small jet engine is a single-stage engine (Jet-engine) with a single-stage radial compressor, a pooled combustion chamber, a single-stage uncooled gas turbine, and a fixed nozzle output, seen in Figure 2. The engine has an electric starter, a simple oil system, and a mechanical-hydraulic control fuel system. The technical parameters of small jet engine can be read from Table 1.
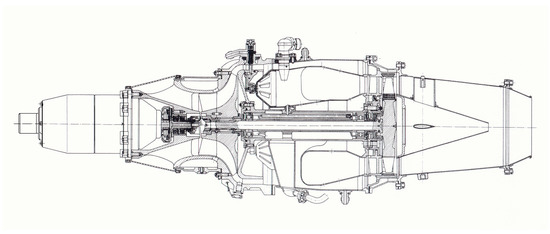
Figure 2.
Cut way of small jet motor SJE-20.

Table 1.
Basic technical data SJE-20.
The small jet engine was installed in the special Laboratory of Small Jet Engines of the Department of Aeronautical Engineering, Faculty of Aeronautics, Technical University in Košice. The measurement of individual engine parameters was provided by special sensors placed on the engine (Figure 3). The sensed engine parameters were transformed into electrical signals using transducers, which were processed by Labview software. The result of the measurements were specific values of the parameters at a given time of measurement and a graphical time course of the change in the parameters during the measurement. Each measurement, with a specific mixture of FAME biofuel and JET A-1 aviation kerosene, was performed within 60 s.
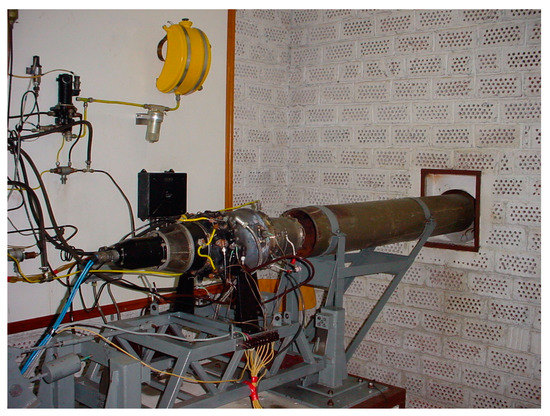
Figure 3.
Small jet engine lab.
The small jet engine laboratory was specially built to meet the needs of the experimental small jet engine SJE-20 for research purposes. The laboratory is equipped with the engine fuel system, engine oil system, engine starting system with electrical power supply, air supply, and exhaust gas extraction, as shown in Figure 3. The laboratory is equipped with a fire protection system and has a secured air supply and exhaust gas outlet.
Figure 3 shows the configuration of the SJE-20 small jet motor before the experimental measurement.
Control of the SJE-20 experimental jet engine is remote from the control room, which is separated by a glass wall. The sensed motor parameters were led by electrical wires to the control room and interfaced with the computer, which was used to control the experimental small current motor SJE-20 during the experimental measurements.
3. Properties of the Mixture of Jet A-1 Aviation Kerosene and FAME Biofuel
The used biofuel FAME is a fatty acid methyl ester of rapeseed, which is commonly used in the food industry. Crude rapeseed oil is produced by transesterification, a chemical process based on mixing methanol with oil pressed from rapeseeds. Sodium hydroxide acts as a catalyst during the mixing process. The characteristics of obtained FAME biofuel can be seen in Table 2. The by-product of this process is glycerin, which is used in the chemical, cosmetic, and pharmaceutical industries [31,32,33].
Table 2.
Extract from the quality certificate FAME PT—Fatty Acid Methyl Ester for diesel engines manufacturer FUELMA-TUMYS, a.s., analysis number: 50/06 dated 6 September 2006.
Jet A-1 aviation kerosene is the most widespread aviation fuel used in aviation jet engines (see characteristics in Table 3). Jet A-1 is a mixture of hydrocarbons with a boiling point of 130–300 °C. It consists of light fractions with a lower distillation temperature and lower density than light diesel fuel. Various additives are added to aviation kerosene to improve the necessary properties, e.g., antioxidants, conductivity additives, and additives to increase the lubricating ability. Aviation kerosene must be hydrogenated. Jet A-1 has a freezing point determined by Boeing in document 747-SL-28-68 of at least −47 °C [34,35].
Table 3.
Selected properties of Jet A-1 aviation kerosene.
FAME Biofuel Mixtures with Jet A-1 Aviation Kerosene
When investigating the possibilities of mixing FAME biofuel and Jet A-1 aviation kerosene, it was found that at all concentrations (from 0% to 90%) of FAME biofuel in Jet A-1 aviation kerosene, a homogeneous mixture was formed, without the formation of deposits or coagulates. The density of the mixtures varied depending on the increasing proportion of FAME biofuel in the mixture. Similar results were achieved when examining mixtures of FAME biofuel and aviation kerosene PL-7, which is used in the military aviation of the Slovak Republic.
Special attention should be paid to the problems of the action of bacteria on FAME biofuel in different concentrations mixed with Jet A-1 aviation kerosene. Since Jet A-1 jet kerosene contains additives that increase its resistance to bacteria, it is assumed that different concentrations of FAME biofuel and Jet A-1 jet kerosene blends will be more resistant to bacteria than pure FAME biofuel.
The physical properties of FAME biofuel and Jet A-1 (PL-7) aviation kerosene are very similar (Table 4).
Table 4.
Comparison of some parameters of Jet A-1 aviation kerosene and FAME biofuel.
4. The Influence of the Mixture of FAME Biofuel and Jet A-1 Aviation Kerosene on the Operating Characteristics of Jet Engines
The effect of different blends of FAME biofuel and Jet A-1 aviation kerosene on the operating characteristics of jet engines was experimentally verified in the laboratory of small jet engines on the experimental small jet engine SJE-20. The experimental engine was not specially modified for this type of fuel (it was not modified in terms of its design and control system). The individual experimental measurements used different mixtures of FAME biofuel and Jet A-1 aviation kerosene.
Prior to each measurement, a blend was prepared with the appropriate addition of FAME biofuel to Jet A-1 aviation kerosene. The individual blends differed in the percentage of FAME biofuel in aviation kerosene. This resulted in 11 different blends of FAME biofuel and Jet A-1 aviation kerosene, as shown in Table 5.
Table 5.
Composition of the mixture of aviation kerosene Jet A-1 and FAME.
The measurement cycle was the same for all the mixtures used and consisted of starting a small jet engine (the start-up cycle was completed at around 15 s) and the collection of the measured values of the selected parameters at selected times of 20 s, 25 s, 30 s, 35 s, 40 s, and 45 s. The given times from the start of the measurement were selected based on the steady-state operation of the motor after the start-up transient. Each measurement (up to 40% FAME share in Jet A-1 aviation kerosene) was repeated at least five times, with a measurement length from 40 s to 55 s. At higher proportions of FAME than 40% in the mixture with jet A-1, the number of measurements was increased due to unsuccessful attempts with a cold SJE-20 engine. Thus, experiments with a higher FAME content than 40% were carried out only when the engine was warmed up. The consumption of the mixture ranged from 0.5 dm3 to 0.65 dm3.
At each experimental measurement, atmospheric temperature t0, atmospheric pressure p0, and humidity were measured. As the measures took place in an air-conditioned laboratory, the temperature was constant t0 = 21 °C, the humidity was 75%, and the tressure varied in the p0 = 101,328 to 101,650 Pa range. During the measurements, the following parameters were continuously measured: the static air temperature in front of the engine t0, total air temperature behind the compressor t2t, total gas temperature in front of the gas turbine t3t, total gas temperature behind the gas turbine t4t, total air pressure behind the compressor p2t, total gas pressure in front of gas turbine p3t, fuel flow rate Qfuel (fuel mixture of aviation kerosene Jet A-1 and biofuel FAME (Table 5)), revolutions speed n, and thrust force F.T. The mentioned parameters were sensed by temperature and pressure sensors, which were placed directly on the experimental engine and sent to the computer through converters, where they were processed into a graphic course of parameter changes depending on time. At the same time, the parameter values in the specified time intervals were processed in tabular form. The graphical waveform of the small jet motor parameter variation was the result of the LABVIEW program.
4.1. The Effect of Different Concentrations of Mixtures of FAME Biofuel and Jet A-1 Aviation Kerosene on the Performance of SJE-20
During experiments carried out on SJE-20 with different proportions of FAME biofuel mixed with Jet A-1 aviation kerosene, changes in measured thermodynamic parameters and their influence on its operational properties were monitored. For the purposes of the measurements, the SJE-20 was set to a reduced mode (n = 46.700 min−1). The time of the measurement cycles was in the range of 45 ± 5 s. The concentration of FAME biofuel in the mixture with Jet A-1 aviation kerosene was varied by 10%. For each concentration of the mixture of FAME biofuel and Jet A-1 aviation kerosene, a minimum of three measurements were performed, from which one representative graphical course was selected for evaluation. In addition to the continuously measured parameters were the maximum gas temperature in front of the gas turbine t3t,max., the maximum gas temperature behind the gas turbine t4t,max., and the time of their reaching. Before each experimental measurement, the thermal state of the experimental SJE-20 was evaluated by determining the engine temperature in the region of its gas turbine t3. For easier evaluation of the individual parameters, the individual curves were processed in tabular form for the values read in the 20th, 25th, 30th, 35th, 40th, and 45th seconds after starting the engine. The exact values of the parameters were obtained from the computer’s tabular record of the course of the experiments.
4.1.1. The Course of the Change in SJE-20 Parameters When Using 100% Jet A-1
The first three experimental measurements aimed at determining the parameter values for Jet A-1 aviation kerosene without adding FAME biofuel. Several conclusions can be drawn from the evaluated course of parameters shown in the graph in Figure 4 and in Table 6. The temperature of SJE-20 before ignition was 66.0 °C. After the end of the transition process when starting the SJE-20 after 15 s, based on the operation of the engine control system according to the control law p2t = f(Qfuel.), there was a stabilization of the revolutions n, the total air pressure behind the compressor p2t, the total gas pressure in front of the gas turbine p3t, and F.T. move. Due to the gradual overheating of the SJE-20 engine, there was a gradual increase in the total air temperature behind the t2t compressor and its stabilization after 30 s. After reaching the temperature peak during start-up at the total temperature in front of the gas turbine, t3t,max. = 1114.6 °C in 9.8 s, and for the total temperature behind the gas turbine, t4t,max. = 991.6 °C in the 8th second and the subsequent drop in temperature; after the 15th second, there was a subsequent increase in the total gas temperature in front of the gas turbine t3t and the total gas temperature behind the gas turbine t4t. The increase in the total temperature in front of the gas turbine is more intense t3t (Δt3t = 64.8 °C) than for the total temperature behind the gas turbine t4t (Δt4t = 45.8 °C).
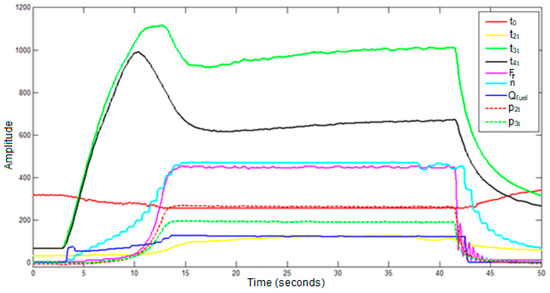
Figure 4.
Graphic course of changes in SJE-20 parameters at 100% Jet A-1 aviation kerosene.
Table 6.
Mixture of 100% Jet A-1 aviation kerosene and 0% FAME biofuel, 1st launch (40th second).
4.1.2. The Course of Changes in SJE-20 Parameters When Using a Mixture of 90% Jet A-1 and 10% FAME
The second series of measurements was aimed at determining the parameters of the experimental SJE-20 during its operation with a fuel mixture consisting of 90% Jet A-1 aviation kerosene and 10% FAME biofuel. The changes in the parameters during measurements can be seen in Figure 5 and read from Table 7.
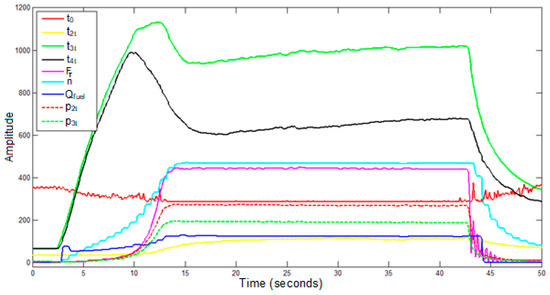
Figure 5.
Graphic course of changes in SJE-20 parameters when using a mixture of 90% Jet A-1 aviation kerosene and 10% FAME biofuel.
Table 7.
Mixture of 90% Jet A-1 aviation kerosene and 10% FAME biofuel, 1st launch (40th second).
The measurements immediately followed the first series of measurements with pure Jet A-1 aviation kerosene. The temperature of the SJE-20 engine before starting was tMPM = 65.0 °C. The starting process of the engine, at the given temperature state of the engine, was not affected by the new composition of the mixture. Due to the relatively small difference in the calorific value of Jet A-1 aviation kerosene (43.292 MJ.kg−1) and FAME biofuel (39.0 MJ.kg−1), no fundamental changes in the measured thermodynamic parameters were recorded. The maximum temperature in front of the gas turbine t3t,max. = 1130.5 °C was reached 12.2 s after the start, and the maximum temperature behind the gas turbine t4t,max. = 992.1 °C was reached 9.8 s after the start. A small increase in the total gas temperature in front of the gas turbine t3t by 4.5 °C and the total gas temperature behind the gas turbine t4t by 8.9 °C (40th second) can be explained by the higher engine temperature before the measurement relative to the temperature of the SJE-20 engine when measured with pure Jet A-1 aviation kerosene (tMPM = 25.5 °C). The value of the total air temperature behind the compressor Δt2t increased to a minimal extent by 4.4 °C, and the value of the total air pressure behind the compressor Δp2t by 4452.8 Pa and the value of the total gas pressure in front of the gas turbine Δp3t decreased by −1494.6 Pa. The thrust of the SJE-20 engine was reduced by ΔFT = −6.1 N with a simultaneous increase in fuel consumption ΔQfuel. = 0.017 L.min−1 (40th second). The change in thrust ΔFT and fuel consumption ΔQfuel. fully correspond to the basic hypothesis that the reduced energy value of the mixture of 90% Jet A-1 aviation kerosene and 10% FAME biofuel will decrease F.T. thrust and increase fuel consumption mixture Qfuel.
4.1.3. The Course of Changes in SJE-20 Parameters When Using a Mixture of 80% Jet A-1 and 20% FAME
The next series of measurements was aimed at determining the parameters of the experimental SJE-20 during its operation with a fuel mixture consisting of 80% Jet A-1 aviation kerosene and 20% FAME biofuel. The changes in the parameters during measurements are presented in Figure 6 and can be read from Table 8. The measurements followed a long pause after the second series of measurements. The temperature of the SJE-20 engine before starting was tMPM = 29.0 °C. The starting process of the engine, at the given temperature state of the engine, was affected by the new composition of the mixture. The mixture was ignited only at 9.9 s, 6.9 s later than with pure Jet A-1 aviation kerosene. At the same time, there was a shift in the moment of reaching the temperature peak t3t,max. and t4t,max. by almost 7 s. The maximum temperature in front of the gas turbine t3t,max. = 1110.6 °C was reached 19.6 s after ignition, and the maximum temperature behind the gas turbine t4t,max. = 972.3 °C was reached 16.8 s after ignition.
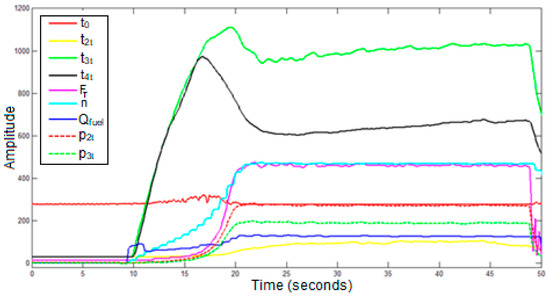
Figure 6.
Graphic course of changes in SJE-20 parameters when using a mixture of 80% Jet A-1 aviation kerosene and 20% FAME biofuel.
Table 8.
Mixture of 80% Jet A-1 aviation kerosene and 20% FAME biofuel, 1st launch (40th second).
The addition of 20% FAME biofuel to Jet A-1 jet kerosene resulted in an increase in the total gas temperature in front of the gas turbine t3t by 3.3 °C and a decrease in the total gas temperature behind the gas turbine t4t by −11.3 °C. The value of the total air temperature behind the compressor Δt2t decreased to a minimum extent by −2.9 °C, the value of the total air pressure behind the compressor Δp2t increased by 8545.7 Pa, and the value of the total gas pressure in front of the gas turbine Δp3t decreased by −2691.6 Pa. The thrust of the SJE-20 engine was reduced by ΔFT = −11.5 N with a simultaneous increase in fuel consumption ΔQfuel. = 0.043 L.min−1.
As the proportion of FAME biofuel (ρFAME = 882 kg.m−3) in the mixture with Jet A-1 aviation kerosene (ρJet A-1 = 810 kg.m−3) increased, the density of the mixture increased, resulting in a lower quality fuel atomization when flowing through the fuel nozzles. Insufficient atomization of the fuel resulted in its slower evaporation in the combustion chamber, which caused a worse ignition process of the mixture during its start-up, especially with a cold engine and lower atmospheric temperatures.
4.1.4. The Course of Changes in SJE-20 Parameters When Using a Mixture of 70% Jet A-1 and 30% FAME
The fourth series of measurements was aimed at determining the parameters of the experimental SJE-20 during its operation with a fuel mixture consisting of 70% Jet A-1 aviation kerosene and 30% FAME biofuel (see Figure 7 and Table 9). The measurements followed immediately after the previous series of measurements. The temperature of the SJE-20 engine before starting was tMPM = 71.0 °C. The starting process of the engine, at the given temperature state of the engine, took place normally. The mixture was ignited only at 4.6. seconds, corresponding to starting the engine with pure Jet A-1 aviation kerosene. Temperature peak t3t,max. = 1127.9 °C was reached after 13.9 s, and t4t,max. = 981.9 °C was reached 12.1 s after engine start [36].
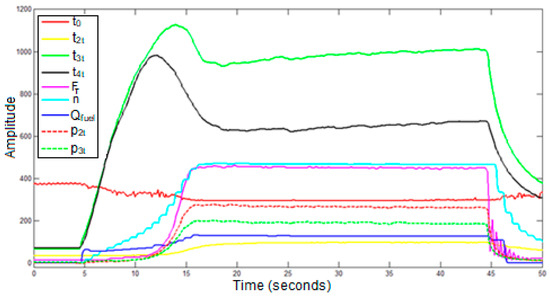
Figure 7.
Graphic course of changes in SJE-20 parameters when using a mixture of 70% Jet A-1 aviation kerosene and 30% FAME biofuel.
Table 9.
Blend of 70% Jet A-1 aviation kerosene and 30% FAME biofuel, 1st launch (40th second).
The addition of 30% FAME biofuel to Jet A-1 aviation kerosene resulted in an increase in the maximum total gas temperature in front of the gas turbine Δt3t,max by 13.35 °C and a decrease in the maximum total gas temperature behind the gas turbine Δt4t,max by −9.7 °C, as well as a decrease in the total gas temperature in front of the gas turbine Δt3t,max by −3.4 °C and a decrease in the total gas temperature behind the gas turbine Δt4t,max by −6.4 °C. The value of the total air temperature behind the compressor Δt2t decreased by −9 °C, the value of the total air pressure behind the compressor Δp2t decreased by −1493.7 Pa, and the value of the total gas pressure in front of the gas turbine Δp3t decreased by −3217.2 Pa. The thrust of the SJE-20 engine was reduced by ΔFT = −2.1 N, with a simultaneous increase in fuel consumption ΔQfuel. = 0.051 L.min−1.
4.1.5. The Course of Changes in SJE-20 Parameters When Using a Mixture of 60% Jet A-1 and 40% FAME
The fifth series of measurements was aimed at determining the parameter values of the experimental SJE-20 during its operation with a fuel mixture consisting of 60% Jet A-1 aviation kerosene and 40% FAME biofuel. The changes in the parameters during measurements can be seen in Figure 8 and read from Table 10. The measurements followed immediately after the previous series of measurements. The temperature of the SJE-20 engine before starting was tMPM = 70.1 °C. The starting process of the engine, at the given temperature state of the engine, took place normally. The mixture of 60% aviation kerosene and 40% FAME biofuel was ignited only at 4.6 s, which corresponded to the start of the neat Jet A-1 aviation kerosene. A temperature peak t3t,max. = 1118.97 °C was reached in 13.7 s, and t4t,max. = 988.8 °C was reached 11.6 s after engine start.
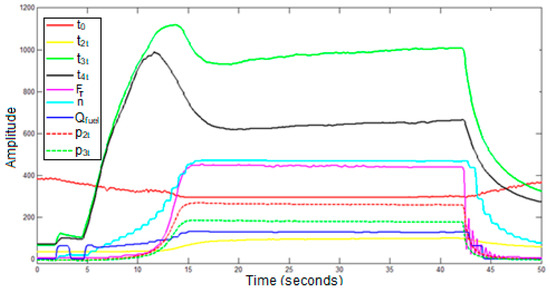
Figure 8.
Graphic course of changes in SJE-20 parameters when using a mixture of 60% Jet A-1 aviation kerosene and 40% FAME biofuel at an engine temperature of 70.1 °C.
Table 10.
Mixture of 60% Jet A-1 aviation kerosene and 40% FAME biofuel, 1st launch (40th second).
The addition of 40% FAME biofuel to Jet A-1 aviation kerosene increased the maximum total gas temperature in front of the gas turbine Δt3t,max by 4.42 °C and decreased the maximum total gas temperature behind the gas turbine Δt4t,max by −2.8 °C, as well as decreased the total gas temperature in front of the gas turbine Δt3t,max by −1.4 °C and the total gas temperature behind the gas turbine Δt4t,max by −7.1 °C. The value of the total air temperature behind the compressor Δt2t decreased by −6.9 °C, the value of the total air pressure behind the compressor Δp2t decreased by −2015.2 Pa, and the value of the total gas pressure in front of the gas turbine Δp3t decreased by −11,680 Pa. The thrust of the SJE-20 engine was reduced by ΔFT = −5 N, with a simultaneous increase in fuel consumption ΔQfuel. = 0.071 L.min−1.
As the proportion of FAME biofuel (ρMERO = 882 kg.m−3) in the mixture with Jet A-1 aviation kerosene (ρJet A-1 = 810 kg.m−3) increased, the density of the mixture increased, resulting in a lower quality of fuel atomization when flowing through the fuel nozzles. Insufficient atomization of a denser fuel mixture resulted in its slower evaporation in the combustion chamber, which caused a deteriorated mixture ignition process when starting a cold engine at lower atmospheric temperatures. The reliable launch of the SJE-20 was possible with a cold engine at temperatures of the surrounding atmosphere of tH = 20 °C only up to 40% of FAME biofuel mixed with Jet A-1 aviation kerosene. At higher concentrations of FAME biofuel in the mixture (45% and 50%), the SJE-20 was successfully started only if the engine was warmed up after the previous operation when radiant heat from heated engine parts was used for faster evaporation of the given fuel mixture.
4.2. The Influence of Different Concentrations of Jet A-1 Aviation Kerosene and FAME Biofuel on Individual Parameters of SJE-20
Based on the measured courses of the basic parameters of the SJE-20 experimental engine, it was possible to analyze the specific influence of the composition of Jet A-1 aviation kerosene and FAME biofuel on selected parameters in steady modes as well as in transient modes of engine operation. The next part of this chapter will gradually analyze the influence of the addition of FAME biofuel in the range from 0% to 40% to Jet A-1 aviation kerosene on the total air pressure behind the compressor p2t, the total air temperature behind the compressor t2t, the engine revolutions speed n and the total gas temperature in front of the gas turbine t3t, the total gas temperature behind the gas turbine t4t, fuel mass flow rate Qfuel, and engine thrust F.T.
4.2.1. The Effect of Different Concentrations of Jet A-1 Aviation Kerosene and FAME Biofuel Mixture on the Total Air Pressure behind the Compressor p2t
The change in the composition of Jet A-1 aviation kerosene and FAME biofuel in the stable modes of operation of the experimental SJE-20 does not fundamentally affect the value of the total air pressure behind the compressor p2t (see Figure 9 and Table 11). During start-up, there is a time shift (prolongation) in the start-up process. At a concentration of 20% FAME biofuel addition to Jet A-1 aviation kerosene, the start-up process was extended by 5 s due to the delayed ignition of the mixture (Figure 9).
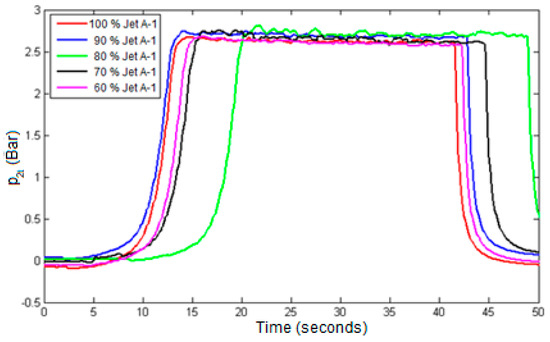
Figure 9.
Graphical course of the change in the total air pressure behind the SJE-20 p2t compressor [Bar] when using different mixtures of Jet A-1 aviation kerosene and FAME biofuel.
Table 11.
Change in total air pressure behind compressor p2t [Pa] SJE-20 with different concentrations of Jet A-1 aviation kerosene and FAME biofuel.
Due to the fact that the SJE-20 is a single-mode experimental engine which has a control system set to maintain a constant operating speed, the value of the total air pressure behind the compressor will also correspond to this speed since the dependence p2t = f(n) applies.
4.2.2. The Effect of Different Concentrations of Jet A-1 Aviation Kerosene and FAME Biofuel Mixture on the Total Temperature of the Air behind the Compressor t2t
The graphic course of the change in the total temperature of the air behind the compressor t2t depending on the change in the composition of the mixtures of aviation kerosene Jet A-1 and FAME biofuel (Figure 10) indicates the tendency of this temperature to increase depending on the time of engine operation in stable modes. This tendency was most pronounced in the case of pure aviation kerosene. As the proportion of FAME biofuel in the Jet A-1 jet kerosene mixture increased, this gradient of total temperature rises t2t behind the compressor decreased. The 35th second represented the maximum difference between the highest temperature t2t,max. (100% aviation kerosene Jet A-1) and the lowest air temperature behind the compressor, t2t,min (80% Jet A-1 aviation kerosene and 20% FAME biofuel) Δt2t = 32.8 °C (see Table 12). The mentioned fact results from the atypical change in parameters of the SJE-20 during its operation with a mixture of 80% Jet A-1 aviation kerosene and 20% FAME biofuel due to the delayed ignition of the fuel mixture with this composition.
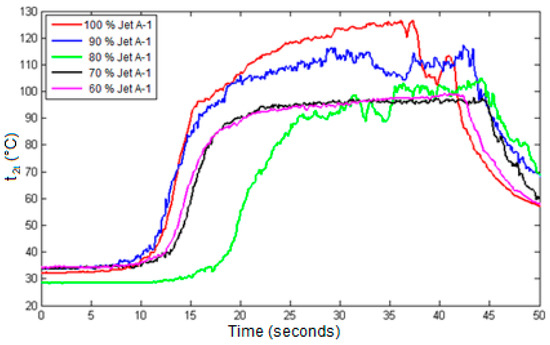
Figure 10.
Graphical course of change in the total air temperature behind the compressor SJE-20 t2t [°C] when using different mixtures of Jet A-1 aviation kerosene and FAME biofuel.
Table 12.
Change in total air temperature behind compressor t2t [°C] SJE-20 with different concentrations of Jet A-1 aviation kerosene and FAME biofuel.
4.2.3. The Effect of Different Concentrations of Jet A-1 Aviation Kerosene and FAME Biofuel Mixture on the Total Gas Pressure in Front of the Gas Turbine p3t
The change in the total gas pressure in front of the gas turbine p3t at all concentrations of Jet A-1 aviation kerosene and FAME biofuel mixtures corresponds to the change in the total pressure in the aviation jet engine combustion chamber (Figure 11). For all mixtures of Jet A-1 aviation kerosene and FAME biofuel, a decrease in the total pressure p3t occurred in the SJE-20 combustion chamber with the same course due to hydraulic losses arising during gas flow in the combustion chamber. In terms of the absolute value of the total pressure p3t, there was a decrease in its value for the mixture of 60% Jet A-1 and 40% FAME due to the reduced value of the total pressure of the air behind the compressor p2t at the beginning of the experiment (Table 13).
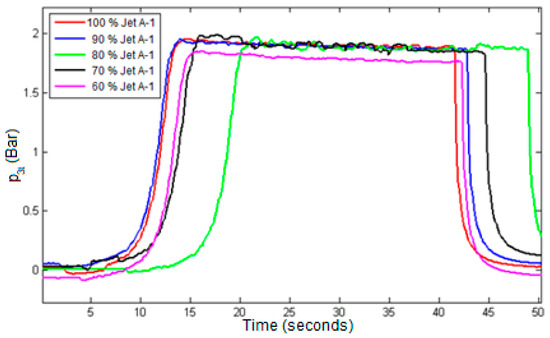
Figure 11.
The graphical course of changes in the total air pressure in front of the gas turbine SJE-20 p3t when using different mixtures of Jet A-1 aviation kerosene and FAME biofuel.
Table 13.
Change in total gas pressure in front of gas turbine p3t [Pa] SJE-20 with different concentrations of jet A-1 aviation kerosene and FAME biofuel.
4.2.4. The Effect of Different Concentrations of Jet A-1 Aviation Kerosene and FAME Biofuel Mixture on the Total Gas Temperature in Front of the Gas Turbine t3t
The course of changes in the total gas temperature in front of the gas turbine t3t is different during start-up and in the steady state (see Figure 12 and Table 14). During start-up, there is a sharp increase in the total gas temperature in front of the gas turbine t3t, reaching the maximum total gas temperature in front of the gas turbine t3t,max.. The maximum total gas temperature in front of the gas turbine t3t,max. is set by the initial fuel pressure control valve, which regulates the fuel supply at start-up Qfuel.,sp. The value of the maximum total gas temperature in front of the gas turbine t3t,max. differs relatively little, Δt3t,max. ≈ 20 °C. The moment of reaching the maximum total gas temperature in front of the gas turbine is ambiguously different depending on the composition of the mixture of Jet A-1 aviation kerosene and FAME biofuel by a minimum value (1.5 s) (Table 15). For a mixture of 80% Jet A-1 jet kerosene and 20% FAME biofuel, the time to reach the maximum gas temperature in front of the gas turbine t3t was delayed by 5 s due to the delayed ignition of this fuel mixture.
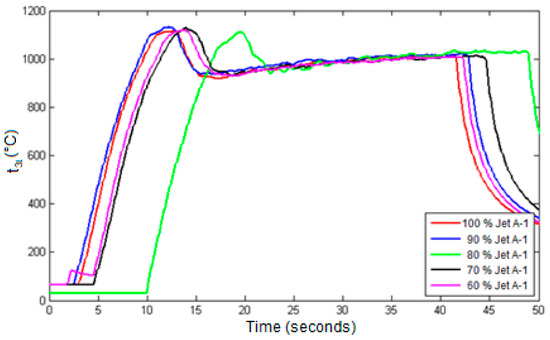
Figure 12.
The graphical course of the change in the total gas temperature in front of the gas turbine SJE-20 t3t [°C] when using different mixtures of jet A-1 aviation kerosene and FAME biofuel.
Table 14.
Change in total gas temperature in front of the gas turbine t3t [°C] SJE-20 with different concentrations of Jet A-1 aviation kerosene and FAME biofuel.
Table 15.
Change in the maximum total gas temperature in front of the gas turbine t3t, max. [°C] SJE-20 with different concentrations of Jet A-1 aviation kerosene and FAME biofuel.
In the stable mode of operation of the SJE-20 experimental engine, there is a gradual increase in the total gas temperature in front of the gas turbine t3t. The slight increase in gas temperature in front of the t3t gas turbine is caused by the gradual overheating of the SJE-20 gas turbine. The course of increasing the total gas temperature in front of the gas turbine t3t is the same for all mixtures. The average change in the total gas temperature in front of the gas turbine t3t between the 20th and 40th second is 65 °C.
4.2.5. The Effect of Different Concentrations of Jet A-1 Aviation Kerosene and FAME Biofuel Mixture on the Total Gas Temperature behind the Gas Turbine t4t
The course of changes in the total gas temperature behind the gas turbine t4t (Figure 13) depending on the composition of the mixtures of Jet A-1 aviation kerosene and FAME biofuel (Table 16) copies the course of change in the total gas temperature in front of the gas turbine t3t, but with lower values of the total gas temperature behind the gas turbine t4t. During the expansion of the gas on the gas turbine of the SJE-20 experimental engine, the total gas temperature ΔtPT changed with different compositions of Jet A-1 aviation kerosene and FAME biofuel in the range of total temperatures from ΔtPT = 315.1 °C to ΔtPT = 370.7 °C (Table 17).
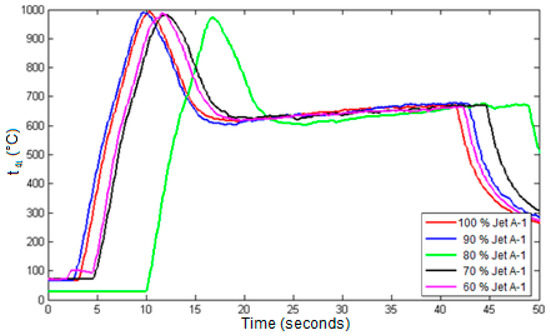
Figure 13.
The graphical course of the change in the total gas temperature behind the gas turbine SJE-20 t4t [°C] when using different mixtures of Jet A-1 aviation kerosene and FAME biofuel.
Table 16.
Change in total gas temperature behind gas turbine t4t [°C] SJE-20 with different concentrations of Jet A-1 aviation kerosene and FAME biofuel.
Table 17.
Change in total gas temperature during gas expansion on gas turbine ΔtPT [°C] SJE-20 with different concentrations of Jet A-1 aviation kerosene and FAME biofuel.
The maximum total gas temperature behind the gas turbine t4t,max. is dependent on the maximum total gas temperature in front of the gas turbine t3t,max., which is set by the initial fuel pressure control valve, which regulates the fuel supply during start-up Qfuel.,sp. The value of the maximum total gas temperature behind the gas turbine t4t,max differs relatively little Δt4t,max. ≈ 17.8 °C. The moment of reaching the maximum total gas temperature behind the gas turbine t4t,max. depending on the composition of the mixture of Jet A-1 aviation kerosene and FAME biofuel differs from the moment of reaching the maximum total gas temperature in front of the gas turbine t3t,max. (Table 18). For the mixture of 80% Jet A-1 jet kerosene and 20% FAME biofuel, the time to reach the maximum total gas temperature downstream of the gas turbine t3t was delayed by 5 s due to the delayed ignition of this fuel mixture.
Table 18.
Change in the maximum total gas temperature behind the gas turbine t4t, max. [°C] SJE-20 with different concentrations of Jet A-1 aviation kerosene and FAME biofuel.
4.2.6. Effect of Different Concentrations of Jet A-1 Aviation Kerosene and FAME Biofuel Mixture on the Qfuel Fuel Flow Rate
Changing the supply of various mixtures of Jet A-1 aviation kerosene and FAME biofuel up to the 15th second during the start-up corresponds to the starting program of SJE-20, Qfuel,sp. = f(p2t). After the fuel mixture is ignited, the supply of the fuel mixture is increased so that the SJE-20 reaches working mode (SJE-20 was created through the modification of a TS-20 turbine launcher, while its control system was preserved).
After reaching the working mode of SJE-20, the flow rate of fuel mixtures Qfuel. stabilized and only minimally decreased in the range from 0.002 L.min−1 (60% Jet A-1 and 40% FAME) to 0.052 L.min−1 (80% Jet A-1 and 20% FAME) (Figure 14). In the 40th second, the biggest difference in the fuel flow rate was reached ΔQfuel = 0.071 L.min−1 between Jet A-1 aviation kerosene (1.204 L.min−1) and a mixture of 60% Jet A-1 aviation kerosene and 40% FAME biofuel (1.277 L.min−1) (Table 19).
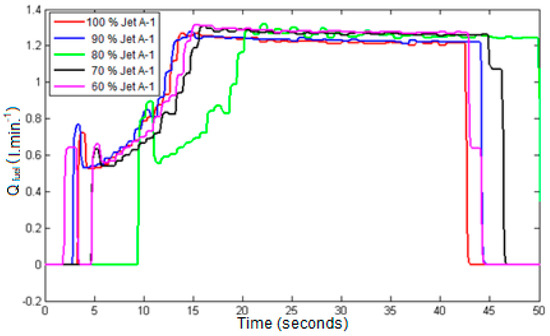
Figure 14.
The graphic course of the change in the flow rate of SJE-20 fuel [L.min−1] when using different mixtures of Jet A-1 aviation kerosene and FAME biofuel.
Table 19.
Change in the flow rate of fuel Qfuel [L.min−1] SJE-20 with different concentrations of Jet A-1 aviation kerosene and FAME biofuel.
4.2.7. The Effect of Different Concentrations of Jet A-1 Aviation Kerosene and FAME Biofuel on the Revolutions n
The speed change in the SJE-20 during its operation is controlled by the engine regulation system, which is set to maintain a constant speed at the operating mode n = nmax (Figure 15). The mentioned regulation law corresponds to the needs of the original turbine starter TS-20, from which SJE-20 was created. For this reason, the flow rate of Qfuel fuel mixtures changed. In order to maintain constant revolutions in the working mode, it was necessary to ensure the required energy value for the individual mixtures of Jet A-1 aviation kerosene and FAME biofuel, which required an increased supply of a mixture of Jet A-1 aviation kerosene and FAME biofuels (Table 20). In the SJE-20 operating range from the 25th to the 40th second, the maximum speed difference is Δnmax. = 60.6 min−1, representing a deviation of 0.129% with respect to the maximum engine speed.
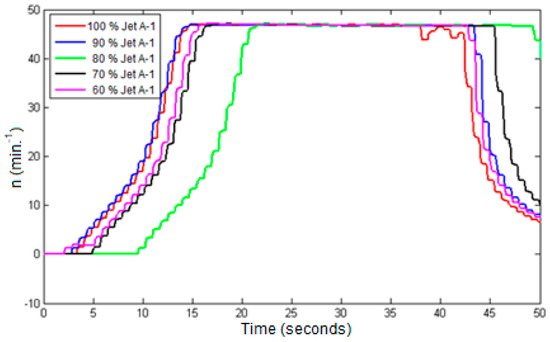
Figure 15.
The graphic course of SJE-20 n [min−1] speed changes when using different mixtures of Jet A-1 aviation kerosene and FAME biofuel.
Table 20.
Change in revolutions n [min−1] with different concentrations of Jet A-1 aviation kerosene and FAME biofuel.
4.2.8. The Influence of Different Concentrations of Jet A-1 Aviation Kerosene and FAME Biofuel Mixtures on the Thrust T.T. of the SJE-20
The change in thrust F.T. of the SJE-20 experimental engine, depending on the composition of the mixture of Jet A-1 aviation kerosene and FAME biofuel, is relatively small in the working mode (Figure 16). It is not proportional to the content of FAME biofuel in the mixture. The highest thrust is achieved by SJE-20 with a mixture containing 20% of FAME biofuel. From the 20th to the 35th second, there was a maximum thrust deviation of 37.5N (20th second) and a minimum pull deviation of 15.8N (35th second), representing a deviation of 8.3% and 3.5%, respectively (Table 21). The measured values of the thrust of the SJE-20 correspond to the calculated values.
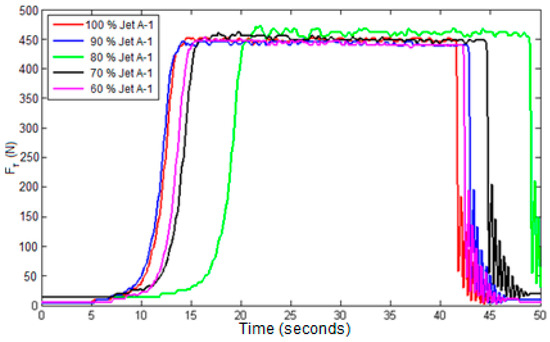
Figure 16.
The graphical course of SJE-20 thrust F.T. [N] changes when using different mixtures of Jet A-1 aviation kerosene and FAME biofuel.
Table 21.
Change in thrust F.T. [N] with different concentrations of Jet A-1 aviation kerosene and FAME biofuel.
5. Conclusions
The measurements confirmed that due to the small differences in calorific value between Jet A-1 aviation kerosene and FAME biofuel, individual concentrations of the mixture affect the measured parameters of the SJE-20 experimental engine only to a small extent.
Small differences in some measured parameters (speed n, fuel flow rate Qf, engine thrust F.T.), depending on the composition of the mixture of Jet A-1 aviation kerosene and FAME biofuel, were influenced by the engine regulation law in the working mode, which ensures the maintenance of a constant speed nmax. = const.
The composition of the mixture of Jet A-1 aviation kerosene and FAME biofuel had a significant effect on the course of launching the SJE-20. As the addition of FAME biofuel to Jet A-1 aviation kerosene increased, the time to reach the working mode increased. When reaching 40% concentration of FAME biofuel mixed with Jet A-1 aviation kerosene, the start-up process was unsuccessful with a cold SJE-20 engine. The unsuccessful ignition of the mixture with the given composition was insufficient evaporation of the mixture due to insufficient atomization of the fuel mixture with the fuel nozzle, which was intended for the atomization of Jet A-1 aviation kerosene. The igniters used, which ignited the mixture of fuel and air only by the electrical discharge of the spark plug, were insufficient to ignite a mixture with a different composition than pure Jet A-1 aviation kerosene. Re-starting a heated SJE-20 engine after its previous operation was also successful with a mixture of 60% Jet A-1 aviation kerosene and 40% FAME biofuel. Radiant heat from the heated parts of the SJE-20 was used to evaporate this mixture.
Also atypical was the delayed start of the SJE-20 engine when using a mixture of 80% Jet A-1 aviation kerosene and 20% FAME biofuel. The most significant deviations were measured when using this mixture.
From the analysis of the influence of individual mixtures of Jet A-1 aviation kerosene and FAME biofuel on the measured parameters, it can be concluded that these mixtures caused the most significant deviations in the total air temperature behind the compressor t2t. Future work in alternative aviation fuels will focus on researching other possible impacts that the blends of FAME biofuel and Jet A-1 aviation kerosene could have on the various aircraft components.
Author Contributions
Conceptualization, M.H. and S.A.-R.; methodology, M.H. and S.A.-R.; software, M.H.; validation, M.H., S.A.-R. and M.K.; formal analysis, S.A.-R. and M.K.; investigation, S.A.-R. and M.K.; resources, M.H.; data curation, M.H.; writing—original draft preparation, M.H., S.A.-R. and M.K.; visualization, S.A.-R.; supervision, M.H. and S.A.-R. All authors have read and agreed to the published version of the manuscript.
Funding
This research received no external funding.
Conflicts of Interest
The authors declare no conflict of interest.
References
- Balli, O.; Kale, U.; Rohács, D.; Hikmet Karakoc, T. Environmental damage cost and exergoenvironmental evaluations of piston prop aviation engines for the landing and take-off flight phases. Energy 2022, 261, 125356. [Google Scholar] [CrossRef]
- Balli, O.; Kale, U.; Rohács, D.; Karakoc, T.H. Exergoenvironmental, environmental impact and damage cost analyses of a micro turbojet engine (M-TJE). Energy Rep. 2022, 8, 9828–9845. [Google Scholar] [CrossRef]
- Kale, U.; Al-Rabeei, S.; Rácek, B.; Nagy, A. Analysis of utilization alternative fuels in the aviation. Int. J. Interdiscip. Theory Pract. 2021, 22, 12–17. [Google Scholar]
- Braun-Unkhoff, M.; Riedel, U. Alternative fuels in aviation. CEAS Aeronaut. J. 2014, 6, 83–93. [Google Scholar] [CrossRef]
- Sustainable Aviation Fuel: Review of Technical Pathways Report. 2020. Available online: https://www.energy.gov/eere/bioenergy/downloads/sustainable-aviation-fuel-review-technical-pathways-report (accessed on 15 October 2022).
- Adeniyi, O.M.; Azimov, U.; Burluka, A. Algae biofuel: Current status and future applications. Renew. Sustain. Energy Rev. 2018, 90, 316–335. [Google Scholar] [CrossRef]
- Girardi, J.C.; Bariccatti, R.A.; de Souza, S.N.M.; do Amaral, C.Z.; Guedes, C.L.B.; Baumi, J.; Bertosse, C.M. Potential of BABASSU biofuels use as Aviation Fuel. Res. Soc. Dev. 2022, 11, e51911125226. [Google Scholar] [CrossRef]
- Mayorga, M.A.; Estrada, J.G.C.; Paez, J.A.B.; Santamaria, C.A.L.; Castillo, J.M.G.; Leal, V.S.; Gomez, M.L. Use of biofuels in the aeronautical industry. case of the Colombian Air Force. TECCIENCIA 2019, 14, 33–43. [Google Scholar] [CrossRef]
- Altarazi, Y.S.; Yu, J.; Gires, E.; Ghafir, M.F.A.; Lucas, J.; Yusaf, T. Effects of biofuel on engines performance and emission characteristics: A Review. Energy 2022, 238, 121910. [Google Scholar] [CrossRef]
- Gawron, B.; Białecki, T. Impact of a jet A-1/HEFA blend on the performance and emission characteristics of a miniature turbojet engine. Int. J. Environ. Sci. Technol. 2017, 15, 1501–1508. [Google Scholar] [CrossRef]
- Mendez, C.J.; Parthasarathy, R.N.; Gollahalli, S.R. Performance and emission characteristics of Butanol/jet a blends in a gas turbine engine. Appl. Energy 2014, 118, 135–140. [Google Scholar] [CrossRef]
- Manigandan, S.; Atabani, A.E.; Ponnusamy, V.K.; Gunasekar, P. Impact of additives in jet-A fuel blends on combustion, emission and exergetic analysis using a micro-gas turbine engine. Fuel 2020, 276, 118104. [Google Scholar] [CrossRef]
- Habib, Z.; Parthasarathy, R.; Gollahalli, S. Performance and emission characteristics of biofuel in a small-scale gas turbine engine. Appl. Energy 2010, 87, 1701–1709. [Google Scholar] [CrossRef]
- Reksowardojo, I.K.; Duong, L.H.; Soerawidjaja, T.H.; Nguyen, T.T.; Fujita, O.; Neonufa, G.F. Performance and emission characteristics of a gas turbine engine burning soap-derived biokerosene/jet A-1 blends. SAE Int. J. Fuels Lubr. 2020, 13, 125–136. [Google Scholar] [CrossRef]
- Boomadevi, P.; Paulson, V.; Samlal, S.; Varatharajan, M.; Sekar, M.; Alsehli, M.; Elfasakhany, A.; Tola, S. Impact of microalgae biofuel on microgas Turbine Aviation Engine: A combustion and emission study. Fuel 2021, 302, 121155. [Google Scholar] [CrossRef]
- Cican, G.; Plesu, V.; Deaconu, M.; Toma, A.; Cretu, M. Performances and emissions evaluation of a Microturbojet engine running on biodiesel blends. J. Energy Resour. Technol. 2019, 141, 072003. [Google Scholar] [CrossRef]
- Reham, S.S.; Masjuki, H.H.; Kalam, M.A.; Shancita, I.; Fattah, I.R.; Ruhul, A.M. Study on stability, fuel properties, engine combustion, performance and emission characteristics of biofuel emulsion. Renew. Sustain. Energy Rev. 2015, 52, 1566–1579. [Google Scholar] [CrossRef]
- Chen, L.; Gao, K.; Zhang, C.; Lang, W. Alternative fuels for I.C. engines and jet engines and comparison of their gaseous and particulate matter emissions. In Advanced Biofuels; Woodhead Publishing: Sawston, UK, 2019; pp. 17–64. [Google Scholar] [CrossRef]
- Jasiński, R.; Kurzawska, P.; Przysowa, R. Characterization of particle emissions from a DGEN 380 small turbofan fueled with ATJ blends. Energies 2021, 14, 3368. [Google Scholar] [CrossRef]
- Anderson, A.; Karthikeyan, A.; Ramachandran, S.; Praveenkumar, T.R. Lowest emission sustainable aviation biofuels as the potential replacement for the jet-A Fuels. Aircr. Eng. Aerosp. Technol. 2020, 93, 502–507. [Google Scholar] [CrossRef]
- Mazlan, N.M.; Savill, M.; Kipouros, T. Effects of biofuels properties on aircraft engine performance. Aircr. Eng. Aerosp. Technol. 2015, 87, 437–442. [Google Scholar] [CrossRef]
- Yakovlieva, A.; Boichenko, S.; Lejda, K. Evaluation of jet engine operation parameters using conventional and alternative jet fuels. Int. J. Sustain. Aviat. 2019, 5, 230. [Google Scholar] [CrossRef]
- Aydogan, H.; Ozcelik, A.E.; Acaroglu, M. An experimental study of the effects of Camelina sativa biodiesel-diesel fuel on exhaust emissions in a turbocharged diesel engine. J. Clean Energy Technol. 2017, 5, 254–257. [Google Scholar] [CrossRef]
- Brusca, S.; Galvagno, A.; Lanzafame, R.; Garrano, A.M.C.; Messina, M. Performance analysis of Biofuel Fed Gas Turbine. Energy Procedia 2015, 81, 493–504. [Google Scholar] [CrossRef]
- Badami, M.; Nuccio, P.; Pastrone, D.; Signoretto, A. Performance of a small-scale turbojet engine fed with traditional and alternative fuels. Energy Convers. Manag. 2014, 82, 219–228. [Google Scholar] [CrossRef]
- Lapuerta, M.; Canoira, L. The suitability of fatty acid methyl esters (FAME) as blending agents in Jet A-1. In Biofuels for Aviation; Academic Press: Cambridge, MA, USA, 2016; pp. 47–84. [Google Scholar] [CrossRef]
- Llamas, A.; Lapuerta, M.; Al-Lal, A.-M.; Canoira, L. Oxygen extended sooting index of fame blends with aviation kerosene. Energy Fuels 2013, 27, 6815–6822. [Google Scholar] [CrossRef]
- Standard Test Method for Determination of Fatty Acid Methyl Esters (FAME) in Aviation Turbine Fuel Using Mid-Infrared Laser Spectroscopy. ASTM International—Standards Worldwide. 2022. Available online: https://www.astm.org/d8290-20.html (accessed on 27 December 2022).
- Wilson, G.R.; Edwards, T.; Corporan, E.; Freerks, R.L. Certification of Alternative Aviation Fuels and blend components. Energy Fuels 2013, 27, 962–966. [Google Scholar] [CrossRef]
- Engine AL-7F-1 Technical Description, Let-21-33/1; MNO Prague: Prague, Czech republic, 1968.
- Fatty Acid Methyl Esters (FAME)—ETIP Bioenergy. 2011. Available online: https://www.etipbioenergy.eu/images/fame-fact-sheet.pdf (accessed on 18 September 2022).
- Trestka, P.; Zygmunt-Kowalska, B.; Kuznia, M. Analysis of biodiesel production using different oils. In Contemporary Problems of Power Engeneering and Environmental Protection; Department of Technologies and Installation for Waste Management: Gliwice, Poland, 2021. [Google Scholar]
- Ershov, M.A.; Savelenko, V.D.; Makhova, U.A.; Makhmudova, A.E.; Zuikov, A.V.; Kapustin, V.M. Current challenge and innovative progress for producing HVO and fame biodiesel fuels and their applications. Waste Biomass Valorization 2022, 13, 1–17. [Google Scholar] [CrossRef]
- Safety Data Sheet Aviation Jet Fuel Jet A-1 (JETA1) Docslib. Available online: https://docslib.org/doc/3463581/safety-data-sheet-aviation-jet-fuel-jet-a-1-jeta1 (accessed on 23 September 2022).
- Kannaiyan, K.; Sadr, R. Experimental investigation on spray characteristics of jet A-1 and alternative aviation fuels. Int. J. Spray Combust. Dyn. 2021, 13, 54–71. [Google Scholar] [CrossRef]
- Lazar, T.; Madarász, L. Inovatívne výstupy z transformovaného experimentálneho pracoviska s malým prúdovým motorom. In Košice: Fakulta Elektrotechniky a Informatiky, Letecká Fakulta; TUKE: Košice, Slovakia, 2011. [Google Scholar]


Disclaimer/Publisher’s Note: The statements, opinions and data contained in all publications are solely those of the individual author(s) and contributor(s) and not of MDPI and/or the editor(s). MDPI and/or the editor(s) disclaim responsibility for any injury to people or property resulting from any ideas, methods, instructions or products referred to in the content. |
© 2023 by the authors. Licensee MDPI, Basel, Switzerland. This article is an open access article distributed under the terms and conditions of the Creative Commons Attribution (CC BY) license (https://creativecommons.org/licenses/by/4.0/).