Abstract
The reliability of logistics processes is most often considered in the context of the correct flow of materials. The information that accompanies the logistic flow is usually not considered a potential source of errors or disruptions to the correct operation of the logistic chain. The article presents literature studies in this field and presents a model for evaluating the logistics process, taking into account the quality of information. An example of process evaluation based on a container terminal was presented.
1. Introduction
In modern technical systems, it is hard not to notice the dynamic development of new technologies along with the development of science in the field of modern engineering solutions. This leads to a continuous increase in the complexity of systems in which integrated manufacturing, service-related or business processes are implemented. For these processes, it is necessary to make key decisions based on imperfect knowledge, which is quite often burdened with the uncertainty of data, ambiguity and incompleteness of information available. Such complex engineering systems also comprise supply chains that perform specific functions consisting of the movement of goods in space and time under conditions of an ever-changing and uncertain environment and the occurrence of probable disturbances. The challenge facing the current supply chains is ensuring the continuity of supply reliability based on available information. Maintaining the continuity of the supply chain can be achieved by proper management of logistic processes within the operation of the engineering system [1].
One of the basic goals of supply chain management should be risk management and continuity of supply, with particular attention paid to the security and resilience of the supply chain to hazards [1]. Based on the information received, various decisions are taken, and whether the logistics process will be carried out, and in some cases, even whether the security within this process will be ensured is fully dependent on the said information. The correctness and completeness of the information are necessary to perform the tasks and sometimes to guarantee security in logistics processes. Problems with conveying information can end up in interruption or termination of the process, and in some cases, even a disaster.
In modern technical systems, one can notice the dynamic development of new technologies, along with the development of science in the field of modern technical solutions. This results in a continuous increase in the complexity of systems in which integrated production, service or business processes are implemented. For these processes, it is necessary to make key decisions based on imperfect knowledge, which is quite often burdened with data uncertainty, ambiguity and incompleteness of available information [2]. Such complex technical systems also include supply chains that perform specific functions involving the movement of goods in space and time in conditions of a changing and uncertain environment and possible disruptions. The challenge faced by modern supply chains is to ensure continuity of supply reliability based on available information [3]. Maintaining the continuity of the supply chain can be achieved by proper management of logistics processes as part of the operation of the technical system [4].
If we assume that the logistic flow is the interconnected flow of materials and accompanying information, then the general concept of logistic costs should also include the cost of information flow. This topic was addressed in the publication [5]. The cost of obtaining information was the motivation to write the article [6].
When considering logistic flows, in the vast amount of information that surrounds us, we need to reject those that can distract us or lead to incorrect operation of processes [7,8]. Another interesting example is presented in [9], where information is a key element of the logistics process. With regard to the flagship examples of logistics, we can find works embedded in the area of supply logistics [10].
It should be noted that well-chosen information can lead to the success of the process, but disruptions both in the process of informing and poorly selected ways of its transmission will generate costs, see, e.g., [11,12].
In the practice of enterprises, one can often encounter a situation where the unreliability of a process is not a physical or technical issue but results from insufficient reliability of the information. Even though all the equipment works, the process does not work; it leads to waste, and it makes the job harder instead of helping.
The authors, recognizing the above-mentioned shortcomings, present a proposal for a method for determining process reliability, taking into account the reliability of the information. In this case, the method is based largely on the analysis of fault trees, while the article itself is a summary of a larger work, and the whole can be read in publication [13].
The source publication discusses the topic in more detail, taking into account the issue of data quality, information, etc.
The definitions [14] describe logistics as the flow of materials and the accompanying information flow. The first element being distinguished in logistics is the customer‘s purchase order, and the last is the execution of the task specified by the customer in the said purchase order. There are several processes related to the relocation of goods: storage, warehousing, distribution and transportation. All these processes are accompanied by the flow of information within the system: the transfer of information between the customer and the company, within the company and between the supplier and the company. The essence of logistics is to deliver the right goods at the right time to the right consignee.
In their papers conducted on logistic flows, the authors very often ignore the issues related to information unreliability, focusing mainly on solutions in the field of technology or economics. The purpose of the article is to present the method of assessing the logistics process in terms of the unreliability of information flow. However, to evaluate logistic processes concerning the reliability of the information, its components should be taken into account, which is regarded as the quality of information. The review of the literature was carried out in three areas:
- Information flow;
- Assessment of information quality;
- Assessment of reliability.
The summary allowed for drawing conclusions, which then resulted in the solution described in Section 3. Section 4 presents an example of the reliability assessment of a logistics system based on the sample container terminal. This is a curious example because, in the system of handling container units at the contact of rail and road transportation, there are very frequent changes in the information, its redundancy, lack of topicality, or simply scarcity, which translates into the overall functioning of the system. The analysis presents two approaches to calculating reliability—with the omission and consideration of the information flow assessment.
2. Review of Literature
The problem of the assessment of the reliability of logistics processes is related to numerous dimensions of the analysis and evaluation of these processes. These are:
- Information flow;
- Assessment of information quality;
- Reliability of the technical systems.
The paper does not provide an overview of the basic definitions. They can be easily found in the publications quoted. The focus was on a synthetic juxtaposition of various aspects that were taken into consideration in the individual subject-matter areas. Hence, the literature review was divided into the above-mentioned three groups.
2.1. Information Flow Issues
Information is inherent in engineering systems. The authors ever so often analyze this issue due to its significance and the possibility of a disruption or hazard that may end up not only with the interruption (or termination) of the process in the analyzed engineering system but also with a disaster. In order to verify how the authors define the concept of information and in what way they identify, analyze and evaluate information, a literature review has to be carried out that introduces the current scope of knowledge in the field of information flow.
The table presented in Appendix A provides a synthetic summary of the literature related to information flow. The first column includes information sharing and the associated concepts of (information sharing) and communication. In the case of information sharing, the authors considered three models of information sharing: complete, partial and lack of information sharing. In communication, however, in some papers, the role of the sender and the recipient of the message is precisely defined. Then, the analysis of communication problems and the method of communication (e-mail, conversation, telephone, formal meetings, informal meetings, etc.) were analyzed within the context of communication. As for the issue of communication, the authors also put emphasis on what is in the transmitted message (the content of the message). The next column contains the decision-making: centralized and decentralized. The next column contains the analysis of information sharing considered within the supply chains. Depending on the adopted approach, the authors considered various parameters: design and implementation time, demand, levels of stock and production efficiency. The last column deals with the effects of information sharing. As a result of information sharing, the authors calculated the costs (total costs and penalties) as well as general benefits resulting from sharing of information between users within the supply chain. In some papers, the researchers examined whether sharing information reduces or removes the bullwhip effect. An indicator of the value of information sharing, described in several papers, may be a useful indicator of the benefits of information sharing. The last element in the line of effects of sharing information is the analysis of the result of the process, activity and task performance. In this case, it is important to analyze the way the information affects the process outcome (e.g., on delivering the order to the customer).
While analyzing the data from Appendix A, it can be noticed that in the case of information exchange, the complete information-sharing model is taken into consideration the most often. However, it should be noted that the content of the message and the completeness of the data contained in it are not taken into account. Instead, the sharing of information between designated users within the supply chain is analyzed. In the case of communication, authors quite often specify the sender and recipient of the message. The problems related to communication, as well as the content of the message, are examined in the papers that most commonly concern communication within the pilot-to-air traffic controller relationship, while the communication method is considered in mere 10 papers, which amounts to 33% of all presented papers. The authors emphasize in these works that the communication method matters, as well as whether the communication takes place at formal or informal meetings. The content of the message, on the other hand, is considered in the case of communication-centered papers, while centralized or decentralized decision-making in the papers on sharing information within the supply chains. In some papers, the content of the information provided was taken into account; most often, it is the demand, the lead time, the level of stocks and production efficiency. The effects of sharing information were distinguished last. The most frequently analyzed are the total cost, costs of penalties (for causing delays), miscellaneous benefits, service quality, elimination of the negative impact of the bullwhip effect and the value of information. There are no papers in the literature that examine the effects of sharing information in the context of activities performed. For example, if the pilot receives the message that the airplane may take-off, what time after receiving the message will the airplane take off, and what will happen should this information be misunderstood? Therefore, dealing with the subject of communication and sharing this information is significant not only in air transportation but also in other logistics or transportation systems, where information plays a crucial role in the flow of materials.
2.2. Assessment of Information Quality
This sub-chapter provides an overview of the literature on information flow in engineering systems. The authors in the selected papers identify and discuss issues related to information quality. In successive papers, on the other hand, the authors perform an assessment of information quality based on the chosen considerations. In this sub-chapter, the quality of information is described as per the scheme introduced in Figure 1.
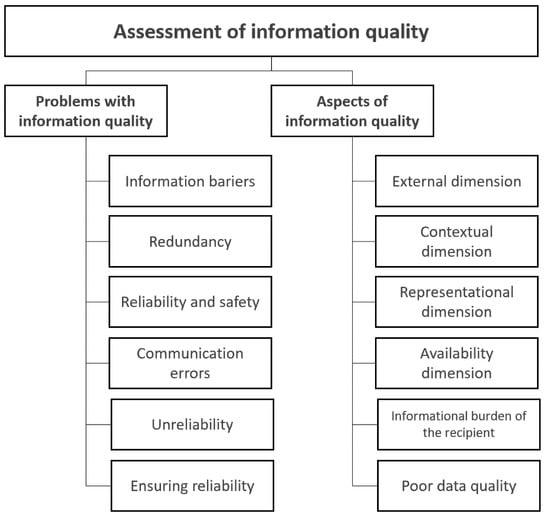
Figure 1.
Scheme for assessment of information quality.
As part of this problem, it can be said that the authors of these papers base their understanding of the subject-matter on a system consisting of a human, an engineering facility, the environment and problems relating directly to the information. These issues are related to the reliability of the facility as well as security. Many papers concern the discussion of issues within the information system, i.e., for example, information barriers or unreliability of information. Table 1 presents the classification of quality issues related to data (provided information), the user (recipient or sender of information), as well as issues resulting from external factors, i.e., changes in the environment.

Table 1.
Classification of information quality issues.
The issue of the assessment of information quality is being considered at the level of data, the user (sender or recipient of information), as well as the influence of the environment.
Most often, it concerns the concept of data redundancy, incomplete messages and unreliable information. There are two similar concepts in this column, data redundancy, which is related to the fact of an overflow of information present, while overload refers to a unit of time, i.e., there is too much information per unit of time. In the case of the user, it is the recipient of information that is analyzed most often; here, various problems are distinguished, such as psychological, educational or linguistic barriers, which hamper the understanding of the transmitted message. With respect to the machine operator, the decisive factor is the operator’s experience which will exclude the risk of classifying the read value as a completely different one. In the case of the environment, there are numerous factors that can disrupt the reception of information. For example, it may be the lack of access to necessary information. In the case of the issue of reliability and security, the authors point out that the provided information must be reliable and delivered on time. Problems within the information system can also result from external disturbances, such as delivery errors or a lack of necessary documents. One of the conclusions that can be drawn based on the literature review on the issue of information quality is that the proper operation of the information system has a significant impact on decision-making as well as the execution of the specified tasks. However, these papers do not describe in detail the negative effects in the event of the occurrence of problems such as information redundancy or misreading of the message.
The authors approach the estimation of the information quality issue differently. However, in the available literature, multi-criteria methods are most often used to provide an assessment of the quality of information and IT systems, in which various aspects of the assessment are considered. Therefore, the table presented in Appendix B presents a summary table consisting of 16 selected papers where the quality of information was assessed utilizing various aspects. The aspects have been divided into several groupings and dimensions based on the paper itself [44]; the “+” sign indicates the aspects that appear in a given paper.
Furthermore, the authors most often mention the aspect of accessibility of information. The largest number of authors pay attention to aspects related to the contextual dimension, i.e., in the literature, the greatest emphasis is put on the message content, whether it is complete, results in an added value, whether it is timely, etc. Then the authors give consideration to aspects from the internal dimension, i.e., whether the information is precise, reliable, credible, etc. Moreover, there is the representational dimension, in what way the communicated information is useful, intelligible or concise. Next comes the availability dimension, i.e., the ability to access information. The least popular are aspects that belong to the external dimension, such as customer support, the right location, etc.
In the literature on the assessment of information quality, completeness, accuracy, subject matter-relatedness, timeliness and availability are most often accounted for. The aspect of intelligibility and topicality receives far too little interest. For example, information will be delivered to the recipient at the indicated time, but it will be completely incomprehensible to them, so they will not be able to use it. The sender of the message should simultaneously pay attention to many aspects so that the transmitted message can be useful for the recipient.
2.3. Logistics Process Reliability Assessment
In order to develop the method for process reliability assessment, it is necessary to review the current state of knowledge on the available and previous process assessment methods. This chapter focuses on reliability-oriented methods and models. The literature review was also described in relation to logistics and transportation systems. The current challenge facing logistics and transportation systems is to ensure process reliability based on the information available. Reliability is also described as punctuality, meaning that processes are carried out according to a specified schedule. Therefore, this sub-chapter describes the methods and models of reliability, taking into consideration punctuality, as per the diagram shown in Figure 2.
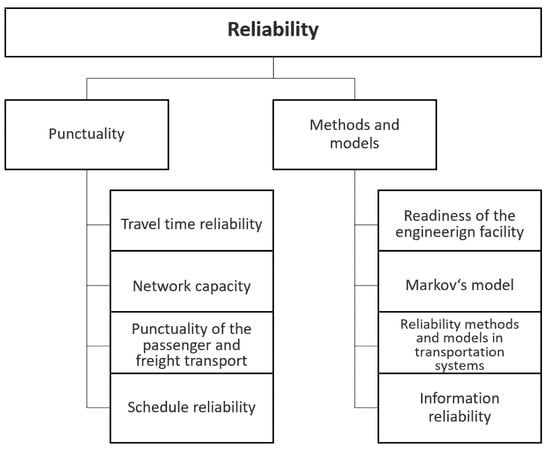
Figure 2.
Scheme of literature review regarding reliability.
The papers presented in Table 2 most often concern the determination of reliability and technical readiness, taking into account damage to an engineering facility—area I (17 papers); repair and operation—area II (14 papers); and determination of the readiness value—area III (11 papers). In 11 articles, the case of an execution of the transportation task was analyzed; the main limitation is the lack of consideration of how information impacts the performance of the said task. If the authors refer the information to the task execution, they do not take into consideration the quality of the provided information, i.e., timeliness, completeness or intelligibility, etc.
Table 2.
Summary of the review in the analysed areas of research.
The academic literature on the methods and models of reliability assessment mainly refers to the systemic approach, for the most part assuming two conditions: worthiness and unfitness. In the analyzed papers, reliability refers to the timely provision of services in various modes of transport. In some papers, there is no reference to the effects of delays and no indication of the precise critical value of the delay, past which it will be known whether disruption to the process execution will occur. There are no methods for assessing reliability in the literature, in which not only the timely execution of services is assessed but also the quality of the information provided and the effects of its lack.
Based on the above conclusions, the table presented in Appendix C summary was drawn up, which shows what was taken into consideration in the research on information flows and what was missing. The summary concerns three areas in which the analysis of the literature review was performed, i.e., information flow, information quality, as well as reliability (methods and models), all these in relation to logistics and transportation systems.
The first issue relates to the manner the system (or process) was examined. In all analyzed works, it was treated in its entirety; there was no assessment of individual components, subsystems or sub-processes. It was similar in the case of information flow, where the flow is described as an entirety, it is not assessed as a single piece of information, and this issue was discussed in all analyzed areas. The analysis of the definition of information showed that a specific sender or recipient was not taken into consideration in all papers. Additionally, in the works from the first area, the sender and the recipient of the message were precisely defined, mainly in the air transportation mode, where communication took place between the pilot and the air traffic controller.
Furthermore, in the case of the analysis and evaluation of the provided information, there is no reference to which data, e.g., in a specific document, are necessary for the execution of a given task. Thus, when assessing, e.g., the aspect of completeness, the authors infer that the information was incomplete; there is no indication as to whether or not the task can be performed or not without this specific information. In the third area, the sender and the recipient are also defined, most often in passenger information systems. In the second area, however, the information received was assessed mostly from the recipient’s point of view. Furthermore, in the first and third areas, the effects of providing information, costs, benefits, etc., were considered, while only in the third area, in transportation systems, the execution of tasks was taken into account, but only in two conditions, i.e., whether the task will be executed or not. However, in none of these areas was there any discussion on how the correctness of the message influences the execution of tasks in the examined system or process.
No thought was given to whether a message lacking the essential data caused the process to be terminated or delayed. Another issue concerns the timely execution of the process and tasks. This issue was mainly considered in the third area in relation to punctuality in transportation systems, but the authors did not provide specific values of the delays occurring, i.e., meaning, for example, that a delay of 10 min will have such an effect, a 1 h delay will cause certain other changes and a delay of more than a few hours will lead to irreversible effects. In engineering systems, it is of key importance because, e.g., in the event of an insignificant delay, there will be no consequences, but sometimes even the tiniest delay results in the carrier being penalized. In the first and second areas, in the selected papers, the reliability of devices in relation to information was presented, i.e., what is more unreliable, devices or information flow?
Currently, engineering systems are assessed in their entirety, in the same manner as the processes that are carried out within the operation of these systems. Hence the justification for developing a method by which the reliability will be assessed for each component of the process, taking into consideration the timeliness of individual operations in each of these components. The method developed allows the identification of bottlenecks within the process. Thanks to the determination of reliability, it will be possible to assess which of the process components is the most unreliable. However, based on the analysis of the quality of messages, the sender and recipient are identified, as well as the necessary data that are needed to implement the activities of the process. Based on the above, by means of the aspects of precision, completeness, reliability, timeliness and intelligibility, it will be possible to judge which message within the process is the most unreliable and contains errors. Thanks to the identification of the data necessary to perform the operation, it will also be known what sort of data are missing and whether these data are necessary to perform the said operation. On the basis of the obtained results, changes can be made to optimize and improve the quality of the process, e.g., improve operations by eliminating (as far as practically possible) the occurrence of disturbances. In terms of the quality of information, by improving the quality of the messages transmitted after analyzing the occurring errors, it is possible to improve communication by indicating the errors that occur to a specific sender or recipient. Identification and assessment of bottlenecks at each level of the process will allow for maintaining the process continuity, keeping the timely execution of the operation, and will also allow for increasing the efficiency and effectiveness of the process through continuous improvement and introduction of changes.
3. The Proposed Method for Assessing the Logistics Process in Terms of Information Flow Unreliability
The scientific literature on the reliability assessment covers mainly the systemic approach, and the reliability assessment is not carried out for individual components of the system. Information quality is also assessed in the context of the entire engineering system, and individual messages for a specific sender and recipient are not considered. Therefore, in the further portion of the article, a method is presented that will assess the reliability of the process as well as the quality of information flow at the same time.
The process has been divided into elements, where at the lowest level is the physical execution of operations based on the received message, and the reliability of the process refers to the timeliness of the operation performance. The literature specifies the delay thresholds without specifying what their impact will be, depending on the value of the delay. In turn, the quality of information is determined on the basis of the results of surveys carried out for a given engineering system. The evaluation of the quality of information is determined on the basis of the selected aspects; however, there are no indications as to which specific data in the message being transferred is incorrect and what effect this may have on the further execution of the process in the analyzed engineering system.
3.1. The Proposal to Assess the Logistics Process Based on Five Steps
The assessment of the reliability of the logistics process in any engineering system requires making five steps presented in the algorithm shown in Figure 3.
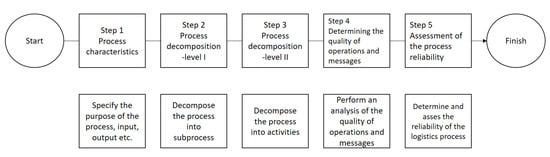
Figure 3.
Algorithm of the process reliability assessment method.
The developed method allows for the assessment of reliability, taking into consideration the timeliness of the performed operations as well as the quality analysis of the messages transferred.
In the first step of the method developed, the analyzed process should be characterized, thereby defining its purpose. Then, the sub-processes that make up this process should be identified by decomposing the process at Level I. In the Level II decomposition, individual activities should be identified, where operations (a set of activities or a single activity) and messages (containing data) that must be delivered to carry out certain operations are distinguished. Then, experimental studies should be carried out, which allow for determining the timely execution of all operations within the activities. The analysis of these activities consists of the analysis of the timely execution of individual operations, as well as the quality of the messages received. In the final step, on the basis of the studies carried out, the process reliability should be determined and assessed.
The developed method is based on the model shown in Figure 4, which demonstrates that a message confirming the performance of this operation is needed before each operation is performed.
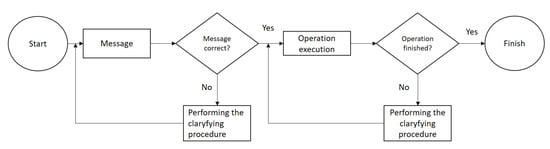
Figure 4.
Operational model in any engineering system.
In the model (Figure 5), the execution of the action depends on the correctness of the message. Should the data contained in this message be correct, the operation can be executed. However, if the message is incorrect or the message is missing important data, clarifying procedures must be performed. Only after these irregularities have been clarified can the operation continue.
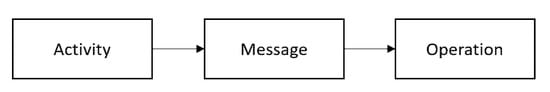
Figure 5.
Structure of an activity.
- Step 1–Characterization of the process
The achievement of the intended goals by the system requires the implementation of several coordinated activities and the execution of a certain process [44,45,46,47]. In the analyzed engineering system, the main process should be singled out and given a name. The purpose of the process should result from the tasks of the entire system, in line with the customer‘s requirements. The process input may comprise tangible resources, data and all other elements necessary for the functioning of the process. The process output comprises all the tangible and intangible elements that arise as a result of the functioning of this process. The supplier and customer may be a natural person or an institution supplying the process or collecting the result of its outcome. The owner of the process is most often the decision-maker who supervises the course and functioning of the entire process. The basic parameters for the assessment of the process under examination may include process duration, timely execution of the process, process quality and cost [48].
- Step 2–Process decomposition—level I
The process decomposition on level I consists of the decomposition of a process into sub-processes. The number of sub-processes depends on the characteristics of the analyzed process in the studied engineering system. In this step of the suggested method, it is assumed that the process decomposition at level I can contain merely verbal descriptions.
- Step 3–Process decomposition—level II
In step 3, the sub-processes should be decomposed into actions necessary for the execution of the sub-processes. In this step, a process map should be developed, utilizing any process mapping tool (e.g., block process flow sheet, BPMN, etc.) that will allow for the identification of these actions. After their identification, operations (collection of activities) and messages (data set) should be distinguished as part of the execution of individual activities.
Decomposition of the process at level I allowed identifying sub-processes, which in turn consist of activities (process decomposition—level II, Figure 6). Operations are performed within the frameworks of the activities that may consist of one or more activities. A message is required for the operations to be executed, and it may consist of one or more data needed to perform them. In step 3 of the method developed, activities, operations and messages should be identified.
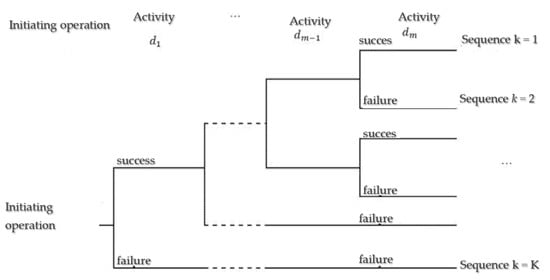
Figure 6.
Event tree—general model [38].
Therefore, the G process is a set of sub-processes, activities, operations, messages and relations between them:
where:
- G = {A} process is a set of sub-processes, where A ={a1, … an};
- A = {D}, sub-processes are a set of activities, where D = {d1, …. dm};
- D = (I, B) activity is a set of messages and operations, where B = {b1, …, bm} and I = {I1, …, Im};
- W = {Y} set of relations of the G process.
The activity is a set of operations and messages; based on the definition of activity, it can be deduced that the number of operations and messages equals the number of activities. For individual activities, operations and messages, the notation is as follows:
and:
- G–process;
- dm–activity;
- Im–message in the consecutive action m;
- bm–operation in the consecutive activity m;
- e(m,v)–action in the consecutive activity m;
- i(m,u)–data in the message in the consecutive activity m;
- n–sub-process number, for n = {1, …, N};
- m–activity number, for m = {1, …, M};
- v–number of the consecutive activity in the execution of the operation bm, for v = {1, …, V};
- u–consecutive number of data in the message, Im, for u = {1, …, U}.
- Step 4–Determining the quality of operations and messages
In the studied process, an analysis of activities carried out within separate sub-processes should be carried out. In each of these activities, messages and operations are identified:
- (a)
- operation quality analysis bm
The operation bm is a physical execution of a single or many activities by the contractor. Therefore, when analyzing operations, the time it takes to execute these activities is considered. Based on the studies carried out for each operation, it should be affirmed how many of these operations are not performed in a timely manner. If a given operation has a “predetermined” time of execution, the task is simple because the untimely execution of this operation is higher than the value of this predetermined threshold. However, if the given operations within the process do not have such values specified, the time it takes to perform these operations should be measured, and based on the results obtained, the level above which the operation is considered to be delayed should be determined. It should also be determined at the exceedance of what value the undesirable effects occur, e.g., the consecutive operation commences with a delay.
- (b)
- analysis of the message quality Im
A message is necessary for the execution of the operation (Figure 5). The following information is needed to analyze a message: the input information, the type of message (e.g., e-mail, document), and who is the sender and recipient of the message. On the basis of the identified sender, recipient and all data contained in the message, it is necessary to specify what data are necessary for the performance of a particular operation. The content of the communicated message is of utmost importance, and on this basis, the data quality is assessed according to specific attributes (parameters). The parameters impacting the assessment of the message quality are accuracy, completeness, believability, actuality and intelligibility. These attributes relate directly to the contents of the transferred message and the data that it contains. Precision (accuracy) means that the transferred message is prepared by the sender with the utmost care. The message may not contain errors. Completeness [34] is defined as the set of all data (information) handed over to the message recipient necessary to undertake further decisions or actions. The person who produces the message should include all the required data. Believability in paper [36] is defined as a feature that expresses its compliance with the condition of the object described by it. Another attribute is actuality, which in the case of the message, is defined [37] as the compliance of the message with the real condition of the object described. The data conveyed in the message should be up-to-date for the operation to be performed properly. The last considered attribute that impacts the message quality is intelligibility. The sender of the message [34] should transfer the message to the recipient in a clear and understandable manner.
In order to assess the quality of the transferred message, the results from the tested sample of a given message are considered . The recipient, based on the number of the received messages, determines the number of correct ones (No. of correct messages) and how many were incorrect (No. of incorrect messages), referring only to the contents of the message, as well as to the above attributes. If certain data are missing from the content of the message, they are marked in the completeness cell by entering the number of messages in which the completeness attribute was unreliable. If the message is unintelligible, they mark the number of such messages in the intelligibility cell. The recipient receiving an incorrect message must perform a forcing action to clarify or verify the correctness of the message with its sender; the average duration of the clarifying action should be measured.
- Step 5—Process reliability assessment
The authors assume that the object may be in a fit or unfit state. In relation to the process under analysis, reliability is the probability of the process being performed within the specified time limit under specific requirements. The method that is used in the paper is the event tree analysis method. Figure 6 shows a process reliability assessment model based on the assumption that the activity will be performed or not.
The process commences with an initiating operation. It is assumed that the given action will end up as a success (S) or fail (F) with a set probability. The process studies shall allow for the determination of individual probability values. The use of this method allows for obtaining information on the probability of failure for each activity and, ultimately, the process in its entirety.
The steps to draw up an event tree for the process under study are the following [48]:
Identifying the initiating operation;
- Drawing up an event tree for each activity, assuming two states of activity execution: success and failure;
- Determining the probabilities or possibilities of two states occurring: success and failure for each activity;
- Determination of reliability;
- Analysis and evaluation of the results.
After identifying and analyzing the activities involved in the sub-processes, the likelihood of success or failure should be estimated. For a two-state system, it is:
where:
- is the probability of the success sequence for the activity dm, for m = 1, …, M;
- is the probability of the failure sequence for the activity dm, for m = 1, …, M;
- K is the subsequent binary branching of the sequence.
Determination of reliability consists in determining the probability of realization of the set of functioning sequences for the process under analysis, according to the event trees method [40]. The reliability of the Rpr process is described by a set of subsequent success sequences of the set operation, , and each sequence is described by a set of successive dm activities.
Thus, the reliability of the Rpr process is [40]:
where
is the probability of the success sequence for the activity set D.
For any k, it is determined based on:
However, the probability of the failure sequence the activity set D is calculated as follows:
3.2. Assessment of Process Reliability, Taking into Consideration the Timeliness of Operations
In logistics and transportation systems, it is important whether the process has been executed while conforming to specific requirements or not. When analyzing processes, attention should also be paid to whether individual activities in the specific sub-processes were performed within the specified time, and if not, the cause of the delay should be determined. Thanks to this, constant process improvements are constantly possible.
A reliability assessment method was developed that takes into consideration the three-state model, utilizing the event trees method. The assumption in this method is that an activity in each sub-process can be executed in three ways, that is, ending as a success, partial success, or failure. Success is when the activity is completed in a timely manner, partial success is when the action is delayed, and failure happens when the activity is not completed, which may interrupt the process execution.
The steps to draw up an event tree for the process under study are the following [49]:
- Identifying the initiating operation;
- Development of the event tree for each activity assuming three states for the event: success, partial success and failure;
- Designating the probabilities or possibilities of the occurrence of three states: success, partial success and failure for each activity;
- Determination of reliability;
- Analysis and evaluation of the results.
After identifying and analyzing the activities occurring, the probability of success, partial success, or failure should be assessed. For a three-state system, it is:
where:
- is the probability of the success sequence for activity dm for the three-state system, for m = 1, …, M;
- is the probability of the partial success sequence for the three-state system for activity dm, for m = 1, …, M;
- is the probability of failure sequence for the three-state system for activity dm, for m = 1, …, M;
- C is the consequent sequence branch for the three-state system.
Determination of reliability consists in determining the probability of the implementation of the sequence of activities for the process under study in accordance with the event tree method, similar to the event tree for a two-state process [50]. The process reliability using the (three-state) event tree method is described by a set of subsequent sequences of the success of an activity and partial success of an activity , and each sequence is described by a set of subsequent activities dm.
Thus, the process reliability for success is Rpr(S) [51,52]:
where is the occurrence of the success sequence for the set of activities D for any c is determined on the basis of:
In contrast, the probability of the partial success sequence ; for the set of activities, D is calculated as follows:
and the probability of partial success sequence for the set of activities, D is calculated from:
4. Verification of the Method
4.1. Stages of the Studies in the Real System in the Case of a Sample Container Terminal
The proposed method of process evaluation was verified at a container terminal in Poland. The study was divided into six stages. The aim of the study was to collect the data necessary to determine the process’s reliability. The first stage concerned the characteristics of the engineering system under study. At this stage, the focus was put on the technical parameters of the terminal, the availability of loading devices and the nature of the terminal’s operation. The second stage of the study was more detailed than the previous one, where the operations performed at the terminal were thoroughly examined. The purpose of the system was marked out, and sub-processes were identified at each level of the process, along with the identification of information tools, as well as contractors (operators) of particular activities. In the next stage of the study (stage III), an analysis was performed of the information system in which internal and external information is propagated. Senders and recipients of given messages were identified. In the examined engineering system, documents are usually sent in printed or electronic form. By using interviews with employees, it was possible to access documents, and it was also determined which data included in the messages were necessary for the performance of operations. The interviews were conducted with employees at all levels of employment, from the manager to dispatchers, down to operators and drivers. In the fourth stage of the research, attention was focused on the efficiency of the terminal work, the efficiency of reloading devices and the duration of reloading activities. The duration of reloading of individual containers and acceptance of cargo to the terminal (rail transportation, road transportation) were measured. Thanks to access to the system, it was possible to analyze the number and types of reloading at the terminal (per month/per annum). In the consecutive stage of the study, the cargo handling process was analyzed along with all sub-processes carried out in the process under study. Based on the experimental research and the documentation available, information was collected on the number of delays in deliveries to customers, delays in accepting cargo at the terminal, and the causes of these disruptions. The 6th stage of the study concerned the analysis and evaluation of the obtained results.
As part of the analysis (process decomposition—level II) of the cargo handling process at the container terminal, the process was using the BPMN (business process modeling notation), see in Appendix D. At the inland terminal, the main contractors of the process are the road dispatcher, the railway dispatcher, the operator of the cargo handling machines and the driver. The mapped process contains certain simplifications that do not describe the ancillary events and all possible scenarios of the described activities. A situation was presented where the containers arrive at the terminal by rail and are delivered to the customer by road. The presented map contains the main activities and two triggered events that describe the cargo handling process, commencing with the receipt of the customer purchase order by the road dispatcher and finalized with the delivery of the cargo to the customer. After receiving the purchase order from the customer, the dispatcher enters the data into the IT system. Then, the railway dispatcher enters the data into the system from the advice note list received from the railway carrier. Next, the road dispatcher draws up a list of containers for shipment or storage and enters it into the system; it is then visible to operators of reloading machines. After these activities are concluded, the terminal is ready to accept the train according to the specified timetable. At the same time, operators of reloading machines perform their work, and drivers are in the process of delivering the goods to the customer or waiting at the terminal for transportation tasks. After the train enters the terminal, it is accepted, i.e., the condition of the containers (whether they are not damaged) is verified, and the seal numbers and the actual condition (according to the list of containers in the IT system) are checked. If the containers did not undergo customs clearance at the port, customs processing must be performed at the terminal before the container is delivered to the customer. Similarly, in the case of containers arriving by road transportation, the driver arriving at the terminal with a loaded container must wait for customs clearance in such a case. After checking the container deliveries by rail, the operators, having read the plan, unload the containers, partly putting them in the storage yard, in portions loaded directly onto trucks and shipped to the customer according to their intended use. The road dispatcher sets up a transportation order for the haulage to the driver, which contains accurate information on the cargo to be delivered to the target customer. After loading the container onto the vehicle and filling-in the documentation, the driver leaves the terminal. As part of the analysis of the cargo handling process at the container terminal, the activities necessary to achieve the goal of the cargo handling process were selected. Thanks to the map drawn up, 5 such activities were identified, which are always of a repeatable sort in the process of cargo handling.
4.2. Determining the Quality of Operations and Messages
The data were collected in a random manner, not in real-time, and each operation underwent a separate analysis. Depending on the type of activity, the time the operation was performed was measured, or it was determined on the basis of historical data from the IT system. Based on these findings, the times of timely execution of the given operations were set. In the case of the analysis of the quality of the received messages, interviews were conducted with the recipients of the messages, that is, road dispatchers, railway dispatchers, machine operators, checkers and drivers. The results of the research were processed using the Statistica 13.0 program as well as the Expert Fit tool within the Flexim software.
Based on the process map (Appendix D), activities within which operations are performed and messages that must be delivered so that the operations can be performed have been distinguished. The cargo handling process at the container terminal consists of 2 sub-processes, 5 activities, 5 operations and 5 messages. In the a1 sub-process, three activities were distinguished (d1, d2, d3), and in sub-process a2, two successive activities were distinguished (d4, d5). In summary, the cargo handling process consists of two data completion operations within the system (b1, b2), the operation of accepting the train at the terminal (b3), the translocation of cargo (b4) and the operation of delivering the cargo to the customer (b5). The assumption, in this case, is that the trucks are ready to perform the transportation order at the terminal, exactly as it is in the real-life system. Depending on the type of operation, numerous steps occur. In the analyzed process of cargo handling, the following 5 messages were distinguished: a list with an order from the customer (I1), an advice note list (I2), a cargo list on a mobile device (I3), a list of containers for reloading (I4) and a transportation order for the haulage of cargo (I5). Each message contains a specific amount of data, including data necessary to perform the operation.
Based on the above, the structure of the G cargo handling process is as follows:
- G = {a1, a2}—a set of sub-processes;
- D = {d1, d2, d3, d4, d5}—a set of activities;
- B = {b1, b2, b3, b4, b5}—a set of operations;
- b1 = {e(1,1), e(1,2)}, b2 = {e(2,1), e(2,2)}, b3 = {e(3,1), e(3,2), e(3,3)}, b4 = { e(4,1)}, b5 = {e(5,1), e(5,2)},—a set of individual activities of the individual operations;
- I = {I1, I2, I3, I4, I5}—a set of messages;
- I1 = {i(1,1),…, i(1,34)}, I2 = {i(2,1),…, i(2,39)}, I3 = {i(3,1),…, i(3,10)}, I4 = {i(4,1),…, i(4,13)}, I5 = {i(5,1),…, i(5,27)},—a set of data in individual messages;
- —a set of process relationships.
For the analysis of operation b1, the time taken to perform actions as part of the operation is taken into consideration. The first I1 message sent to the terminal is the list that includes the customer’s order and, more specifically, from the ship’s owner. The road dispatcher receives such a message by electronic means and completes the data in the IT system, which is available to all employees of the terminal. Therefore, operation b1 is a set of activities:
The time of the operation execution, however :
Table 3 presents the basic statistics for 255 measurements made from the sample. Operation b1 is performed within 0.35 h (21 min) to 1.22 h (73 min), while the dispatchers supplement the data on average in = 0.74 h. The values of the standard deviation and the coefficient of variation indicate that the values of the feature are slightly different from the mean value. The average time to supplement the data in the system with a probability of 95% ranges from 0.72 h (43 min) to 0.76 h (46 min).
Table 3.
Basic statistics on the time of the execution of operation b1.
For the results of the operation performance time b1, a histogram was drawn up (Figure 7), in which the interval was assumed to be 0.1 h, which resulted in 13 intervals. The dispatchers supplemented the data in the system 22 times in less than 0.5 h. The operation of supplementing the data in the system most often (51 times) took between 0.6 h (36 min) and 0.7 h (42 min) as well as 0.7 h and 0.8 h (48 min). The time to supplement the data in the system that took over 1 h was exceeded 18 times. The gamma distribution density function was also matched with the histogram. At the test significance level of α = 0.05 , the statistical value was obtained, , and it does not exceed the critical value of the gamma distribution; for the 5th degree of freedom, at the significance level of α = 0.05, the value of the statistics is equal to .
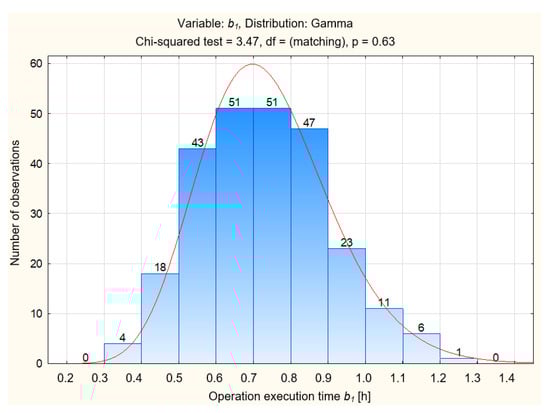
Figure 7.
Histogram of the frequency of occurrence of operation b1 according to pre-set time intervals.
Based on this, it can be concluded that there are no grounds to reject the zero hypothesis that the data takes the character of a gamma distribution; therefore, the formula of the gamma distribution density function is:
From the analysis of results (Figure 7) and observation of the time of operation b1 as performed by the dispatcher, it was established that 90% of all results were performed in a timely manner; therefore, the value of the 9th decile was calculated, which amounted to 0.98 h (59 min). The values of the operation execution above this decile are treated as untimely performed operations. At the container terminal, operation b1, which took more than 0.98 h to complete, is an operation in which other disruptions were being clarified or other tasks were performed by the road dispatcher. On the basis of the adopted distribution, the probability of a delay of 0.98 h can be calculated, which is equal to:
The probability of an occurrence of a delay in operation b1 for the value of 0.98 h is equal to 0.07. From the sample studied for operation b1, no case was noted in which there was a failure to perform this operation. The finding of the analysis of the results of operation b1 is also the fact that there is a high repeatability of results could be found. This is due to the fact that one person is responsible for supplementing these data in the system, the road dispatcher; other dispatchers do not provide these data.
The probability of an occurrence of a delay in operation b2 for the value of 0.98 h is equal to 0.18. From the sample studied for operation b2, no case was noted in which there was a failure to perform this operation. The finding of the analysis of the results of operation b2 is also the fact that there is a high repeatability of results could be found. This is also due to the fact that one specific person is responsible for supplementing these data in the system, the railway dispatcher; other railway dispatchers do not provide these data.
For the test performed, there were no grounds for rejection of the hypothesis that the data had a gamma distribution. The frequency of data supplementing operations in the system within the range of up to 0.8 h (48 min) amounts to 51%, while the operations performed for over 1 h give a cumulative frequency of 98%.
The remaining parameters necessary to use the method were analyzed in a similar manner.
4.3. Assessment of the Reliability of the Cargo Handling Process
Based on the cargo handling process map (Appendix D), a structural model was drawn up, thanks to which it is possible to determine the reliability of the cargo handling process from the time the order is accepted up to the cargo being delivered to the customer. In the analyzed process of cargo handling, it can be concluded, based on the map (Appendix D), that many operations within individual activities are performed in parallel. The development of the structural model (Figure 8) is intended to facilitate further calculations. Itemization of the basic operations within the sub-processes, as well as routing of the parallel paths, will simplify the creation of a reliability model using the event tree method.
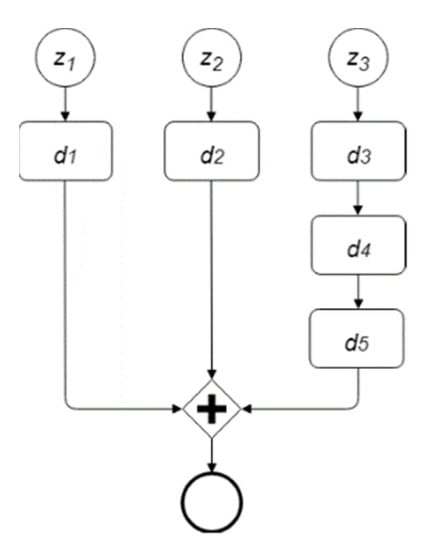
Figure 8.
Structural diagram of the cargo handling process at the container terminal.
On the bases of the structural model reliability may be determined using event trees. For activity d1, the initiating operation comes in the form of sending the order by the ship’s owner, z1 (Figure 9).
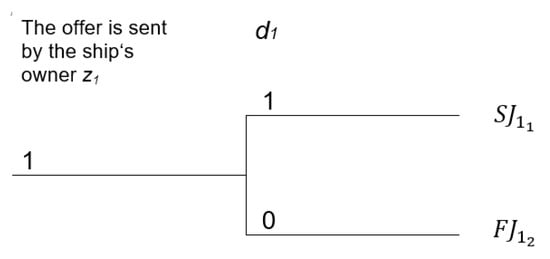
Figure 9.
Event tree for activity d1.
In the case of the consequent activity d2, the initial operation consists in sending the advice not listed. First, the I2 advice not listed from the port is drawn up and sent to the container terminal for the railway dispatcher (Figure 10).
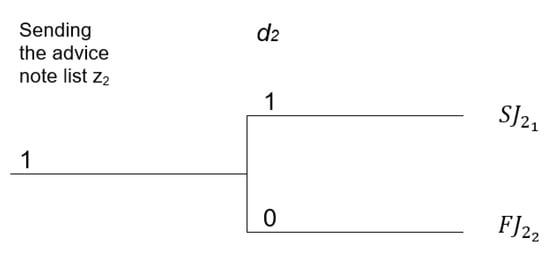
Figure 10.
Event tree for activity d2.
The next initiating operation is the cargo transportation by rail to the container terminal z3. The path in the structural model shows that within the initiating operation z3, 3 actions are performed in sequence (d3, d4, d5): transportation of the cargo from the port to terminal z3 (Figure 11).
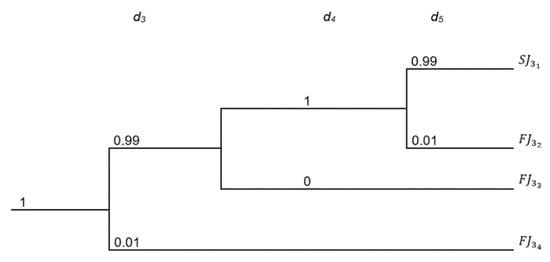
Figure 11.
Event tree for activity d3, d4, d5.
Therefore, the process reliability Rpr is equal to:
The reliability of the cargo handling process in the tested real-time system is Rpr = 0.98. In the case of the binary tree from the figure, because only the fact that a given action will be performed or not will be taken into consideration, the process of cargo handling in the engineering system under analysis is characterized by high reliability. In the case of the first two activities (d1 and d2), there was no situation during the study of the process when the dispatchers did not perform these activities. After the (I1 i I2) messages are received, the data are always entered into the system. In the case of the last path, the situation where the advice note list is received and the train does not arrive at the container terminal does not happen. Once, a situation arose where railway dispatchers received an advice note list; then they received information that there were disturbances at the port, and the target train, which was to arrive at the terminal, was reloaded and sent the next day. The last activities (d3, d4 and d5) also confirm the high reliability of the operating process. The operator who receives the list of containers carries out the cargo translocation operation and loads the container onto the vehicle. If there are any disruptions at this point, it is mainly on-route the transportation to the customer, when the driver has a loaded vehicle, leaves the terminal and delivers the cargo to the customer.
4.4. Assessment of the Reliability of the Cargo Handling Process, Considering the Timely Execution of Operations
On the basis of the studies presented in Section 4.1, reliability could be determined, taking into consideration the timely execution of operations in individual activities. In this case, the number of operations experiencing a delay was taken into account; for each bm operation, the values were as follows:
Above these values, an operation that is part of the activity is considered delayed. Based on the above, the following results were obtained the situation presented on the Figure 12 (activity d1) and Figure 13 (activity d2). Transportation of cargo from the port to the terminal for activities d3, d4 and d5 on the Figure 14 is presented.
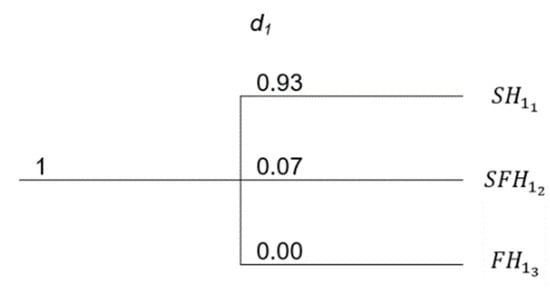
Figure 12.
Event tree for activity (orders sent by the ship’s owner z1).
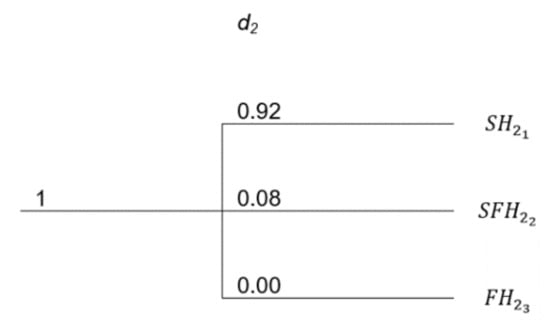
Figure 13.
Event tree for activity (Sending the advice note list z2.).
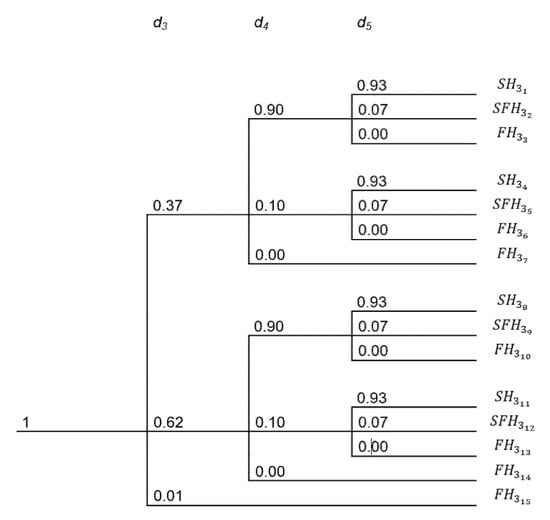
Figure 14.
Calculations for activity d3, d4, d5.
Transportation of cargo from the port to terminal z3= 0.93, = 0.07, = 0.
= 0.31, = 0.02, = 0.00, = 0.03, = 0.07, = 0.00, = 0.00, = 0.52, = 0.04, = 0.00, = 0.06, = 0.00, = 0.00, = 0.00, = 0.01.
Reliability for success is equal to:
Reliability for success is equal to Rpr(S) = 0.79, which is lower than the one obtained using the event trees for the two modes, which was equal to Rpr = 0.98. This is due to the fact that the timely execution of the operations performed within the activities was considered. It also follows that the activities at the terminal are carried out, but a portion of them are delayed. The activity d3 and, more specifically, the operation of accepting the train at terminal b3 has the greatest impact on the reliability, i.e., the timely execution of the operating process. This activity determines whether the cargo handling process will be performed in a timely manner and whether the cargo will be delivered to the customer exactly on time. Train delays are up to 48 h, and the most critical delays are already above 6 h; therefore, it is of key importance for the proper operation of the terminal.
In order to compare the value obtained with the developed method for the cargo handling process, the global value for delays in delivery to the customer from the container terminal was obtained. According to the data received from the terminal manager, 82% of haulage is performed on time in accordance with the customer‘s requirements. Based on the above, it can be determined that the reliability value of the cargo handling process for the three-state event tree amounting to 0.79 is a more accurate value, which suggests the validity of the developed method. It is also worth remembering that the method utilizes delay thresholds, which, following the identification of the bottlenecks within the process, will allow to improve the timeliness of the process or avoid penalties for delays.
5. Conclusions
The literature review analysis allowed for identifying a research gap, which is the non-existence of a reliability assessment method that would also take into consideration the quality and timeliness of the message transferred to the recipient. When defining the concept of information, the authors refer the interpretation of data to the sender and the recipient and demonstrate that by sharing information, uncertainty is reduced, and the bullwhip effect is partially excluded. However, information becomes significant only when it is understandable, interpretable and useful for the recipient. The exchange of information between users of complex engineering systems forces the physical flow of materials and the performance of activities within the framework of the ongoing process; therefore, both these flows should be considered concurrently. In their papers, the authors adopted various models of information sharing, often without referring to the data completeness and the timeliness of delivering these messages. In some papers, however, the issue of overloading is discussed, which refers to too much data transferred per unit of time. The papers ignore the impact of incomplete information on the process execution or performance of tasks.
The aim of the article was to create a method for assessing the reliability of the logistics process in terms of information flow unreliability. The proposed method assumes performing five steps. The mainstream of research work was based on the issue of process reliability, in which the crucial role is played by the timely execution of operations in the process under analysis. A definition of process reliability was formulated, where three states are listed: the state of fitness, the state of partial fitness and the state of unfitness. The notion of the cargo handling process for which the verification of the proposed method was performed was also defined. The cargo handling process is a process that is commenced with the shipment of the order from the customer and is concluded when the cargo is delivered to the customer. As part of this process, sub-processes and activities were distinguished, as well as the relationships between these being part of the operation of the cargo handling process. Each activity consists of a message (data set) and an operation (set of activities). Based on operations and messages characterized in such a manner, it was possible to determine reliability.
As the calculations showed, the reliability of the process based solely on technical issues gave a much greater value than the case taking into account the flow of information. As a result, it gives an insight into the importance of the issue of ignoring information in decision-making and logistics processes. It also allows for reflection on the importance of information and its failure as a cause of process failure.
The goal was achieved by:
- Characterizing the examined logistics process;
- Determining the components of the process, including the information transferred within a complex engineering system;
- Formulating a definition of process reliability;
- Developing a method for assessing the reliability of a logistics process;
- Verifying a method for assessing the reliability of a logistics process using the sample cargo handling process;
- Performing analysis and evaluation of the results obtained;
- Formulation of summaries and conclusions.
- The developed method of assessing the reliability of the logistics process enables the following:
- Determination of reliability, taking into consideration the timeliness of operations performed within the framework of the analyzed process;
- Gaining knowledge on each component of the analyzed process and the determination of the necessary messages, as well as the data necessary for the execution of the operation;
- Collection of data on the causes of delays;
- Determination of the quality of the transmitted messages, in quantitative terms, as well as indicating which aspects are the most unreliable;
- Continuous improvement of the process by introducing changes and increasing the awareness of the users of the engineering system concerning errors in messages, as well as the untimeliness of the operations performed.
The method developed is a universal one and can be used to evaluate logistics processes, including, e.g., manufacturing systems or transportation systems. The direction of the development of further research papers will be the use of the multi-criteria evaluation method that takes into account not only the criterion of the reliability evaluation but also, for example, process efficiency.
The article drew attention to and used the fault tree analysis. This is a simple method by which information reliability can easily be adapted. However, in the further development of the issue of reliability of the information in the logistics process, efforts can be made to adapt the idea using other analytical or simulation tools. The latter group is of particular interest and will be the subject of further research.
Author Contributions
Conceptualization, J.S.; methodology, M.Z. All authors have read and agreed to the published version of the manuscript.
Funding
This research received no external funding.
Institutional Review Board Statement
Not applicable.
Informed Consent Statement
Informed consent was obtained from all subjects involved in the study.
Data Availability Statement
The data presented in this study are available in this article.
Conflicts of Interest
The authors declare no conflict of interest.
Appendix A
Table A1.
Summary of the literature review of the issue of information flow in logistic systems.
Table A1.
Summary of the literature review of the issue of information flow in logistic systems.
| Item No. | Information Exchange | Decision Making | Analysis of Information for Selected Parameters | Results of Information Sharing (Valorisation) | |||||||||||||||||
|---|---|---|---|---|---|---|---|---|---|---|---|---|---|---|---|---|---|---|---|---|---|
| Information Sharing | Communication | Centralized | Decentralized | Lead Time | Demand | Inventory Level | Production Capacity | Total Cost | Costs of Penalties | Benefits | Service Level | Bullwhip Effect | Value of Information | Result of Tasks/Process Execution | |||||||
| Complete | Partial | Lack of | Sender—Recipient | Problems | Method (Conversation, Email, etc.) | Content of the Message | |||||||||||||||
| 1 | [53] | + | |||||||||||||||||||
| 2 | [54] | + | + | + | + | + | + | + | |||||||||||||
| 3 | [55] | + | + | + | + | + | + | G | |||||||||||||
| 4 | [17] | + | + | + | + | + | + | + | + | + | A | ||||||||||
| 5 | [56] | + | + | + | + | + | P | ||||||||||||||
| 6 | [57] | + | + | + | + | + | + | + | + | ||||||||||||
| 7 | [58] | + | + | + | + * | + | + | + | |||||||||||||
| 8 | [59] | + | + | + | + | + | G | ||||||||||||||
| 9 | [60] | + | + | + | + | + | + | + | A | ||||||||||||
| 10 | [61] | + | + | + | + * | + | + | + | + | + | P | ||||||||||
| 11 | [62] | + | + | ||||||||||||||||||
| 12 | [63] | + | + | + | + | + | + | + | + | + | + | + | + | + | |||||||
| 13 | [64] | + | + | + | + | G | |||||||||||||||
| 14 | [26] | + | + | + | + | A | |||||||||||||||
| 15 | [27] | + | + | P | |||||||||||||||||
| 16 | [28] | + | + | + | + | ||||||||||||||||
| 17 | [36] | + | |||||||||||||||||||
| 18 | [30] | + | + | + | + | + | + | + | + | + | + | + | + | + | G | ||||||
| 19 | [65] | + | + | + | + | + | + | + | + | + | + | + | A | ||||||||
| 20 | [66] | + | + | + | + | + | P | ||||||||||||||
| 21 | [67] | + | + | + | + | + | |||||||||||||||
| 22 | [68] | + | + | + | + | ||||||||||||||||
| 23 | [35] | + | + | + | + | + | |||||||||||||||
| 24 | [36] | + | + | + | + | ||||||||||||||||
| 25 | [69] | + | + | + | + | + | + | G | |||||||||||||
| 26 | [38] | + | + | + | + | A | |||||||||||||||
| 27 | [70] | + | + | + | + | + | P | ||||||||||||||
| 28 | [37] | + | + | + | + | ||||||||||||||||
| 29 | [41] | + | + | + | |||||||||||||||||
| 30 | [71] | + | + | + | G | ||||||||||||||||
| 31 | [43] | + | + | + | + | + | A | ||||||||||||||
| 32 | [44] | + | + | + | + | P | |||||||||||||||
| 33 | [72] | + | + | + | + | ||||||||||||||||
+ *—in these papers, it was assumed that the design and implementation time (lead time) is equal to 0.
Appendix B
Table A2.
Dimensions of data quality assessment available in the literature.
Table A2.
Dimensions of data quality assessment available in the literature.
| Data Quality Dimension | Aspects | [44] | [73] | [74] | [75] | [76] | [77] | [78] | [79] | [80] | [81] | [82] | [83] | [84] | [85] | [86] | [87] | Total |
|---|---|---|---|---|---|---|---|---|---|---|---|---|---|---|---|---|---|---|
| Internal | Believability | + | + | + | + | + | 5 | |||||||||||
| Accuracy, no errors present | + | + | + | + | + | + | + | + | + | + | + | + | + | + | 14 | |||
| Reliability | + | + | + | + | + | + | + | + | + | 9 | ||||||||
| Objectivity | + | + | + | + | + | 5 | ||||||||||||
| Verifiability | + | 1 | ||||||||||||||||
| Contextual | Value added | + | + | + | + | + | + | 6 | ||||||||||
| Completeness | + | + | + | + | + | + | + | + | + | + | + | + | + | + | + | 15 | ||
| Timeliness (on-time) | + | + | + | + | + | + | + | + | + | + | + | 11 | ||||||
| Subject-matter relatedness, relevant | + | + | + | + | + | + | + | + | + | + | + | 11 | ||||||
| Amount of information | + | + | + | + | + | + | 6 | |||||||||||
| Actuality (in good standing) | + | + | + | + | + | 5 | ||||||||||||
| Representative | Concise representation | + | + | + | + | + | + | 6 | ||||||||||
| Adequacy (adequate) | + | + | + | + | 4 | |||||||||||||
| Interpretability | + | + | + | + | 4 | |||||||||||||
| Intelligibility (ease of understanding) | + | + | + | + | + | + | 6 | |||||||||||
| Usability (ease of use) | + | + | + | + | + | + | + | + | 8 | |||||||||
| Clarity, intelligibility (clear) | + | + | + | 3 | ||||||||||||||
| Availability dimension | Availability (access, availability) | + | + | + | + | + | + | + | + | + | + | 10 | ||||||
| Internal connectivity | + | 1 | ||||||||||||||||
| Security | + | + | + | + | + | 5 | ||||||||||||
| Internal dimension | Customer support | + | 1 | |||||||||||||||
| Price per request | + | 1 | ||||||||||||||||
| Response time | + | 1 | ||||||||||||||||
| External connectivity | + | 1 | ||||||||||||||||
| Right purpose | + | 1 | ||||||||||||||||
| Right location | + | 1 | ||||||||||||||||
| Opinion on the source of information (reputation) | + | + | + | + | + | 5 |
Appendix C
Table A3.
Reliability methods and models in transportation systems.
Table A3.
Reliability methods and models in transportation systems.
| [88] | [89] | [90] | [91] | [92] | [93] | [94] | [95] | [96] | [97] | [98] | [99] | [100] | [101] | [102] | [103] | [104] | [105] | [106] | [107] | [108] | [109] | [110] | [111] | [112] | [113] | [114] | [115] | [116] | [117] | TOTAL | |
|---|---|---|---|---|---|---|---|---|---|---|---|---|---|---|---|---|---|---|---|---|---|---|---|---|---|---|---|---|---|---|---|
| Information reliability | + | + | + | + | 4 | ||||||||||||||||||||||||||
| Travel time reliability | + | + | + | + | + | 5 | |||||||||||||||||||||||||
| Schedule/timetable reliability | + | + | + | + | + | + | 6 | ||||||||||||||||||||||||
| Reliability of IT network infrastructure | + | 1 | |||||||||||||||||||||||||||||
| Markov | + | + | + | + | + | + | 6 | ||||||||||||||||||||||||
| Semi-Markov | + | + | 2 | ||||||||||||||||||||||||||||
| Reliability structure with the unloaded reserve | + | + | 2 | ||||||||||||||||||||||||||||
| Monte Carlo simulation | + | + | + | 3 | |||||||||||||||||||||||||||
| Poisson distribution | + | + | + | 3 | |||||||||||||||||||||||||||
| Exponential distribution | + | + | + | + | + | + | + | + | 8 | ||||||||||||||||||||||
| Weibull distribution | + | 1 | |||||||||||||||||||||||||||||
| Normal distribution | + | 1 | |||||||||||||||||||||||||||||
| Log-normal distribution | + | 1 | |||||||||||||||||||||||||||||
| Readiness | + | + | + | + | + | + | + | + | + | + | + | 11 | |||||||||||||||||||
| Unreliability | + | + | 2 | ||||||||||||||||||||||||||||
| Network capacity | + | + | + | + | + | + | 6 | ||||||||||||||||||||||||
| Punctuality | + | + | + | + | + | + | + | + | + | + | + | + | 12 | ||||||||||||||||||
| Delay threshold | + | + | 2 | ||||||||||||||||||||||||||||
| Punctuality threshold | + | 1 | |||||||||||||||||||||||||||||
| Damage | + | + | + | + | + | + | + | + | + | + | + | + | + | + | + | + | + | 17 | |||||||||||||
| Repair/operation | + | + | + | + | + | + | + | + | + | + | + | + | + | + | 14 | ||||||||||||||||
| Surveys | + | + | 2 | ||||||||||||||||||||||||||||
| Task execution | + | + | + | + | + | + | + | + | + | + | + | 11 | |||||||||||||||||||
| Hierarchical task analysis (HTA) | + | 1 | |||||||||||||||||||||||||||||
| Costs | + | + | + | + | + | 5 | |||||||||||||||||||||||||
| Availability | + | + | + | + | + | 5 | |||||||||||||||||||||||||
| Dispatcher‘s decisions | + | + | 2 | ||||||||||||||||||||||||||||
| Schedule reliability | Readiness | Markov model | Transportation system reliability model | Information reliability | |||||||||||||||||||||||||||
Appendix D

Figure A1.
Flow chart of the selected process.
Figure A1.
Flow chart of the selected process.

References
- Zio, E. Reliability engineering: Old problems and new challenges. Reliab. Eng. Syst. Saf. 2009, 94, 125–141. [Google Scholar] [CrossRef]
- Cichosz, M.; Wallenburg, C.M.; Knemeyer, A.M. Digital transformation at logistics service providers: Barriers, success factors and leading practices. Int. J. Logist. Manag. 2020, 31, 209–238. [Google Scholar] [CrossRef]
- Meeker, W.Q.; Escobar, L.A.; Pascual, F.G. Statistical Methods for Reliability Data; John Wiley & Sons: Hoboken, NJ, USA, 2022. [Google Scholar]
- Levchenkov, A. Increasing the reliability of information management systems for complex objects. E3S Web Conf. 2020, 224, 01039. [Google Scholar] [CrossRef]
- Pomatto, L.; Strack, P.; Tamuz, O. The Cost of Information. arXiv 2018, arXiv:1812.04211. [Google Scholar]
- Cabrales, A.; Gossner, O.; Serrano, R. A normalized value for information purchases. J. Econ. Theory 2017, 170, 266–288. [Google Scholar] [CrossRef]
- Dean, M.; Neligh, N.L. Experimental Tests of Rational Attention; Columbia University Press: New York, NY, USA, 2017. [Google Scholar]
- Maćkowiak, B.; Matějka, F.; Wiederholt, M. Rational Inattention: A Review (June 1, 2021). ECB Working Paper No. 2021/2570. Available online: https://ssrn.com/abstract=3871534 (accessed on 15 December 2022).
- Chukurna, O.; Vaysman, V.; Kassien, O.; Dobrovoslkyi, V.; Strunnikova, N. Recycling of Municipal Sewage Sludge in Sustainable Logistics Systems in the Focus of Information Technology Management. J. Inf. Technol. Manag. 2022, 14, 157–178. [Google Scholar]
- Zha, X.; Zhang, X.; Liu, Y.; Dan, B. Bonded-warehouse or direct-mail? Logistics mode choice in a cross-border e-commerce supply chain with platform information sharing. Electron. Commer. Res. Appl. 2022, 54, 101181. [Google Scholar] [CrossRef]
- Antony, J.; Gupta, S. Top ten reasons for process improvement project failures. Int. J. Lean Six Sigma 2019, 10, 367–374. [Google Scholar] [CrossRef]
- Hebert, B.; Woodford, M. Rational Inattention and Sequential Information Sampling; NBER: Cambridge, MA, USA, 2017. [Google Scholar]
- Swieboda, J. Metoda Oceny Procesu Logistycznego w Aspekcie Zawodności Przepływu Informacji; Raporty Wydziału Mechanicznego Politechniki Wrocławskiej; Politechniki Wrocławskiej: Wrocław, Poland, 2019. [Google Scholar]
- Nowakowski, T.; Mlynczak, M.; Jodejko-Pietruczuk, A.; Werbinska-Wojciechowska, S. Safety and Reliability: Methodology and Applications; CRC Press: Boca Raton, FL, USA, 2014. [Google Scholar]
- Coyle, J.J.; Bardi, E.J.; Langley, C.J., Jr. Zarządzanie Logistyczne; Polskie Wydawnictwo Ekonomiczne: Warszawa, Poland, 2002. [Google Scholar]
- Thomas, M.T.C.A.J.; Joy, A.T. Elements of Information Theory, Wiley-Interscience; John Wiley & Sons: Hoboken, NJ, USA, 2006. [Google Scholar]
- Lagorio, A.; Zenezini, G.; Mangano, G.; Pinto, R. A systematic literature review of innovative technologies adopted in logistics management. Int. J. Logist. Res. Appl. 2020, 25, 1043–1066. [Google Scholar] [CrossRef]
- Waters, D. Logistics An Introduction to Supply Chain Management; Palgrave Macmillan: London, UK, 2021. [Google Scholar]
- Pokrovskaya, O.; Reshetko, N.; Kirpicheva, M.; Lipatov, A.; Mustafin, D. The study of logistics risks in optimizing the company’s transportation process. IOP Conf. Ser. Mater. Sci. Eng. 2019, 698. [Google Scholar] [CrossRef]
- Stair, R.; Reynolds, G. Principles of Information Systems; Cengage Learning: Boston, MA, USA, 2020. [Google Scholar]
- van Goor, A.; van Amstel, M.P. European Distribution and Supply Chain Logistics; Routledge: London, UK, 2019. [Google Scholar]
- Cox, J.F.; Blackstone, J.H. The Educational Society for Resource Management, 9th ed.; APICS Dictionary (APICS): Chicago, IL, USA, 1998. [Google Scholar]
- Myerson, P. Lean Supply Chain and Logistics Management; McGraw-Hill Education: New York, NY, USA, 2012. [Google Scholar]
- Faheem, M.; Shah, S.; Butt, R.; Raza, B.; Anwar, M.; Ashraf, M.; Ngadi, M.; Gungor, V. Smart grid communication and information technologies in the perspective of Industry 4.0: Opportunities and challenges. Comput. Sci. Rev. 2018, 30, 1–30. [Google Scholar] [CrossRef]
- Anand, K.; Mendelson, H. Information organization for horizontal multimarket coordination. Manag. Sci. 1997, 43, 1609–1627. [Google Scholar] [CrossRef]
- Zhou, L.; Hu, D.L. The Beneficial Impact of Information Sharing on the Bullwhip Effect in Supply Chains. In Proceedings of the 2008 4th International Conference on Wireless Communications, Networking and Mobile Computing, Dalian, China, 12–14 October 2008; pp. 1–4. [Google Scholar]
- Moyaux, T.; Chaib-Draa, B.; D’Amours, S. Information Sharing as a Coordination Mechanism for Reducing the Bullwhip Effect in a Supply Chain. IEEE Trans. Syst. Man Cybern. Part C Appl. Rev. 2006, 37, 396–409. [Google Scholar] [CrossRef]
- Tan, G.W.; Wang, B. The Relationship between Product Nature, Demand Patterns and Information Sharing Strategies. In Proceedings of the 22nd ICIS, New Orleans, LA, USA, 16–19 December 2001; pp. 543–549. [Google Scholar]
- Wójcik, A.; Zabost, M. Symulacja jako narzędzie doskonalenia przepływu produkcji na przykładzie analizowanego przedsiębiorstwa–case study. J. Trans. Logist. 2016, 2, 145–163. [Google Scholar]
- Zhang, C. Design and simulation of demand information sharing in a supply chain. Simul. Model. Pract. Theory 2007, 15, 32–46. [Google Scholar] [CrossRef]
- Woźniak, W.; Sąsiadek, M.; Jachowicz, T.; Edl, M.; Zając, P. Studies on the Mechanical Properties of C45 Steel with Martensitic Structure after a High Tempering Process. Adv. Sci. Technol. Res. J. 2022, 16, 306–315. [Google Scholar] [CrossRef]
- Kochan, C.G.; Nowicki, D.R.; Sauser, B.; Randall, W.S. Impact of cloud-based information sharing on hospital supply chain performance: A system dynamics framework. Int. J. Prod. Econ. 2018, 195, 168–185. [Google Scholar] [CrossRef]
- Dejonckheere, J.; Disney, S.M.; Lambrecht, M.R.; Towill, D.R. The impact of information enrichment on the bullwhip effect in supply chains: A control engineering perspective. Eur. J. Oper. Res. 2004, 153, 727–750. [Google Scholar] [CrossRef]
- Agrawal, S.; Sengupta, R.N.; Shanker, K. Impact of information sharing and lead time on bullwhip effect and on-hand in-ventory. Eur. J. Oper. Res. 2009, 192, 576–593. [Google Scholar] [CrossRef]
- Sodhi, M.M.; Tang, S.; Christopher, S. The incremental bullwhip effect of operational deviations in an arborescent supply chain with requirements planning. Eur. J. Oper. Res. 2011, 215, 374–382. [Google Scholar] [CrossRef]
- Lee, H.L.; So, K.C.; Tang, C.S. The value of information sharing in a two-level supply chain. Manag. Sci. 2000, 46, 626–643. [Google Scholar] [CrossRef]
- Ojha, D.; Sahin, F.; Shockley, J.; Sridharan, S.V. Is there a performance tradeoff in managing order fulfillment and the bullwhip effect in supply chains? The role of information sharing and information type. Int. J. Prod. Econ. 2019, 208, 529–543. [Google Scholar] [CrossRef]
- Shanshan, W. The impact of information sharing and coordination in make-to-order supply chain. In Proceedings of the 2010 Second International Conference on Communication Systems, Networks and Applications, Hong Kong, China, 29 June–1 July 2010; pp. 325–328. [Google Scholar]
- Matharage, S.T.; Hewage, U.; Perera, H.N. Impact of sharing point of sales data and inventory information on bullwhip effect. In Proceedings of the 2020 IEEE International Conference on Industrial Engineering and Engineering Management (IEEM), Singapore, 14–17 December 2020; pp. 857–861. [Google Scholar]
- Chatfield, D.C.; Kim, J.G.; Harrison, T.P.; Hayya, J.C. The bullwhip effect—Impact of stochastic lead time, information quality, and information sharing: A simulation study. Prod. Oper. Manag. 2004, 13, 340–353. [Google Scholar] [CrossRef]
- Guo, C.; Li, X.; Wilck, J. Supply Chain Information Sharing Strategy on Inventory Systems; Institute of Industrial Engineers-Publisher: Peachtree Corners, GA, USA, 2011. [Google Scholar]
- Dimitriadis, N.I.; Koh, S.C.L. Information flow and supply chain management in local production networks: The role of people and information systems. Prod. Plan. Control. 2005, 16, 545–554. [Google Scholar] [CrossRef]
- Rached, M.; Bahroun, Z.; Campagne, J.P. Assessing the value of information sharing and its impact on the performance of the various partners in supply chains. Comput. Ind. Eng. 2015, 88, 237–253. [Google Scholar] [CrossRef]
- Choe, J.M. Inter-organizational relationships and the flow of information through value chains. Inf. Manag. 2008, 45, 444–450. [Google Scholar] [CrossRef]
- Nowakowski, T. Problems with analyzing operational data uncertainty. Arch. Civ. Mech. Eng. 2010, 10, 95–109. [Google Scholar] [CrossRef]
- Abdel-Basset, M.; Mohamed, M. RETRACTED: The role of single valued neutrosophic sets and rough sets in smart city: Imperfect and incomplete information systems. Measurement 2018, 124, 47–55. [Google Scholar] [CrossRef]
- Zając, M. The Analysis of Selected Factors Improving the Cargo Susceptibility to Modal Shift. Energies 2022, 15, 8811. [Google Scholar] [CrossRef]
- Nowakowski, T. Problemy Reprezentacji Niepewności Danych Niezawodnościowych; Zimowa Szkoła Niezawodności, Zimowa Szkoła Niezawodności: Warsaw, Poland, 1997; pp. 147–152. [Google Scholar]
- Ruiz-Palmero, J.; Colomo-Magaña, E.; Ríos-Ariza, J.M.; Gómez-García, M. Big Data in Education: Perception of Training Advisors on Its Use in the Educational. System. Soc. Sci. 2020, 9, 53. [Google Scholar] [CrossRef]
- Rožić, T.; Naletina, D.; Zając, M. Volatile Freight Rates in Maritime Container Industry in Times of Crises. Appl. Sci. 2022, 12, 8452. [Google Scholar] [CrossRef]
- Henley, E.J.; Kumamoto, H. Reliability Engineering and Risk Assessment; Englewood Cliffs (NJ); Prentice-Hall: Hoboken, NJ, USA, 1981. [Google Scholar]
- Kierzkowski, A.; Kisiel, T. An impact of the operators and passengers behavior on the airport’s security screening reliability. In Proceedings of the European Safety and Reliability Conference—ESREL 2015, Zurich, Switzeland, 7–10 September 2015; pp. 2345–2354. [Google Scholar]
- Abdulrahaman, M.; Faruk, N.; Oloyede, A.; Surajudeen-Bakinde, N.; Olawoyin, L.; Mejabi, O.; Imam-Fulani, Y.; Fahm, A.; Azeez, A. Multimedia tools in the teaching and learning processes: A systematic review. Heliyon 2020, 6, e05312. [Google Scholar] [CrossRef]
- Abramowicz, W. Filtrowanie Informacji; Wydawnictwo Akademii Ekonomicznej w Poznaniu: Poznań, Poland, 2008. [Google Scholar]
- Grudzień, Ł. Koncepcja Oceny Jakości Informacji o Procesach w Systemach Zarządzania; Oficyna Wydawnicza Polskiego Towarzystwa Zarządzania Produkcją: Opole, Poland, 2012. [Google Scholar]
- Rainer, R.K.; Prince, B. Introduction to Information Systems; John Wiley & Sons: Hoboken, NJ, USA, 2021. [Google Scholar]
- Adamczewski, P. Informatyczne wspomaganie łańcucha logistycznego- struktura funkcjonalna i uwarunkowania realizacji. Zesz. Nauk. Akad. Ekon. W Pozn. 2000, 3, 36–56. [Google Scholar]
- Abt, S. Systemy Logistyczne w Gospodarowaniu, Teoria i Praktyka Logistyki; Wydawnictwo Akademii Ekonomicznej Poznaniu: Poznań, Poland, 1996. [Google Scholar]
- Scheff, S.; Livngston, D.B. Computer Integrated Logistic: CIL Architecture in the Extended Enterprise; IBM Corporation, U.S. Transportation Industry Marketing: Southbury, CT, USA, 1991; p. 9. [Google Scholar]
- Birkel, H.; Müller, J.M. Potentials of industry 4.0 for supply chain management within the triple bottom line of sustainability—A systematic literature review. J. Clean. Prod. 2021, 289, 125612. [Google Scholar] [CrossRef]
- Parfenov, A.; Shamina, L.; Niu, J.; Yadykin, V. Transformation of distribution logistics management in the digitalization of the economy. J. Open Innov. Technol. Mark. Complex. 2021, 7, 58. [Google Scholar] [CrossRef]
- Barczak, A.; Dembińska, I.; Marzantowicz, Ł. Analysis of the Risk Impact of Implementing Digital Innovations for Logistics Management. Processes 2019, 7, 815. [Google Scholar] [CrossRef]
- Peña, J.D.; Bas, O.; Maldonado, N.R. Impact of Bullwhip Effect in Quality and Waste in Perishable Supply Chain. Processes 2021, 9, 1232. [Google Scholar] [CrossRef]
- Choi, J.; Chung, S.; Chang, Y.S. Is M&A Information Useful for Exploring Promising Industries and Technologies? Sustainability 2020, 12, 139. [Google Scholar]
- Fu, Y.H.; Piplani, R. Supply-side collaboration and its value in supply chains. Eur. J. Oper. Res. 2004, 152, 281–288. [Google Scholar] [CrossRef]
- Mostafa, N.; Hamdy, W.; Alawady, H. Impacts of Internet of Things on Supply Chains: A Framework for Warehousing. Soc. Sci. 2019, 8, 84. [Google Scholar] [CrossRef]
- Zhang, M.; Shi, L.; Zhuo, X.; Liu, Y. A Bullwhip Effect Weakening Approach Based on VMD-SVM Algorithm under the Background of Intelligent Manufacturing. Processes 2021, 9, 1957. [Google Scholar] [CrossRef]
- Lochan, S.A.; Rozanova, T.P.; Bezpalov, V.V.; Fedyunin, D.V. Supply Chain Management and Risk Management in an Environment of Stochastic Uncertainty (Retail). Risks 2021, 9, 197. [Google Scholar] [CrossRef]
- Merkuryev, Y.A.; Petuhova, J.J.; Van Landeghem, R.; Vansteenkiste, S. Simulation-based analysis of the bullwhip effect under different information sharing strategies. In Proceedings of the 14th European Simulation Symposium, Dresden, Germany, 23–26 October 2002. [Google Scholar]
- Yuan, Q.; Qiong, Z. Incentive Mechanism of Supply Chain Inventory Management Based on Information Sharing. In Proceedings of the Business and Information Management, Proceedings of the ISBIM International Seminar, Wuhan, China, 19 December 2008; Volume 2, pp. 373–377. [Google Scholar]
- Lanza, G.; Ferdows, K.; Kara, S.; Mourtzis, D.; Schuh, G.; Váncza, J.; Wang, L.; Wiendahl, H.-P. Global production networks: Design and operation. CIRP Ann. 2019, 68, 823–841. [Google Scholar] [CrossRef]
- Childerhouse, P.; Hermiz, R.; Mason-Jones, R.; Popp, A.; Towill, D.R. Information flow in automotive supply chains–present industrial practice. Ind. Manag. Data Syst. 2003, 103, 137–149. [Google Scholar] [CrossRef]
- Chileshe, N.; Jayasinghe, R.S.; Rameezdeen, R. Information flow-centric approach for reverse logistics supply chains. Autom. Constr. 2019, 106. [Google Scholar] [CrossRef]
- Bag, S.; Wood, L.C.; Xu, L.; Dhamija, P.; Kayikci, Y. Big data analytics as an operational excellence approach to enhance sustainable supply chain performance. Resour. Conserv. Recycl. 2019, 153, 104559. [Google Scholar] [CrossRef]
- Li, J.; Shaw, M.J.; Sikora, R.T.; Tan, G.W.; Yang, R. The Effects of Information Sharing Strategies on Supply Chain Performance; College of Commerce and Business Administration, University of Illinois at Urbana: Champaign, IL, USA, 2001. [Google Scholar]
- Straub, D. Value of information analysis with structural reliability methods. Struct. Saf. 2014, 49, 75–85. [Google Scholar] [CrossRef]
- Helper, C.M.; Davis, L.B.; Wei, W. Impact of demand correlation and information sharing in a capacity constrained supply chain with multiple-retailers. Comput. Ind. Eng. 2010, 59, 552–560. [Google Scholar] [CrossRef]
- Davis, L.B.; King, R.E.; Hodgson, T.J.; Wenbin, W. Information sharing in capacity constrained supply chains under lost sales. Int. J. Prod. Res. 2011, 49, 7469–7491. [Google Scholar] [CrossRef]
- Wijayaratna, K.P.; Dixit, V.V. Impact of information on risk attitudes: Implications on valuation of reliability and information. J. Choice Model. 2016, 20, 16–34. [Google Scholar] [CrossRef]
- Billings, C.E. Misunderstanding of Communications between Pilots and Controllers; ASRS Third Quarterly Report, NASA TM X-3546; NASA: Washington, DC, USA, 1977.
- Araz, O.M.; Choi, T.; Olson, D.L.; Salman, F.S. Data Analytics for Operational Risk Management. Decis. Sci. 2020, 51, 1316–1319. [Google Scholar] [CrossRef]
- Lin, Y. Spoken Instruction Understanding in Air Traffic Control: Challenge, Technique, and Application. Aerospace 2021, 8, 65. [Google Scholar] [CrossRef]
- Knoblock, E.J.; Apaza, R.D.; Li, H.; Wang, Z.; Han, R.; Schimpf, N.; Rose, N.P. Investigation and Evaluation of Advanced Spectrum Management Concepts for Aeronautical Communications. In Proceedings of the 2021 Integrated Communications Navigation and Surveillance Conference (ICNS), Dulles, VA, USA, 19–23 April 2021. [Google Scholar]
- Stroeve, S.H.; van Doorn, B.A.; Everdij, M.H. Analysis of the roles of pilots and controllers in the resilience of air traffic management. Saf. Sci. 2015, 76, 215–227. [Google Scholar] [CrossRef]
- Skaltsas, G.; Rakas, J.; Karlaftis, M.G. An analysis of air traffic controller-pilot miscommunication in the NextGen environment. J. Air Transp. Manag. 2013, 27, 46–51. [Google Scholar] [CrossRef]
- Molesworth, B.R.; Estival, D. Miscommunication in general aviation: The influence of external factors on communication errors. Saf. Sci. 2015, 73, 73–79. [Google Scholar] [CrossRef]
- Telesetsky, A. The United States National Contingency Plan: Learning from Gaps in the System; Brill Nijhoff: Leiden, The Netherlands, 2017; pp. 201–222. [Google Scholar]
- Stedmon, A.W.; Sharples, S.; Littlewood, R.; Cox, G.; Patel, H.; Wilson, J.R. Datalink in air traffic management: Human factors issues in communications. Appl. Ergon. 2007, 38, 473–480. [Google Scholar] [CrossRef]
- Galotti, V.P. The Future Air Navigation System (FANS): Communications, Navigation, Surveillance–Air Traffic Management (CNS/ATM); Routledge: London, UK, 2019. [Google Scholar]
- International Civil Aviation Organization. Procedures for Air Navigation Services, Air Traffic Management, Fifth Edition—2007, International Civil Aviation Organization, Attachment to Guidelines No. 8 of the President of the Civil Aviation Authority of August 26, 2015; International Civil Aviation Organization: Montreal, QC, Canada. (In Polish)
- Loftus, G.R.; Dark, V.J.; Williams, D. Short-term memory factors in ground controller/pilot communication. Hum. Factors J. Hum. Factors Ergon. Soc. 1979, 21, 169–181. [Google Scholar] [CrossRef]
- Chen, J.Y.C.; Lakhmani, S.G.; Stowers, K.; Selkowitz, A.R.; Wright, J.L.; Barnes, M. Situation awareness-based agent transparency and human-autonomy teaming effectiveness. Theor. Issues Ergon. Sci. 2018, 19, 259–282. [Google Scholar] [CrossRef]
- Bullock, N. Evolving teacher training programmes through integrating contextual factors for language learning as part of aeronautical communication. In Proceedings of the Integrating Contextual Factors into Teaching of English for Aeronautical Communications, Daytona Beach, FL, USA, 10 May 2018. [Google Scholar]
- Available online: http://atccommunication.com (accessed on 15 December 2022).
- Cardosi, K.M. An Analysis of en Route Controller-Pilot Voice Communication; Final Report NASA ASRS; NASA: Washington, DC, USA, 1993.
- Ahlstrom, D.; Arregle, J.; Hitt, M.A.; Qian, G.; Ma, X.; Faems, D. Managing Technological, Sociopolitical, and Institutional Change in the New Normal. J. Manag. Stud. 2020, 57, 411–437. [Google Scholar] [CrossRef]
- Santalova, M.S.; Lesnikova, E.P.; Nechaeva, S.N.; Borshcheva, A.V.; Charykova, O.G. Information hindrances and communication barriers in project interactions. In The Future of the Global Financial System: Downfall of Harmony; Springer: Cham, Switzerland, 2018; pp. 273–281. [Google Scholar]
- Rodionov, D.; Zaytsev, A.; Konnikov, E.; Dmitriev, N.; Dubolazova, Y. Modeling changes in the enterprise information capital in the digital economy. J. Open Innov. Technol. Mark. Complex. 2021, 7, 166. [Google Scholar] [CrossRef]
- Wang, H.-W.; Lin, J.-R.; Zhang, J.-P. Work package-based information modeling for resource-constrained scheduling of construction projects. Autom. Constr. 2019, 109, 102958. [Google Scholar] [CrossRef]
- Urbinati, A.; Franzò, S.; Chiaroni, D. Enablers and Barriers for Circular Business Models: An empirical analysis in the Italian automotive industry. Sustain. Prod. Consum. 2021, 27, 551–566. [Google Scholar] [CrossRef]
- Liao, H.; Mi, X.; Xu, Z. A survey of decision-making methods with probabilistic linguistic information: Bibliometrics, preliminaries, methodologies, applications and future directions. Fuzzy Optim. Decis. Mak. 2019, 19, 81–134. [Google Scholar] [CrossRef]
- Jagacinski, R.J.; Flach, J.M. Control Theory for Humans: Quantitative Approaches to Modeling Performance; CRC Press: Boca Raton, FL, USA, 2018. [Google Scholar]
- Lesca, H.; Lesca, E. Gestion de L’information; Litec: Paris, France, 1995. [Google Scholar]
- Zoltowski, B. Nadmiar Informacyjny w Diagnozowaniu Uszkodzeń; Zimowej Szkoły Niezawodności: Szczyrk, Poland, 2004; pp. 412–424. [Google Scholar]
- Nowakowski, T. Problemy Wykorzystania Nadmiaru Informacyjnego do Podwyższenia Niezawodności Maszyn; Zimowej Szkoły Niezawodności: Szczyrk, Poland, 1995; pp. 117–122. [Google Scholar]
- Salma, V.; Friedl, F.; Schmehl, R. Improving reliability and safety of airborne wind energy systems. Wind. Energy 2019, 23, 340–356. [Google Scholar] [CrossRef]
- Bukowski, L. Wpływ Nadmiaru Informacyjnego na Niezawodność Zautomatyzowanych Systemów Produkcyjnych; Zimowej Szkoły Niezawodności: Szczyrk, Poland, 2004; pp. 43–53. [Google Scholar]
- Moore, E.F.; Shannon, C.E. Reliable circuits using less reliable relays. J. Frankl. Inst. 1956, 262, 191–208. [Google Scholar] [CrossRef]
- Mao, H.; Schwarzkopf, M.; Venkatakrishnan, S.B.; Meng, Z.; Alizadeh, M. Learning scheduling algorithms for data processing clusters. In Proceedings of the ACM Special Interest Group on Data Communication, Beijing, China, 19 August 2019; pp. 270–288. [Google Scholar]
- Wawrzyński, W.; Dziula, P. Rola Nadmiaru Informacyjnego w Poprawie Bezpieczeństwa Systemu; Zimowej Szkoły Niezawodności: Szczyrk, Poland, 2004; pp. 379–388. [Google Scholar]
- Kołowrocki, K.; Soszyńska-Budny, J. Critical infrastructure safety indicators. In Proceedings of the 2018 IEEE International Conference on Industrial Engineering and Engineering Management (IEEM), Bangkok, Thailand, 16–19 December 2018; pp. 1761–1764. [Google Scholar]
- Chen, W.; Xu, H.-L.; Peng, N.; Yang, F.-Q.; Lin, P. Linkage characteristics of deep-sea mining lifting system. Ocean Eng. 2021, 233, 109074. [Google Scholar] [CrossRef]
- Karolak, Z.; Olearczuk, E.; Zubko, W. Koncepcja Hybrydowego Modelu Odbioru Informacji w Systemach Człowiek—Obiekt Techniczny; Zimowej Szkoły Niezawodności: Szczyrk, Poland, 1979; pp. 133–148. [Google Scholar]
- Collin-Orellana, A.; Vásquez-Cassinelli, J.; Duque-Córdova, L.; Espinoza-Samaniego, C.; Arias-Ulloa, C.; Escobar-Segovia, K. Improvement in service quality by analyzing the relationship between psychosocial risks and labor engagement in a vertical transport equipment maintenance company. In Proceedings of the 18th LACCEI International Multi-Conference for Engineering, Education Caribbean Conference for Engineering and Technology, Bogota, Colombia, 27–31 July 2020. [Google Scholar]
- Ważyńska-Fiok, K. Model Bezpieczeństwa Systemu o Dwóch Stanach Intencjonalnych Wyposażonego w Układ Informacyjny; Zimowej Szkoły Niezawodności: Szczyrk, Poland, 1993; pp. 289–299. [Google Scholar]
- Barrows, C.; Bloom, A.; Ehlen, A.; Ikaheimo, J.; Jorgenson, J.; Krishnamurthy, D.; Lau, J.; McBennett, B.; O’Connell, M.; Preston, E. The IEEE reliability test system: A proposed 2019 Update. IEEE Trans. Power Syst. 2019, 99, 1. [Google Scholar] [CrossRef]
- Pawlak, E. Problemy Utrzymania W Stanie Zdatności Systemu Dystrybucji Drobnicowej W Aspekcie Niezawodności Przepływu Informacji; Zimowej Szkoły Niezawodności: Szczyrk, Poland, 2014; pp. 255–264. [Google Scholar]


Disclaimer/Publisher’s Note: The statements, opinions and data contained in all publications are solely those of the individual author(s) and contributor(s) and not of MDPI and/or the editor(s). MDPI and/or the editor(s) disclaim responsibility for any injury to people or property resulting from any ideas, methods, instructions or products referred to in the content. |
© 2023 by the authors. Licensee MDPI, Basel, Switzerland. This article is an open access article distributed under the terms and conditions of the Creative Commons Attribution (CC BY) license (https://creativecommons.org/licenses/by/4.0/).