1. Introduction
Nature has evolved for about three billion years, learning what works effectively and what lasts which has kept them alive. This allowed mankind to find an optimized solution from nature to various problems that have been faced for centuries. For example, the first airplane in human history was invented from the wings of bald eagles. The diagrid method was adopted to build buildings by imitating hexagonal honeycomb structures, which are considered perfectly waste-free in the field of architecture. As such, nature can present the most efficient answer to mankind [
1,
2].
In this paper, we introduce a biomimicry concept based on a spider to enhance the damage detection performance of the EMI (electro-mechanical impedance) technique subjected to debonding of composite structures. The EMI technique is an NDT (non-destructive testing) method which is widely known for its excellent performance for local damage detection [
3,
4,
5,
6,
7]. In [
3,
4], the EMI technique was used for monitoring bolt loosening where damage detection on composite materials was performed in [
5,
6]. Additionally, a good review of the technique can be found in [
7]. However, this local method has its limitations when detecting damage on large areas due to the fact that it uses a high frequency range. To overcome this problem, the very first attempt to increase the performance of the EMI technique was researched in [
8] where the authors used a metal disc to create a resonance frequency range to successfully detect damage on concrete surfaces. In this research, the authors propose a different way of enhancing the performance of the EMI technique.
Spiders detect vibrations transmitted through the web by sensory organs of the body and legs and distinguish the frequency range of vibrations to determine the existence of a prey [
9]. The structure of spider webs is a result of learning from nature to cover the widest area possible. Thus, inspired by nature, the authors used steel wires in conjunction with the EMI technique to increase the performance of the EMI technique. The first part of the study discusses the current limitation of using the EMI technique for detecting debonding damage on composite structures by dividing the test specimen into several areas. Then, the second part of the study introduces the biomimicry concept which shows a positive outcome when detecting debonding damage.
2. Debonding Detection with Electromechanical Impedance Technique
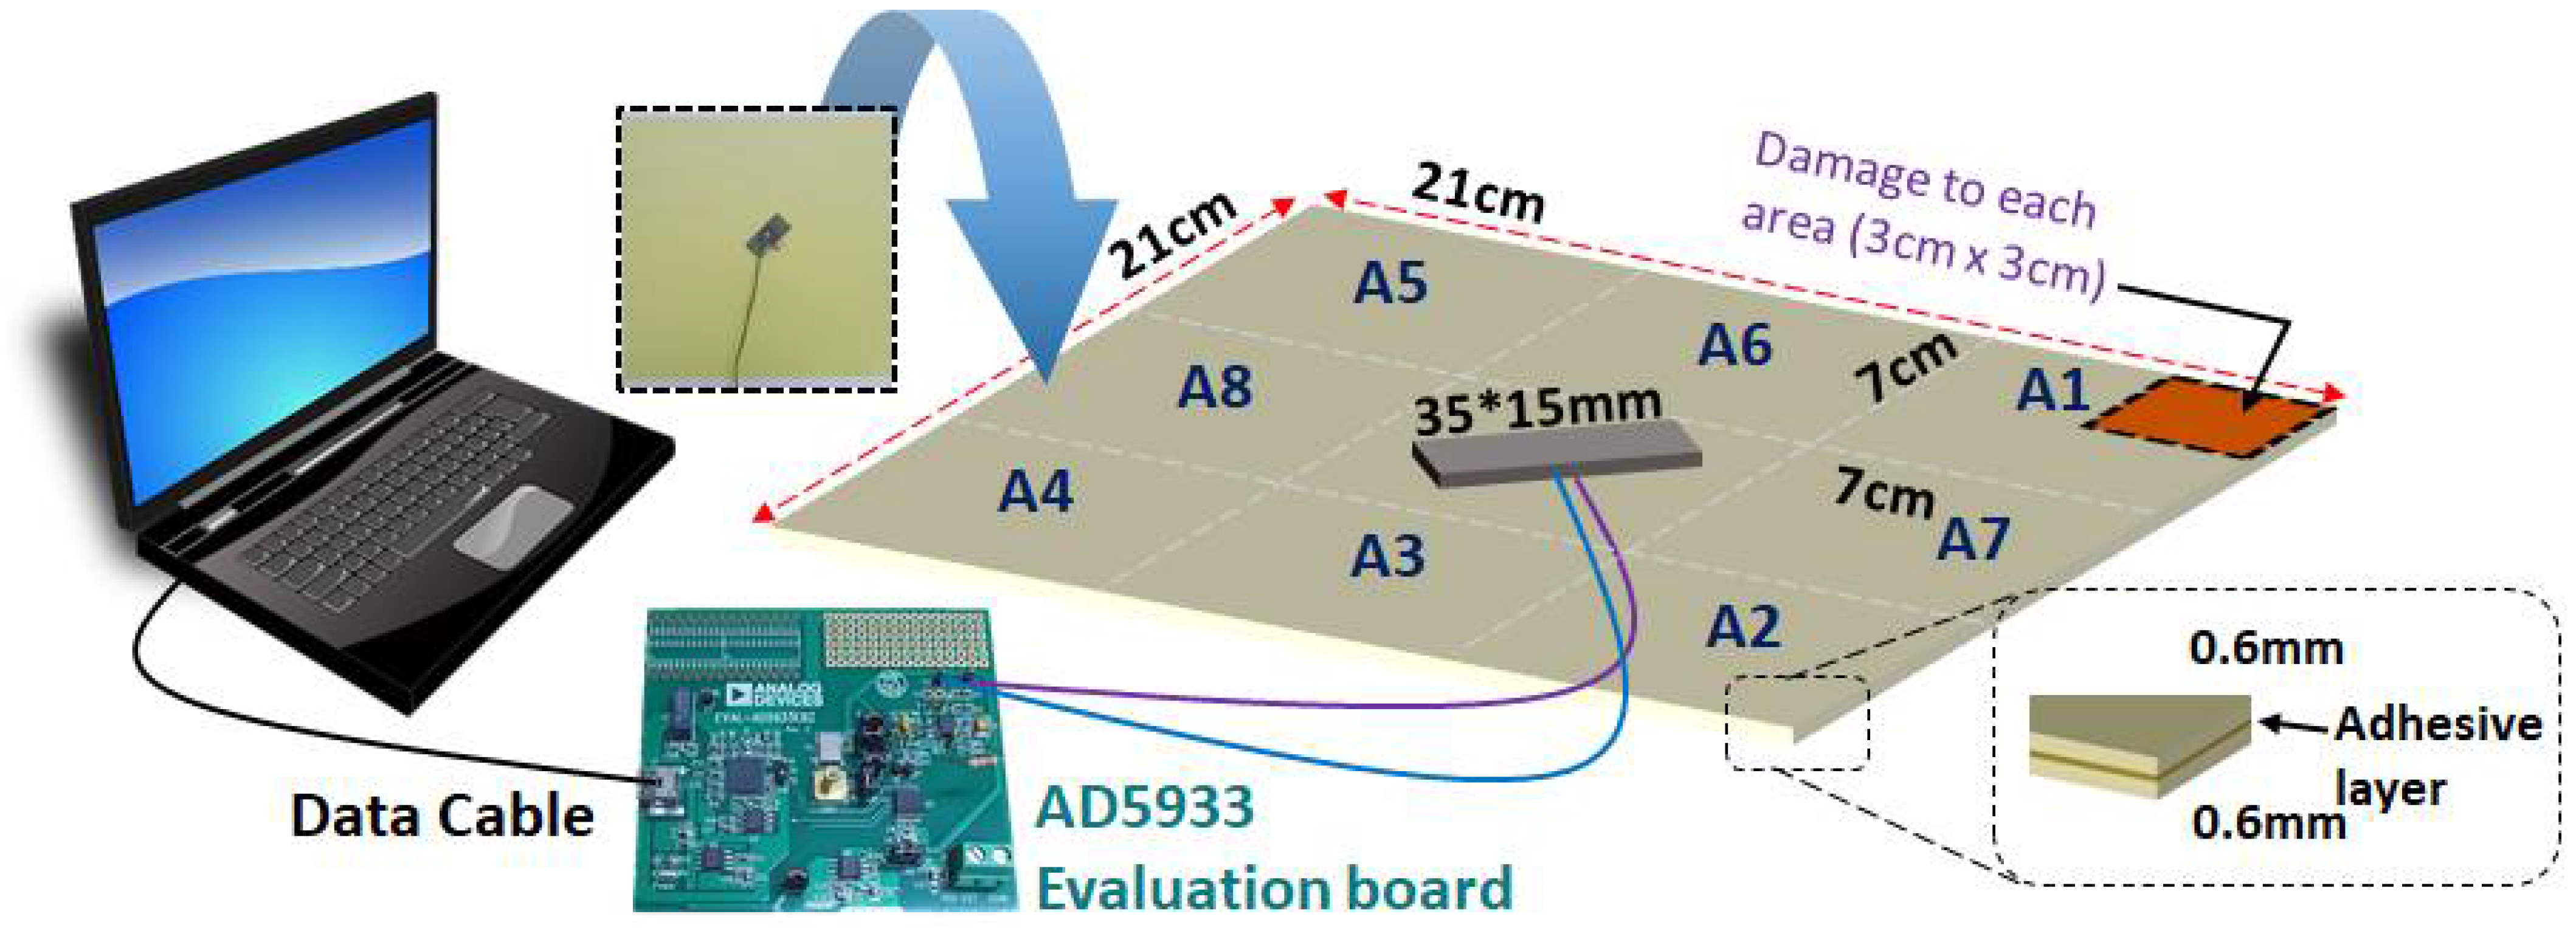
Before introducing the biomimicry idea, we first need to identify the limitation of conducting the EMI technique using the conventional approach of attaching the PZT (lead-zirconate-titanate) transducer. The setup for the EMI technique used for this section can be seen in
Figure 1. By connecting the AD5933 evaluation board (manufactured from Analog Devices co., Wilmington, MA, USA) onto a computer and the PZT transducer (model 5A4E, purchased from Piezo.com), one can acquire impedance signatures using the provided software to conduct the EMI technique. The AD5933 evaluation board can measure impedance up to 100 kHz with more than 500 data points where the USB data cable also provides enough power to run the device. According to the one-dimensional equation proposed by Liang et al. (1994) in Equation (1), the electrical admittance
is a combined function of
and
, which are the mechanical impedance of the host structure and the PZT transducer, respectively. This means that any change in structural properties (such as damage) can be detected by measuring the electrical impedance of the PZT transducer attached to the host structure. Other variables in the equation, which are
,
,
,
,
,
,
,
represent the PZT output current, PZT input voltage, input frequency, geometric constant, dielectric constant, loss tangent, piezoelectric constant and Young’s modulus, respectively.
Two 0.6 mm thickness glass fiber reinforced epoxy composite plates shown in
Figure 1 is attached to each other using an epoxy adhesive (quick-set Epoxy, Loctite, Düsseldorf, German) where the test specimen was divided into 8 areas labelled A1 to A8. Within each area, a small part was debonded (3 cm × 3 cm) where the impedance signatures were measured after debonding from each of the 8 areas. This resulted in a total number of 9 signatures which can be seen in
Figure 2.
Observing
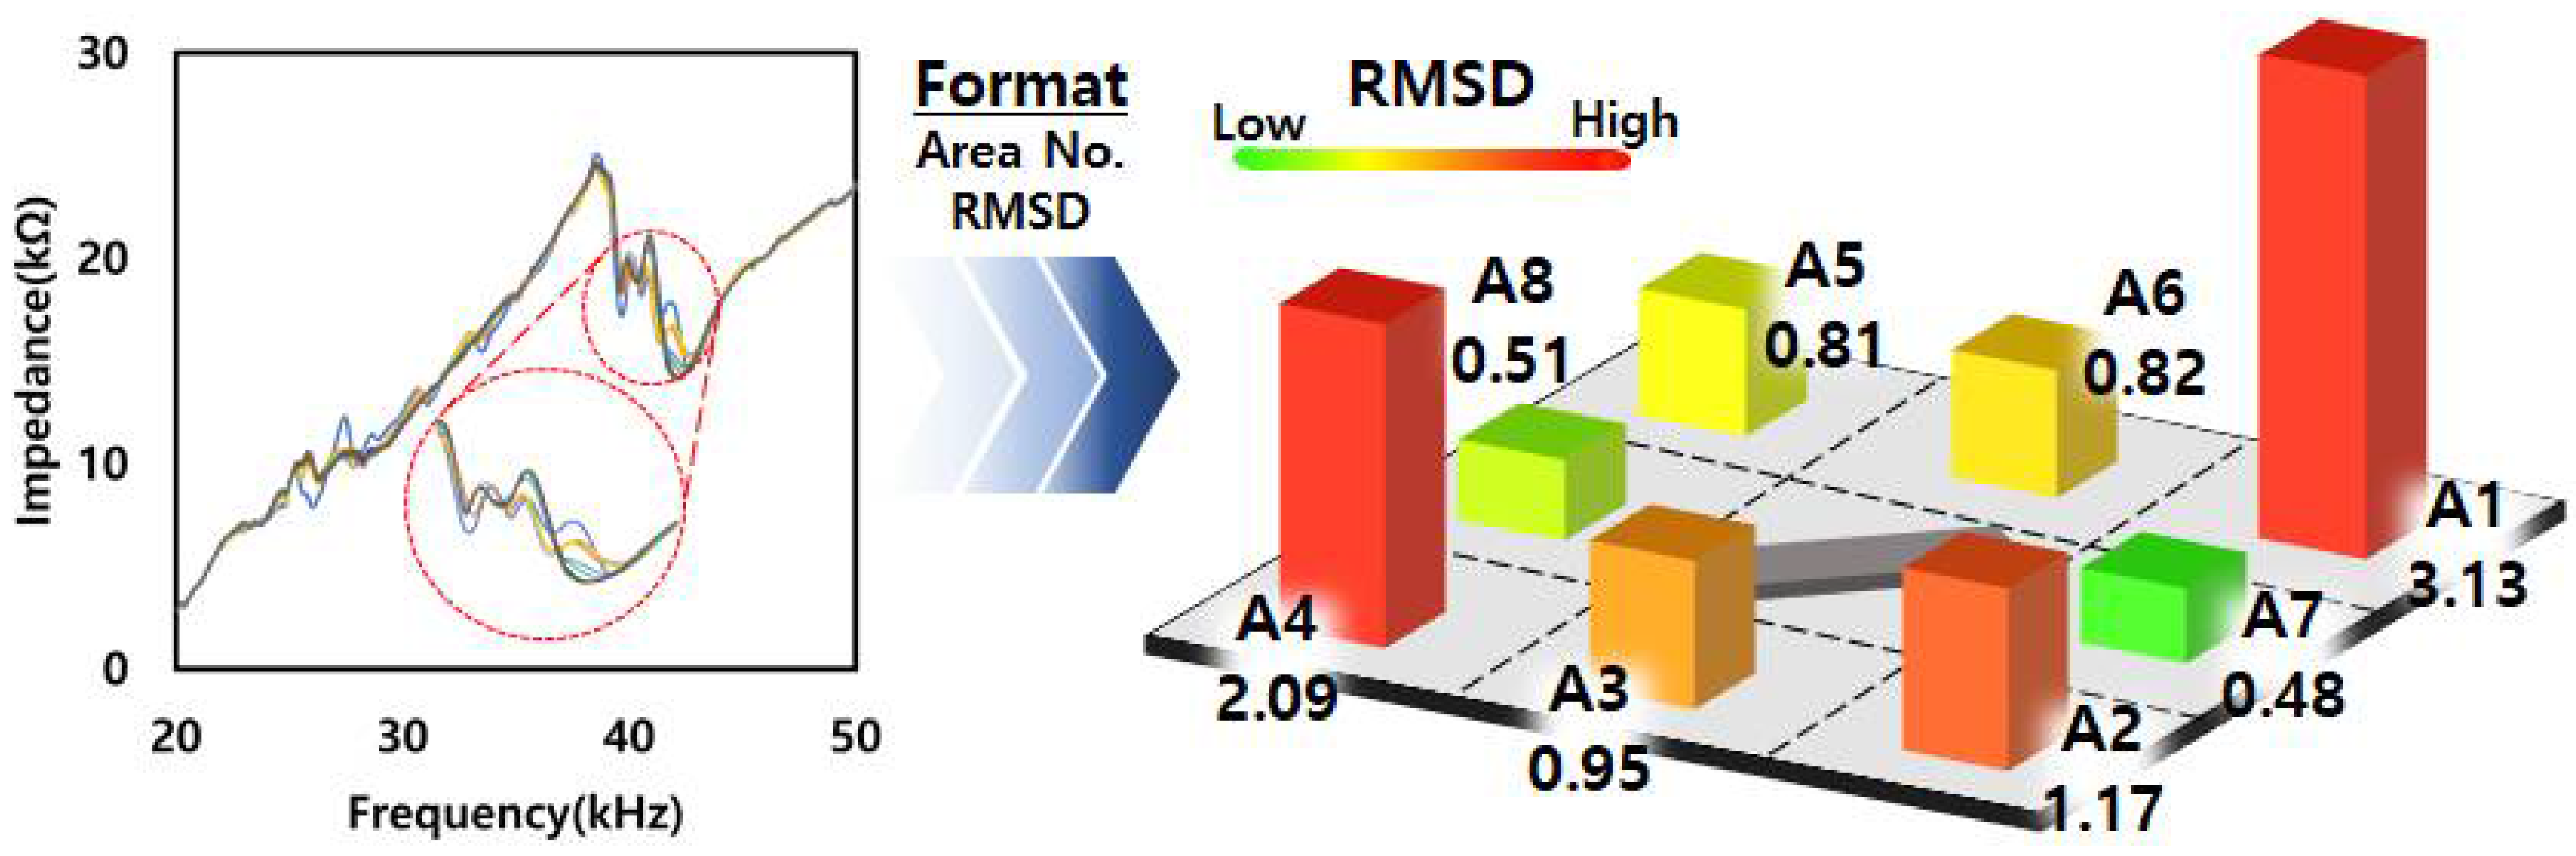
Figure 2, we notice that there are only small peaks along the impedance signatures. With a closer look, the variations can be seen at around 32 kHz, 41 kHz and 47 kHz with the amplitude of the peaks changing. Next, to quantify the severity of damage, RMSD (root mean square deviation) values were calculated for the debonding damage for each area where the two impedance signatures before and after the debonding damage were used to calculate the RMSD values. The RMSD values have been used to analyze the EMI technique in general as it has been found to be effective in identifying damage by various researchers. The equation on RMSD is shown below where
and
represents the signatures before and after damage, respectively. The variable
N in the equation represents the number of the impedance signature:
The calculated RMSD values are labeled in the right side of
Figure 2 where the values can be seen for each area (A1 to A8). Looking at the figures, the highest RMSD value was observed for A1 with 0.5 with the lowest being 0.31 for A4 and A6. Although all the areas have similar distances to the PZT transducer attached in the middle of the composite structure, there are differences in the RMSD values. In addition, one can say the 0.5 is about 1.6~7 times larger than the 0.31. One of the reasons for such a difference is due to the fact that the impedance signature keeps changing as debonding damage is given to the structure. Nevertheless, one can say that an RMSD value of 0.31 can be set as a threshold value and any value above this value can be used to identify debonding damage.
From past studies conducted by various authors in the field of the EMI technique, it has been experimentally found that damage detection using the EMI technique is more difficult for non-homogenous materials (such as composite structures or concrete) compared to homogenous materials such as steel. One reason is due to the damping effect where the impedance signature change will be larger for steel structures compared to composite structures subjected to same damage. Thus, it is vital for one to acquire a large difference in the impedance signature subjected to damage to avoid false alarms as a small change in the surrounding temperature can also cause the impedance signatures to change. For this reason, the authors have introduced a way of causing the impedance signatures to change as large as possible subjected to debonding damage by biomimicking a spider and its web.
3. Spider Web Inspired EMI Technique for Damage Detection
Spiders can pluck and pull their web to send out ripples in every direction to sense the vibrations in each of its eight legs. These vibrations provide the spider with vital information about the state of the web and the presence of prey. Inspired from nature, the authors used three steel wires (where two wires are bent 90 degrees) to be attached to a 35 mm × 15 mm PZT transducer, as shown in
Figure 3. By bending the wires, it is possible to monitor six different areas, as shown in the figure (A1 to A6), where each end of the wires is attached to the composite plate using epoxy. Since the steel wires are homogenous material, one can expect that the impedance signature change was larger compared to the previous section subjected to debonding damage.
Here, the test conducted in the previous section was tested again using the proposed idea by introducing debonding damage to all eight areas. Looking at
Figure 3, the ends of the wires are attached to the surface of the test specimen. Note that A7 and A8 have no wires attached as the authors wanted to clearly identify the effect of using the wires subjected to debonding damage. One can assume that the impedance signature will dramatically change when debonding occurs directly below the end of wires (from A1 to A6).
Using the proposed biomimicry idea, the impedance signatures and the calculated RMSD values for each area are shown in
Figure 4. At first glance, the impedance signatures have many more peaks and the RMSD values are higher compared to
Figure 2. Thus, this experimentally proves that the proposed idea is effective. The highest RMSD value is 3.34 for A1 subjected to debonding where this is more than six times higher compared to A1 in
Figure 2 (value of 0.5). However, A7 and A8 show relatively low RMSD values of 0.47 and 0.53 where the reason is due to the fact that the ends of the wires are not attached to this area (
Figure 3). Thus, this experimentally shows that the proposed idea performs best when debonding occurs directly below the end of the wires. Furthermore, one explanation of the large differences in the RMSD values between areas can be said to be due to the existence of nodes and antinodes. Debonding damage to certain areas can create larger variations in the signature and this makes the EMI technique difficult to analyze for the existence of damage. Nevertheless, it can be said that the proposed idea for this study is effective when monitoring a composite structure for debonding damage.
Next, the authors wanted to evaluate the performance of the proposed idea subjected to different thicknesses of the composite structure. Thus, two more tests were conducted with different thicknesses of the top layer, which were 0.4 mm and 0.2 mm, to find out the performance of the EMI technique when subjected to a thinner structure. The same test conducted in the previous test was conducted again with the two different top layers where the impedance signatures and the RMSD values are shown in
Figure 5 and
Figure 6. By observation, both figures show variations in the impedance signatures subjected to debonding damage where A1 shows the highest RMSD values of 3.13 and 2.71 for 0.4 mm and 0.2 mm thicknesses, respectively. In addition, most of the RMSD values with the 0.2 mm thickness structure show higher values compared to
Figure 4 which leads to the fact that thinner structures will result in a better outcome when using the EMI technique.
4. Comparison Analysis on the RMSD Values for All Tests
Figure 7 shows all the RMSD value results of all the experiments conducted for this study (
Figure 2,
Figure 4,
Figure 5 and
Figure 6). The labels “Conv”, “0_6”, “0_4” and “0_2” represent the RMSD values for
Figure 2,
Figure 4,
Figure 5 and
Figure 6, respectively. Combining all the values together clearly shows that the proposed idea is effective where “Conv” values show the lowest values overall. Additionally, the high RMSD values for A1 and A4 indicates that the shape of the PZT transducer and the steel wires attached to it can have an effect on the result as this pattern can be seen for the 0_6, 0_4 and 0_2 experiments. Relatively low RMSD values are shown for A7 and A8 where the reason is due to the fact that the end of the wires are absent in this area, as mentioned in a previous section. However, the three RMSD values using the proposed idea in A7 and A8 are higher than “Conv” experiment RMSD values which is a positive sign.
Additionally, in the figure, the averaged values are also plotted on the right end of the graph where the calculated values for Conv, 0_6, 0_4 and 0_2 are 0.39, 1.19, 1.25 and 1.55, respectively. These values show that the performance of the EMI technique can be improved by applying the biomimicry idea proposed in this study for detecting the existence of debonding damage on composite structures. The RMSD values are high for A1 and A4 compared to the rest of the areas and one of the reasons can be said to be due to the shape of the PZT transducer and length of the wires where this will be further researched in detail in a future study. With the averaged values, 0_2 with the 1.55 RMSD value indicates that the EMI technique performs better with thinner structures as expected.
5. Conclusions
In this study, the authors proposed a biomimicry idea based on a spider and its web to enhance the damage detection performance of glass fiber reinforced epoxy composite plates subjected to debonding damage. The first experiment was performed by using two composite plates of size 210 mm × 210 mm × 0.6 mm bonded to each other using an epoxy adhesive where debonding was given to 8 different areas (A1 to A8). Here, all the RMSD values were below 0.5 with the average value of 0.39 when all 8 areas were averaged. Such low RMSD values can cause false alarms when detecting damage as the EMI technique is a sensitive technique where the impedance signatures can vary with a small change in the environmental temperature. Thus, to overcome this problem, the proposed idea was tested against three composite structures with different top layer thicknesses of 0.6 mm, 0.4 mm and 0.2 mm.
By analyzing the results from the three tests, the RMSD values were higher with the proposed idea with the highest value of 3.34 subjected to debonding on A1 with the 0.6 mm thickness top composite plate. Furthermore, the averaged values for all three tests (0_6, 0_4 and 0_2 from
Figure 7) were 1.19, 1.25 and 1.55 which indicates that the EMI technique performs better with a thinner structure. Although one could say that the differences between RMSD values are quite large between areas such as A1 and A6, the shape of the PZT transducer and the length of the wire can affect the outcome. For this reason, more research will be conducted in detail in a future study.


