Article

Ultrasound-Assisted Extraction of Specific Phenolic Compounds from Petroselinum crispum Leaves Using Response Surface Methodology and HPLC-PDA and Q-TOF-MS/MS Identification

by
Afroditi Michalaki
1,*,
Haralabos C. Karantonis
1,*,
Anastasia S. Kritikou
2,
Nikolaos S. Thomaidis
2 and
Marilena E. Dasenaki
3
1
Laboratory of Food Chemistry, Biochemistry and Technology, Department of Food Science and Nutrition, School of the Environment, University of The Aegean, Metropolitan Ioakeim 2, 81400 Lemnos, Greece
2
Laboratory of Analytical Chemistry, Department of Chemistry, National and Kapodistrian University of Athens, Panepistimioupolis Zografou, 15771 Athens, Greece
3
Laboratory of Food Chemistry, Department of Chemistry, National and Kapodistrian University of Athens, Panepistimioupolis Zografou, 15771 Athens, Greece
*
Authors to whom correspondence should be addressed.
Appl. Sci. 2023, 13(2), 798; https://doi.org/10.3390/app13020798
Submission received: 5 December 2022 / Revised: 1 January 2023 / Accepted: 4 January 2023 / Published: 6 January 2023
(This article belongs to the Special Issue New Insights into Natural Antioxidants in Foods)

Abstract

:
Petroselinum crispum is native to the Mediterranean region and has been reported to contain several phenolic compounds in addition to the highest quantity of apigenin among several natural raw materials. The aim of the present study was to establish an extraction method for the most abundant phenolic compounds of Petroselinum crispum leaves by using response surface methodology. A Box–Behnken design was applied to optimize the extraction conditions with regards to the extraction time, temperature, solvent mixture, and sample to solvent ratio with the use of ultrasound-assisted extraction. An analytical HPLC-PDA methodology was developed to accurately quantify the phenolic compounds in the extracts. Identification of the most abundant phenolic compounds (luteolin, caffeic acid, and apigenin) was also performed with an UPLC-Q-TOF MS methodology. The predicted optimal conditions of the statistical model were identified, and the predicted values confirmed. Actual values of 23.92 ± 1.86 with 100 mL/g, 40% ethanol, 70 °C and 40 min, 19.10 ± 0.75 with 20 mL/g, 0% ethanol, 70 °C and 40 min, and 25.29 ± 1.82 μg/g dry parsley with and 100 mL/g, 0% ethanol, 25 °C and 40 min of luteolin, caffeic acid, and apigenin respectively, were estimated. Total phenolic content and antioxidant activities by DPPH, ABTS, FRAP, and CUPRAC assays were performed for the extracts. The extracts acquired under the optimum conditions contain an adequate quantity of phenolic compounds that could be used in the production of functional foods by food enrichment prcedure.

1. Introduction

Petroselinum crispum, also known as parsley, is an aromatic herb that belongs in the Apiaceae family and has been used for almost 500 years in food (parsley may be one of the oldest herbs used as condiment in food) as well as pharmaceutical, perfume and cosmetic industries [1,2,3]. It is native to the central and eastern Mediterranean region, but in the modern world, it is cultivated on all continents. Previous studies on the chemical composition of parsley have revealed the presence of phenolic acids and flavonoids. These compounds can significantly prevent the oxidating stress. High antioxidant capacity is considered to be an important factor for the delay or the prevention of several diseases, such as heart diseases, neurodegenerative diseases, cancer, and of the aging prcess [2,4,5,6,7,8]. Additionally, parsley has been reported to contain the highest quantity of apigenin among several natural raw materials [9,10], as well as potential benefits on the immune system, sleep, testosterone production, blood sugar levels, and several types of cancer [11]. Furthermore, parsley has been reported to contain a high quantity of luteolin and caffeic acid which, along with their anti-oxidativeand anti-inflammatory properties, have also been reported to have potential anticancer properties [12,13,14]. In addition, parsley and its extracts are used to treat various illnesses, such as Alzheimer’s and cardiovascular diseases, and are also are employed to help people with thrombosis problems and strokes [15,16].
Taking into consideration the health benefits of specific parsley constituents, there is significant interest in evaluating and optimizing a procedure that will properly extract the relevant compounds and further utilize the extracts. Since the extraction step is of highest importance to obtain the compounds of interest, more attention is being paid to evaluating the proper extraction techniques and optimizing the respective process parameters.
Some new extraction techniques have been developed in the frame of green extraction, such as microwave extraction (ME), supercritical fluid extraction (SFE), and ultrasonic-assisted extraction (UAE). Special interest has been given to ultrasound assisted extraction because of its positive impact on the bioactive compounds extraction process, such as higher product yields, shorter extraction time, and lower costs in contrast with other extraction techniques [17,18].
During preliminary experiments, along with apigenin, luteolin, and caffeic acid; gallic acid, ferulic acid, quercetin, and kaempferol were also extracted from parsley. However, apigenin, luteolin, and caffeic acid were obtained in higher quantities, so the experimental design was conducted for these three compounds.
Thus, the aim of the study was to identify the existence of apigenin, caffeic acid, and luteolin in Petroselinum crispum by HPLC-PDA and HPLC-QTOF-MS methodology and then determine (a) the optimum extraction conditions of these phenolic compounds by using a response surface methodology and (b) the antioxidant activities of the extracts obtained under optimized conditions.

2. Materials and Methods

2.1. Chemicals and Reagents

Fresh Petroselinum crispum (1 kg) used in the experiments were obtained in the island of Lemnos, located in the Aegean Sea of Greece. Only the Petroselinum crispum (parsley) leaves were used for the experiment.
The reagents Folin–Ciocalteau, Trolox (6-hydroxy-2,5,7,8-tetremethychroman-2-carboxylic acid), and anhydrous sodium carbonate were purchased from SDS (Peypin, France). DPPH (1, 1-Diphenyl-2-picryl-hydrazyl), caffeic acid, luteolin, and apigenin were purchased from Sigma–Aldrich (St. Louis, MO, USA). Methanol, acetic acid HPLC water, and acetonitrile were purchased from Thermo-Fisher scientific (Nepean, ON, Canada). Neocuproine was purchased from Acros Organics (Fair Lawn, NJ, USA). Ammonium acetate, sodium chloride, sodium dihydrogen phosphate dehydrate, and copper chloride dihydrate were all purchased from Penta (CZ Ltd., Chrudim, Czech Republic). ABTS (2,2’ -azinobis (3-ethylbezothiazoline-6-sulphonic acid)) was purchased from Applichem (Darmstadt, Germany). Potassium persulfate was purchased from Chem-Lab (Zedel-gem, Belgium).

2.2. Preparation of the Samples

For the preparation of the parsley samples, the fresh parsley that was cultivated in Lemnos Island and had been purchased from a local shop was transferred to oven at 40 °C for 48 h. Then the dried parsley was further processed for one minute in a laboratory grinder IKA A 10 basic (IKA Works, Wilmington, NC, USA) to achieve a sample of fine powder. The water activity (aw) was measured at 0.36, using a water activity meter (Novasina Lab Touch-aw meter, Novasina AG, Zurich, Switzerland).

2.3. Ultrasound-Assisted Extraction (UAE)

The phenolic compounds extraction from parsley samples was performed with the use of a cup-horn of 750-Watt ultrasonic processor VCX-750 equipped with a sealed converter (Sonics & Materials, Inc., Newtown, CT, USA). A one-to-one pulse in seconds was applied combined with a 60% amplitude while several temperatures were applied, from 25 °C to 70 °C, for the preliminary experiments. With regards to the sample preparation, 0.6 g of dried samples were weighed in a 10-mL tube. The tube was filled up to 6.0 mL with purified water, ethanol, or ethanol/water in various ratios. After extraction, samples were centrifuged for 5 min at 3000× g and supernatants were filtered in HPLC vials through 0.20-μm RC (regenerated cellulose) filters before the analysis.

2.4. Experimental Design

The Box–Behnken design (BBD), a standard RSM design, is highly suited to fitting a quadratic surface, which is often used for process optimization. It was selected to identify the optimum extraction conditions for luteolin, caffeic acid, and apigenin from the dried parsley sample. The four independent factors were temperature (X1), time (X2), liquid to solid sample ratio (X3), and ethanol concentration (X4).
Each factor was coded at three levels: −1, 0, and +1. The factors and their corresponding levels, both coded and actual, chosen in the four-factor-three-level BBD were based on preliminary one-factor-at-a-time experiments, literature research, and instrumental specifications, and are presented in Table 1.
RSM was used to fit a complete second-order polynomial equation to the design points and experiment data. The following quadratic response surface model Equation (1) for four components was fitted:
Y = β 0 + i = 1 4 β i X i + i 4 β i i X i 2 + i = 1 3 j = i + 1 4 β i j X i X j + ε
In Equation (1), Y corresponds to the response variable (μg/g DM), for each phenolic under evaluation (luteolin, caffeic acid, and apigenin) that was obtained via HPLC-DAD. Χi and Χj are the independent factors affecting the response (Table 1). The terms β0, βi, βii, and βij are the regression coefficients of the model (intercept, linear, quadratic, and interaction term) and ε corresponds to the random error term.
Analysis of variance (ANOVA) was used to estimate the fitting of the entire quadratic approximation of the BBD response surface model. The significance of each source of terms (linear, two-factor interaction, and quadratic), as well as the regression coefficients of the fitted model, were examined using the F-values and pertinent p-values. Statistically significant terms were those whose probability (p-value) at the 95% confidence level fell below 0.05.

2.5. Verification of the Statistical Model

Optimum extraction conditions of the phenolic compounds under question, that is luteolin, caffeic acid, and apigenin from parsley samples, were based on the evaluation of sample to solvent ratio, extraction temperature and time, and solvent composition and were obtained using the predictive equations of RSM. The concentration of luteolin, apigenin, and caffeic acid was determined after extraction of phenolic compounds under optimal conditions. The experimental and predicted values were compared to determine the validity of the model.

2.6. Determination of Phenolic Compounds with HPLC-PDA

For the determination of phenolic compounds during preliminary experiments as well as during the analysis of extracts produced in the frame of experimental design, a Shimadzu HPLC 2030C prominence-i system equipped with a binary pump, a degasser, an autosampler, a column heater, and a PDA detector was used. A Phenomenex Luna C18(2) analytical column (4.6 mm × 250 mm, particle size 5.0 μm) was used for the separation of the phenolic compounds under evaluation. The elution was performed using water acidified with 0.2% formic acid (mobile phase A) and methanol (mobile phase B). The adopted elution gradient was applied as follows: 0 min, 5% mobile phase B; 2 min, 5% mobile phase B; 20 min, 95% mobile phase B; 25 min, 95% mobile phase B; 25.01 min, 5% mobile phase B; 28 min, 5% mobile phase B. The injection volume was 20 μL, UV–vis spectra were recorded from 190 to 800 nm while the chromatograms were registered at 280 and 320 nm. The analytical methodology was successfully validated in terms of linearity, accuracy, stability, limit of quantitation, and precision (system precision, reproducibility) for each phenolic compound under evaluation [19].

2.7. Identification of Phenolic Compounds with HPLC-QTOF-MS

An UHPLC system with an HPG-3400 pump (Dionex UltiMate 3000 RSLC, Thermo Fisher Scientific, Germany) coupled to a QTOF mass spectrometer (Maxis Impact, Bruker Daltonics, Bremen, Germany) was used for the analysis. Negative electrospray ionization mode was applied. Separation was carried out using an Acclaim RSLC C18 column (2.1 × 100 mm, 2.2 μm) purchased from Thermo Fisher Scientific (Driesch, Germany) with a pre-column of ACQUITY UPLC BEH C18 (1.7 μm, VanGuard Pre-Column, Waters (Waters Corporation®, Wexford, Ireland). Column temperature was set at 30 °C. The solvents used consisted of (A) 90% H2O, 10% methanol, and 5 mM CH3COONH4 (Mobile phase A) and 100% methanol and 5 mM CH3COONH4 (Mobile phase B). The adopted elution gradient started with 1% of organic phase B with flow rate 0.2 mL min−1 during 1 min, gradually increasing to 39% for the next 2 min and then increasing to 99.9% and flow rate 0.4 mL min−1 for the following 11 min. These almost pure organic conditions were kept constant for 2 min (flow rate 0.48 mL min−1), and then initial conditions (1% B–99% A) were restored within 0.1 min (flow rate decreased to 0.2 mL min−1) to re-equilibrate the column for the next injection.
The QTOF-MS system was equipped with an electrospray ionization interface (ESI), operating in negative mode with the following settings: capillary voltage of 3500 V, end plate off-set of 500 V, nebulizer pressure of 2 bar (N2), drying gas of 8 L min−1 (N2), and drying temperature of 200 °C. A QTOF external calibration was daily performed with sodium formate (cluster solution), and a segment (0.1–0.25 min) in every chromatogram was used for internal calibration, using calibrant injection at the beginning of each run. The sodium formate calibration mixture consisted of 10 mM sodium formate in a mixture of H2O/isopropanol (1:1). Full scan mass spectra were recorded over the range of 50–1000 m/z, with a scan rate of 2 Hz. MS/MS experiments were conducted using AutoMS data-dependent acquisition mode based on the fragmentation of the five most abundant precursor ions per scan. The instrument provided a typical resolving power (FWHM) between 36,000 and 40,000 at m/z 226.1593, 430.9137, and 702.8636.

2.8. Evaluation of Antioxidant Activity

The antioxidant activities of the extracts, obtained at optimized conditions, were evaluated by the DPPH, ABTS, FRAP, and CUPRAC assays. Each sample was examined in triplicate. Trolox solutions were prepared in appropriate concentrations for quantitation purposes, and the results were expressed as Trolox equivalents in nmol per g of dry parsley for all the antioxidant tests performed.
The capacity of extracts to scavenge the free radical of DPPH was evaluated using the method from Miller et al. [20] with minor modifications. An aliquot of the extract (25 to 100 µL) or appropriate standard solution of Trolox was diluted with methanol up to 0.9 mL. Then, 0.1 mL of 0.6 mM DPPH reagent in methanol was added, followed by vigorous stirring. After 15.0 min in the dark, the absorbance was measured at 515 nm against a reference sample containing methanol.
Determination of ABTS radical scavenging activity of samples was performed using the method from Brand-Williams et al. [21] with minor modifications. ABTS radical cation (ABTS•+) was produced by the oxidation of ABTS with potassium persulfate (K2S2O8). The ABTS•+ was generated by reacting 7 mmol/L stock solution of ABTS with potassium persulphate in a final concentration equal to 2.45 mmol/L. The ABTS•+ working solution was prepared by dilution of the stock solution using distilled water to give an absorbance of 0.700 at 734 nm. Aliquots of parsley extracts (25 to 100 µL) or appropriate amounts of Trolox standards were diluted to 1.0 mL with working ABTS•+ solution and were vigorously stirred. Samples remained for 15.0 min in the dark at ambient temperature and the absorbance was measured at 734 nm. The ability of the extracts to scavenge the ABTS•+ was evaluated relative to a reference sample that did not contain any quantity of extract.
The reducing potential of the samples was determined using the FRAP assay as described by Benzie and Strain [22]. The method is based on the reduction of the Fe3+—tripyridyl triazine complex to its ferrous-colored form at low pH in the presence of antioxidants. The FRAP reagent was freshly prepared and contained 0.2 mL of a 10 mM TPTZ (2,4,6-tripyridy-s-triazine) solution in 40 mM HCl plus 0.2 mL of 20 mM FeCl3•6H2O plus 0.2 mL of 3.0 M acetate buffer, pH 3.6. Aliquots of extracts (10 to 50 µL) were transferred in test tubes and dissolved up of 900 µL with distilled water, followed by addition of 300 µL of FRAP solution and vigorous stirring. The samples were incubated for 10 min in a 37 °C water bath, and the absorbance was measured at 593 nm.
The reducing capacity of the samples was also determined using the CUPRAC assay according to Özyürek et al. [23]. Aliquots of parsley extracts (10 to 50 µL) were transferred in test tubes and diluted with 300 µL of 10 mM CuCl2•2H2O, 7.5 mM neocuproine, and 1 mM CH3COONH4 buffer solution with pH = 7.0, followed by the addition of distilled water up to the volume of 1200 µL. The samples were well stirred and remained at room temperature for 30 min. The absorbance of the samples was then measured at 450 nm.

2.9. Determination of Phenolic Compounds

The total content of phenolics in parsley extracts, obtained at optimized conditions, was measured in triplicate by using a modified version of Singleton and Rossi’s technique and was determined using the Folin–Ciocalteu’s method according to Singleton, Orthofer, and Lamuela-Raventos with some modifications [24]. The experiment was carried out by combining 5 to 20 µL of parsley extracts with 1.8 mL of distilled water and 0.1 mL of Folin-Ciocalteu reagent. The materials were then rapidly mixed and incubated in the dark for two minutes. After adding 0.3 mL of 20% (w/v) aqueous Na2CO3, the samples were rapidly agitated and incubated at 40 °C in a water bath for 30 min. Absorbance was measured spectrophotometrically at 765 nm, by a Spectrophotometer Lambda 25 (Perkin Elmer, Norwalk, CT, USA). Gallic acid was used to develop a standard curve. The final findings were expressed as equivalent concentrations of gallic acid (mg GAE per g dry parsley).

2.10. Statistical Analysis

Data presented as mean ± standard deviation (m ± SD). The response values of the RSM model were analyzed by Minitab® trial version statistical software (Minitab Ltd., Coventry, UK). SPSS V 28.0.10 software (IBM Corp., Armonk, NY, USA) was used for one-way analysis of variance (ANOVA) coupled with post hoc Tukey’s test for comparison of means of more than two samples and one-sample t-test analysis for the verification of the model. Statistical significance was defined at <0.05.

3. Results and Discussion

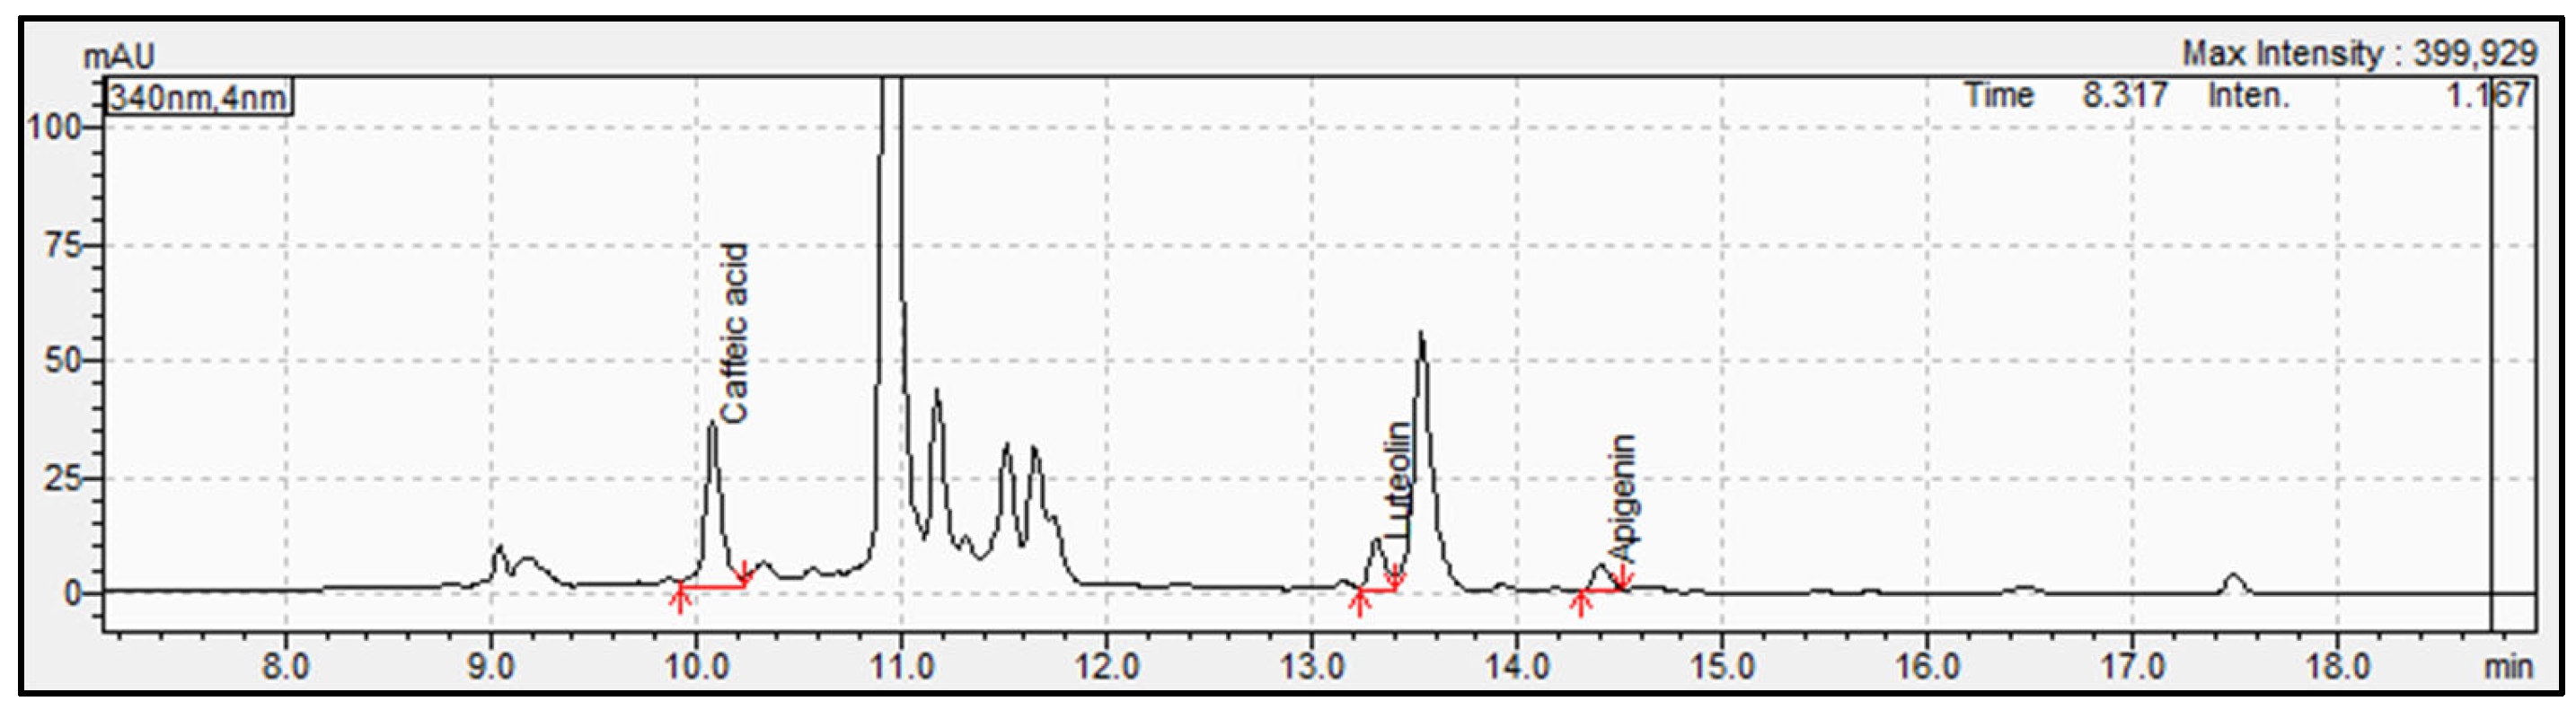
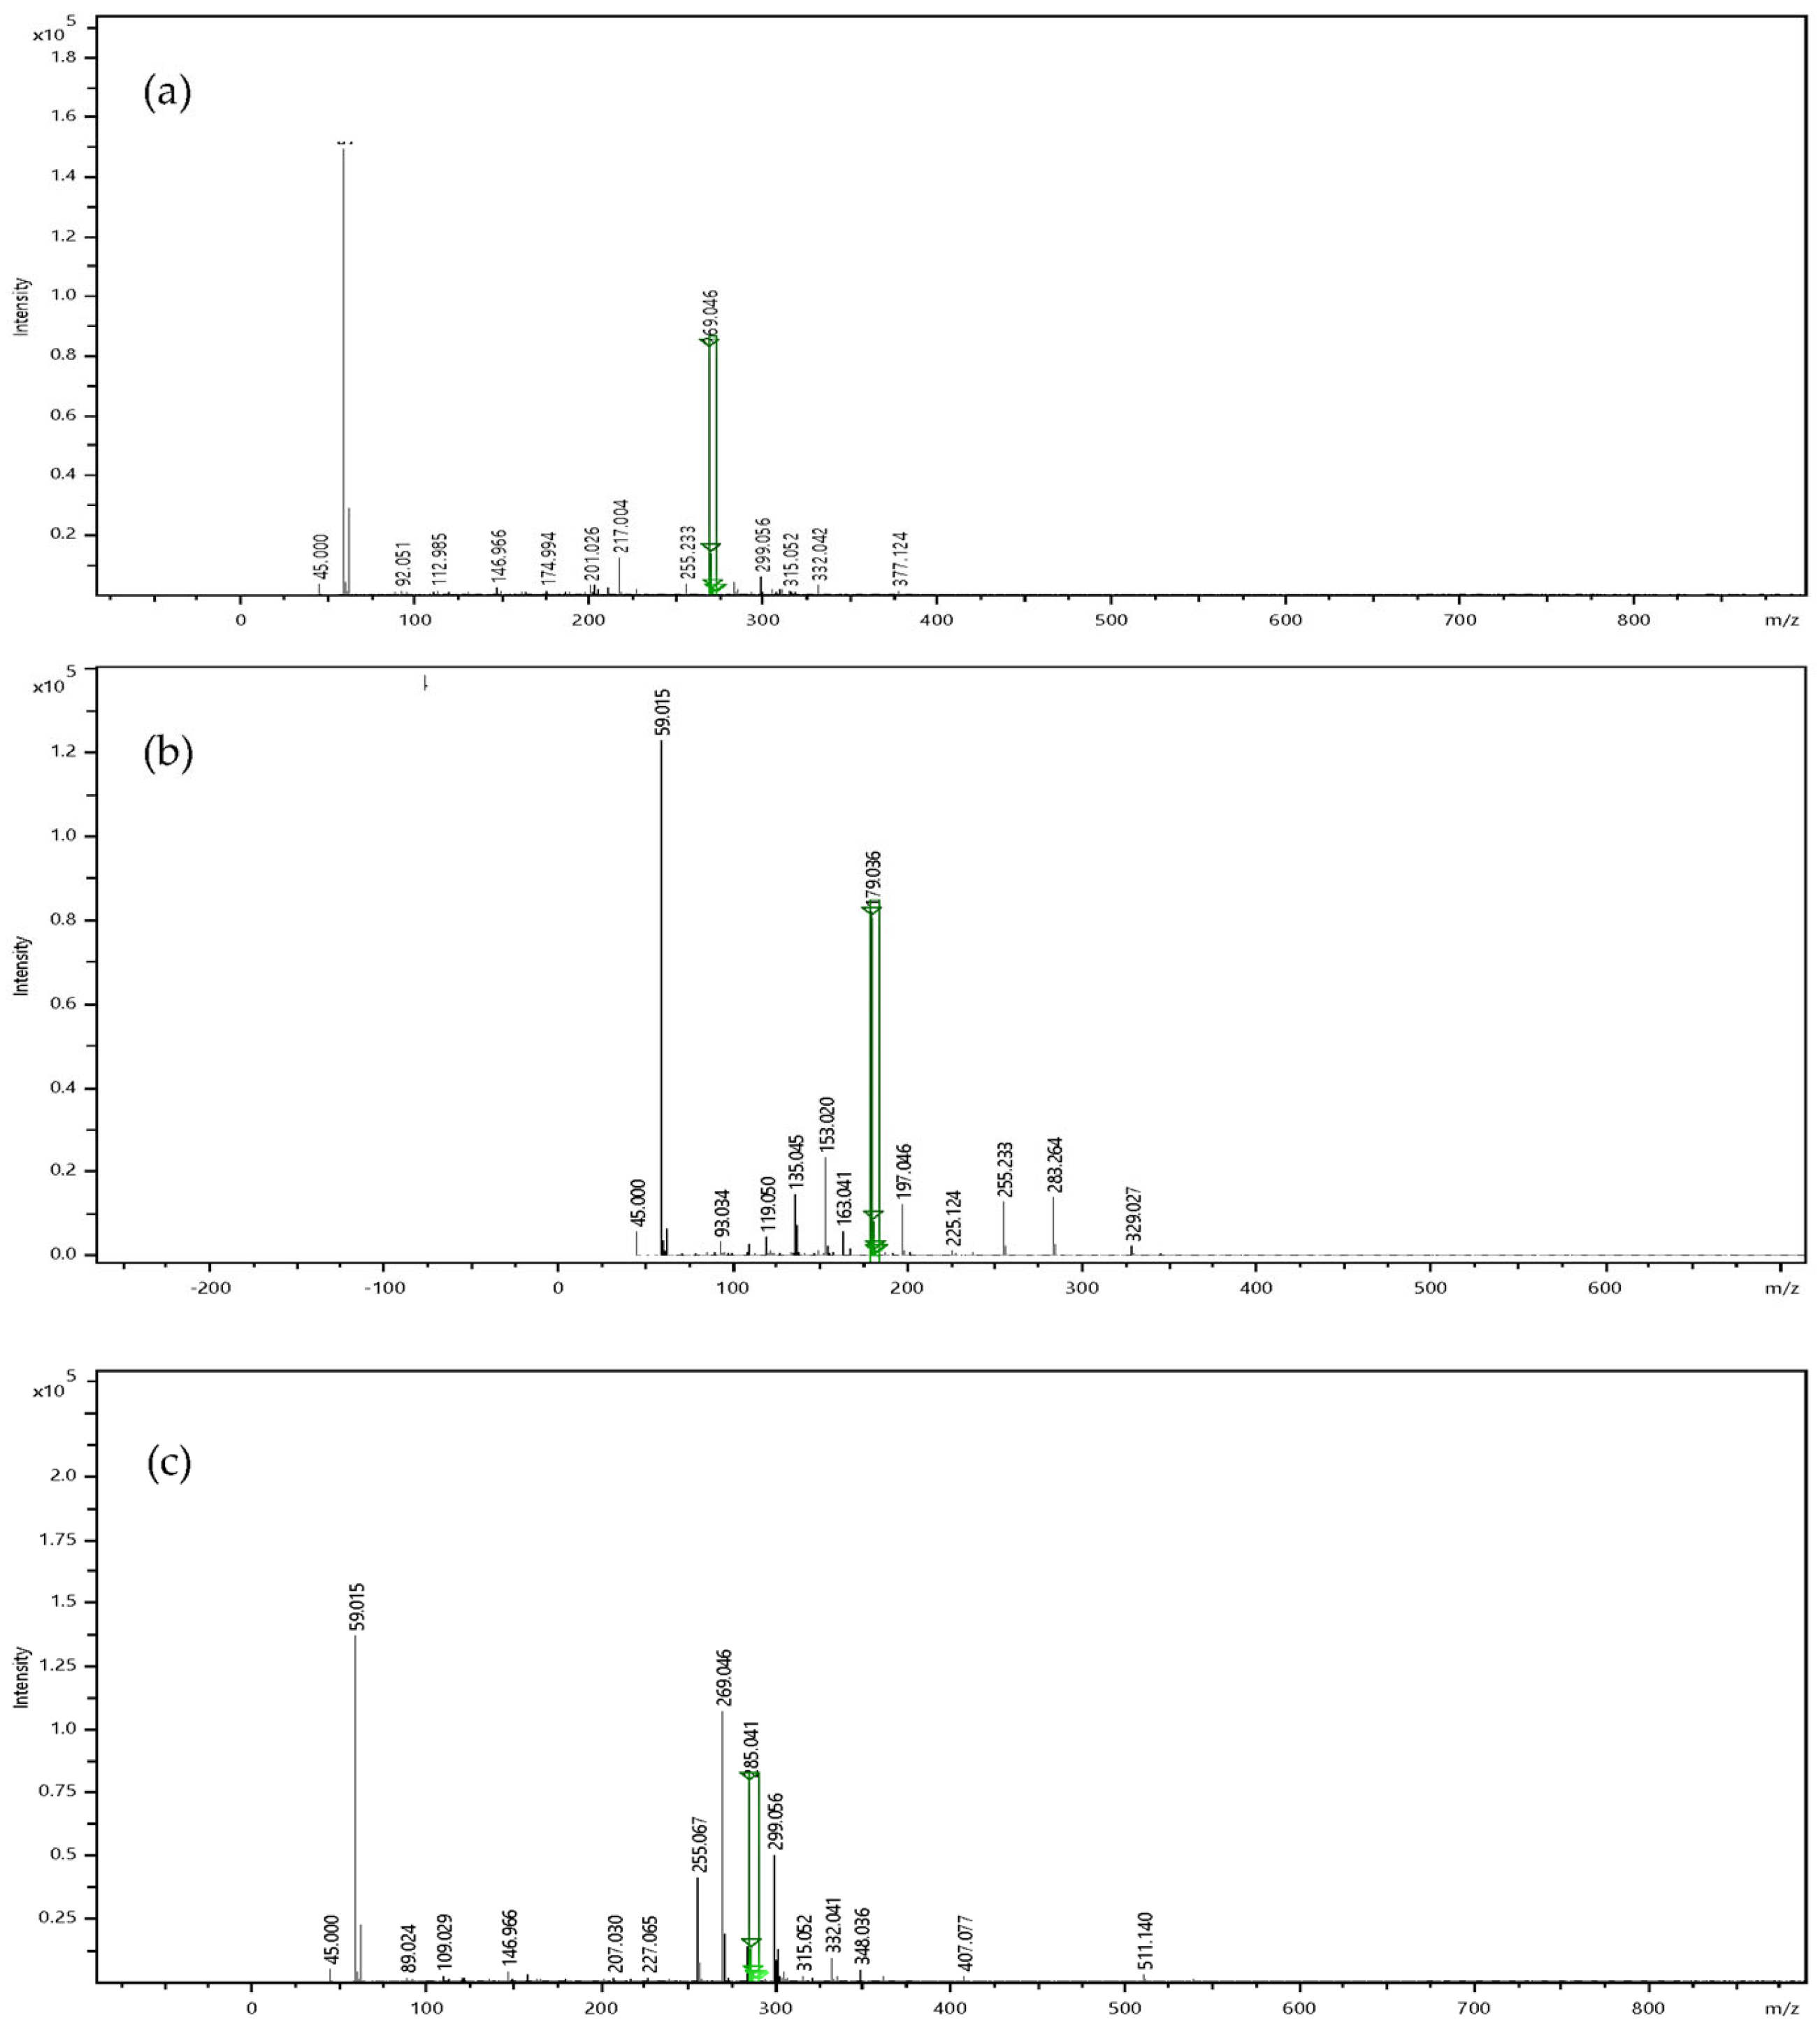
3.1. Determination and Identification of Phenolic Compounds in Parsley Samples by HPLC-PDA and UHPLC-QTOF-MS

Identification and determination of apigenin, luteolin, and caffeic acid was performed in parsley ultrasound assisted extract obtained with ethanol/water 30/70 (v/v) as a solvent and a ratio of solvent to dry parsley (LS ratio) equal to 20 mL/g. Extraction was performed for 20 min at 25 °C.
Determination of phenolic compounds was performed with the validated analytical method of HPLC-PDA (methodology is referred at Section 2.6). Figure 1 and Figure 2 show the profile of the phenolic compounds under evaluation for the sample and standard solution at 340 nm, respectively. Apigenin, luteolin, and caffeic acid were quantitively determined at 6.3 ± 0.2, 6.7 ± 0.2, and 1.8 ± 0.1 μg/g dry parsley, respectively.
The parsley extracts were also analyzed using UHLPC-QTOF-MS (methodology is referred to in Section 2.7) for confirmatory purposes, and the respective mass spectrums are presented at Figure 3. Precursor ions were obtained, and the identification was performed with validated methodology along with the software library for the three phenolic compounds. Identification of apigenin, luteolin, and caffeic acid was based on the accurate mass measurements of the molecular ion [M-H], the UV–Vis data and the comparison with the commercial standards that were available for these specific phenolic compounds.

3.2. Model Fitting

The optimization of the extraction procedure by ultrasound assisted extraction (UAE) of luteolin, caffeic acid, and apigenin from parsley was carried out by response surface methodology. More specifically, a Box–Behnken design was used to find out the combined effect between the factors of extraction temperature (25, 47.5, and 70 °C) (Χ1), extraction time (10, 25, and 40 min) (Χ2), ethanol concentration (0, 20, and 40% v/v) (Χ3) and solvent to dry parsley ratio (20, 60, 100 mL/g) (X4) on the extractability of luteolin, caffeic acid and apigenin as quantified with the use of a HPLC PDA methodology.
The experimental design matrix produced was based on BBD consisted of 27 combinations, including three center points, and was carried out in triplicate, resulting in a total of 81 runs that were conducted in a randomizing run order to reduce impact of variation on response values owing to the external factors. Results obtained from the USE of parsley are shown in Table 2. The experimental values varied from 7.8 to 24.8 μg luteolin/g dry parsley, 0.42 to 16.1 μg caffeic acid/g dry parsley, and 4.3 to 21.0 μg apigenin/g dry parsley (Table 2).
The fitting of the full quadratic approximation of the BBD response surface model was estimated by the analysis of variance (ANOVA). The F-values and relevant p-values were used to examine the significance of each source of terms, that is, linear, two-factor interaction, and quadratic, and the regression coefficients of the fitted models. Terms with p-value lower than 0.05 at the 95% confidence interval were identified as statistically significant.
A multiple regression analysis was employed to fit the response value and the experiment data. Model reduction was carried out to further refine the full quadratic response surface model by clicking off the insignificant terms with a significance level greater than 5% (p > 0.05). To further refine the full quadratic response surface model, because of the existence of non-significance effect of factors, transformation of the data and backward elimination of terms was performed.
Results of the analysis of variance (ANOVA), after data transformation and model reduction, were used to determine the degree to which the quadratic approximation of the BBD response surface reduced models fitted the data are presented in Table 3.
The ANOVA results (Table 3) suggested that the refined second-order models were statistically significant for apigenin, caffeic acid, and luteolin, since the F-values of 14.56, 105.45, and 15.77 have a zero percent chance to occur due to noise.
Table 3 also indicates the linear, quadratic, and interaction terms that are significant for the models concerning the studied phenolic molecules. The linear terms temperature (X1) showed significant effects in all three models for apigenin, caffeic acid and luteolin. Time (X2) did not show significant effect in any model (p > 0.05). Ratio of solvent to dry parsley (X3) showed significant effect only in the models of apigenin and luteolin (p < 0.05). Finally, the linear term of ethanol showed significant effect only in the model of caffeic acid (p < 0.05). Temperature, time, ratio of solvent to sample, and ethanol as solvent have been previously shown to be factors of interest when optimization of phenolic compound green extraction is studied [25,26].
Other than the linear source, quadratic terms indicated statistically significant effects on the extraction of the studied specific phenolic compounds. Quadratic term of temperature (X12) indicated statistically significant effects on the models of apigenin and luteolin (p < 0.05). Ratio of solvent to dry parsley (X32) indicated statistically significant effects on the model of caffeic acid (p < 0.05), and quadratic term of ethanol concentration (X42) indicated statistically significant effects on the models of apigenin and caffeic acid (p < 0.05).
Moreover, concerning the interaction coefficient that exert statistically significant effects on the models, the interaction of temperature and ethanol concentration (X1X4) showed a statistically significant effect on the model of apigenin and luteolin, the interaction of ratio of solvent to dry parsley with ethanol concentration showed a statistically significant effect on the model of apigenin (p < 0.05) while the interaction of temperature with ratio of solvent to dry parsley (X1X3) and that of time with ethanol concentration (X2X4) showed a statistically significant effect on the model of caffeic acid (p < 0.05).
The viscosity of the mixture of solvents and studied sample during extraction is affected by the solvent to sample ratio (LSr), which alters the effectiveness of ultrasound assisted extraction. This mixture has a high viscosity when LSr is low, which could prevent the cavitation effect because the negative pressure in the region of rarefaction needs to be greater than the strong cohesiveness between particles. In contrast, when the LSr is high, the medium’s decreased viscosity might boost cavitation, resulting in improved extraction up to a point at which a more significant cavitation may cause the extracted molecules to disintegrate [26,27].
Depending on the substance and the molecules extracted, variations in ethanol may alter solution polarity, which could be extremely important for extraction as it impacts phenolic solubility. On the other hand, high ethanol concentrations can result in pectin dehydration and protein denaturation, which prevent phenolics from diffusing through the matrix of plant material into the solution. Additionally, the right amount of water in the solution may cause the dry matter of plants to swell, expanding the contact surface between the solvent and the solute, thereby having a positive effect on the extraction [28].
To increase the mass transfer rate and cavitation effect, and to increase the solubility of phenolic compounds, solvent extraction is often carried out at relatively high temperatures, but high temperatures may also cause phenolic deterioration [26,27].
Increased temperature improves the extraction efficiency of phenolics because it increases their solubility and diffusivity, which in turn improves the mass transfer. However, heat may be able to lessen the severity of collapsing in cavitation bubbles by reducing the variations in vapor pressure between the interior and exterior of the bubbles. When the temperature of the extracted material is raised, the surface tension decreases, reducing the shear force of the popping bubbles [29].
Extracting at the lowest possible cost is largely dependent on how quickly the procedure can be completed [26]. Typically, better extraction efficiency may be seen during the first time periods owing to the steep gradient solvent slope, which gradually diminishes with time. In addition, short extraction times are achieved as a result of cavitation, thermal, and physical phenomena induced at the extracted material’s surface [29].
Lack of fit was also not significant (p > 0.05) for the models of apigenin, caffeic acid, and luteolin, implying that the models fit the data and each model may give accurate predictions.
Significant linear, quadratic, and interaction terms lead to the predictive equations (Equations (2)–(4)) as presented in Table 4. Positive and negative signs of its coefficient in its equation of the quadratic models indicate respectively positive or negative effects on the extraction efficiency of the studied phenolics.

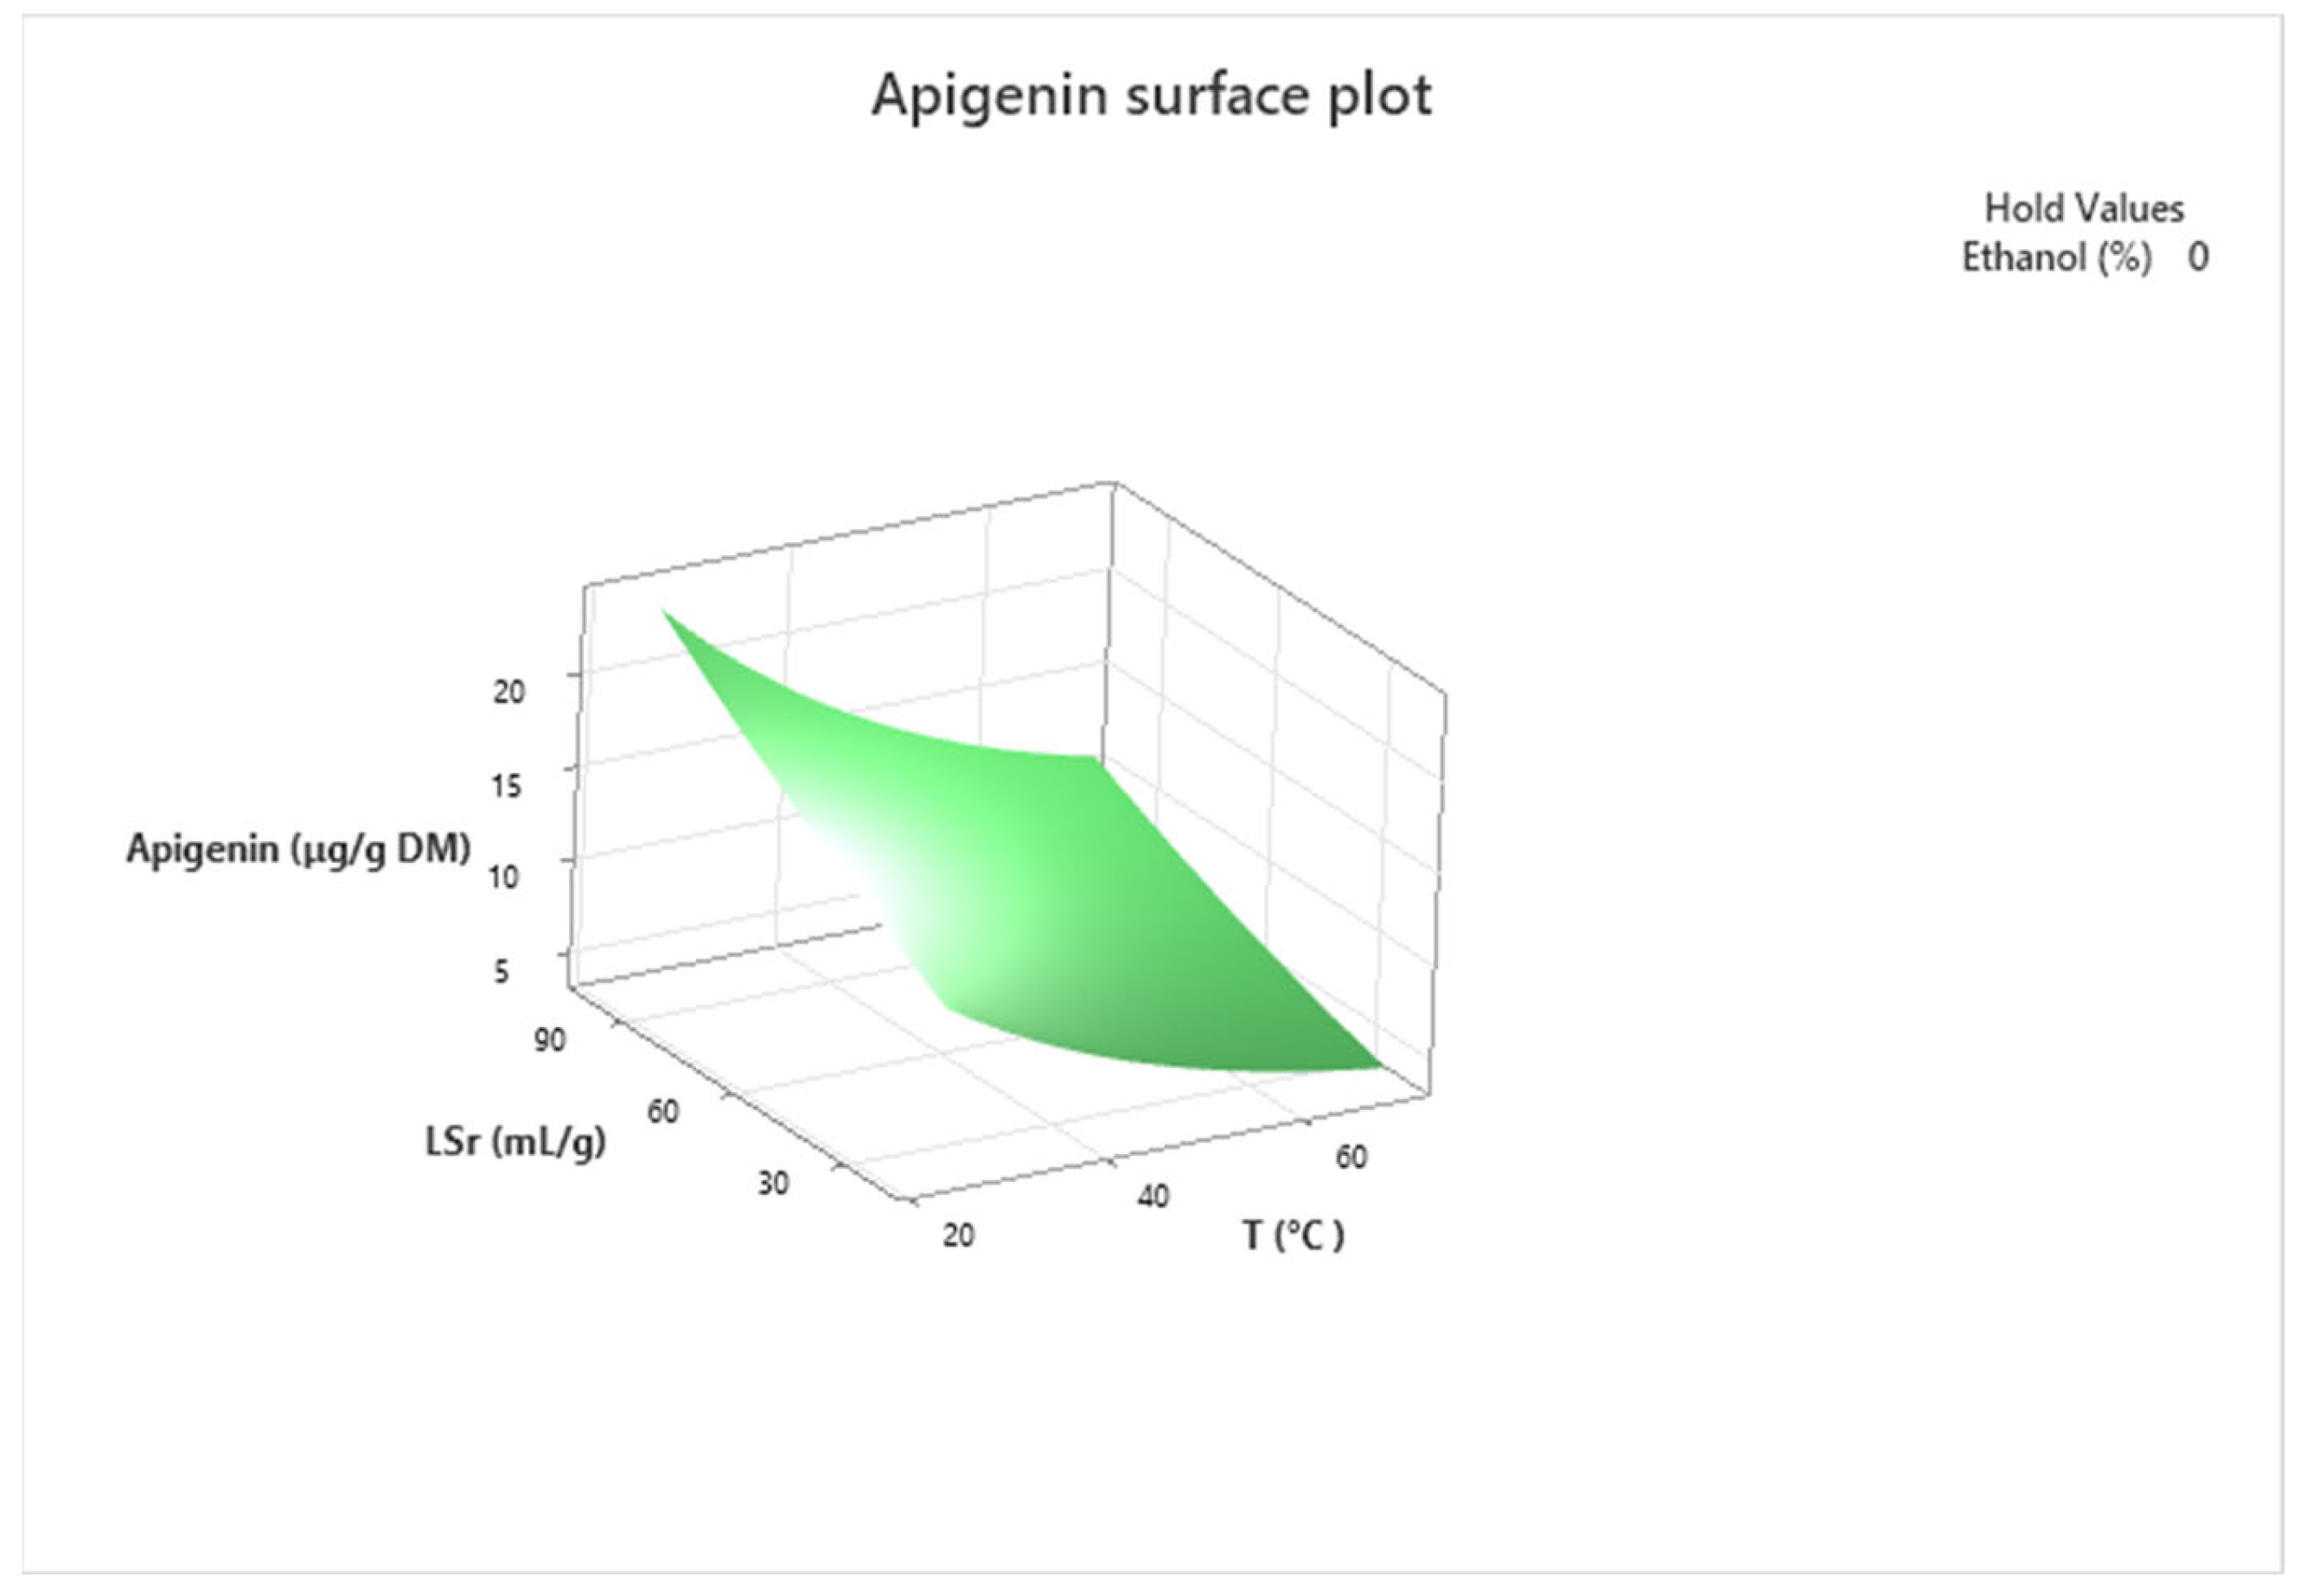
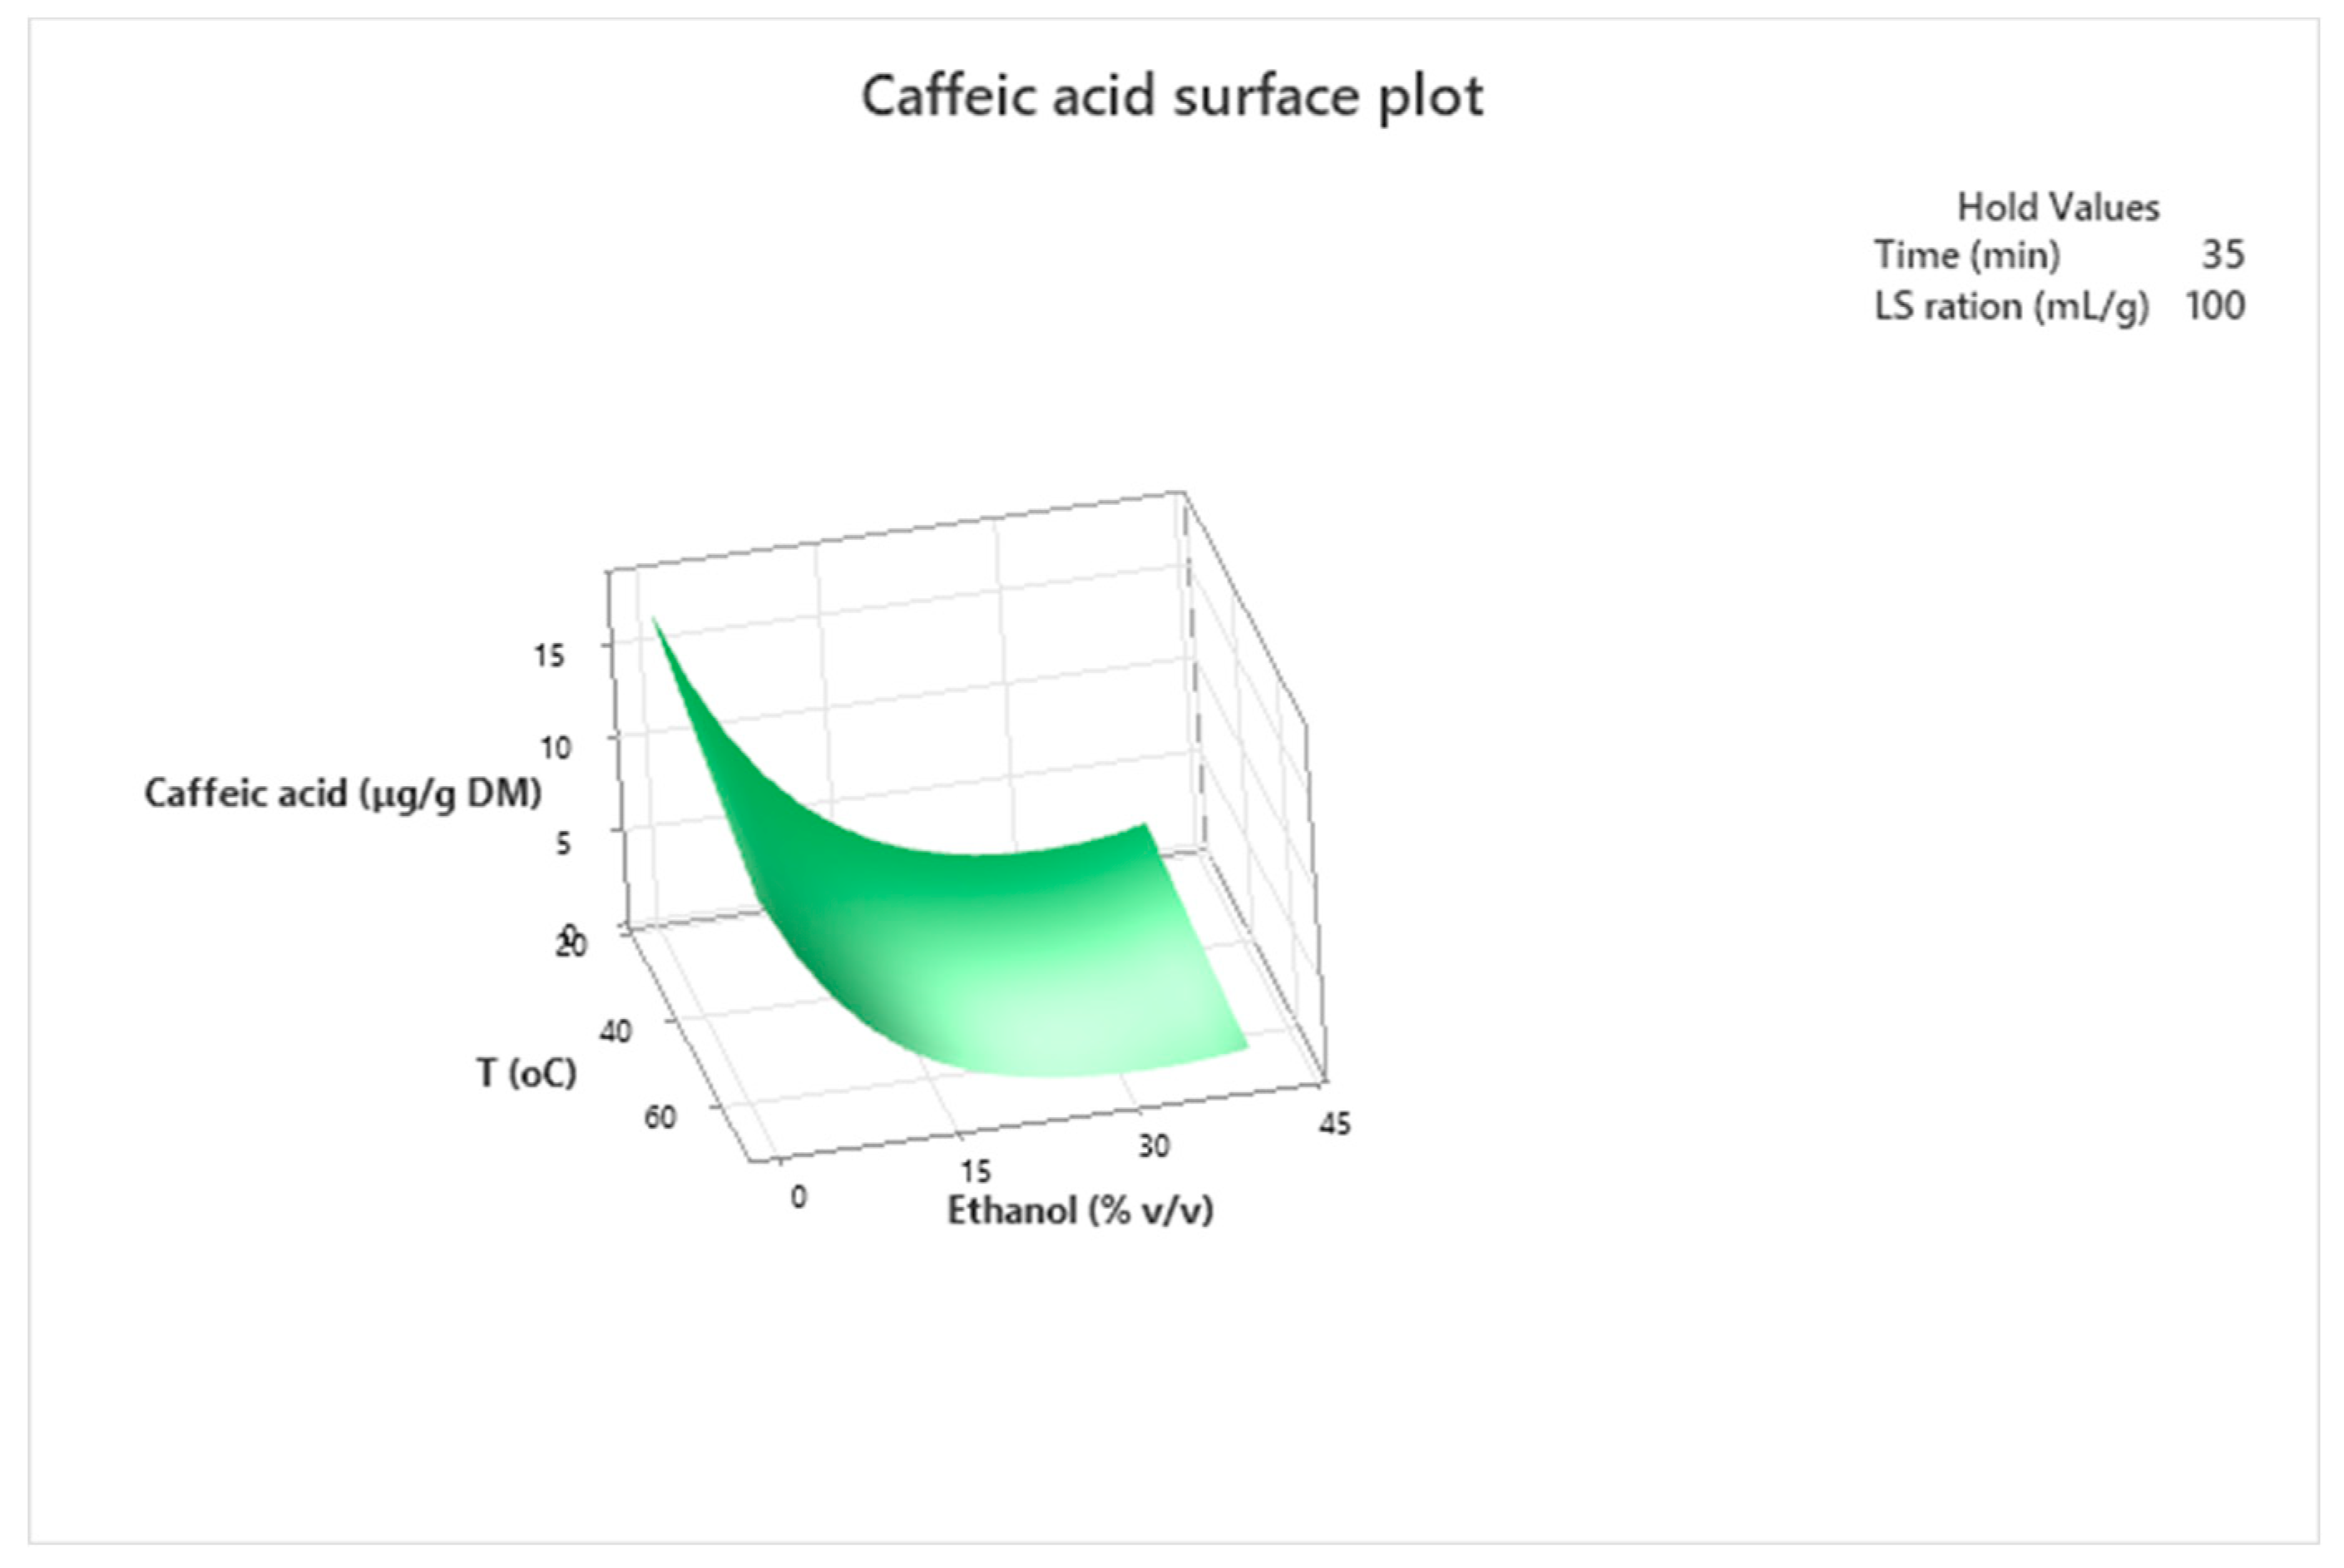
3.3. Optimization of the Extraction Conditions

Response surface methodology was employed to evaluate the combined effect of the four factors to maximize the extraction of the specific phenolic compounds under question, namely apigenin, caffeic acid, and luteolin. Figure 4, Figure 5 and Figure 6 present the three-dimensional response surface plots that describe the interactive effect of the independent factors on the quantity of each studied phenolic that was extracted by UAE for the two more significant factors in each case.
Response surface methodology holds an important role in the exploration of the optimum conditions of independent variables that can contribute in order to achieve a maximum response [30,31]. Response surface plots are useful for establishing the response values and operation conditions as required. They can also provide a method to visualize the results and help in processing the experimental levels of each variable and the types of interactions between them [32].
The 3D response surface plot in Figure 4 shows that extraction of apigenin is favored in high values of solvent to dry parsley ratio (LSr; X3) and low values of temperature (T; X1).
During the extraction of caffeic acid, as shown in Figure 5, high values of ratio of solvent to dry parley (LSr; X3) exert a positive effect while high values of temperature (T; X1) show a negative effect.
Through the 3D response surface plot, Figure 6 indicates that higher luteolin extractability is achieved with high values of ratio of solvent to dry parley (LSr; X3) and low values of temperature (T; X1).
Based on the experimental results of the luteolin, caffeic acid, and apigenin extracted amounts shown in Table 2, specific combination of the four factors lead to maximum extraction of the three studied phenolics. Temperature of 25 °C, time of 25 min, ethanol of zero concentration (% v/v) and solvent to dry parley ratio of 60 mL/g results in a maximum apigenin extraction of 21.0 μg/g DM. Temperature of 47.5 °C, time of 25 min, ethanol of zero concentration (% v/v), and solvent to dry parley ratio of 100 mL/g results in a maximum caffeic acid extraction of 16.1 μg/g DM. Finally, temperature of 70 °C, time of 25 min, ethanol of 20% (v/v) concentration and solvent to dry parley ratio of 100 mL/g results in a maximum luteolin extraction of 24.8 μg/g DM.
The optimal conditions were calculated with the response optimizer of the Minitab® statistical software and the results are presented in Table 5.

3.4. Verification of the Models

The validity of the predictive model was confirmed by comparing the predicted and the experimental values at optimal conditions. The values predicted by the model at optimal conditions were 24.54, 18.48, and 23.53 μg per g of dry parsley for luteolin, caffeic acid, and apigenin, respectively, and the actual experimental values were 23.92 ± 1.86, 19.10 ± 0.75 and 25.29 ± 1.82 μg/g dry parsley. No significant differences were found between the predicted and the actual values (p > 0.05), indicating a high accuracy of response optimization.
The desirability value may define the ideal solution’s degree of precision. The closer the desirability value is to 1, the greater the optimization precision. Therefore, the model validation and response values are not substantially different from the predictions under ideal circumstances [29].

3.5. Antioxidan Activity Evaluation and Total Phenolic Determination

The antioxidant activity evaluation by the DPPH, ABTS, FRAP, and CUPRAC assays and total phenolic content (TPC) of parsley optimized extracts are reported in Table 6.
There was no statistical difference between optimized extract for apigenin and luteolin on antioxidant activities and total phenolics. On the other hand, the optimized extract for caffeic acid exerted lower antioxidant activities based on DPPH and ABTS assays compared to the optimized extracts for apigenin and luteolin (p < 0.05). Since the results concern mixtures of different compounds, this effect may be explained by the different composition of each optimized extract in combination with different antioxidant mechanisms for each assay. This is in agreement with reports that refer to synergism between phenolic compounds during the conduct of antioxidant experiments [33].
Both ABTS and DPPH tests measure the ability of compounds to scavenge free radicals. Small differences between the DPPH and ABTS values of the optimized extract indicated that the phenolic compounds contributing to the free radical scavenging activity were compounds with comparable hydrophilicity, as the ABTS assay is applicable to both hydrophilic and lipophilic antioxidant systems, whereas the DPPH assay is only applicable to hydrophobic antioxidant systems [34].
The FRAP and CUPRAC tests assess the sample’s capacity to reduce using ferric and cupric ions, respectively. Non-statistically significant differences between the optimized extracts indicated that the chemicals contained in the optimized extracts may decrease ferric and cupric ions equally. In contrast, the lower DPPH and ABTS values (P0.05) for the optimized caffeic acid extract compared to those for luteolin and apigenin suggest that a fraction of the reductive chemicals in this extract had reduced radical-scavenging capabilities [35,36].
The results are promising since a higher amount of total phenolic compounds were extracted compared to studies that have been performed in the past. More specifically, the amounts reported were 9.63 ± 2.60 for aqueous solutions and 24.77 ± 1.2 mg GAE per g of dry parsley for methanolic extracts, but the amount of total phenolic compounds that were extracted with the optimized procedure ranged from 38.8 to 39.9 mg GAE per g of dry parsley. Other studies have reported 42.31 ± 0.50 mg GAE per g of dry parsley, but for dichloromethane extracts. Dichloromethane extracts cannot be used in food enrichment Prcedures without any sample pretreatment; this study’s results are considered satisfactory since they offer an advantage from the green extraction perspective that was employed [37,38].
Antioxidants are used in foods to delay or prevent the oxidation of molecules. Two types of antioxidants can be used, either natural or synthetic. Butylated hydroxyanisole (BHA) and butylated hydroxytoluene (BHT) are examples of synthetic antioxidants which have been prohibited because of their carcinogenicity. Thus, there is a growing interest in natural antioxidants, such as phenolic compounds, that can be used in food enrichment Prcedures. Thus, the development of natural antioxidants from plant matrices for nutritional purposes, along with the improvement of the nutritional profile of the products, is of great interest [39].
More specifically, in view of these results, an adequate quantity of phenolic compounds under evaluation were extracted from Petroselinum crispum, especially apigenin and luteolin, while using ultrasound-assisted extraction and green solvents (the ethanol/water mixture was selected as the extracting solution rather than other solvents because both ethanol and water are considered green solvents). The health benefits of apigenin and luteolin are well studied [40,41] and thus it would be of great interest to enrich foods with extracts that will contain an adequate quantity of these phenolics and further evaluate their properties. The use of human friendly solvents allows for these extracts to be used during food enrichment to upgrade their nutritional profile. However, there are several factors that must be considered before Prceeding to food enrichment with parsley extracts. One important parameter is the stability of the extracts and the evaluation of methodologies to improve the stability, such as the encapsulation of the compounds of interest in the extracts [42].

4. Conclusions

In this study, luteolin, caffeic acid, and apigenin were determined by HPLC-DAD and identified by UHPLC-Q-TOF-MS after UAE of a dry parsley sample. Then, a Box–Behnken design (BBD) was developed to optimize the extraction of these three phenolic compounds from Petroselinum crispum (parley) by applying Box–Cox transformation of the data and model reduction. Determination of luteolin, caffeic acid, and apigenin in each set of experimental conditions was performed by HPLC-DAD.
After data Box–Cox transformation and model reduction, the adequacy of the predictive model and the verification of the model were confirmed. Optimal conditions were calculated for each of the three phenolic compounds: 100 mL/g, 0% ethanol, 25 °C and 40 min for apigenin with predictive and actual values equal to 23.53 and 25.29 ± 1.82 and value for desirability equal to 1.000; 20 mL/g, 0% ethanol, 70 °C and 40 min for caffeic acid with predictive and actual values equal to 18.48 and 19.10 ± 0.75 and value for desirability equal to 1.000; and 100 mL/g, 40% ethanol, 70 °C and 40 min for luteolin with predictive and actual values equal to 24.54 and 23.92 ± 1.86 and value for desirability equal to 0.9822.
The three extracts acquired under the optimized conditions indicated for each compound of interest, namely caffeic acid, luteolin, and apigenin, presented similar behavior with respect to the total phenolic content and antioxidant activities based on FRAP and CUPRAC assays. Different composition of optimized extracts led to lower antioxidant activity of optimized extract for caffeic acid compared to those for luteolin and apigenin based on DPPH and ABTS assays. Satisfactory amounts of phenolic compounds (ranged from 38.8 to 39.9 mg GAE per g of dry parsley) were extracted and high antioxidant capacities (ranged from 13.2 to 687.8 nmol Trolox equivalent per g of dry parsley with respect to DPPH, ABTS, FRAP and CUPRAC assays) were obtained (Table 6).
The results of the study highlight the nutraceutical potential of the parsley extracts. Parsley is an aromatic herb with widespread cultivation, and a considerable amount is easily accessible for the creation of novel functional foods or the refinement of current traditional products with shown superiority in consumer health protection.

Author Contributions

Conceptualization, H.C.K.; methodology, H.C.K., A.M., A.S.K., N.S.T. and M.E.D.; software, H.C.K. and A.M.; validation, H.C.K. and A.M.; investigation, H.C.K., A.M. and A.S.K.; resources, H.C.K., N.S.T. and M.E.D.; data curation, H.C.K. and A.M.; writing—original draft preparation, A.M.; writing—review and editing, H.C.K.; supervision, H.C.K.; project administration, H.C.K.; funding acquisition, H.C.K. All authors have read and agreed to the published version of the manuscript.

Funding

This research was funded by EPAnEk-NRSF 2014–2020; Operational Program “Competitiveness, Entrepreneurship and Innovation, Call 111 “Support of Regional Excellence” in the context of the implementation of the program: AGRICA II: AGrifood Research and Innovation Network of ExCellence of the Aegean, which is co-financed by the European Regional Development Fund (ERDF), MIS code: 5046750, and the APC was funded by the special account for research grants (SARG) of the University of the Aegean.

Institutional Review Board Statement

Not applicable.

Informed Consent Statement

Not applicable.

Data Availability Statement

Not applicable.

Conflicts of Interest

The authors declare no conflict of interest. The funders had no role in the design of the study; in the collection, analyses, or interpretation of data; in the writing of the manuscript; or in the decision to publish the results.

References

  1. López, M.G.; Sánchez-Mendoza, I.R.; Choa-Alejo, N. Comparative Study of Volatile Components and Fatty Acids of Plants and in Vitro Cultures of Parsley (Petroselinum crispum (Mill) Nym Ex Hill). J. Agric. Food Chem. 1999, 47, 3292–3296. [Google Scholar] [CrossRef] [PubMed]
  2. de Oliveira, V.S.; Chávez, D.W.H.; Paiva, P.R.F.; Gamallo, O.D.; Castro, R.N.; Sawaya, A.C.H.F.; Sampaio, G.R.; Torres, E.A.F.D.S.; Saldanha, T. Parsley (Petroselinum crispum Mill.): A Source of Bioactive Compounds as a Domestic Strategy to Minimize Cholesterol Oxidation during the Thermal Preparation of Omelets. Food Res. Int. 2022, 156, 111199. [Google Scholar] [CrossRef] [PubMed]
  3. Dziki, D.; Hassoon, W.H.; Biernacka, B.; Gawlik-Dziki, U. Dried and Powdered Leaves of Parsley as a Functional Additive to Wheat Bread. Appl. Sci. 2022, 12, 7930. [Google Scholar] [CrossRef]
  4. Mouhoubi, K.; Boulekbache-Makhlouf, L.; Madani, K.; Palatzidi, A.; Perez-Jimenez, J.; Mateos-Aparicio, I.; Garcia-Alonso, A. Phenolic Compounds and Antioxidant Activity Are Differentially Affected by Drying Processes in Celery, Coriander and Parsley Leaves. Int. J. Food Sci. Technol. 2022, 57, 3467–3476. [Google Scholar] [CrossRef]
  5. Şener, G.; Karakadıoglu, G.; Ozbeyli, D.; Ede, S.; Yanardag, R.; Sacan, O.; Aykac, A. Petroselinum crispum Extract Ameliorates Scopolamine-Induced Cognitive Dysfunction: Role on Apoptosis, Inflammation and Oxidative Stress. Food Sci. Hum. Wellness 2022, 11, 1290–1298. [Google Scholar] [CrossRef]
  6. Petropoulos, S.A.; Fernandes, Â.; Finimundy, T.C.; Polyzos, N.; Pinela, J.; Ivanov, M.; Soković, M.; Ferreira, I.C.F.R.; Barros, L. The Bioactivities and Chemical Profile of Turnip-Rooted Parsley Germplasm. Horticulturae 2022, 8, 639. [Google Scholar] [CrossRef]
  7. Arsenov, D.; Župunski, M.; Pajević, S.; Nemeš, I.; Simin, N.; Alnuqaydan, A.M.; Watson, M.; Aloliqi, A.A.; Mimica-Dukić, N. Roots of Apium Graveolens and Petroselinum crispum—Insight into Phenolic Status against Toxicity Level of Trace Elements. Plants 2021, 10, 1785. [Google Scholar] [CrossRef]
  8. Ghasemzadeh, A.; Ghasemzadeh, N. Flavonoids and Phenolic Acids: Role and Biochemical Activity in Plants and Human. J. Med. Plant Res. 2011, 5, 6697–6703. [Google Scholar] [CrossRef]
  9. Ahmed, S.A.; Parama, D.; Daimari, E.; Girisa, S.; Banik, K.; Harsha, C.; Dutta, U.; Kunnumakkara, A.B. Rationalizing the Therapeutic Potential of Apigenin against Cancer. Life Sci. 2021, 267, 118814. [Google Scholar] [CrossRef]
  10. Głowacki, R.; Furmaniak, P.; Kubalczyk, P.; Borowczyk, K. Determination of Total Apigenin in Herbs by Micellar Electrokinetic Chromatography with UV Detection. J. Anal. Methods Chem. 2016, 2016, 3827832. [Google Scholar] [CrossRef]
  11. Salehi, B.; Venditti, A.; Sharifi-Rad, M.; Kręgiel, D.; Sharifi-Rad, J.; Durazzo, A.; Lucarini, M.; Santini, A.; Souto, E.B.; Novellino, E.; et al. The Therapeutic Potential of Apigenin. Int. J. Mol. Sci. 2019, 20, 1305. [Google Scholar] [CrossRef] [PubMed] [Green Version]
  12. Cizmarova, B.; Hubkova, B.; Bolerazska, B.; Marekova, M.; Birkova, A. Caffeic Acid: A Brief Overview of Its Presence, Metabolism, and Bioactivity. Bioact. Compd. Health Dis. 2020, 3, 74–81. [Google Scholar] [CrossRef]
  13. Lin, Y.; Shi, R.; Wang, X.; Shen, H.-M. Luteolin, a Flavonoid with Potential for Cancer Prevention and Therapy. Curr. Cancer Drug Targets 2008, 8, 634–646. [Google Scholar] [CrossRef] [PubMed]
  14. Luo, Y.; Shang, P.; Li, D. Luteolin: A Flavonoid That Has Multiple Cardio-Protective Effects and Its Molecular Mechanisms. Front. Pharmacol. 2017, 8, 692. [Google Scholar] [CrossRef] [Green Version]
  15. Gadi, D.; Bnouham, M.; Aziz, M.; Ziyyat, A.; Legssyer, A.; Legrand, C.; Lafeve, F.F.; Mekhfi, H. Parsley Extract Inhibits in Vitro and Ex Vivo Platelet Aggregation and Prolongs Bleeding Time in Rats. J. Ethnopharmacol. 2009, 125, 170–174. [Google Scholar] [CrossRef]
  16. Adsersen, A.; Gauguin, B.; Gudiksen, L.; Jäger, A.K. Screening of Plants Used in Danish Folk Medicine to Treat Memory Dysfunction for Acetylcholinesterase Inhibitory Activity. J. Ethnopharmacol. 2006, 104, 418–422. [Google Scholar] [CrossRef]
  17. Wen, C.; Zhang, J.; Zhang, H.; Dzah, C.S.; Zandile, M.; Duan, Y.; Ma, H.; Luo, X. Advances in Ultrasound Assisted Extraction of Bioactive Compounds from Cash Crops–A Review. Ultrason. Sonchem. 2018, 48, 538–549. [Google Scholar] [CrossRef]
  18. Alara, O.R.; Abdurahman, N.H.; Ukaegbu, C.I. Extraction of Phenolic Compounds: A Review. Curr. Res. Food Sci. 2021, 4, 200–214. [Google Scholar] [CrossRef]
  19. ICH Topic Q 2 (R1) Validation of Analytical Prcedures: Text and Methodology Step 5 Note for Guidance on Validation of Analytical Prcedures: Text and Methodology (CPMP/ICH/381/95) Approval by CPMP November 1994 Date for Coming into Operation. 1995. Available online: https://www.ema.europa.eu/en/documents/scientific-guideline/ich-q-2-r1-validation-analytical-prcedures-text-methodology-step-5_en.pdf (accessed on 4 December 2022).
  20. Miller, N.J.; Rice-Evans, C.; Davies, M.J.; Gopinathan, V.; Milner, A. A Novel Method for Measuring Antioxidant Capacity and Its Application to Monitoring the Antioxidant Status in Premature Neonates. Clin. Sci. 1993, 84, 407–412. [Google Scholar] [CrossRef] [Green Version]
  21. Brand-Williams, W.; Cuvelier, M.E.; Berset, C. Use of a Free Radical Method to Evaluate Antioxidant Activity. LWT-Food Sci. Technol. 1995, 28, 25–30. [Google Scholar] [CrossRef]
  22. Benzie, I.F.F.; Strain, J.J. The Ferric Reducing Ability of Plasma (FRAP) as a Measure of ‘Antioxidant Power’: The FRAP Assay. Anal. Bichem. 1996, 239, 70–76. [Google Scholar] [CrossRef] [PubMed] [Green Version]
  23. Özyürek, M.; Güçlü, K.; Apak, R. The Main and Modified CUPRAC Methods of Antioxidant Measurement. TrAC-Trends Anal. Chem. 2011, 30, 652–664. [Google Scholar] [CrossRef]
  24. Singleton, V.L.; Orthofer, R.; Lamuela-Raventós, R.M. Analysis of Total Phenols and Other Oxidation Substrates and Antioxidants by Means of Folin-Cicalteu Reagent; Academic Press: Cambridge, MA, USA, 1999; Volume 299. [Google Scholar]
  25. Vo, T.P.; Nguyen, L.N.H.; Le, N.P.T.; Mai, T.P.; Nguyen, D.Q. Optimization of the Ultrasonic-Assisted Extraction Prcess to Obtain Total Phenolic and Flavonoid Compounds from Watermelon (Citrullus lanatus) Rind. Curr. Res. Food Sci. 2022, 5, 2013–2021. [Google Scholar] [CrossRef] [PubMed]
  26. Rao, M.V.; Sengar, A.S.; Sunil, C.K.; Rawson, A. Ultrasonication-A Green Technology Extraction Technique for Spices: A Review. Trends Food Sci. Technol. 2021, 116, 975–991. [Google Scholar] [CrossRef]
  27. Kumar, K.; Srivastav, S.; Sharanagat, V.S. Ultrasound Assisted Extraction (UAE) of Bioactive Compounds from Fruit and Vegetable Processing by-Products: A Review. Ultrason. Sonchem. 2021, 70, 105325. [Google Scholar] [CrossRef] [PubMed]
  28. Muñiz-Márquez, D.B.; Martínez-Ávila, G.C.; Wong-Paz, J.E.; Belmares-Cerda, R.; Rodríguez-Herrera, R.; Aguilar, C.N. Ultrasound-Assisted Extraction of Phenolic Compounds from Laurus nobilis L. and Their Antioxidant Activity. Ultrason. Sonchem. 2013, 20, 1149–1154. [Google Scholar] [CrossRef]
  29. Mahindrakar, K.V.; Rathod, V.K. Ultrasonic Assisted Aqueous Extraction of Catechin and Gallic Acid from Syzygium Cumini Seed Kernel and Evaluation of Total Phenolic, Flavonoid Contents and Antioxidant Activity. Chem. Eng. Process.-Process Intensif. 2020, 149, 107841. [Google Scholar] [CrossRef]
  30. Zhang, L.-L.; Xu, M.; Wang, Y.-M.; Wu, D.-M.; Chen, J.-H. Optimizing Ultrasonic Ellagic Acid Extraction Conditions from Infructescence of Platycarya Strobilacea Using Response Surface Methodology. Molecules 2010, 15, 7923–7932. [Google Scholar] [CrossRef]
  31. Silva, E.M.; Rogez, H.; Larondelle, Y. Optimization of Extraction of Phenolics from Inga Edulis Leaves Using Response Surface Methodology. Sep. Purif. Technol. 2007, 55, 381–387. [Google Scholar] [CrossRef]
  32. Zhong, K.; Wang, Q. Optimization of Ultrasonic Extraction of Polysaccharides from Dried Longan Pulp Using Response Surface Methodology. Carbohydr. Polym. 2010, 80, 19–25. [Google Scholar] [CrossRef]
  33. Hugo, P.-C.; Gil-Chávez, J.; Sotelo-Mundo, R.R.; Namiesnik, J.; Gorinstein, S.; González-Aguilar, G.A. Antioxidant Interactions between Major Phenolic Compounds Found in ‘Ataulfo’ Mango Pulp: Chlorogenic, Gallic, Protcatechuic and Vanillic Acids. Molecules 2012, 17, 12657–12664. [Google Scholar] [CrossRef]
  34. Kim, D.-O.; Lee, K.W.; Lee, H.J.; Lee, C.Y. Vitamin C Equivalent Antioxidant Capacity (VCEAC) of Phenolic Phytchemicals. J. Agric. Food Chem. 2002, 50, 3713–3717. [Google Scholar] [CrossRef] [PubMed]
  35. Pulido, R.; Bravo, L.; Saura-Calixto, F. Antioxidant Activity of Dietary Polyphenols as Determined by a Modified Ferric Reducing/Antioxidant Power Assay. J. Agric. Food Chem. 2000, 48, 3396–3402. [Google Scholar] [CrossRef] [PubMed] [Green Version]
  36. Vasco, C.; Ruales, J.; Kamal-Eldin, A. Total Phenolic Compounds and Antioxidant Capacities of Major Fruits from Ecuador. Food Chem. 2008, 111, 816–823. [Google Scholar] [CrossRef]
  37. Liberal, Â.; Fernandes, Â.; Polyzos, N.; Petropoulos, S.A.; Dias, M.I.; Pinela, J.; Petrović, J.; Soković, M.; Ferreira, I.C.F.R.; Barros, L. Bioactive Properties and Phenolic Compound Profiles of Turnip-Rooted, Plain-Leafed and Curly-Leafed Parsley Cultivars. Molecules 2020, 25, 5606. [Google Scholar] [CrossRef]
  38. Tang, E.L.-H.; Rajarajeswaran, J.; Fung, S.; Kanthimathi, M.S. Petroselinum crispum Has Antioxidant Properties, Protects against DNA Damage and Inhibits Proliferation and Migration of Cancer Cells. J. Sci. Food Agric. 2015, 95, 2763–2771. [Google Scholar] [CrossRef] [Green Version]
  39. Shi, J.; Nawaz, H.; Pohorly, J.; Mittal, G.; Kakuda, Y.; Jiang, Y. Extraction of Polyphenolics from Plant Material for Functional Foods-Engineering and Technology. Food Rev. Int. 2005, 21, 139–166. [Google Scholar] [CrossRef]
  40. Ali, F.; Rahul; Naz, F.; Jyoti, S.; Siddique, Y.H. Health Functionality of Apigenin: A Review. Int. J. Food Prop. 2017, 20, 1197–1238. [Google Scholar] [CrossRef]
  41. Taheri, Y.; Sharifi-Rad, J.; Antika, G.; Yilmaz, Y.B.; Tumer, T.B.; Abuhamdah, S.; Chandra, S.; Saklani, S.; Kiliç, C.S.; Sestito, S.; et al. Paving Luteolin Therapeutic Potentialities and Agro-Food-Pharma Applications: Emphasis on in Vivo Pharmacological Effects and Bioavailability Traits. Oxid. Med. Cell. Longev. 2021, 2021, 1987588. [Google Scholar] [CrossRef] [PubMed]
  42. Vinceković, M.; Viskić, M.; Jurić, S.; Giacometti, J.; Bursać Kovačević, D.; Putnik, P.; Donsì, F.; Barba, F.J.; Režek Jambrak, A. Innovative Technologies for Encapsulation of Mediterranean Plants Extracts. Trends Food Sci. Technol. 2017, 69, 1–12. [Google Scholar] [CrossRef]
Figure 1. Representative chromatogram acquired for parsley sample extract at 340 nm.
Applsci 13 00798 g001
Figure 2. Representative chromatogram acquired for standard solution of caffeic acid, luteolin and apigenin at 340 nm.
Applsci 13 00798 g002
Figure 3. Mass spectrum of parsley extract samples at negative ionization were the precursor ion of apigenin—m/z 269 (a), caffeic acid—m/z 185 (b), and luteolin—m/z 285 (c) are obtained.
Applsci 13 00798 g003
Figure 4. 3D response surface plot of the apigenin (response variable) in μg/g of dry matter (DM) of parsley as a function of Temperature (X1) in Celsius degrees (°C) and ratio of solvent to dry parsley (LSr) in mL/g while holding ethanol at 0% (v/v).
Applsci 13 00798 g004
Figure 5. 3D response surface plot of the caffeic acid (response variable) in μg/g of dry matter (DM) of parsley as a function of Temperature (X1) in Celsius degrees (°C) and ethanol concentration in % v/v while holding time at 35 min and ratio of solvent to dry parsley (LSr) at 100.
Applsci 13 00798 g005
Figure 6. 3D response surface plot of luteolin (response variable) in μg/g of dry matter (DM) of parsley as a function of Temperature (X1) in Celsius degrees (°C) and ratio of solvent to dry parsley (LSr) in ml/g while holding ethanol at 0% (v/v).
Applsci 13 00798 g006
Table 1. Independent factors and their levels in the Box–Behnken Experimental Design.
Factor Levels and Range
FactorsCodes−101
Temperature (°C)X12547.570
Time (min)X2102540
1 LS ratio (mL/g)X32060100
Ethanol (%, v/v)X402040
1 LS ratio: Liquid of solvent to Solid of dried parsley sample ratio.
Table 2. Coded and actual values of BBD design, along with the experimental results of of quantification for luteolin, caffeic acid, and apigenin from parsley.
RunIndependent FactorsLuteolin (μg/g) 2Caffeic Acid (μg/g)Apigenin/(μg/g)
X1
Temperature (°C)
X2
Time (min)
X3
Ethanol (% v/v)
X4
1 LS Ratio
mL/g Parsley
147.5 (0)10 (−1)20 (0)2012.22.27.1
225 (−1)40 (+1)20 (0)6018.30.469.3
347.5 (0)25 (0)20 (0)608.80.925.5
447.5 (0)10 (−1)20 (0)2013.20.957.3
547.5 (0)40 (+1)0 (−1)6019.514.89.6
625 (−1)25 (0)20 (0)10021.23.410.8
747.5 (0)10 (−1)20 (0)10015.62.29.8
847.5 (0)40 (+1)20 (0)10021.71.910.1
970 (+1)25 (0)20 (0)2019.98.410.1
1047.5 (0)40 (+1)20 (0)10022.43.59.9
1147.5 (0)25 (0)20 (0)608.01.15.2
1270 (+1)10 (−1)20 (0)6021.33.89.8
1325 (−1)10 (−1)20 (0)6016.90.89.0
1447.5 (0)25 (0)0 (−1)2014.010.54.5
1547.5 (0)10 (−1)40 (+1)6019.82.310.1
1670 (+1)25 (0)20 (0)2019.37.910.2
1770 (+1)25 (0)20 (0)10024.81.612.0
1847.5 (0)40 (+1)0 (−1)6018.014.312.4
1970 (+1)25 (0)40 (+1)6021.11.710.5
2047.5 (0)25 (0)20 (0)607.81.05.1
2147.5 (0)25 (0)20 (0)608.01.15.1
2225 (−1)10 (−1)20 (0)6017.01.09.6
2347.5 (0)40 (+1)20 (0)2012.21.07.5
2447.5 (0)10 (−1)20 (0)2014.41.17.3
2547.5 (0)25 (0)0 (−1)10021.015.717.1
2647.5 (0)25 (0)40 (+1)2014.21.77.8
2770 (+1)25 (0)20 (0)2020.17.310.2
2847.5 (0)10 (−1)0 (−1)6019.310.98.9
2947.5 (0)25 (0)40 (+1)10022.42.413.4
3025 (−1)25 (0)40 (+1)6019.51.49.6
3147.5 (0)25 (0)20 (0)6018.61.27.6
3270 (+1)25 (0)0 (−1)6011.511.34.7
3347.5 (0)25 (0)40 (+1)2015.11.78.0
3470 (+1)25 (0)20 (0)10024.21.311.6
3547.5 (0)25 (0)0 (−1)10022.516.118.6
3670 (+1)25 (0)20 (0)10024.61.912.1
3747.5 (0)10 (−1)0 (−1)6019.310.611.2
3825 (−1)40 (+1)20 (0)6018.10.449.7
3925 (−1)25 (0)20 (0)2014.80.787.8
4025 (−1)25 (0)20 (0)2014.20.908.1
4147.5 (0)25 (0)0 (−1)2014.410.65.8
4247.5 (0)25 (0)40 (+1)10022.52.513.2
4347.5 (0)40 (+1)20 (0)2015.33.47.3
4425 (−1)25 (0)20 (0)10021.53.111.0
4570 (+1)25 (0)0 (−1)6011.414.14.1
4647.5 (0)25 (0)20 (0)6023.33.311.2
4770 (+1)40 (+1)20 (0)6022.52.410.5
4870 (+1)25 (0)40 (+1)6021.61.410.6
4925 (−1)25 (0)40 (+1)6019.51.59.5
5047.5 (0)10 (−1)40 (+1)6019.92.49.9
5170 (+1)40 (+1)20 (0)6020.61.710.1
5225 (−1)10 (−1)20 (0)6017.40.59.4
5347.5 (0)10 (−1)20 (0)10015.32.110.0
5425 (−1)25 (0)0 (−1)6019.69.218.6
5525 (−1)40 (+1)20 (0)6017.80.429.9
5647.5 (0)25 (0)0 (−1)10023.415.419.3
5770 (+1)10 (−1)20 (0)6021.12.510.0
5847.5 (0)25 (0)0 (−1)2014.710.05.9
5947.5 (0)40 (+1)20 (0)2016.31.48.5
6047.5 (0)10 (−1)40 (+1)6019.42.210.1
6170 (+1)10 (−1)20 (0)6021.02.410.0
6270 (+1)25 (0)0 (−1)6011.413.64.3
6347.5 (0)25 (0)20 (0)6020.43.310.3
6447.5 (0)10 (−1)20 (0)10015.32.110.0
6525 (−1)25 (0)0 (−1)6018.910.921.0
6647.5 (0)40 (+1)40 (+1)6019.32.09.7
6747.5 (0)40 (+1)40 (+1)6019.01.79.9
6847.5 (0)25 (0)20 (0)6019.81.28.3
6970 (+1)25 (0)40 (+1)6021.01.49.1
7047.5 (0)40 (+1)20 (0)10019.92.59.6
7125 (−1)25 (0)20 (0)2015.31.27.5
7247.5 (0)25 (0)20 (0)6017.62.68.5
7370 (+1)40 (+1)20 (0)6021.32.410.3
7425 (−1)25 (0)0 (−1)6019.110.320.1
7525 (−1)25 (0)40 (+1)6018.91.19.7
7647.5 (0)40 (+1)0 (−1)6020.616.013.1
7747.5 (0)40 (+1)40 (+1)6019.01.99.7
7847.5 (0)25 (0)40 (+1)10022.62.313.5
7925 (−1)25 (0)20 (0)10020.52.411.2
8047.5 (0)10 (−1)0 (−1)6019.211.211.8
8147.5 (0)25 (0)40 (+1)2014.91.27.3
1 LS ratio: Liquid of solvent to Solid of dried parsley sample ratio; 2: μg of lutein of caffeic acid or apigenin per g of dried parsley.
Table 3. Results of the analysis of the variance (ANOVA) for transformed data concerning the fitting of reduced response surface model for USE extraction of apigenin, caffeic acid, and luteolin.
1 Apigenin1 Caffeic Acid1 Luteolin
Source2 DFF-Valuep-ValueDFF-Valuep-ValueDFF-Valuep-Value
Model714.560.0008105.450.000515.770.000
Linear315.400.0004132.210.000321.540.000
T (°C) (X1)14.950.029137.980.00018.540.005
Time (min) (X2)---10.160.688---
LS ratio (mL/g) (X3)140.360.00012.130.148153.010.000
Ethanol (%) (X4)10.900.3451488.560.00013.060.084
Square26.010.0042130.700.00016.820.011
T (°C)*T (°C) (X12)14.410.039---16.820.011
LSr (mL/g)*LSr (mL/g) (X32)---112.290.001---
Ethanol (%)*Ethanol (%) (X42)19.760.0031261.310.000---
2-Way Interaction221.830.000226.700.00017.440.008
T (°C)*Ethanol (%) (X1X4)136.560.000---17.440.008
LSr (mL/g)*Ethanol (%) (X3X4)17.110.009----- -
T (°C)*LSr (mL/g) (X1X3)---149.010.000---
Time (min)*Ethanol (%) (X2X4)---14.390.040---
Error73 72 75
Lack-of-Fit671.030.550660.740.756690.450.947
Pure Error6 6 6
Total80 80 80
1: Box–Cox data transformation was performed using optimal λ = 0.38 for apigenin, λ = 0.43 for caffeic acid, and λ = 2.89 for luteolin. Reduction of the models was performed backward p > 0.05 for eliminating terms, while the term in the final step was added to produce a hierarchical model. 2: DF stands for Degree of freedom.
Table 4. Quadratic models of polynomial predictive equations of response surface for apigenin, caffeic acid, and luteolin UAE from parsley.
Phenolic1 Predictive Equations
Apigenin(2)Y λa = 3.21 − 0.04X1 + 0.01X3 − 0.04X4 + 0.0002 X12 + 0.0004X42 + 0.0008 X1X4 − 0.0002 X3X4
Caffeic acid(3)Yλca = 1.02 + 0.04 X1 + 0.01X2 + 0.01X3 − 0.11X4 + 0.0001 X32 + 0.0021 X42 − 0.0005 X1X3 − 0.0005 X2X4
Luteolin(4)(Y(λl−1))/(λl × g^l−1)) =
9.80 − 0.34 X1 + 0.08 X3 − 0.19 X4 + 0.0032 X12 + 0.0048 X2X4
1: Apigenin, caffeic acid, and luteolin are predicted in μg/g of dried parsley. λa = 0.38; λca = 0.43; λl = 2.89; g = 17.59 is the geometric mean of luteolin in μg/g DM. X1: Temperature (T) in °C; X2: Time in min, X3: ratio of solvent to dry parsley (LS ratio) in mL/g, X4: Ethanol concentration (%, v/v).
Table 5. Solution for maximum extraction of luteolin, caffeic acid, and apigenin from dried parsley sample.
1 Independent Factors Predicted ValuesExperimental ValuesDesirability
Luteolin (μg/gDM)24.54 a23.92 ± 1.86 a0.98223
Caffeic acid (μg/gDM)18.48 a19.10 ± 0.75 a1.0000
Apigenin (μg/gDM)23.53 a25.29 ± 1.82 a1.0000
1: Independent factors were set at 70 °C (X1), 100 mL/g DM (X3) and 40% (v/v) (X4) for luteolin; 70 °C (X1), 40 min (X2), 20 mL/g DM (X3) and 0% (v/v) (X4) for caffeic acid; 25 °C (X1), 100 mL/g DM (X3) and 0% (v/v) (X4) for apigenin. Same letters in rows denote values of no statistical difference.
Table 6. Antioxidant activities of parsley optimized extract.
1 Parameters Apigenin
Optimized Extract
Caffeic Acid
Optimized Extract
Luteolin
Optimized Extract
DPPH (nmol TE)638.5 ± 21.3 a510.5 ± 19.4 b638.3 ± 24.4 a
ABTS (nmol TE)687.7 ± 20.3 a550.4 ± 18.1 b687.8 ± 22.3 a
FRAP (nmol TE)114.4 ± 3.1 a115.4 ± 3.2 a118.8 ± 2.9 a
CUPRAC (nmol TE)13.2 ± 0.6 a13.3 ± 0.4 a14.5 ± 0.8 a
TPC (mg GAE)39.4 ± 0.8 a38.8 ± 0.5 a39.9 ± 0.7 a
1 DPPH, ABTS, FRAP, CUPRAC: Results are presented as nmol of Trolox equivalents (TE) per g of dry parsley; TPC: Total phenolic content presented as mg of gallic acid equivalents per g of dry parsley, different letters in rows denote values of statistically significant difference. Results are expressed as mean ± SD in final reported results between the 3 replicates of the optimized extracts acquired for apigenin, caffeic acid, and luteolin.
Disclaimer/Publisher’s Note: The statements, opinions and data contained in all publications are solely those of the individual author(s) and contributor(s) and not of MDPI and/or the editor(s). MDPI and/or the editor(s) disclaim responsibility for any injury to people or property resulting from any ideas, methods, instructions or products referred to in the content.

