Abstract
The purpose of this study was to optimize the effect of particle size, time and ultrasonic intensity on the extraction of phenolic compounds and energy efficiency. Sonication was performed with a VC750 Sonics processor at the following amplitudes: 30, 50 and 70%, which corresponds to the ultrasonic intensity, respectively: 1.6; 5.1 and 8.6 W∙cm−2. The frequency of ultrasound was 20 kHz. Extraction was carried out in a 5 s on–10 s off pulse system. The content of polyphenols and their antioxidant activity were assayed by the spectrophotometric method. Response surface methodology (RMS) was used to optimize the investigated variables. On the basis of the developed model, the highest polyphenols yield was obtained under the following extraction conditions (particle size 0.65 mm, extraction time 13.14 min, ultrasound intensity 6.92 W∙cm−2, which resulted in a maximum value of 15.24 mg GAE∙g−1 dry matter of hemp. Taking into account the lowest unit energy consumption, the best conditions were obtained for particle size of approx. 0.5 mm, extraction time 7.7 min, and ultrasound intensity 1.8 W∙cm−2, which resulted in a phenolic yield of 10.14 mg GAE∙g−1 dry matter of hemp. The best agreement between values of optimization variables within investigated criteria was obtained for the variable particle size. The developed models of pulsed ultrasound-assisted extraction can be used for obtaining polyphenols from Cannabis sativa L. at low unit energy consumption.
1. Introduction
The most often methods used for extracting biologically active compounds include Soxhlet extraction, maceration, carbon dioxide extraction, microwave-assisted extraction (MAE), pulsed electric field assisted extraction and pressurized solvent extraction [1,2,3]. Currently, techniques belonging to the so-called green chemistry, where electricity is saved and the consumption of solvents is reduced due to environmental protection are getting more and more popular [4,5,6]. One of them is ultrasound-assisted extraction (UAE) which uses ultrasonic vibrations and solvents to extract desirable substances from various plant matrices [7].
The ultrasonic field is applied, among others, to support the extraction of active sub-stances, e.g., flavonoids, anthocyanins, carotenoids, flavonols, polysaccharides, but also many other substances from plant matrices–both from whole plants and by-products [8,9,10,11,12]. For example, ultrasound is used to extract pectins from pomegranate peel [13] and jackfruit peel [14], polysaccharides from rambutan peel [15], pectin from grapefruit peel [16], polyphenols from pomegranate peel [17], antioxidants from baobab seeds [18], a bioactive compound from mulberry leaves [19], phenolic components and anthocyanins from grape seeds [20], biophenol from olive leaves [10] and carotenoids from tomato waste [21].
The extraction is carried out using an ultrasonic probe system or an ultrasonic bath. Due to the way the ultrasonic processor works, it can be distinguished between the continuous and pulsed modes [22,23,24,25].
Significant parameters determining the efficiency of ultrasound-assisted extraction are ultrasound intensity, frequency and operating mode of the ultrasonic generator. The duty cycle associated with the mode of operation is the ratio of the duration of the ultrasonic pulse to the total ultrasonic treatment time. The pulse duration is the time the ultrasonic transducer remains “on” while the pulse interval refers to the time that the ultrasonic transducer remains “off”. The sum of the pulse duration and the pulse interval is called cycle time.
A pulsed ultrasound field is used to obtain various bioactive compounds. Most often, literature reports concern the use of pulsed ultrasound-assisted extraction (PUAE) for the evaluation of the efficiency, activity and kinetics of antioxidant extraction from the dry peel of pomegranate [26], the yield of flavonoids, vitamin C and antioxidant activity of papaya pulp and peel extracts [27], efficiency of protein extraction from bitter melon seeds [28], efficiency of extraction of polyphenols from olive pomace [29], the extraction efficiency of phenolic compounds from carob pulp [30] and the extraction efficiency of the camptothecin from Nothapdytes nimmoniana plant [31].
Research by Pan et al. showed that the extraction assisted with the pulsed ultrasonic field saves about 50% of electricity compared to the use of the continuous field [26]. Similar conclusions from the research were obtained by Christou [30], indicating a slightly higher efficiency with the use of ultrasound in the pulsed mode. Studies by Patience [32] show lower energy consumption in the pulsed mode (80 kJ) compared to the 190 kJ in continuous mode while maintaining a similar extraction efficiency.
The effect of the ultrasonic field parameters on the power output in the process of extracting bioactive ingredients is not described in large numbers in the literature. Kobus et al. [33] assessed specific energy consumption in the extraction of bioactive compounds from hawthorn berries. The authors observed significantly higher specific energy consumption during the use of the continuous mode than the pulsed ultrasound mode. Pulsed ultrasound-assisted extraction reduced energy consumption from 20% to 51% while providing a higher process efficiency than continuous ultrasound-assisted extraction. The specific energy consumption during pulsed ultrasonic field-assisted extraction was about 40% to 68% of the unit energy consumption for the continuous operation. It means that during the process of extracting bioactive compounds from hawthorn berries, the use of pulsed ultrasound is more effective than continuous ultrasound. Another important parameter determining the energy intake during ultrasound-assisted extraction is the appropriate selection of the solvent [34].
Hemp (Cannabis sativa L.) is a valuable source of many bioactive substances. However, it is most often used to obtain CBD oils, while little interest is shown in relation to other bioactive substances. The literature on the extraction of polyphenolic compounds from cannabis is quite limited and there is definitely no research on the energy efficiency of this process.
The purpose of the study was to optimize the yield and unit energy consumption during the extraction of polyphenols from cannabis (Cannabis sativa L.).
2. Materials and Methods
2.1. Raw Material and Regents
The raw material was dried leaves and inflorescences of hemp supplied by an organic farm located in the Lublin region. After crushing and sieving, three fractions with an average particle size of 0.25, 0.75 and 1.25 mm were used for further research.
Gallic acid (98% pure) Folina-Ciocalteu reagent (FCR), sodium carbonate (powder, ≥99.5%), and methanol (anhydrous, 99.8%) were used for the analysis of polyphenols. For determining antioxidant activity 2,2-diphenyl-1-picreylhydrazyl (DPPH), 2,4,6-Tris(2-pyridyl)-s-triazine (TPTZ), Trolox, iron(III) chloride (anhydrous, powder, ≥99.99%), acetic acid and hydrochloric acid were used. All reagents used for analytical procedures were analytical grade and were obtained from Sigma-Aldrich–Merck (Taufkirchen, Germany).
2.2. Methods
The experiment was performed according to the presented scheme in Figure 1.
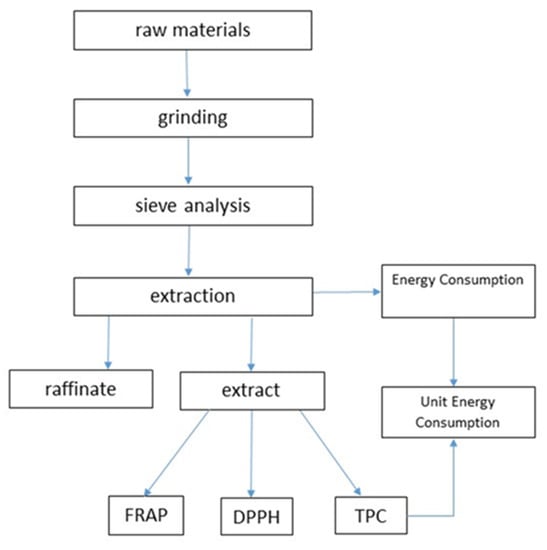
Figure 1.
Scheme of the performed research (FRAP—ferric reducing antioxidant power assay, DPPH—2,2′-diphenyl-1-picrylhydrazyl radical assay; TPC—the total polyphenols content).
2.2.1. Pulsed Ultrasound Assisted Extraction
One and a half of ground sample from each fraction was put into a conical flask and mixed with an aqueous solution of 60% ethyl alcohol. The flask was closed with a 25.4 mm (1 inch) diameter ultrasonic probe, which was then placed in the water bath to stabilize the temperature. The dried hemp was subjected to ultrasound. For this purpose, a VC750 Sonics processor working at a frequency of 20 kHz was used. The sonication was carried out at three ultrasonic intensities of 1.6; 5.1 and 8.6 W∙cm−2. The pulse duration was 5 s, and the pulse interval—10 s. The total extraction time was 15 min, 30 min, and 45 min, respectively, with the effective sonication operating times being 5, 10, and 15 min. The obtained extracts were collected for further chemical analysis and stored in a refrigerator (2 °C) [35].
2.2.2. The Total Polyphenols Content (TPC)
The total phenolic content was determined according to the methodology described by Kobus et al. [33] with a slight modification. Briefly, 0.2 mL of extract was mixed with 2 mL of Folin–Ciocalteu reagent in a 25 mL flask. After three minutes, 2 mL of sodium carbonate was added and made up to 25 mL with distilled water. After the next 30 min of incubation in the dark, the absorbance at 760 nm was measured. Results were expressed as mg gallic acid equivalent per 1 g of dry matter of hemp.
2.2.3. Determination of Antioxidant Activity (DPPH and FRAP)
The antioxidant activity of the tested solutions was determined using the DPPH and FRAP reagents. Briefly, 60 μL of extract and 5.8 mL of 6∙10−5 M DPPH were mixed in a 10 mL flask and after 30 min incubation in the dark the absorbance at 516 nm was measured. Similarly, 60 μL of extract and 5.8 mL of FRAP solution were mixed in a 10 mL flask and after 10 min incubation at 37 degrees, the absorbance at 593 nm was measured. In both cases, the obtained results were expressed as a Trolox equivalent in µg per g of dry matter [33,36,37,38].
2.2.4. Specific Energy
The unit energy inputs were determined as the ratio of the energy consumed by the ultrasonic generator to the total content of polyphenols in the obtained extracts:
where:
E—consumption of energy (kJ),
m—mass of total phenolic content (mg GAE·g−1).
The energy consumed by the ultrasonic generator was read from the wattmeter built into the device.
2.3. The Experimental Design
The experiment was designed on the basis of the three-factor Box-Behnken plan. Particle size (X1), processing time (X2) and ultrasonic intensity (X3) were taken as independent variables, and the total phenolic content (TPC), antioxidant activity (DPPH and FRAP) and unit energy consumption (UEC) were dependent variables. The experiment consisted of a total of 15 combinations, including 3 center points and was performed in randomized order. The levels of the three factors were the following: particle size (X1)—0.25 mm, 0.75 mm and 1.25 mm, extraction time (X2)—5 min, 10 min and 15 min, ultrasonic intensity (X3)—1.6, 5.1 and 8.6 [35].
2.4. Statistical Analysis
Statistical analysis was performed in Design Expert v.13. In the first stage, an analysis of variance (ANOVA) was performed. The models included only those coefficients that were statistically significant (p-values less than 0.05). Optimal extraction conditions were determined using Derringer’s prediction tool. The second-order polynomial model was used to explain the effect of independent variables on each response of interest, according to the following Equation (2):
where:
Y is the response variables (the total phenolic content, the DPPH assay, the FRAP assay and the unit energy consumption);
X1, X2, X3 the independent variables; β0 represents the constant; β1,2,3. Β11,22,33 and β12,13,23 are the linear, quadratic and interactive coefficients, respectively.
The maximum response values were determined for TPC, FRAP and DPPH, and the minimum response value for UEC. Then, four independent experiments were performed for each variable (TPC, FRAP, DPPH and UEC) using optimal extraction conditions. Verification of the developed models was made by comparing the experimental values with the values calculated on the basis of the models.
3. Results
3.1. Total Phenolic Content (TPC)
The studies conducted by the authors showed the content of polyphenols in inflorescences ranged from 6.69 to 15.29 mg GAE·g−1, depending on the experimental conditions (Figure 2). This is consistent with the values obtained by other authors. There are numerous reports in the literature concerning the content of polyphenols in hemps. However, they most often concern the content of these compounds in seeds, oil and flour [39,40,41,42,43]. The number of studies on the content of polyphenols in inflorescences is limited. Izzo’s research showed a significantly higher polyphenol content in inflorescences than in other parts of the plant. The total polyphenol content (TPC) in the inflorescences ranges from 26.2 to 33.2 mg GAE·g−1 (10.5–48.9 mg GAE·g−1) depending on the variety [44].
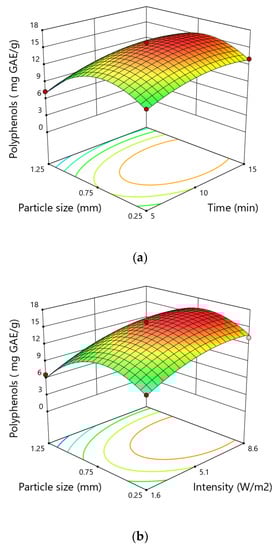
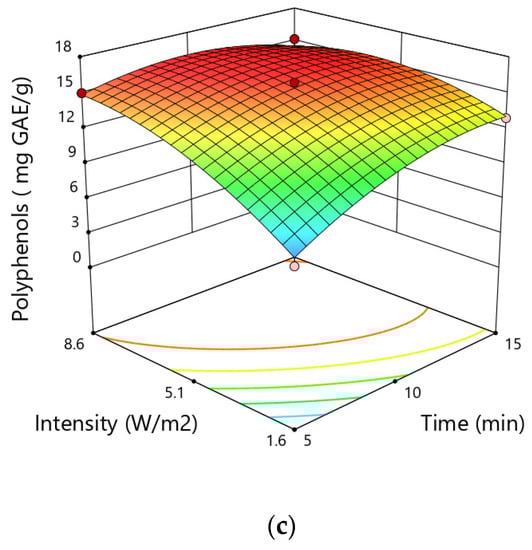
Figure 2.
Response surfaces for the total polyphenol content (mg GAE∙g−1) in hemp showing the effect of (a) particle size and time, (b) particle size and intensity, (c) intensity and time.
In the aerial parts of the cannabis studied by Drini’c [45], the TPC value ranged from 5.85 to 17.05 mg GAE·g−1d.w. depending on the solvent concentration (30–90%), and the maturity of the plant. The (50%) ethanol was recognized as the best solvent for the extraction of polyphenols from both young and mature cannabis samples. In the extracts obtained with 50% ethanol, the highest content of TPC was found for both young (17.05 mg GAE·g−1d.w.) and mature (9.25 mg GAE·g−1d.w.) plants. On the other hand, TPC in flowers alone ranges from 4.7 to 8.1 mg GAE·g−1 [46].
The results of ANOVA analysis showed that the linear and quadratic terms of particle size and time and intensity of ultrasonic treatment significantly affected the yield of total phenolic content. However, the quadratic terms of all variables had negative coefficients, which indicates the existence of a local extreme in the studied area. This extreme is very clearly visible in the case of particle size where the value of TPC initially increases with the increase of particle size and then decreases. Based on the values of the probabilities listed in Table 1, it can also be concluded that particle size was the variable that had the greatest impact on the extraction efficiency of polyphenols from hemp. The highest content of polyphenols of 15.89 mg GAE·g−1 was obtained during the extraction with the particles of 0.75 mm at a time of 10 min and ultrasound intensity of 5.1 W·cm−2, while the lowest value was noticed at 6.69 mg GAE∙g−1 for the particle size of 1.25 mm at time of 10 min and ultrasound intensity of 1.6 W·cm−2.

Table 1.
ANOVA results for response: the total phenolic content.
Based on the regression analysis, the model was adjusted to the experimental data, as shown in Equation (3):
Equation (3) was tested with an analysis of variance, and it supplied an excellent fit to the empirical data. p-values of the model less than 0.05 and p-value of lack of fit higher than 0.1 indicate that the model predicted data well to actual experimental response results. This was also confirmed by the high values of the determination coefficients R2 (0.9822) and the adjusted coefficient R2 (0.9643) and the low value of the coefficient of variation (5.32%). Adequate precision was found to be 20.6375, which testified to an acceptable proportion of signal-to-noise ratio because a value greater than 4 was required for model discrimination.
The model was also validated by residual analysis, as presented in Figure A1 (Appendix A). The result shows a good correlation between the experimental and predicted values of the response and that the errors are independent and normally distributed. This demonstrates that the selected model is appropriate and can be deployed for the optimization of total phenolic content.
3.2. DPPH
The antioxidant activity of the obtained extracts varied from 29.41 to 70.14 μM TE·g−1. Similar results were obtained by Izzo, who determined the antioxidant activity of different varieties of C. sativa cannabis inflorescences in the range from 27.532 to 77.578 μM TE·g−1 [44].
The result of ANOVA analysis showed that the linear and quadratic effects of particle size, time and intensity and the two-level interaction of time and intensity were significant terms. The variable particle size was the most significant factor associated with the response DPPH test. However, the quadratic term of this variable demonstrated a negative correlation resulting in decreasing in the antioxidant activity of the extract when the particle size overcome a certain value (Figure 3).
Figure 3.
Response surfaces for the DPPH test (µMTE∙g−1) showing the effect of (a) time and particle size, (b) size particle and intensity, (c) intensity and time.
The antioxidant activity increased as the particle size increased from 0.25 mm to 0.75 mm, and decreased as the particle size went up from 0.75 mm to 1.25 mm. The antioxidant activity measured by the DPPH test increased with the increase in the extraction time. A similar tendency was observed as regards the intensity of the applied ultrasounds, the antioxidant activity measured by the DPPH test increased with the increase of the ultrasound intensity during the extraction process.
The effect of particle size on the antioxidant properties of extracts was also observed by other authors [47,48,49,50]. Makanjuola [47] showed that the free radical scavenging activity of water extracts of tea and ginger increased as the particle size was reduced from 1.180 mm to 0.425 mm. The observations carried out by the same author also showed that the optimal particle size that maximizes the antioxidant activity of the extracts depends on the solvent used, as well as the type of test applied to assess the antioxidant properties (DPPH, ABTS, peroxide, iron) [47].
Particle size is one of the most significant factors influencing the efficiency and antioxidant properties during conventional extraction methods, including maceration, and percolation, as it affects the access of the solvent to the solutes, and, thus, the mass transfer kinetics. The rise in the degree of fragmentation leads to the expansion of the contact area of the solvent with the surface of the particle and increases the diffusivity of the solvent. On the other hand, excessive fragmentation causes small particles may remain on the surface of the solvent, which significantly reduces the number of active substances passing into the solvent, and, thus, the antioxidant capacity of the extracts too.
During ultrasound-assisted extraction, the optimal particle size may change due to the fact that ultrasonic exposure alone leads to a reduction in the size of particles. Research conducted by Jambrak [51] showed that ultrasound caused a decline in particle size, narrowed their distribution, and expanded the specific free surface in all whey protein samples. In addition, ultrasonic treatment cause erosion of plant structures which enhanced the accessibility of solvent to the solute contained in plant material [52] and produce a sonocapillary effect which increases solvent penetration of liquid into capillaries and pores of plant material [53]. All of these phenomena suggest that optimal ultrasonic extraction yields and, thus, the antioxidant activity can be obtained with slightly larger particle sizes than in the case of conventional extractions.
Based on the regression analysis, the model was fitted to the experimental data, as shown in the Equation (4):
The Equation (4) was verified with analysis of variance (ANOVA), as can be seen in Table 2.
Table 2.
ANOVA results for response: the DPPH test.
The p-value of the model is less than 0.05 which indicates that the coefficients in the model have a significant impact on the DPPH response. The p-value of the lack of fit is statistically insignificant (p > 0.2620), which was desirable for correct model verification. The determination coefficient and adjusted coefficient are close to 1, which is desirable. A low value of the coefficient of variation (5.08%) means that the derivation between the predicted and experimental values arise low. The value of the adequate precision was found to be 20.3907 and is much greater than 4, which confirms that the model can be useful for the prediction of the value of the DPPH test.
The model was also validated by residual analysis as presented in Figure A2 (Appendix A). The result shows a good correlation between the experimental and the predicted values of the response and that the residuals are symmetric about the origin and they have a high density close to the origin and a low density away from the origin. This indicates that the developed model is appropriate and can be applied for the optimization of the DPPH assay.
3.3. FRAP
The antioxidant activity of the extracts measured with the FRAP test was determined at the level from 29.57 to 107.76 μM TE·g−1. In the literature, only Teh and Birch [54] conducted studies to assess the antioxidant activity using the FRAP reagent, but only in relation to hemp seed cake.
The antioxidant activity increased as the particle size increased from 0.25 mm to 0.75 mm, and went down as the particle size increased from 0.75 mm to 1.25 mm. The antioxidant activity determined by the FRAP test increased with the rise of the extraction time. A similar tendency was observed as regards the intensity of the applied ultrasound, namely the antioxidant activity by means of the FRAP test increased with the increase of the intensity of the ultrasound during the extraction process (Figure 4).
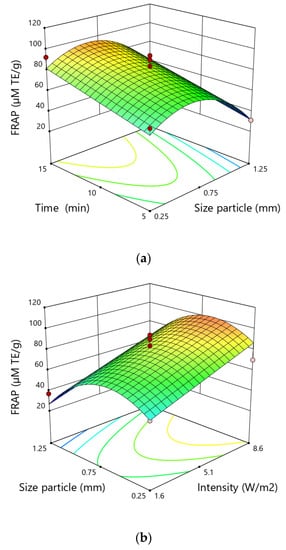
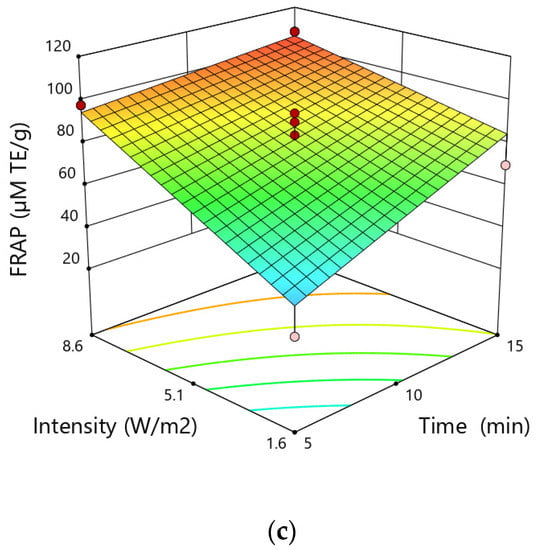
Figure 4.
Response surfaces for the FRAP test (µM TE∙g−1) in hemp extracts depending on the (a) time and size particle, (b) size particle and intensity, (c) intensity and time.
The highest antioxidant activity was obtained for particle size of 0.75 mm, extraction time of 15 min and ultrasound intensity of 8.6 W·cm−2, while the lowest value for particle size of 1.25 mm, time of 5 min and ultrasonic intensity of 8.6 W·cm−2.
The result of ANOVA analysis showed that the linear effects of particle size, time and intensity, the quadratic term of particle size and the two-level interaction of time and intensity were significant terms for the response FRAP test. However, similar to the case of the DPPH test the quadratic term of this variable demonstrated a negative correlation resulting in a decrease in antioxidant activity after overcoming a certain value.
Changes in antioxidant activity determined by the FRAP test can be explained analogously as in the case of the DPPH test. A larger contact surface of the solvent with a particle of plant material is conducive to better extraction of bioactive substances, and thus their higher antioxidant activity of the extracts. A statistically significant effect of particle size on the antioxidant activity determined by the FRAP test was also observed during the extraction of phenolic compounds and Celosia cristata seeds. The growth in particle size from 80 to 100 mesh caused a rise in the FRAP variable by 16.48% [50].
Based on the regression analysis, the equation was adjusted to the empirical data, as shown in Equation (5):
Equation (5) was verified with ANOVA, as was pointed in Table 3.
Table 3.
ANOVA results for response: FRAP test.
Equation (5) is statistically significant (p < 0.0011), and the lack of model fit is statistically insignificant (p > 0.1482), which indicates that the equation was verified correctly. The determination coefficient (0.8640) and adjusted coefficient (0.7885) are rather low and the CV value (17.02%) is quite high, which means that the differences between the empirical and estimated values are not enough satisfactory. On the other hand, the adequate precision was found to be 10.7189 and is greater than four which indicates that this model can be also used for predicting values of the FRAP test.
The model was also validated by residual analysis, as presented in Figure A3 (Appendix A). The result shows a good correlation between the experimental and predicted values of the response and that the errors are independent and normally distributed. This indicates that the developed model is appropriate and can be applied for the optimization of the FRAP test.
3.4. Unit Energy Consumption
The unit energy consumption during ultrasound assisted-extraction of polyphenols ranged from 0.38 to 2.63 kJ·mg−1 GAE·g−1 dry matter varying according to the experimental conditions (Figure 5). The highest unit energy consumption was obtained for a particle size of 0.75 mm, an extraction time of 15 min and an ultrasonic intensity of 8.6 W·cm−2, while the lowest value in the case of particle size of 0.75 mm, time of 5 min and an intensity ultrasound of 1.6 W·cm−2.
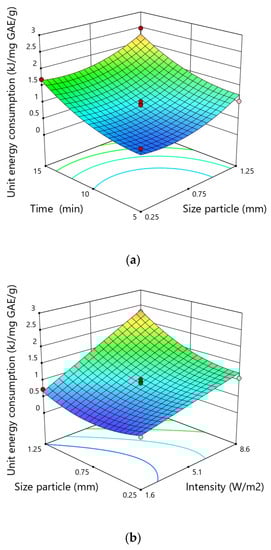
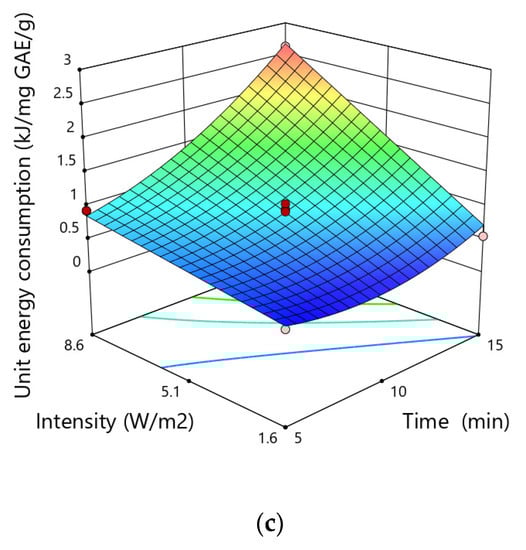
Figure 5.
Response surfaces for the unit energy consumption (kJ·mg−1 GAE·g−1) in hemp showing the effect of (a) time and size particle, (b)size particle and intensity, (c) intensity and time.
Given the p-values of each equation coefficients, it could be confirmed that three linear terms (X1, X2 and X3), two quadratic terms (X12, X22) and two interactive terms (X1X3 and X2X3) were significant and indicate the pattern of the interactions between the tested variables. However, the quadratic terms of particle size and time of extraction demonstrated positive correlations, showing that the rise in the magnitude of these variables could reduce the unit energy consumption to a certain value. The use of elevated particle size and time of extraction above the range studied may considerably increase the specific energy.
The particle size was the variable that most significantly influenced the unit energy consumption, possibly due to the increased access of the solvent to the soluble substances contained in the solid matrix. The higher level of disintegration provides better accessibility of the solvent to the internal structures of tissues. The impact of the degree of fragmentation of the raw material on the unit energy inputs was also observed in the case of obtaining other plant ingredients [55]. During the extraction of soluble substances from dried carrots, the highest energy inputs were found for the raw material fraction with a medium degree of comminution. The interaction between the degree of fragmentation and the extraction time and the intensity of ultrasound also played a significant role. In the case of low values of these variables, the influence of the fragmentation degree on the size of unit energy inputs was not observed, in the case of higher values, the influence of the fragmentation degree on unit energy inputs was significant.
In general, an increase in the extraction time and the intensity of ultrasound leads to an increase in the unit energy inputs per unit of active substance extracted. During the extraction of polyphenols from hawthorn berries, Kobus [33] observed that the unit energy inputs varied from 0.26 to 3.21 kJ·mg−1 GAE·g−1 dry matter, which is comparable with the results obtained in the present experiment. During the extraction of anthocyanins under the same conditions, the unit energy inputs varied in the range from 32.56 to 208.76 kJ·mg−1 Cy3-GE·g−1d.m. Carciochi [56] needed 0.246 kJ to obtain 1 mg caffeine while 2 kJ·mg−1 caffeine were reported by Koturevic [57]. Such large differences in the values of unit energy inputs are caused by the active substance content in the tested raw material. Additional factors affecting energy efficiency are liquid-solid ratio, kind of solvent, water-alcohol ratio and working mode of the ultrasonic processor.
The mechanism of an increase in unit energy inputs with an increase in the extraction time and ultrasound intensity was explained in the work of Kobus et al. [33]. The main reason for the increase in unit energy consumption is the depletion of the extracted substance with the extension of the extraction time.
Based on the regression analysis, the model was adjusted to the empirical data, as shown in Equation (6):
The Equation (6) was verified with analysis of variance (ANOVA), as can be seen in Table 4.
Table 4.
ANOVA results for response: unit energy consumption.
The developed model for the prediction of the results of unit energy consumption has been validated correctly because it has a small p-value (p < 0.0001), and an insignificant F-Lack of Fit value (p > 0.0912). The determination coefficient and adjusted coefficient are close to 1 and a high adequate precision value (˃4.0) indicates the existence of a significant correlation between the independent variables and the specific energy. The CV value (14,02%) means that the differences between the modeling and empirical values are enough satisfactory.
The equation was also validated by residual analysis, as presented in Figure A4 (Appendix A). The result shows a good correlation between the experimental and predicted values of the response and that the errors are independent and normally distributed. This indicates that the developed model is appropriate and can be used for the optimization of unit energy consumption.
3.5. Optimization of the Processing Parameters
Derringer’s prediction tool was applied to compute the maximum value of polyphenols, antioxidant activity by the DPPH test, antioxidant activity by the FRAP test, and minimum value of unit energy consumption. The optimal conditions for each response were listed in (Table 5).
Table 5.
Comparison between the empirical and estimated values of total phenolic content, DPPH, FRAP and unit energy consumption determined in the optimized conditions.
The predictive capacity of our models was computed as the relationship of the empirical values to the predicted values that were obtained at the optimal parameters for each response. In all cases, the experimental values of the total phenolic content, the antioxidant activity estimated by the DPPH and FRAP test and unit energy consumption were slightly lower than the predicted values from developed models. The best predictive capacity of the model was obtained for the polyphenols and the worst for the FRAP test. This may be due to the different number of coefficients included in individual models. For FRAP, a much larger number of parameters were removed from the model, which turned out to be statistically insignificant, and thus the coefficient of determination was much lower than in the case of the model for polyphenols However, for each of the response, the differences between experimental and predictive values are less than 10 percent, which can be considered a satisfactory result.
The analyzed process parameters (particle size of the raw material, processing time and ultrasound intensity) had a different effect on the improvement of the extraction efficiency for different optimization criteria (low energy consumption-high efficiency). The greatest convergence of extraction parameters for the analyzed criteria was observed in the case of the particle size, and the lowest in the case of the intensity of ultrasounds. Taking into account the extraction yield and the antioxidant activity of the obtained extracts, the optimal conditions for the process were as follows: particle size approx. 0.6 mm, extraction time 13 to 15 min, and the ultrasound intensity 7 to 8.6 W∙cm−2. The optimal conditions for unit energy consumption were as follows: particle size approx. 0.5 mm, extraction time 7.7 min and ultrasound intensity 1.8 W∙cm−2. Under these conditions, the amount of predicted total phenolic content was 10.14 mg GAE·g−1. which is 66.53% of the maximum yield. The value of unit energy consumption in optimal conditions for obtaining polyphenols was 1.61 kJ·mg−1 GAE·g−1 dry matter, which accounts for as much as 432% of the minimum energy consumption.
The obtained findings clearly show that after reaching the optimum for unit energy inputs, further increase of the extraction efficiency results in a very fast increase in energy consumption.
4. Conclusions
In this study, the influence of pulsed ultrasound-assisted extraction parameters on the yield of bioactive substances applying the response surface method was investigated. The Box–Behnken plan was successfully used to optimize the effects of process variables such as particle size, time, and ultrasonic intensity on the yield of the total polyphenolic content, their antioxidant activities and unit energy consumption. The statistical analysis pointed out that, the four developed models were accurate and well-fitted to empirical data The optimal conditions for the extraction of polyphenols from cannabis were found to be 0.65 mm for particle size, 13.14 min for extraction time and 6.92 for ultrasound intensity, which resulted in the maximum value of 15.24 mg GAE·g−1. Taking into account the antioxidant activity of the extracts the optimal conditions were found in the range particle size of about 0.6 mm; extraction time, 12.30–15 min; and ultrasound intensity, 8–8.60 W∙cm−2. These parameters were close to the optimal parameters of polyphenol extraction. By optimizing the process in terms of unit energy consumption, the best conditions were obtained in the range of the particle size of approx. 0.5 mm, the extraction time of 7.7 min and the intensity of ultrasounds of 1.8 W∙cm−2. The best agreement between numerical values of optimization variables under contrary demands (low energy consumption-high efficiency) was obtained for the size of the raw material particles, and the lowest for the intensity of ultrasound. Under the optimum conditions for unit energy consumption, the amount of predicted total phenolic was 10.14 mg GAE·g−1. Under the optimum conditions for a yield of polyphenols, the amount of predicted unit energy consumption was 1.61 kJ·mg−1 GAE·g−1 dry matter. The developed models of pulsed ultrasound-assisted extraction proved to be efficient for obtaining polyphones from Cannabis sativa L. at low unit energy consumption.
Author Contributions
Conceptualization, Z.K.; methodology, Z.K.; software, J.K.; validation, P.F. and S.K., formal analysis, Z.K.; investigation, A.P., A.B. and Z.K.; resources, J.K.; writing—original draft preparation, Z.K., A.P. and A.B.; writing—review and editing, Z.K., A.P. and A.B.; visualization, J.K.; supervision, Z.K.; project administration, J.K.; funding acquisition, P.F. and S.K. All authors have read and agreed to the published version of the manuscript.
Funding
This research received no external funding.
Institutional Review Board Statement
Not applicable.
Informed Consent Statement
Not applicable.
Data Availability Statement
Not applicable.
Conflicts of Interest
The authors declare no conflict of interest.
Appendix A. Residual Analysis
The results of the residual analysis for studied responses were showed in Figure A1, Figure A2, Figure A3 and Figure A4.


Figure A1.
The comparison between the experimental and the predicted data and the residual analysis for the optimization of total phenolic content.

Figure A2.
The comparison between the experimental and the predicted data and the residual analysis for the optimization of DPPH assay.

Figure A3.
The comparison between the experimental and the predicted data and the residual analysis for the optimization of FRAP test.


Figure A4.
The comparison between the experimental and the predicted data and the residual analysis for the optimization of unit energy consumption.
References
- Zhang, Q.W.; Lin, L.G.; Ye, W.C. Techniques for extraction and isolation of natural products: A comprehensive review. Chin. Med. 2018, 13, 20. [Google Scholar] [CrossRef] [PubMed]
- Rocchetti, G.; Blasi, F.; Montesano, D.; Ghisoni, S.; Marcotullio, M.C.; Sabatini, S.; Cossignani, L.; Lucini, L. Impact of conventional/non-conventional extraction methods on the untargeted phenolic profile of Moringa oleifera leaves. Food Res. Int. 2019, 115, 319–327. [Google Scholar] [CrossRef] [PubMed]
- Rodríguez-Pérez, C.; Gilbert-López, B.; Mendiola, J.A.; Quirantes-Piné, R.; Segura-Carretero, A.; Ibáñez, E. Optimization of microwave-assisted extraction and pressurized liquid extraction of phenolic compounds fromMoringa oleiferaleaves by multiresponse surface methodology. Electrophoresis 2016, 37, 1938–1946. [Google Scholar] [CrossRef]
- Turrini, F.; Donno, D.; Beccaro, G.L.; Zunin, P.; Pittaluga, A.; Boggia, R. Pulsed Ultrasound-Assisted Extraction as an Alternative Method to Conventional Maceration for the Extraction of the Polyphenolic Fraction of Ribes nigrum Buds: A New Category of Food Supplements Proposed by The FINNOVER Project. Foods 2019, 8, 466. [Google Scholar] [CrossRef] [PubMed]
- Chemat, F.; Rombaut, N.; Meullemiestre, A.; Turk, M.; Perino, S.; Fabiano-Tixier, A.-S.; Abert-Vian, M. Review of Green Food Processing techniques. Preservation, transformation, and extraction. Innov. Food Sci. Emerg. Technol. 2017, 41, 357–377. [Google Scholar] [CrossRef]
- United States Environmental Protection Agency. Green Chemistry’s 12 Principles. Available online: https://www.epa.gov/greenchemistry/basics-green-chemistry#twelve (accessed on 26 July 2019).
- De Oliveira, C.F.; Giordani, D.; Lutckemier, R.; Gurak, P.D.; Cladera-Olivera, F.; Marczak, L.D.F. Extraction of pectin from passion fruit peel assisted by ultrasound. Lwt Food Sci. Technol. 2016, 71, 110–115. [Google Scholar] [CrossRef]
- Kumar, K.; Srivastav, S.; Sharanagat, V.S. Ultrasound assisted extraction (UAE) of bioactive compounds from fruit and vegetable processing by-products: A review. Ultrason. Sonochem. 2021, 70, 105325. [Google Scholar] [CrossRef]
- Patra, A.; Abdullah, S.; Pradhan, R.C. Review on the extraction of bioactive compounds and characterization of fruit industry by-products. Bioresour. Bioprocess. 2022, 9, 14. [Google Scholar] [CrossRef]
- Japón-Luján, R.; Luque-Rodríguez, J.; de Castro, M.L. Dynamic ultrasound-assisted extraction of oleuropein and related biophenols from olive leaves. J. Chromatogr. A 2006, 1108, 76–82. [Google Scholar] [CrossRef]
- Ramić, M.; Vidović, S.; Zeković, Z.; Vladić, J.; Cvejin, A.; Pavlić, B. Modeling and optimization of ultrasound-assisted extraction of polyphenolic compounds from Aronia melanocarpa by-products from filter-tea factory. Ultrason. Sonochem. 2015, 23, 360–368. [Google Scholar] [CrossRef]
- Mehta, N.; Kumar, P.; Verma, A.K.; Umaraw, P.; Khatkar, S.K.; Khatkar, A.B.; Pathak, D.; Kaka, U.; Sazili, A.Q. Ultrasound-Assisted Extraction and the Encapsulation of Bioactive Components for Food Applications. Foods 2022, 11, 2973. [Google Scholar] [CrossRef]
- Moorthy, I.G.; Maran, J.P.; Muneeswari, S.; Naganyashree, S.; Shivamathi, C.S. Response surface optimization of ultrasound assisted extraction of pectin from pomegranate peel. Int. J. Biol. Macromol. 2015, 72, 1323–1328. [Google Scholar] [CrossRef] [PubMed]
- Moorthy, I.G.; Maran, J.P.; Ilakya, S.; Anitha, S.L.; Sabarima, S.P.; Priya, B. Ultrasound assisted extraction of pectin from waste Artocarpus heterophyllus fruit peel. Ultrason. Sonochem. 2017, 34, 525–530. [Google Scholar] [CrossRef] [PubMed]
- Maran, J.P.; Priya, B. Ultrasound-assisted extraction of polysaccharide from Nephelium lappaceum L. fruit peel. Int. J. Biol. Macromol. 2014, 70, 530–536. [Google Scholar] [CrossRef]
- Xu, Y.; Zhang, L.; Bailina, Y.; Ge, Z.; Ding, T.; Ye, X.; Liu, D. Effects of ultrasound and/or heating on the extraction of pectin from grapefruit peel. J. Food Eng. 2014, 126, 72–81. [Google Scholar] [CrossRef]
- Kazemi, M.; Karim, R.; Mirhosseini, H.; Hamid, A.A. Optimization of pulsed ultrasound-assisted technique for extraction of phenolics from pomegranate peel of Malas variety: Punicalagin and hydroxybenzoic acids. Food Chem. 2016, 206, 156–166. [Google Scholar] [CrossRef] [PubMed]
- Ismail, B.B.; Guo, M.; Pu, Y.; Wang, W.; Ye, X.; Liu, D. Valorisation of baobab (Adansonia digitata) seeds by ultrasound assisted extraction of polyphenolics. Optimisation and comparison with conventional methods. Ultrason. Sonochem. 2018, 52, 257–267. [Google Scholar] [CrossRef]
- Insang, S.; Kijpatanasilp, I.; Jafari, S.; Assatarakul, K. Ultrasound-assisted extraction of functional compound from mulberry (Morus alba L.) leaf using response surface methodology and effect of microencapsulation by spray drying on quality of optimized extract. Ultrason. Sonochem. 2022, 82, 105806. [Google Scholar] [CrossRef]
- Ghafoor, K.; Choi, Y.H.; Jeon, J.Y.; Jo, I.H. Optimization of Ultrasound-Assisted Extraction of Phenolic Compounds, Antioxidants, and Anthocyanins from Grape (Vitis vinifera) Seeds. J. Agric. Food Chem. 2009, 57, 4988–4994. [Google Scholar] [CrossRef]
- Luengo, E.; Condón-Abanto, S.; Condón, S.; Álvarez, I.; Raso, J. Improving the extraction of carotenoids from tomato waste by application of ultrasound under pressure. Sep. Purif. Technol. 2014, 136, 130–136. [Google Scholar] [CrossRef]
- Lin, X.; Wu, L.; Wang, X.; Yao, L.; Wang, L. Ultrasonic-assisted extraction for flavonoid compounds content and antioxidant activities of India Moringa oleifera L. leaves: Simultaneous optimization, HPLC characterization and comparison with other methods. J. Appl. Res. Med. Aromat. Plants 2021, 20, 100284. [Google Scholar] [CrossRef]
- Jaeschke, D.P.; Rech, R.; Marczak, L.D.F.; Mercali, G.D. Ultrasound as an alternative technology to extract carotenoids and lipids from Heterochlorella luteoviridis. Bioresour. Technol. 2017, 224, 753–757. [Google Scholar] [CrossRef]
- Del Hierro, J.N.; Herrera, T.; García-Risco, M.R.; Fornari, T.; Reglero, G.; Martin, D.; del Hierro, J.N.; Herrera, T.; García-Risco, M.R.; Fornari, T.; et al. Ultrasound-assisted extraction and bioaccessibility of saponins from edible seeds: Quinoa, lentil, fenugreek, soybean and lupin. Food Res. Int. 2018, 109, 440–447. [Google Scholar] [CrossRef] [PubMed]
- Kobus, Z. Dry matter extraction from valerian roots (Valeriana officinalis L.) with the help of pulsed acoustic field. Int. Agrophys. 2008, 22, 133–137. [Google Scholar]
- Pan, Z.; Qu, W.; Ma, H.; Atungulu, G.G.; McHugh, T.H. Continuous and pulsed ultrasound-assisted extractions of antioxidants from pomegranate peel. Ultrason. Sonochem. 2012, 19, 365–372. [Google Scholar] [CrossRef] [PubMed]
- Wani, K.M.; Uppaluri, R.V. Pulsed ultrasound-assisted extraction of bioactive compounds from papaya pulp and papaya peel using response surface methodology: Optimization and comparison with hot water extraction. Appl. Food Res. 2022, 2, 100178. [Google Scholar] [CrossRef]
- Naik, M.; Natarajan, V.; Modupalli, N.; Thangaraj, S.; Rawson, A. Pulsed ultrasound assisted extraction of protein from defatted Bitter melon seeds (Momardica charantia L.) meal: Kinetics and quality measurements. Lwt 2022, 155, 112997. [Google Scholar] [CrossRef]
- Albahari, P.; Jug, M.; Radić, K.; Jurmanović, S.; Brnčić, M.; Brnčić, S.R.; Čepo, D.V. Characterization of olive pomace extract obtained by cyclodextrin-enhanced pulsed ultrasound assisted extraction. Lwt 2018, 92, 22–31. [Google Scholar] [CrossRef]
- Christou, A.; Stavrou, I.J.; Kapnissi-Christodoulou, C.P. Continuous and pulsed ultrasound-assisted extraction of carob’s antioxidants: Processing parameters optimization and identification of polyphenolic composition. Ultrason. Sonochem. 2021, 76, 105630. [Google Scholar] [CrossRef]
- Patil, D.M.; Akamanchi, K.G. Ultrasound-assisted rapid extraction and kinetic modelling of influential factors: Extraction of camptothecin from Nothapodytes nimmoniana plant. Ultrason. Sonochem. 2017, 37, 582–591. [Google Scholar] [CrossRef]
- Patience, N.A.; Schieppati, D.; Boffito, D.C. Continuous and pulsed ultrasound pectin extraction from navel orange peels. Ultrason. Sonochem. 2021, 73, 105480. [Google Scholar] [CrossRef] [PubMed]
- Kobus, Z.; Krzywicka, M.; Pecyna, A.; Buczaj, A. Process Efficiency and Energy Consumption during the Ultrasound-Assisted Extraction of Bioactive Substances from Hawthorn Berries. Energies 2021, 14, 7638. [Google Scholar] [CrossRef]
- Kobus, Z.; Wilczynski, K.; Nadulski, R.; Rydzak, L.; Guz, T. Effect of Solvent Polarity on the Efficiency of Ultrasound-assisted Extraction of Polyphenols from Apple Pomace. In Proceedings of the IX International Scientific Symposium Farm Machinery and Processes Management in Sustainable Agriculture, Lublin, Poland, 20–22 November 2017. [Google Scholar]
- Kobus, Z.; Pecyna, A.; Buczaj, A.; Krzywicka, M.; Przywara, A.; Nadulski, R. Optimization of the Ultrasound-Assisted Extraction of Bioactive Compounds from Cannabis sativa L. Leaves and Inflorescences Using Response Surface Methodology. Appl. Sci. 2022, 12, 6747. [Google Scholar] [CrossRef]
- Kobus, Z.; Krzywicka, M.; Starek-Wójcicka, A.; Sagan, A. Effect of the duty cycle of the ultrasonic processor on the efficiency of extraction of phenolic compounds from Sorbus intermedia. Sci. Rep. 2022, 12, 8311. [Google Scholar] [CrossRef] [PubMed]
- Bibi Sadeer, N.; Montesano, D.; Albrizio, S.; Zengin, G.; Mahomoodally, M.F. The Versatility of Antioxidant Assays in Food Science and Safety—Chemistry, Applications, Strengths, and Limitations. Antioxidants 2020, 9, 709. [Google Scholar] [CrossRef]
- Benzie, I.F.F.; Strain, J.J. The ferric reducing ability of plasma (FRAP) as a measure of “antioxidant power”: The FRAP assay. Anal. Biochem. 1996, 239, 70–76. [Google Scholar] [CrossRef] [PubMed]
- Frassinetti, S.; Moccia, E.; Caltavuturo, L.; Gabriele, M.; Longo, V.; Bellani, L.; Giorgi, G.; Giorgetti, L. Nutraceutical potential of hemp (Cannabis sativa L.) seeds and sprouts. Food Chem. 2018, 262, 56–66. [Google Scholar] [CrossRef]
- Mkpenie, V.; Essien, E.; Udoh, I. Effect of extraction conditions on total polyphenol contents, antioxidant and antimicrobial activities of Cannabis sativa L. Electron. J. Environ. Agric. Food Chem. 2012, 11, 300–307. Available online: https://www.researchgate.net/publication/260824507 (accessed on 7 November 2022).
- Siano, F.; Moccia, S.; Picariello, G.; Russo, G.L.; Sorrentino, G.; Di Stasio, M.; La Cara, F.; Volpe, M.G. Comparative Study of Chemical, Biochemical Characteristic and ATR-FTIR Analysis of Seeds, Oil and Flour of the Edible Fedora Cultivar Hemp (Cannabis sativa L.). Molecules 2018, 24, 83. [Google Scholar] [CrossRef]
- Vonapartis, E.; Aubin, M.-P.; Seguin, P.; Mustafa, A.F.; Charron, J.-B. Seed composition of ten industrial hemp cultivars approved for production in Canada. J. Food Compos. Anal. 2015, 39, 8–12. [Google Scholar] [CrossRef]
- Moccia, S.; Siano, F.; Russo, G.L.; Volpe, M.G.; La Cara, F.; Pacifico, S.; Piccolella, S.; Picariello, G. Antiproliferative and antioxidant effect of polar hemp extracts (Cannabis sativa L., Fedora cv.) in human colorectal cell lines. Int. J. Food Sci. Nutr. 2020, 71, 410–423. [Google Scholar] [CrossRef] [PubMed]
- Izzo, L.; Castaldo, L.; Narváez, A.; Graziani, G.; Gaspari, A.; Rodríguez-Carrasco, Y.; Ritieni, A. Analysis of Phenolic Compounds in Commercial Cannabis sativa L. Inflorescences Using UHPLC-Q-Orbitrap HRMS. Molecules 2020, 25, 631. [Google Scholar] [CrossRef] [PubMed]
- Drini’c, Z.; Vidovi’c, S.; Vladi’c, J.; Koren, A.; Kiprovski, B.; Sikora, V. Effect of extraction solvent on total polyphenols content and antioxidant activity of Cannabis sativa L. Lek. Sirovine 2018, 38, 17–21. [Google Scholar] [CrossRef]
- Ferrante, C.; Recinella, L.; Ronci, M.; Menghini, L.; Brunetti, L.; Chiavaroli, A.; Leone, S.; Di Iorio, L.; Carradori, S.; Tirillini, B.; et al. Multiple pharmacognostic characterization on hemp commercial cultivars: Focus on inflorescence water extract activity. Food Chem. Toxicol. 2019, 125, 452–461. [Google Scholar] [CrossRef] [PubMed]
- Makanjuola, S.A. Influence of particle size and extraction solvent on antioxidant properties of extracts of tea, ginger, and tea-ginger blend. Food Sci. Nutr. 2017, 5, 1179–1185. [Google Scholar] [CrossRef]
- D’Alessandro, L.G.; Kriaa, K.; Nikov, I.; Dimitrov, K. Ultrasound assisted extraction of polyphenols from black chokeberry. Sep. Purif. Technol. 2012, 93, 42–47. [Google Scholar] [CrossRef]
- Romdhanea, M.; Gourdon, C. Investigation in solid–liquid extraction: Influence of ultrasound. Chem. Eng. J. 2002, 87, 11–19. [Google Scholar] [CrossRef]
- Yatma, F.; Falah, S.; Ambarsari, L.; Aisyah, S.I.; Nurcholis, W. Optimization of Extraction of Phenolic and Antioxidant Activities from Celosia cristata Seeds Using Response Surface Methodology. Biointerface Res. Appl. Chem. 2022, 13, 148. [Google Scholar] [CrossRef]
- Jambrak, A.R.; Mason, T.J.; Lelas, V.; Paniwnyk, L.; Herceg, Z. Effect of ultrasound treatment on particle size and molecular weight of whey proteins. J. Food Eng. 2014, 121, 15–23. [Google Scholar] [CrossRef]
- Petigny, L.; Périno-Issartier, S.; Wajsman, J.; Chemat, F. Batch and Continuous Ultrasound Assisted Extraction of Boldo Leaves (Peumus boldus Mol.). Int. J. Mol. Sci. 2013, 14, 5750–5764. [Google Scholar] [CrossRef]
- Mason, T.J. Some neglected or rejected paths in sonochemistry–A very personal view. Ultrason. Sonochem. 2015, 25, 89–93. [Google Scholar] [CrossRef] [PubMed]
- Teh, S.-S.; Birch, E.J. Effect of ultrasonic treatment on the polyphenol content and antioxidant capacity of extract from defatted hemp, flax and canola seed cakes. Ultrason. Sonochem. 2014, 21, 346–353. [Google Scholar] [CrossRef] [PubMed]
- Kobus, Z. Energetyczne aspekty sonifikacji suszu z marchwi. Inżynieria Rolnicza 2007, 5, 213–222. [Google Scholar]
- Carciochi, R.A.; Dieu, V.; Vauchel, P.; Pradal, D.; Dimitrov, K. Reduction of environmental impacts of caffeine extraction from guarana by using ultrasound assistance. Food Bioprod. Process. 2021, 127, 266–275. [Google Scholar] [CrossRef]
- Koturevic, B.; Adnadjevic, B.; Jovanovic, J. The kinetics of the extraction of caffeine from guarana seed under the action of ultrasonic field with simultaneous cooling. Green Proc. Synth. 2020, 9, 26–36. [Google Scholar] [CrossRef]
Disclaimer/Publisher’s Note: The statements, opinions and data contained in all publications are solely those of the individual author(s) and contributor(s) and not of MDPI and/or the editor(s). MDPI and/or the editor(s) disclaim responsibility for any injury to people or property resulting from any ideas, methods, instructions or products referred to in the content. |
© 2023 by the authors. Licensee MDPI, Basel, Switzerland. This article is an open access article distributed under the terms and conditions of the Creative Commons Attribution (CC BY) license (https://creativecommons.org/licenses/by/4.0/).