Article

Hydrothermal Reservoir and Electrical Anisotropy Investigated by Magnetotelluric Data, Case Study of Asal Rift, Republic of Djibouti

by
Abdek Hassan Aden
Institut National de la Recherche Scientifique, 490 de la Couronne, Québec, QC G1K 9A9, Canada
Appl. Sci. 2023, 13(2), 1157; https://doi.org/10.3390/app13021157
Submission received: 15 November 2022 / Revised: 8 January 2023 / Accepted: 10 January 2023 / Published: 15 January 2023
(This article belongs to the Special Issue Recent Developments in Geoelectrical Imaging Method)

Abstract

:
At the center of the Republic of Djibouti, an eroded rift called Asal is located where tectonic and magmatic activities can be observed at the surface. Multiple studies were carried out with different exploration methods, such as structural, geophysical and hydrogeological, to understand rifting processes and characterize the subsurface of this rift. Among these subsurface exploration methods, the deep geoelectrical structures need to be better defined with the magnetotelluric (MT) method to better delineate the deep resistivity structures. With the objective of improving our understanding of the deep rift structure, magnetotelluric (MT) data acquired in the Asal rift were analyzed and inverted to build a 2D electrical conductivity model of the hydrothermal system. To achieve this, a dimensionality analysis of the MT data along a 2D profile perpendicular to the rift axis was carried out. Results of this analysis justify the approximation of 2D conductivity structure. Then, 2D inversion models were achieved to build models of the conductive structures. Dimensionality analysis results revealed the existence of electrical anisotropy. Consistent correlation between geoelectric strike and electrical anisotropy direction was suggested. Electrical anisotropy direction determined from the ellipticity of the phase tensor for the short periods was interpreted as the consequence of tectonic activity and horizontal deformation of the rift. Moreover, electrical anisotropy direction for the long periods was assumed to be related to the effects of combined magmatic-tectonic activities with predominant magma/dyke intrusion, which implies the vertical deformation and the subsidence of the rift and may imply the alignment of Olivine. Moreover, the variation and rotation of paleo and recent stress fields direction of plate motion in Asal rift located at the junction of three diverging plates—Arabia, Nubia and Somalia—over geological time can generate both magmatic and tectonic activities which in turn can induce a preferred direction of electrical anisotropy which is the direction of the highest conductivity. While the north-south electrical anisotropy direction is parallel to the direction of Red Sea Rift propagation, the north-east electrical anisotropy direction is aligned with the extension direction between Arabia and Somalia plates. Results of the 2D inversion models presented for the Asal rift allowed to identify two superimposed conductive units close to the surface and are interpreted as a shallow aquifer and a wide potential hydrothermal system. These conductive mediums are overlying a relatively resistive medium. The latter is associated with a magmatic system likely containing hot and/or partly molten rocks. The 2D conductivity model developed in this study could be considered as conceptual model of Asal rift prior to modeling multiphase fluid flow and heat transfer and/or could be used to identify the hydrothermal system for future drilling target depth of geothermal exploration.

1. Introduction

Rifts zones with divergent plates host high potential geothermal resources and large hydrothermal systems. The Asal rift is an impelling place to study many features related to the characterization of such hydrothermal systems, as seismicity, ground deformation, high ground temperature, fumaroles activities and geomagnetic anomalies have been observed in the area during the past decades [1,2,3,4]. Earthquake monitoring was consequently carried out for a long period in the Asal rift in order to image the thermal structure of the crust [4]. Thus, the presence of a hydrothermal system was suggested since seismicity can be related to fluid movement in the crust [4,5,6]. However, the depth of high linear geothermal gradient for well A5 (absence of convection) is different from the depth of wells A3, A6 and A4 which clearly showed evidence of convection (see Figure 2 in [6]), the permeability reduction from 1 to 2 km observed in deep geothermal wells located at the center of rift (A5, F1 and F3, see Figure 1) and the absence of significant hydrothermal circulation, are fair evidence that the active hydrothermal system can be compartmented.
Characterization of the subsurface with geophysical methods is an important prior step in geothermal exploration. The magnetotelluric (MT) method is suitable for highlighting conductivity contrasts at depth, and electrical properties are among the most useful parameters for imaging deep geothermal structures, especially in a volcanic context. Electrical conductivity varies with clay content, temperature, rock type, water content. Particularly, the presence of interconnected pore or fracture filled by a fluid or conductive minerals drastically changes the electrical resistivity. Combined with other information, this parameter can help to identify the presence of a magmatic system, hydrothermal reservoir, shallow aquifer, regional aquifer, vertical conduits as faults and the existence of cap rocks [7,8,9,10].
Dimensionality analysis of magnetotelluric data, which is often used to define what structure (1D, 2D and 3D) of electrical conductivity is more appropriate for the acquired MT data and the determination of geoelectric strike or the direction of the higher electrical conductivity, are useful tools to evaluate the existence of anisotropic layers in the subsurface. In fact, geoelectric strike dependence on the penetration depth of electromagnetic fields can be used to determine the past tectonic activities in a rift zones [11], where tectonic and magmatic activities are dominant processes of rifting, such as in the Asal rift. The aim of this study is to infer the presence of both geoelectric strike and electrical anisotropy direction that may be related to the remanent and current stress fields in an extension context of rift prior to delimit the deep structure and assess the extent of the hydrothermal system in Asal rift. To achieve this objective, MT data acquired in 2008 by ISOR [12] were reinterpreted. Detailed dimensionality analysis of the MT soundings was performed, followed by 2D inversion of resistivity sections across the rift. Joint analysis of dimensionality and 2D inversion modelling were carried out to infer the geoelectric strike direction, existence of electrical anisotropy, presence of potential hydrothermal system, and to identify the main electrical conduction mechanism which accommodates the subsurface resistivity distribution.

2. Geological Background

The junction of three diverging plates—Arabia, Somalia and Nubia in East Africa—is a well-known depression called the Afar depression, where the expression of tectonic and magmatic activity is manifested as rift segments. Asal is the first inland rift segment of the Afar depression resulting from the westward propagation of the Aden oceanic ridge (Figure 1).
The emerged part of the Asal-Ghoubbet rift is bounded in the east by Ghoubbet Bay and in the west by Lake Asal (Figure 1). The opening date of this rift is close to 1 My [13]. Normal faults with principal direction of northwest–southeast that can have subvertical scarp over 100 m and a deep rift valley of about 300 m, are the main observed structural elements at the surface. The central emerged part of the rift is narrower than the marginal parts. Such structural and topographic settings are common features of slow spreading oceanic ridges. Deformed paleo shoreline from a preexisted freshwater lake high stand dated to 9 ky and the recent basaltic lava flow that cover mainly the rift axis zone highlight that this area has been subject to recent volcanic and tectonic activity [14,15]. The topography of the emerged rift resulted from successive steps of magmatic-tectonic activity. At the early time, almost 100 ky ago, the Fieale volcano was built by magmatic activity, then following tectonic activity faulted the crater that went under a last period of weak magmatic activity. Volcanic edifices of this later period can be observable at the surface but actives normal faults have dismantled most of them [13,16].
Micro-seismic activity, fumaroles and faults creep activity concentrated at the surface of Fieale Caldera, low seismic velocity zone under Fieale and surrounding areas is evidence supporting the idea that the central volcanic system cited above persisted up to now under the Fieale Caldera [3,4]. Intense seismic swarm with an earthquake of magnitude greater than five that happened on November 1978 in the Asal-Ghoubbet rift was followed by a fissured basaltic eruption lasting one week and which ended by the extrusion of an approximate volume of 2 × 10⁷ m3 yr−1 of lava that gave rise to the Ardoukoba volcano [15]. Observed deformation and geodetic data between 1972 and 1979 allowed to deduce an absolute uplift of the rift shoulders of about 0.2 m, 2 m extension with direction perpendicular to the rift axis (north-east) and 0.7 m absolute subsidence of the inner floor controlled by normal faults activity [13,15,17].
Observed deformation at the surface was interpreted as the result of injection of two magma filled dykes, one under the Ghoubbet Bay and another under the emerged Asal rift [15,18]. In addition, co-seismic period in 1978 of earthquake epicenters record during 5 days at the same episode of deformation in the Ghoubbet Bay had a trending direction of N120°E, which corroborates with the direction of dyke injection described above [13]. Two months of continuous seismicity recorded after that event indicated extension of the seismic activity in the Ghoubbet pass and the transfer zone between the Asal-Ghoubbet rift and Tadjoura submerged rift segment [13,15]. In their study, [19] hypothesized that rift extension at a shallow depth is mainly controlled by opening fissures and normal faulting in both the Ghoubbet seafloor and the emerged Asal rift. Unfortunately, detailed structural and kinematic features that could explain how fissures, faults and dyke are related are still missing. Seismicity recorded between 1979 and 1984 with moderate magnitude was concentrated in the northeast of the rift axis, in the emerged part of the rift [4].
Local geodetic measurements performed at different times suggest that extension in the Asal rift has stabilized since 1990 to an approximate velocity extension of 16 mm yr−1 [17]. According to the latter authors, this rate is practically the same as the regional extension rate inferred from large scale geodetic measurements between the Arabia and Somali plates. The long-term opening velocity of the Asal-Ghoubbet rift is also close to the previous local and regional extension velocity [13,16]. Therefore, even with the existence of some minor transients slip events on fissures and faults inferred from InSAR data [3] and a weak localized seismic activity [4], it is believed that a steady state extensional regime has been reached.

3. Methods

3.1. Magnetotelluric Data Acquisition and Processing

An MT survey was carried out in the Asal rift between 2007 and 2008 by the Icelandic company ISOR [12]. The geographical distribution of the MT stations covers a large part of the Asal Rift (Figure 1). Phoenix MTU-5 systems were used to record the data, i.e., the temporal variation of the three components of the magnetic field (Hx, Hy and Hz) and the two components of the telluric field (Ex and Ey). In order to reduce random noise in the MT signals, a remote reference station located 10 km away from the study area was used [20]. The directions x, y and z correspond, respectively, to the north, to the east and to the depth. The data collection time was 48 h. For each site, time series were converted from time domain to frequency domain impedance tensor with the Fourier transformation method [20]. Then, a least square technique estimated was used in order to reduce and remove the noise related to the electric and magnetic fields that are not naturally induced but resulting from human activities. The frequency range of the data varies from 12.7 × 10⁻³ Hz to 400 Hz and corresponds roughly to a skin depth of the electromagnetic fields up to 24 km in the Earth if a resistivity of 20 Ωm is assumed.
Horizontal and orthogonal components of electric and magnetic fields are related to the impedance tensor by the following equation:
E x E y = Z x x Z x y Z y x Z y y H x H y
where
Z = Z x x Z x y Z y x Z y y
is the complex impedance tensor.

3.2. Dimensionality Analysis of MT Data

Dimensionality analysis is a useful way to understand whether a 3D, 2D or 1D conductivity model should be developed to fit the data. This is carried out through common analysis methods used by the MT community such as phase tensor, invariant impedance tensor, decomposition model and induction vectors [21,22,23]. Thus, to determine if the Earth can be approximated by a 2D conductivity structure, in the following sections the presence of a well-defined geoelectric strike will be investigated, which can be a good argument to assume a regionally 2D conductivity structure.

3.2.1. Phase Tensor

The phase tensor corresponds to the regional phase tensor relationship between the electric and magnetic fields and is not affected by galvanic distortion of electric fields [22]. This phase tensor can be represented by an ellipse where the ellipticity can indicate the degree of split between the orthogonal xy and yx components of the complex impedance tensor (see Equation (1) in Section 3.1), for which a magnitude and phase can be determined. The ellipticity of the phase tensor can be a tool to investigate the presence of lateral and vertical gradient of resistivity which is aligned with the direction of the major axis of the ellipse where the presence of dominant 2D conductivity structure or anisotropy can be inferred [22,24]. The direction with maximum inductive current flow is inferred by the orientation of the major axis of the ellipse, which correspond to the strike angle estimated from the phase tensor. As there is no prior available information for which axe of ellipse correspond to the maximum or the minimum phase, the orientation of the Induction vectors will be jointly used (see Section 3.2.4) to eliminate the 90° ambiguity. An approximate circular phase reveals no preferential inductive current flow direction and indicates 1D conductivity structure, while a large ellipticity indicates a preferred direction of current flow [22]. Major axes of phase tensor ellipses pointing parallel or perpendicular to the geoelectric strike is often known to indicate a dominant 2D conductivity structure. Another parameter used by MT practitioners is phase tensor skew (β), which describes the asymmetry of the phase tensor [22] and is expresses by Equation (2):
β = 1 2 t a n 1 Φ x y   Φ y x Φ x x +   Φ y y  
where Φ i j is the phase tensor components defined by
Φ = X 1 Y
where X and Y are, respectively, the real and imaginary parts of Z.
A 3D conductivity structure can be inferred when the phase tensor skew angle is greater than 5° [22,25]. Furthermore, values of skew angle less than 5° are practically found but cannot be a good argument to advance and conclude on the absence of 3D conductivity structure [24].

3.2.2. Geoelectric Strike Angle from Impedance Invariants

Rotational invariants quantities computed from MT data have been extensively used in the past decades at various stages of MT data processing. Two common examples are the determinant invariant and the squared sum of components of the impedance tensor [26]. With the determination of seven invariants of impedance tensor, ref. [23] have proposed some tools and guidance for analyzing MT dimensionality, i.e., to assess whether a 1D, 2D or 3D conductivity structure interpretation is required prior to modeling or inverting MT data. Moreover, they presented some necessary conditions for considering a regional 2D resistivity structure and advanced that a mean geoelectrical strike angle can be easily calculated in the presence of dominant 2D resistivity structure. In this study, the geoelectric strike angle was determined following this approach to verify the possible extent of a 2D conductivity structure and determine the associated geoelectric strike.

3.2.3. Strike Angle from Decomposition Model

Separating the impedance tensor of a regional 2D/1D Earth model and local 3D has commonly been used to distinguish between regional induction and local galvanic distortion [21,27]. Where local distortion affects the impedance tensor, the impedance phase derived from decomposition model of a regional 2D conductivity structure and local 3D structure, or an ideal 2D and near 2D MT data, can be a useful indicator of dimensionality of the regional conductivity structure in cases of 2D or 3D Earth [27]. The regional strike determined from [21] for 2D regional MT data but locally distorted with the presence of 3D galvanic effects will be along strike. In the case of 3D regional MT data, the strike determined from decomposition model [21] may be considered as an approximate along strike as being a near 2D regionally MT data [27]. The same method was used in this study to determine the geoelectric strike angle and to compare the result with the strike angles determined in the above sections and at the same time to better confirm the presence of 2D structure. The variation of the geoelectric strike angle with the increasing electromagnetic periods cannot be ignored and must be considered when evaluating the appropriate geoelectric strike at the corresponding period that is often assumed to be close to the geological strike. The latter is influenced by the dimension and depth of a body and the inductive length of electromagnetic fields.

3.2.4. Induction Vectors

Induction vectors or tipper vectors are calculated from the relation between the vertical and the horizontal components of magnetic field data, where the vertical magnetic field is generated by lateral conductivity gradient. They are used to determine the presence or absence of lateral conductivity variations at the corresponding depth. The Parkinson convention was adopted in this study, where the vectors point towards anomalous internal concentrations of current. The presence of high magnitude induction vectors can indicate the presence of large conductors and where the lateral changes in conductivity are important. Since tipper vectors are computed from the frequency-domain tensor components, the mean direction/strike inferred from the real component of tipper vector pointing toward a conductor can help to identify the existence of lateral conductivity contrast at the corresponding periods. If the length of the induction vectors is close to zero, a 1D resistivity structure at depth can be suggested; otherwise, a 2D or 3D structure should be considered. Furthermore, if the regional conductivity structure is 2D, the orientation of the tipper vector is mainly orthogonal or parallel to the geoelectric strike direction and this could be helpful in order to eliminate the 90° ambiguity of geoelectric strike (because there is prior available information for which axe of ellipse correspond to the maximum or the minimum phase). In the case of inconsistent orthogonality between strike direction and orientation of tipper, a 3D conductivity structure may be more appropriate.

3.3. Electrical Anisotropy

Existence of electrical anisotropy was analyzed with three methods: (1) the phase split or phase difference between the two polarizations, (2) the consistency of constant electromagnetic strike in a particular period range with the magnitude and direction of the induction vectors, and (3) the ellipticity of the phase tensor. Phase split or phase difference between the TE (transverse electric or TE mode) and TM (transverse magnetic or TM mode) polarization of the phase tensor can indicate the existence of anisotropy. Phase split greater than 10° is often associated with bulk anisotropy of a medium or to a dipping boundary separating two different conductivity regions, or to lateral resistivity variation [24]. The values Φmax and Φmin are the invariants quantities of the phase tensor and represent the length of the major axis and the length of the minor axis of the phase tensor ellipse, respectively [22]. The resistivity contrast can be inferred from the difference of Φmax and Φmin and the direction of the principal axe of ellipse that correspond to the phase tensor angle [22,24]. This method was used to verify the correlation between the shape of the ellipse, the ellipticity degree and the geoelectric strike in order to infer the presence of anisotropy at depth. Some insights based on electromagnetic strike and induction vector will be analysed to identify the presence of electrically anisotropy beneath Asal rift. In addition, a prior test was conducted to confirm the extent of 2D regional conductivity structure and the possible phase sensitive skew or regional skew increase that can result from potential anisotropic structures [28]. The value of phase sensitive skew or regional skew is generally greater than 0.3 in the presence of 3D regional resistivity [29] and a sudden increase in the phase sensitive skew value is often related to the presence of anisotropy or the increase in uncertainty in some MT sites. Anisotropy can be related to other parameters such as mechanical deformation or paleo/recent stress field, melt intrusion, conductive faults and reactivated faults or fractures. Different directions of anisotropy at different depths generated by different mechanisms can exist both in the crust and/or in the mantle. That means anisotropy direction may change with increasing periods of the natural electromagnetic fields or with the skin depth of MT signals.

3.4. Static Shift Correction and Strategy for 2D Inversion Models

Heterogeneity of small sized bodies and resistivity discontinuities across a geological boundary can generate a local distortion of electric field amplitudes and can produce a static shift of the apparent resistivity curve [30,31]. Thus, measured resistivity curves are shifted up or down by an unknown real factor. On the other hand, the shape of the true level of the resistivity curve remains at least same as the shifted resistivities curves. This effect should be removed to correctly infer the geoelectrical properties of the area under investigation. For the last two decades, researchers tried to find which method is most appropriate to correct the static shift phenomenon [30,31,32,33]. The Time Domain Electromagnetic Method (TDEM) is unaffected by static shift and this method is usually used to perform the correction when TDEM surveys can be performed coincidently with MT soundings [9,34,35]. In this study, the TDEM method is thus used in order to correct the static shift of each MT sounding where MT stations are close to the TDEM stations for the 2D profile perpendicular to the rift axis (Figure 1). A TDEM survey was carried out by ISOR with the collaboration of Djibouti government and the TDEM penetration overlapped with shallow MT penetration. Static shift correction was performed to find and determine the proportionality coefficient between resistivity derived from TDEM data and resistivity derived from MT data. Consequently, both resistivity of TE and TM modes are shifted to the level of TDEM resistivity which implies that the near surface is 1D. At the surface and in the shallow subsurface of geothermally active regions such as the Asal rift, resistive environments and dry volcanic rock are more common, and small-scale resistivity contrasts are likely to significantly distort the amplitudes of electric fields [31] and static shift should be corrected to avoid the distortion generated by the small-scale bodies near surface. In addition, in some areas with hilly landscape, topography effect can cause a misinterpretation of MT data because the induced current density can be concentrated in valleys and spread out on hills. In this study, the topography effect was not considered for the 2D inversion. The topography of the study area where electromagnetic soundings are available varies from 100 to 300 m above sea level (Figure 1) and this can be approximate by a slope angle of less than 9%. Moreover, 3D topography and bathymetry effect on MT data was studied by [36], who suggested that this effect is small for a short period range (corresponding to shallow depth approximately the depth of the crust) and can be neglected if the slope angle is less than 9°. So, in the Asal rift, the topographic effect is assumed to be negligible and a 2D mesh where the top of the 2D inversion model did not vary with the altitude of MT stations along the 2D profile is used. 3D galvanic distortion was adequately corrected by the TDEM data, whereas the potential 3D inductive effect or 3D inductive regional conductivity was checked by analysing the value of phase sensitive skew. Thus, values of phase sensitive skew greater than 0.3 are correlated by the presence of 3D inductive effects [29]. In cases where 3D inductive effects are not dominant, 2D inversion can be a good reasonable solution.

4. Results

Results obtained from dimensionality analysis are presented and the results from 2D inversion models follows.

4.1. Dimensionality

4.1.1. Extent of 2D Regional Conductivity and the Regional Skew

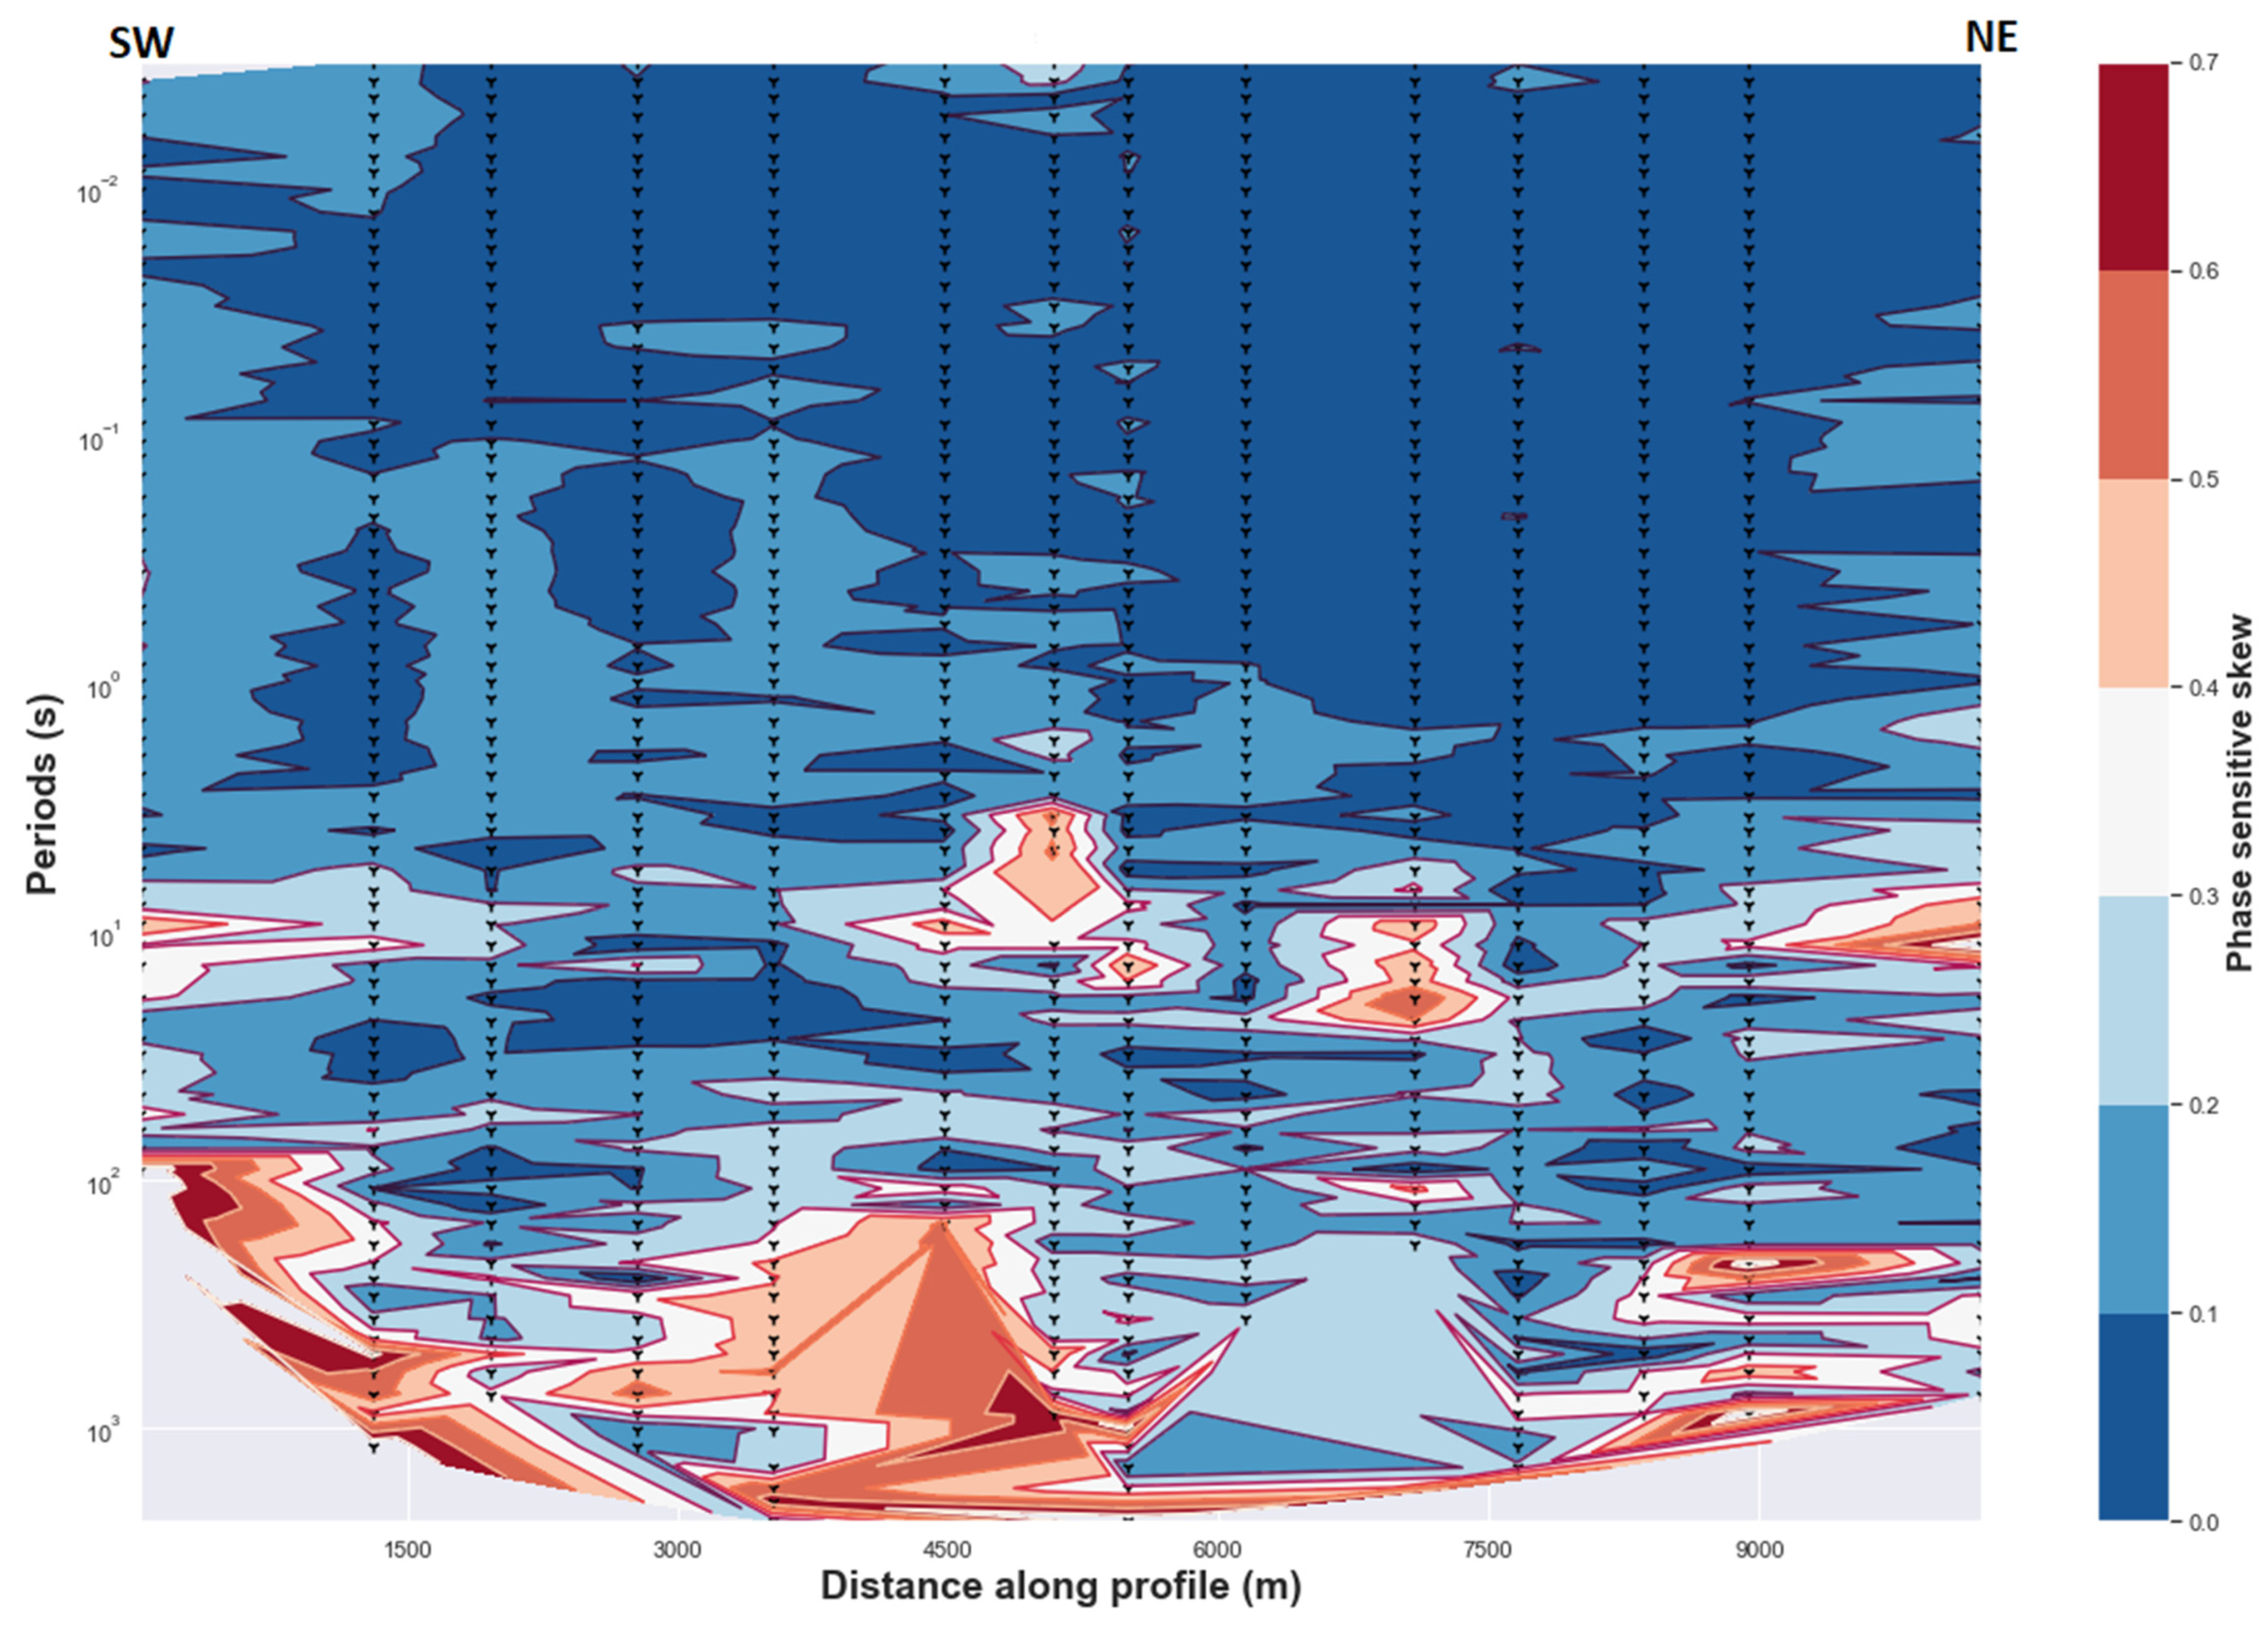
In order to determine the absence of dominant 3D regional conductivity and generalize the presence of dominant 2D regional conductivity in the study area, values of the regional skew were analyzed. It is reasonable and safe to advance that a 2D regional conductivity structure can be considered in this study as there are few points that have a regional skew value greater than 0.3 (Figure 2). Some points with greater regional skew are likely due to the influence of uncertainty in MT fields or impedance estimates (see Appendix A). A relative increase in regional skew values with depth can demonstrate the deviation of the conductivity distribution from the ideal or the exact 2D conductivity structure where the diagonal elements of impedance tensor are neglected and should be zero or close to zero [21,29]. Increasing values of the regional skew for the intermediate and long periods (corresponding to the greater depth) can be interpreted as due to the presence of anisotropic layers as suggested in previously studies by [28,37] with an assumed 2D resistivity structure. It is also correlated with the high vertical gradient magnitude induction vectors (see Section 4.2.3). Consequently, it is very interesting to suggest that anisotropy exists for the area where both the values of regional skew and the magnitude of the tipper increase. In addition, a phase split, ellipticity and a well-defined geoelectric strike exist for the same periods range, which also support the presence of anisotropy at the corresponding depth.

4.1.2. Phase Tensor Analysis

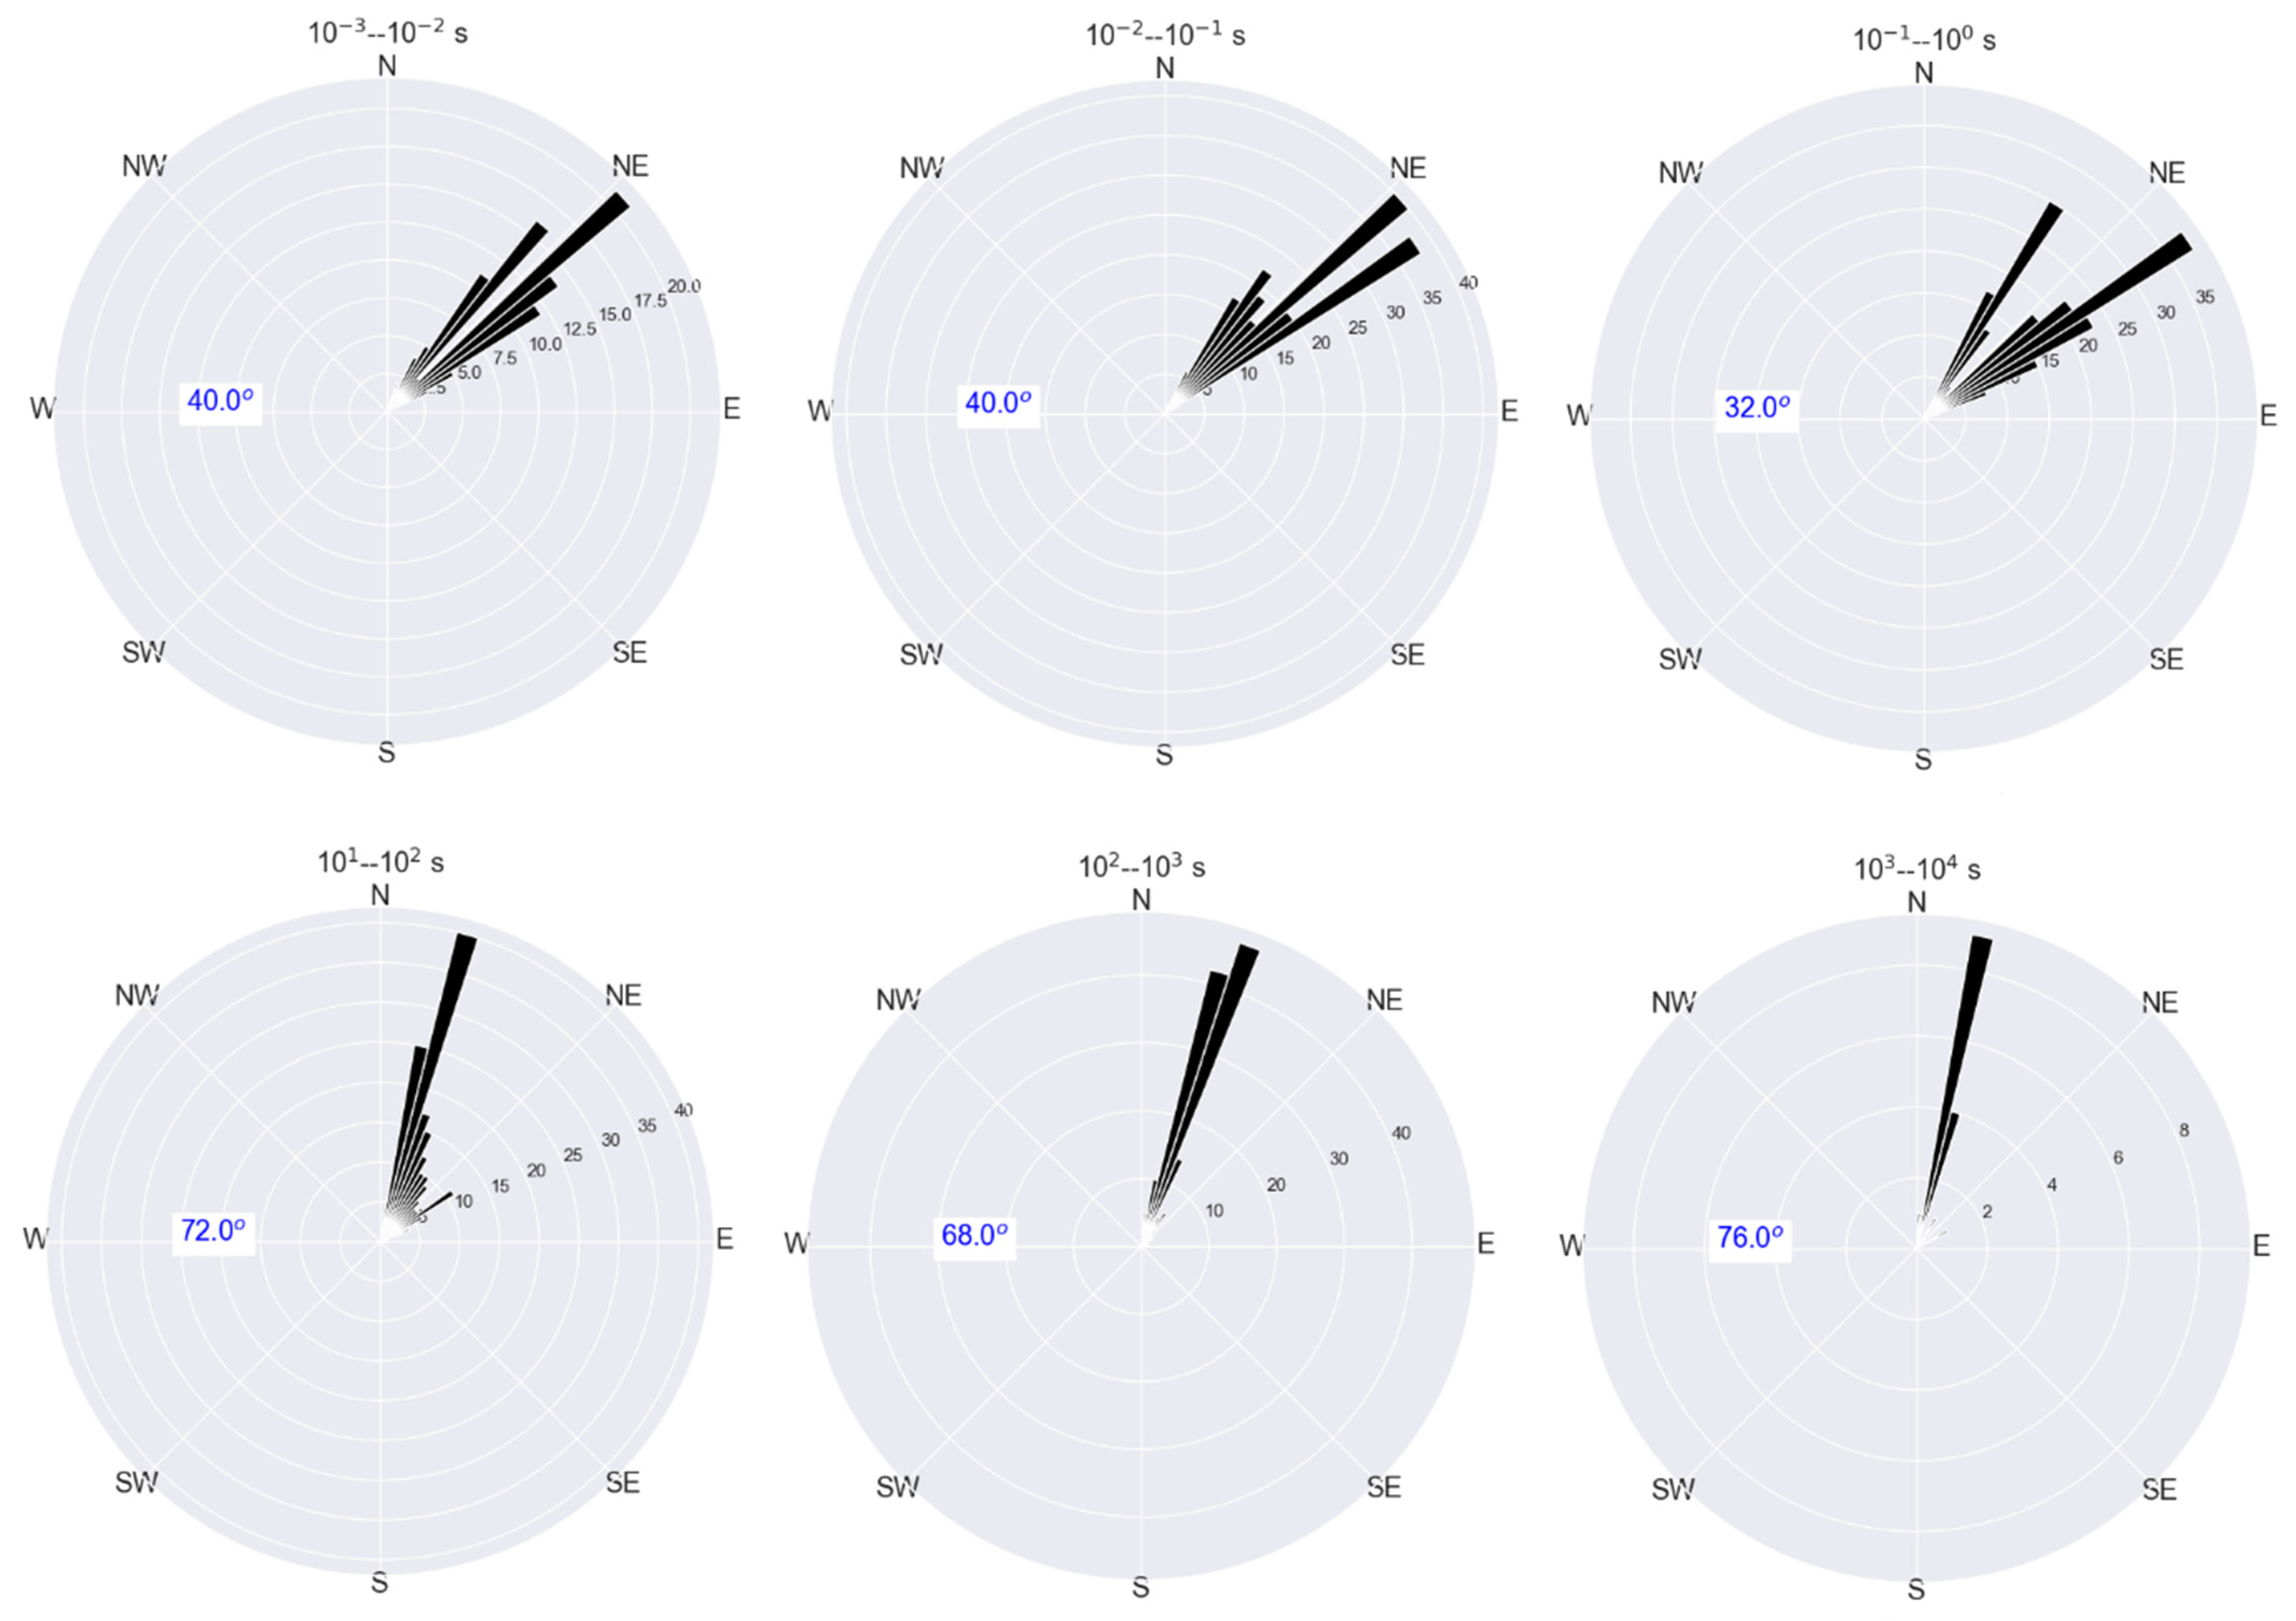
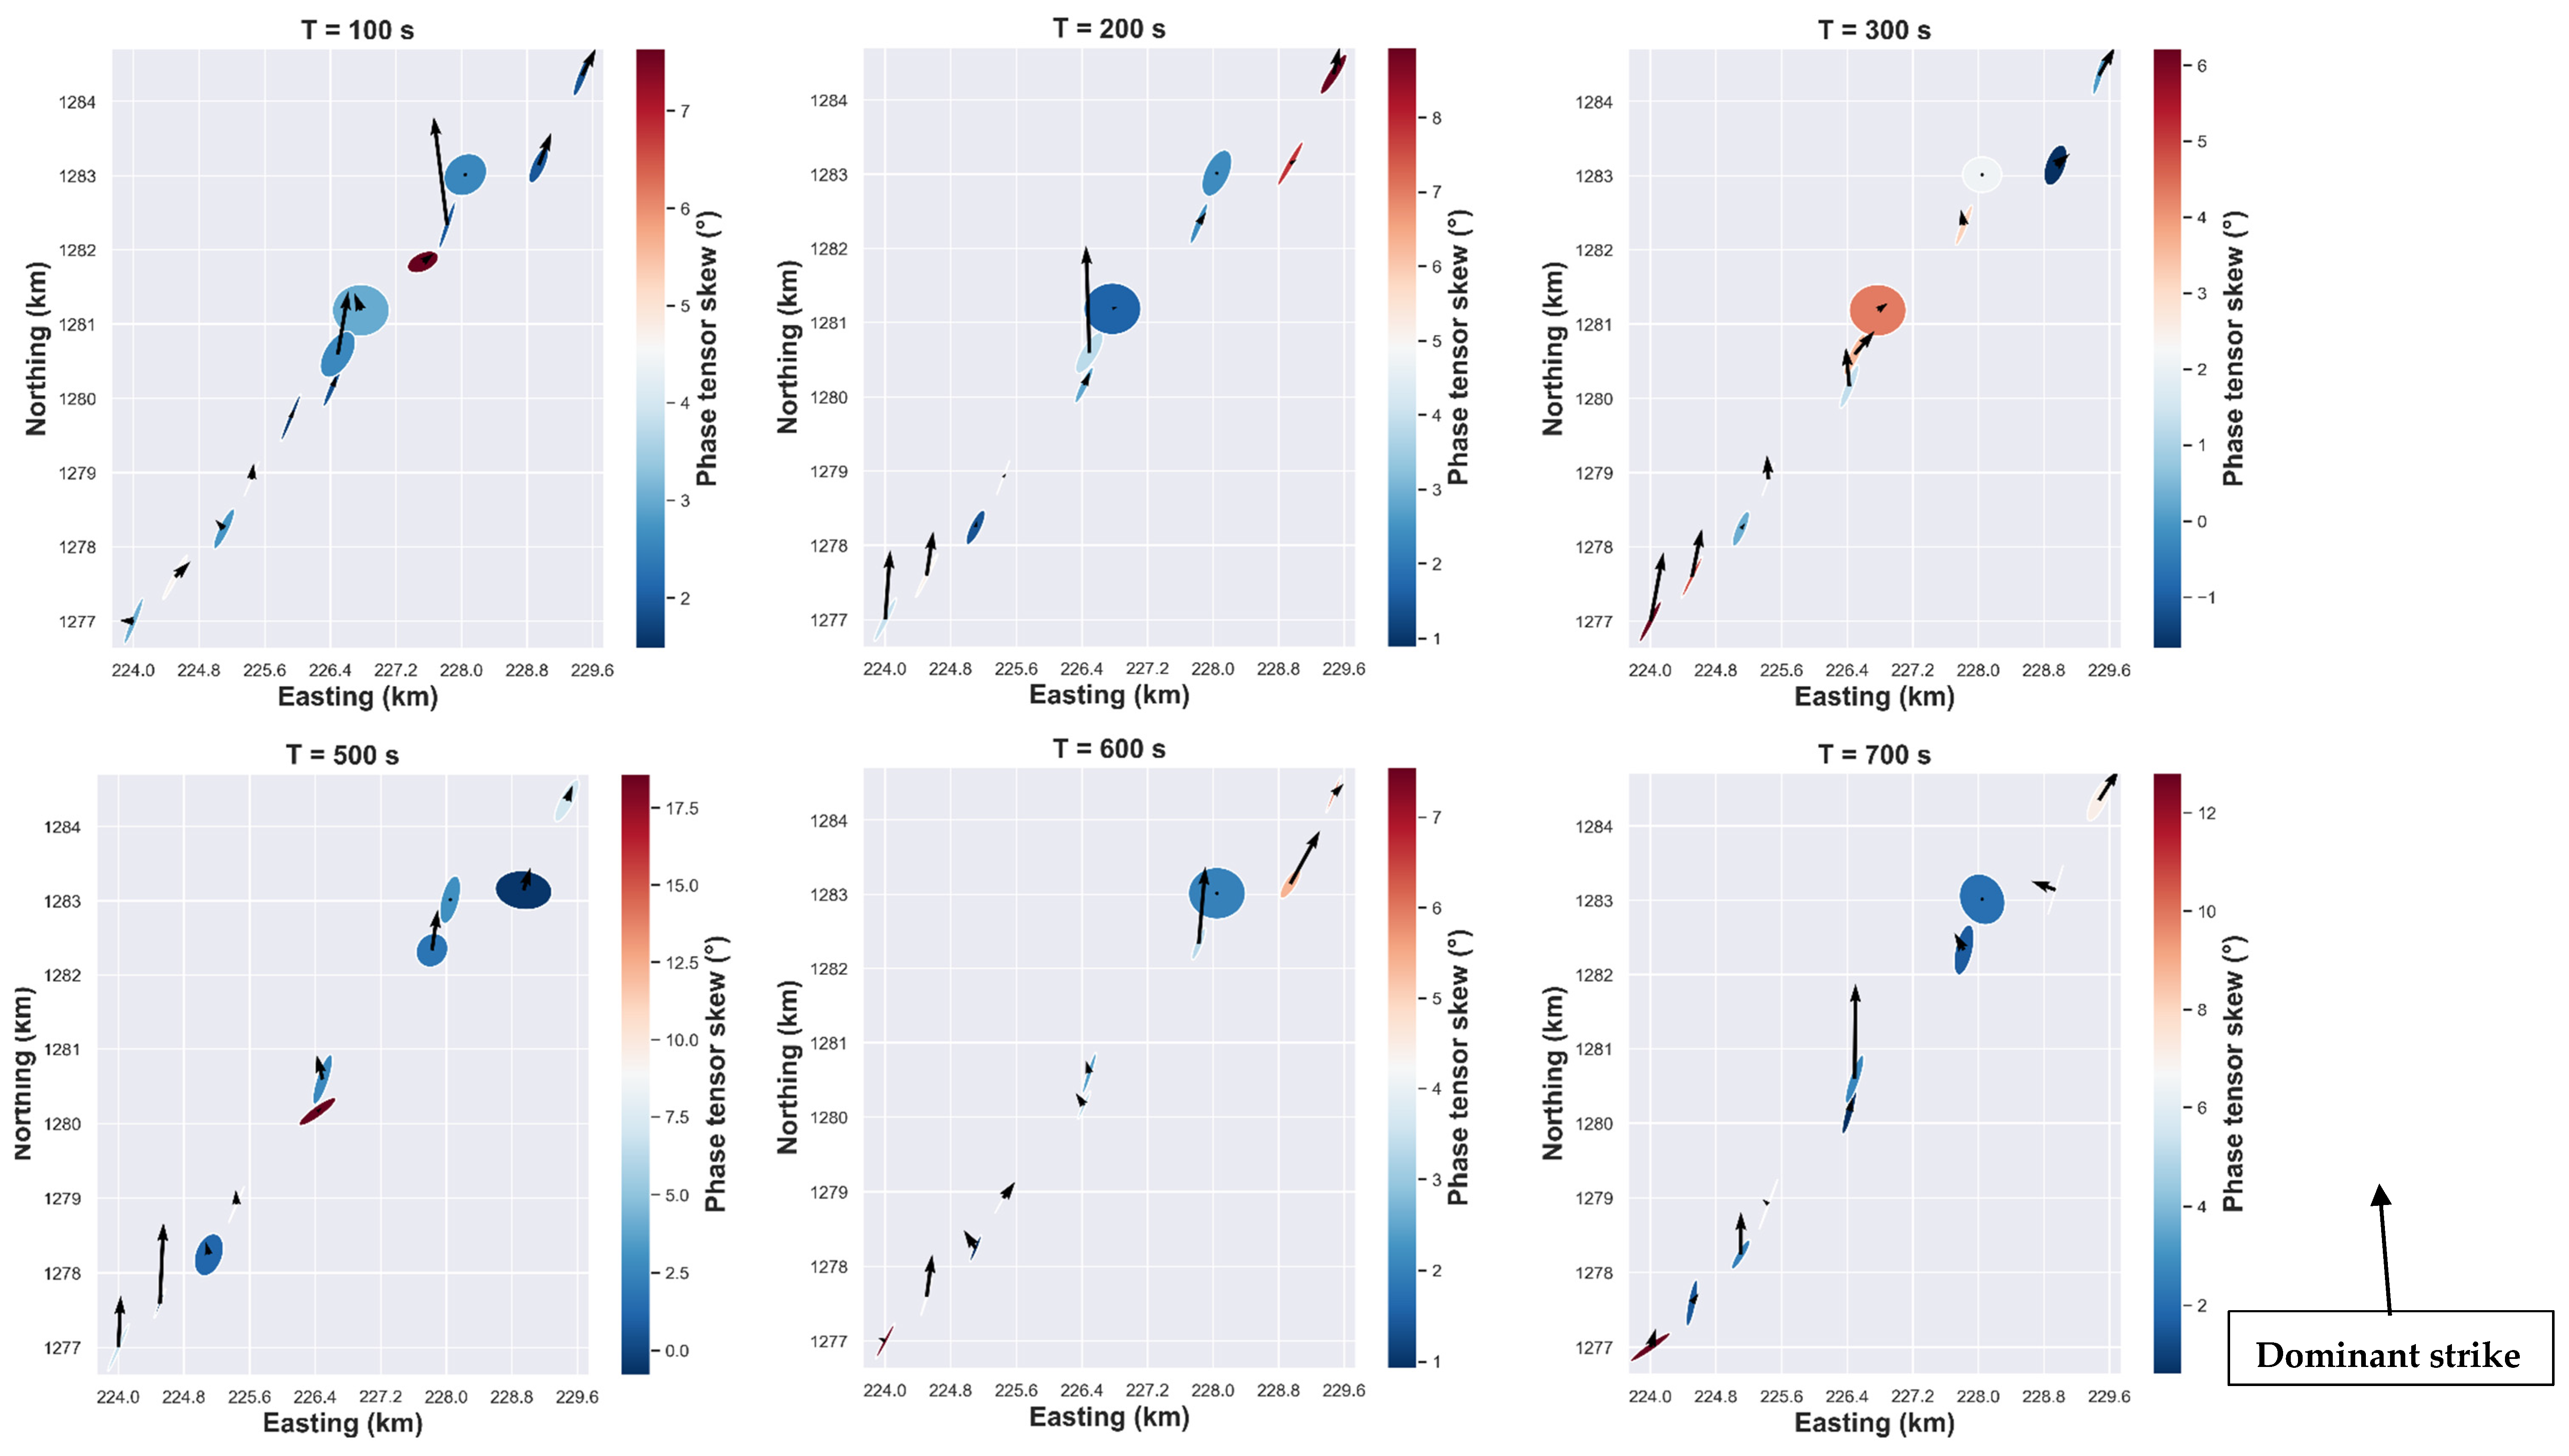
The convention adopted in this paper is that the phase tensor angle is measured counterclockwise, with the east direction corresponding to 0°. The analysis reveals that two main geoelectric strikes appear over two bandwidths for the phase tensor strike (Figure 3), a mean north-east strike of about 40° for the short periods (10−3 to 1 s) and another sensitive north-north-east strike for the long periods (10 to 104 s). The mean strike of phase tensor (Figure 3) is estimated over all 14 MT stations along 2D profile (Figure 1) with the corresponding periods range regrouped by decades.

4.1.3. Impedance Invariant and Decomposition Model

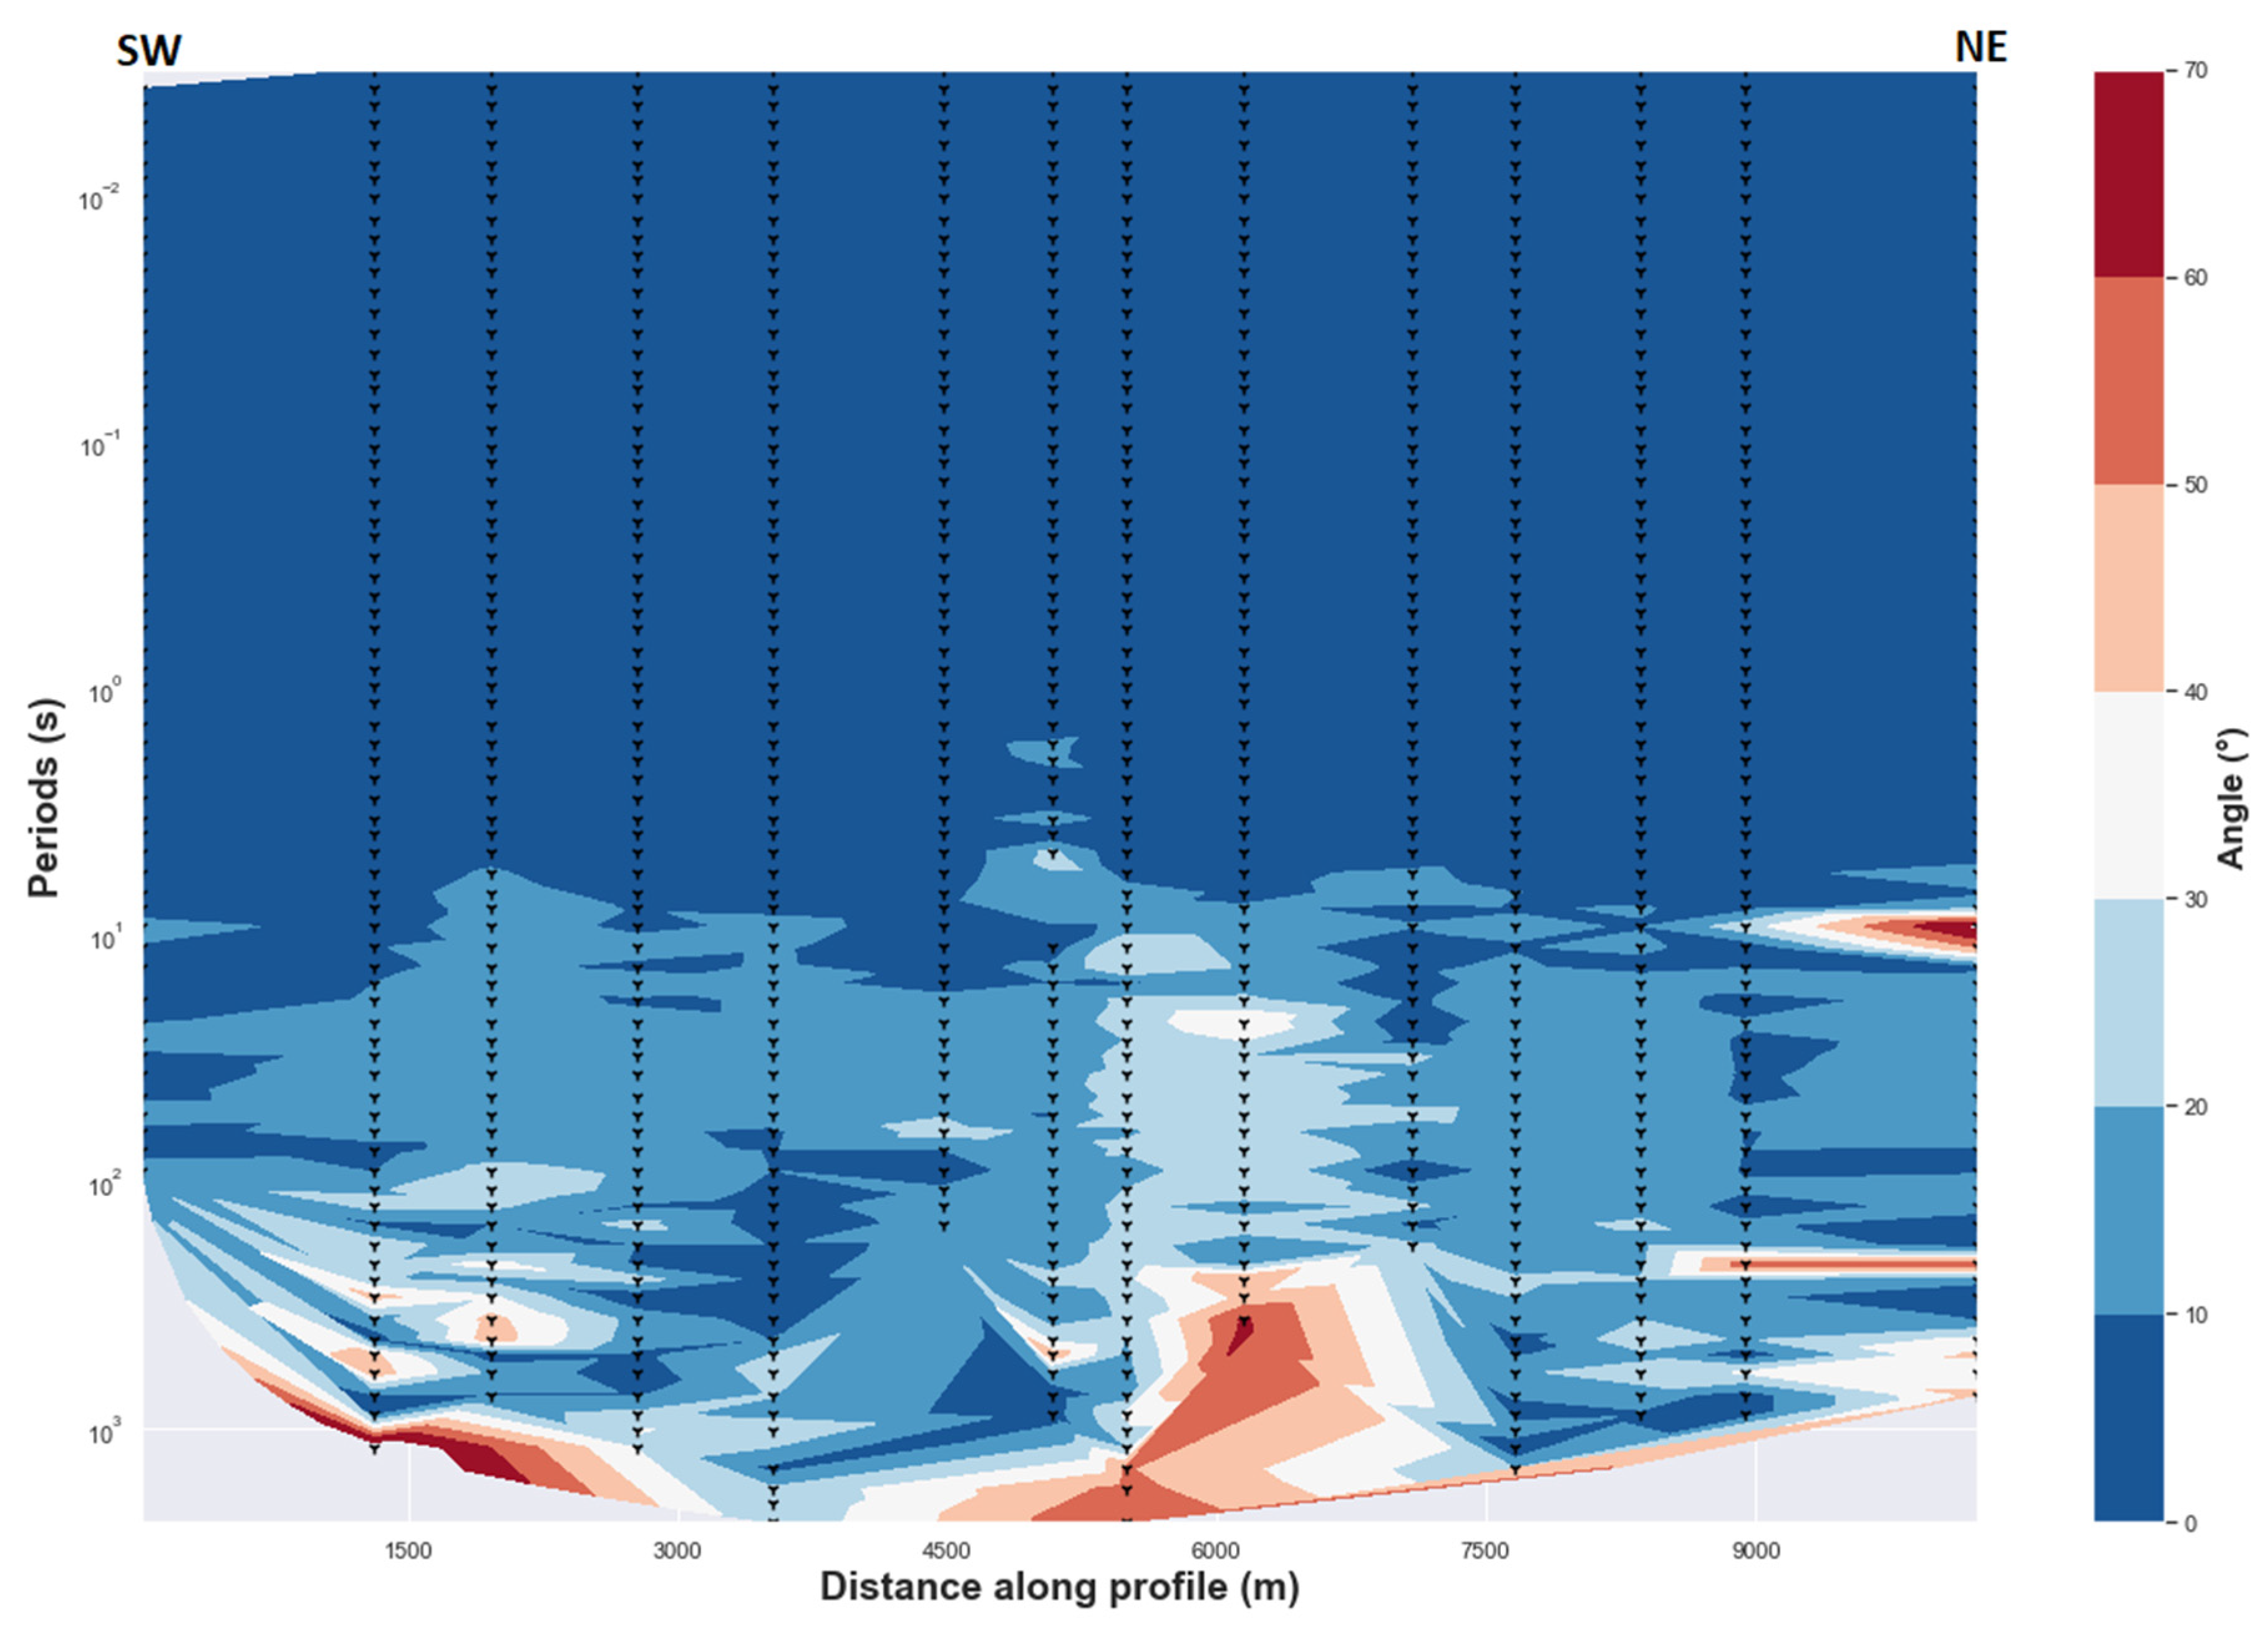
The geoelectric strike estimated from two different approaches (impedance invariant and decomposition model) are in the same range (Figure 4).
The two methods provide consistent results and indicate how geoelectric strike is dependent on period and site location. As evidenced in Figure 4, the geoelectric strike at short-intermediate periods for most MT stations is relatively north-east with an average of 45° but some stations have a N120°E strike that can be described as an orthogonal strike direction of the north-east strike, which can result from 3D effects or local 2D heterogeneity. Further reinterpretation related to the position of those MT stations is given in the discussion section. For the long period, an approximate north-north-west strike direction with an average of N120°E can be seen (Figure 4). In a 2D Earth, the strike determined from impedance invariant is mathematically the same as the strike determined from decomposition model of Bahr [23], which corresponds to the observed results in Figure 4.

4.1.4. Tipper Orientation with Phase Tensor Ellipse

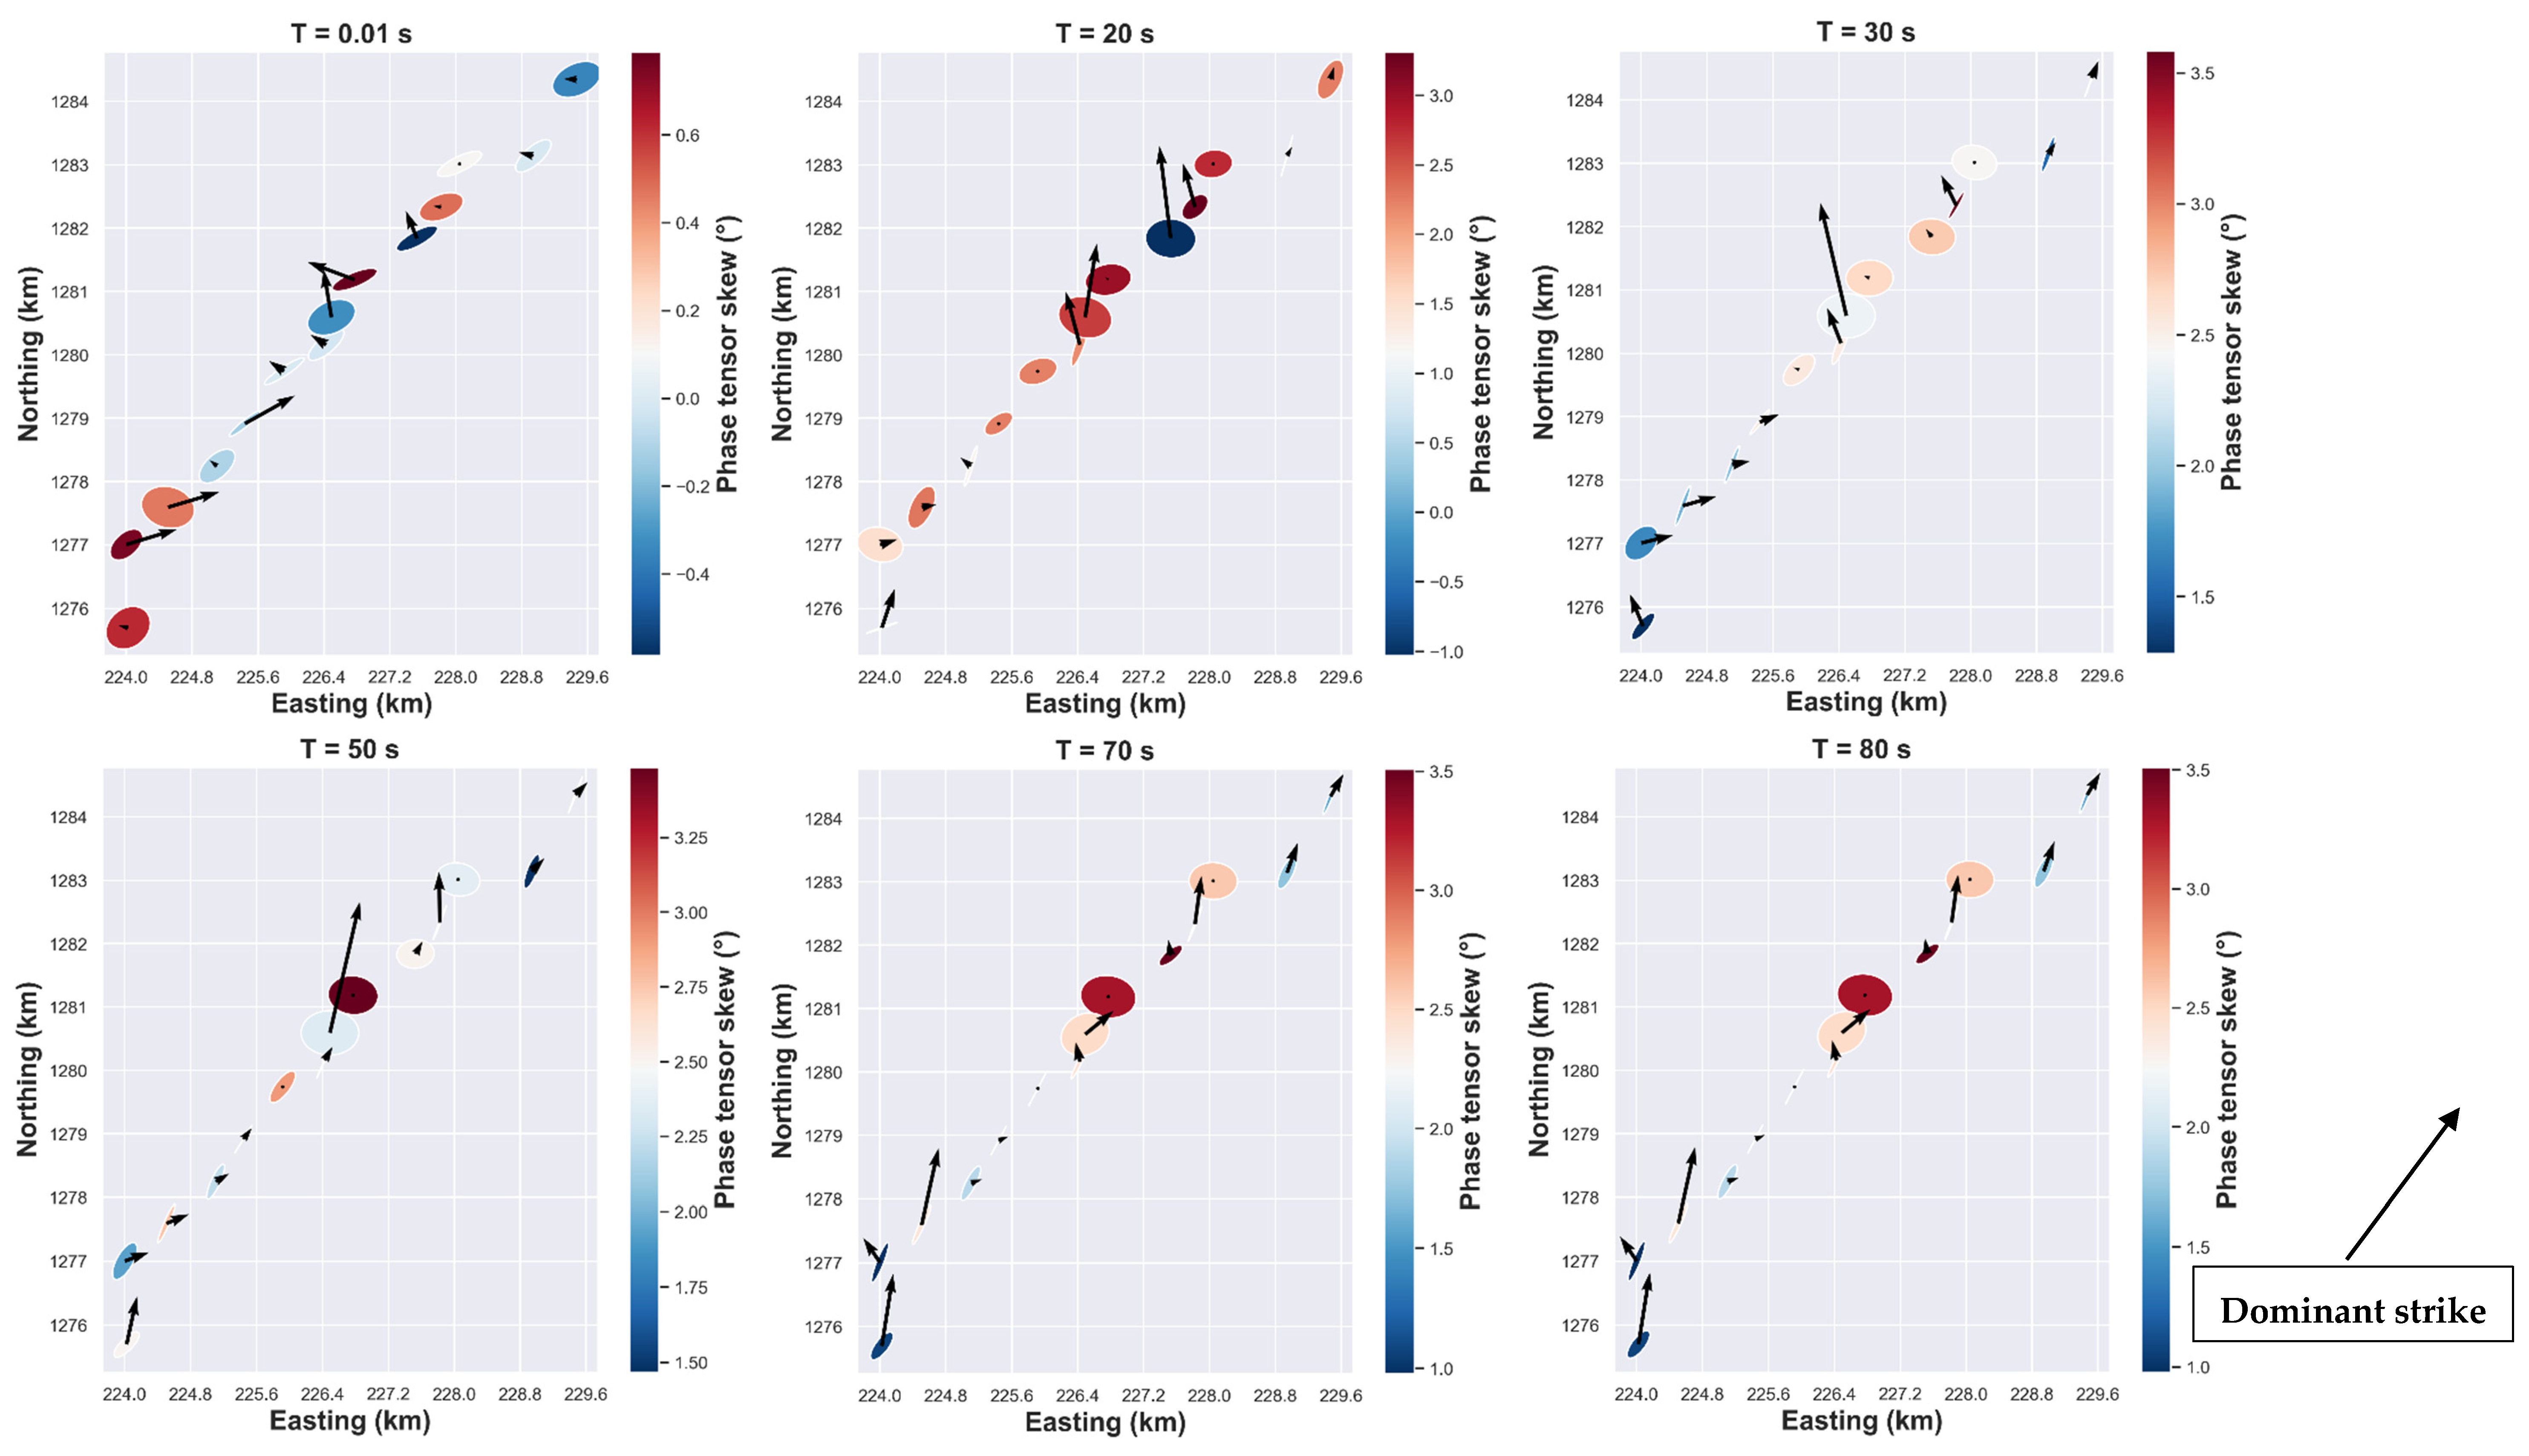
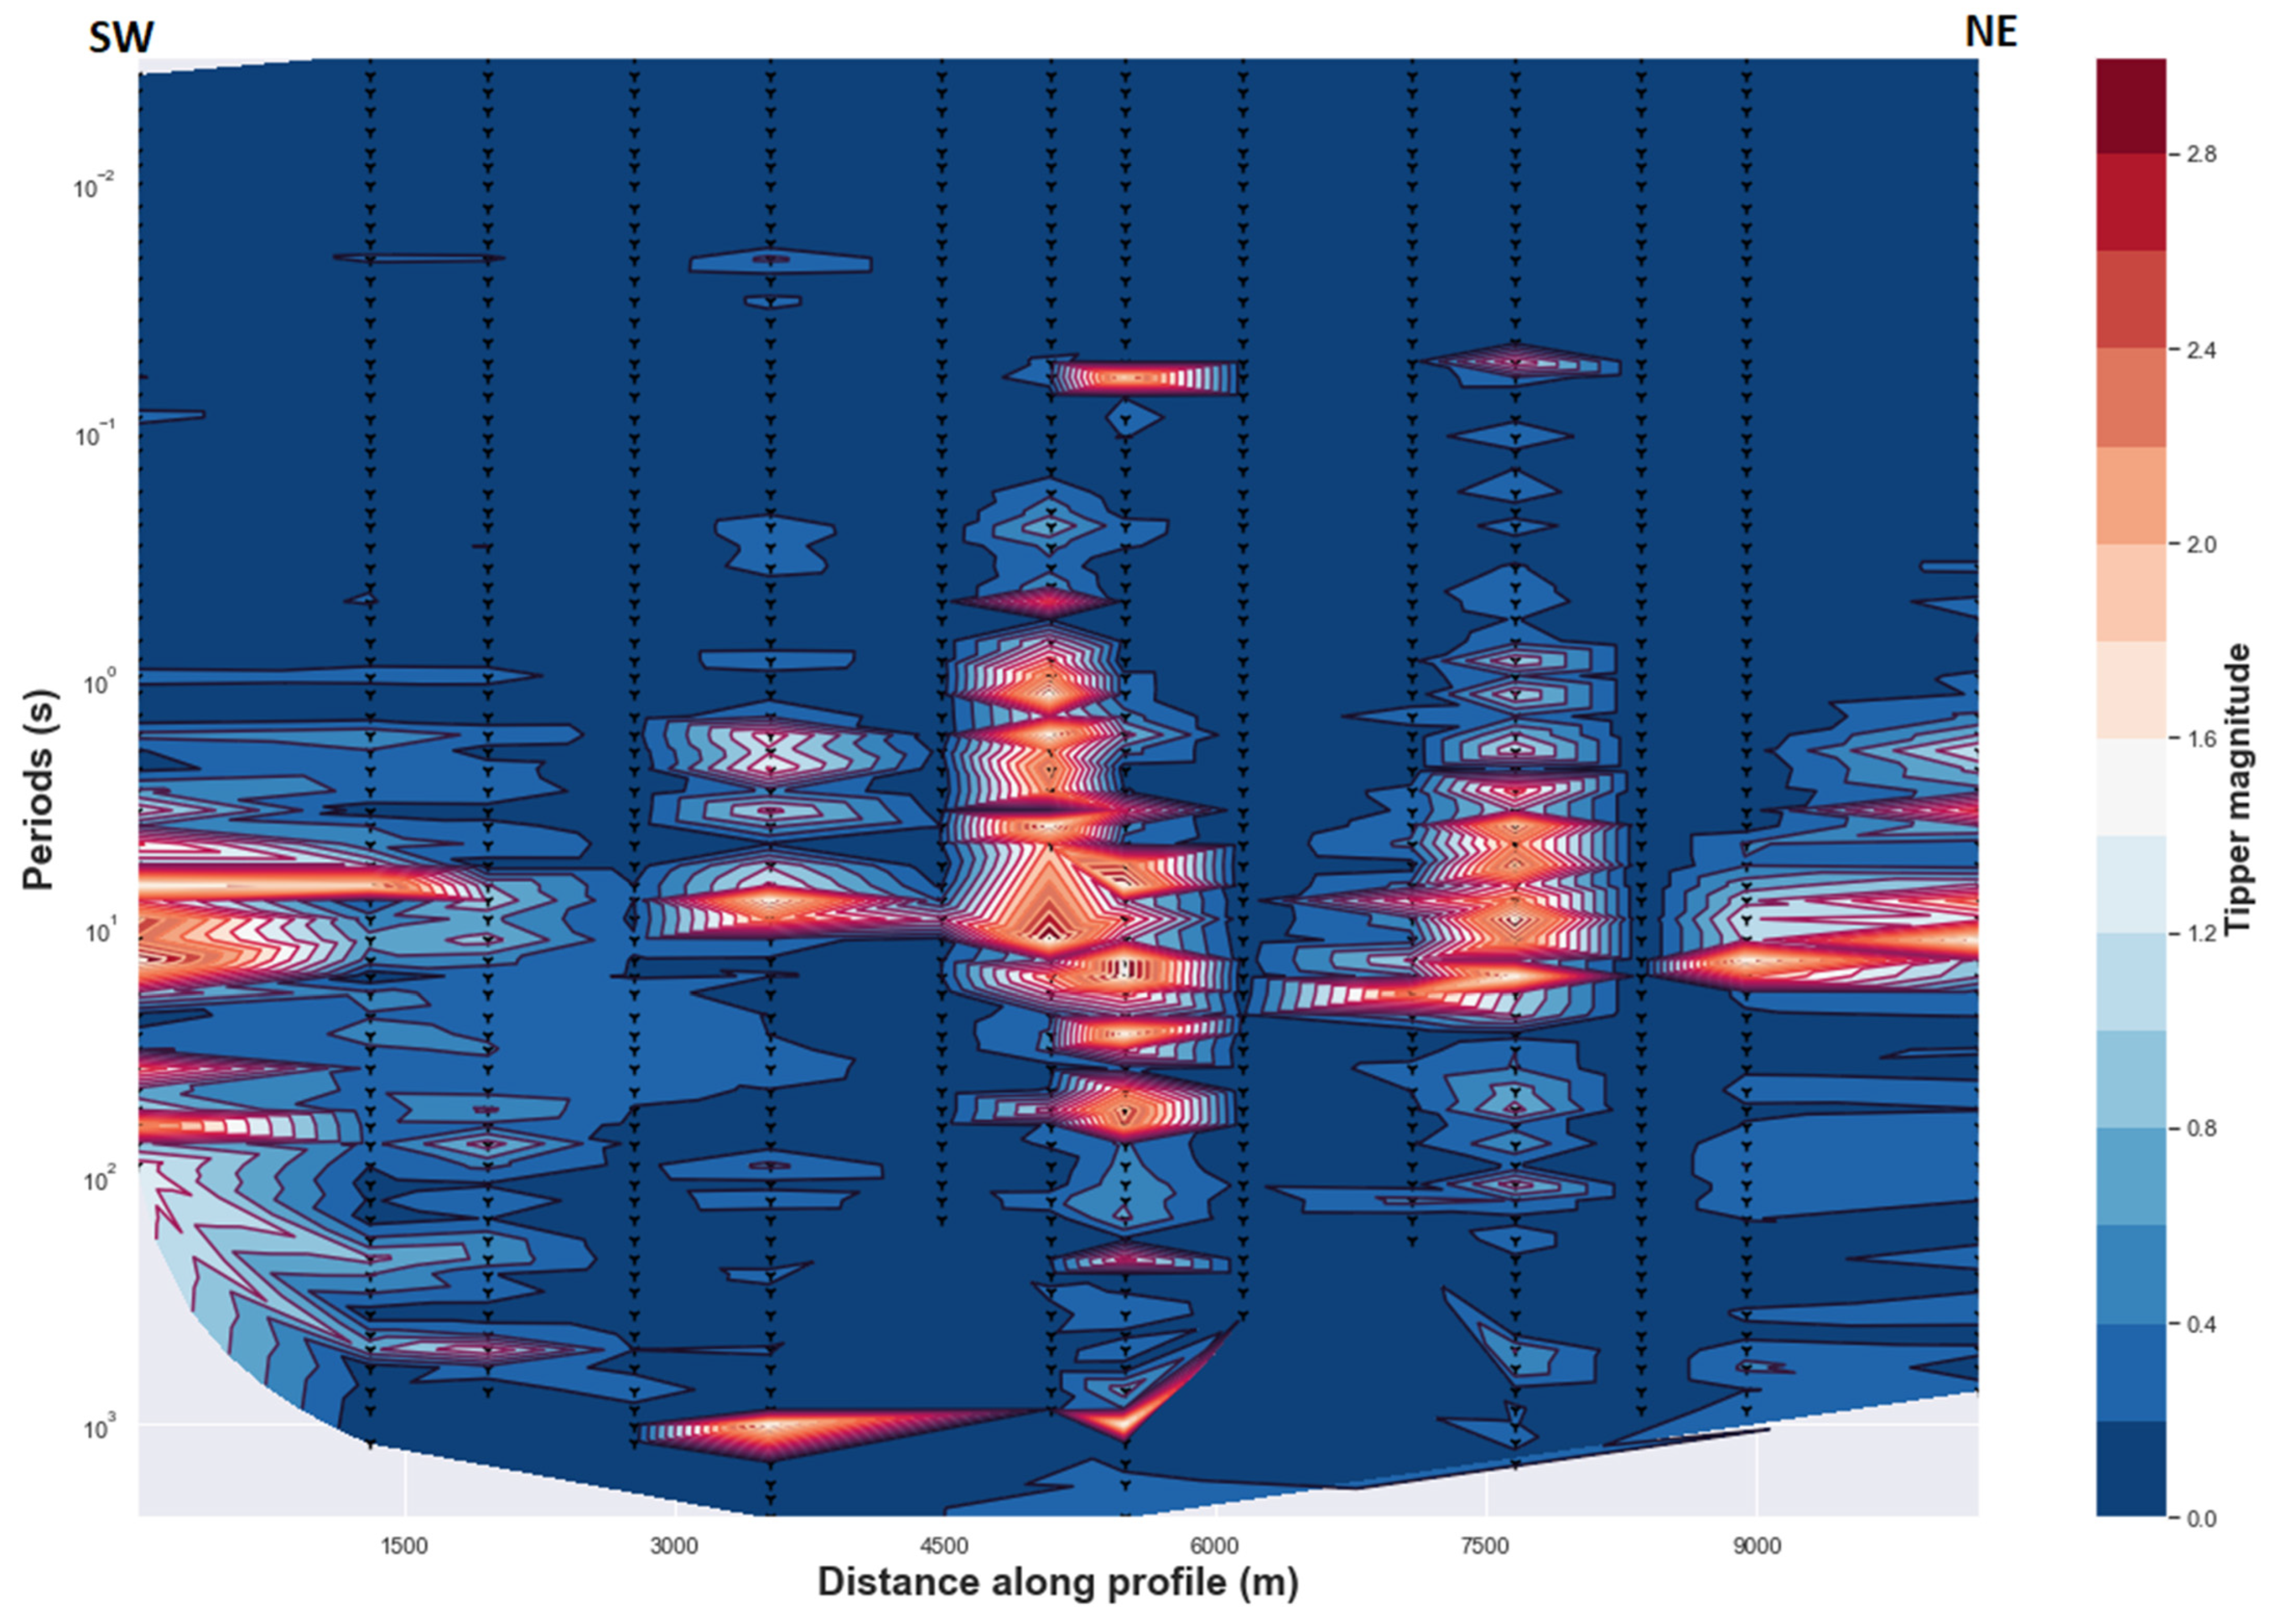
Tipper vectors represent the relation between the vertical magnitude field to the horizontal magnitude fields. Furthermore, lateral conductivity variation induces variation of horizontal magnetic fields, which generate a vertical magnetic field. The tipper vector as illustrated in Figure 5 have a magnitude and direction that varies with period and with site location. For short periods, vectors with strong magnitudes are observed in the center of the rift and in the south-west. The orientation of the tipper angle is approximately N45°E for the stations located in the south-west, while for the sites located at the center, the tipper angle is close to north-north-east and sometimes close to the north-south direction. Furthermore, for the long periods, the features are almost the same for sites located in the center and in the south-west, where the high magnitude vectors are aligned close to the north-south direction. The induction vectors are weak in the case of dominant 1D resistivity structure as evidenced in Figure 5 for some MT sites. In addition, the circular form of the ellipse of those sites indicates the dominant 1D structure (Figure 5, see for reference [22]). The filled color of the ellipse corresponds to the skew angle, which is commonly used to infer the presence of 3D effects where values greater than 5° are generally linked to the existence of 3D effects [25,38]. In Figure 5, values less than 5° of skew angle are common and could be associated with the dominant 2D regional conductivity structure [22]. Another important element is that the principal axes of the ellipse are either parallel or perpendicular to the geoelectric strike direction in the presence of dominant 2D conductivity structure [24].

4.2. Electrical Anisotropy

4.2.1. Impedance Phase Split

In cases where a dipping boundary from the surface to depth could create a phase split, convergence towards the same values of phase split values should be observed for MT sites close to that dipping interface. The lack of this convergence for long periods along entire 2D profile may exclude this hypothesis. Consequently, the anisotropy hypothesis may be preferred for the long periods.
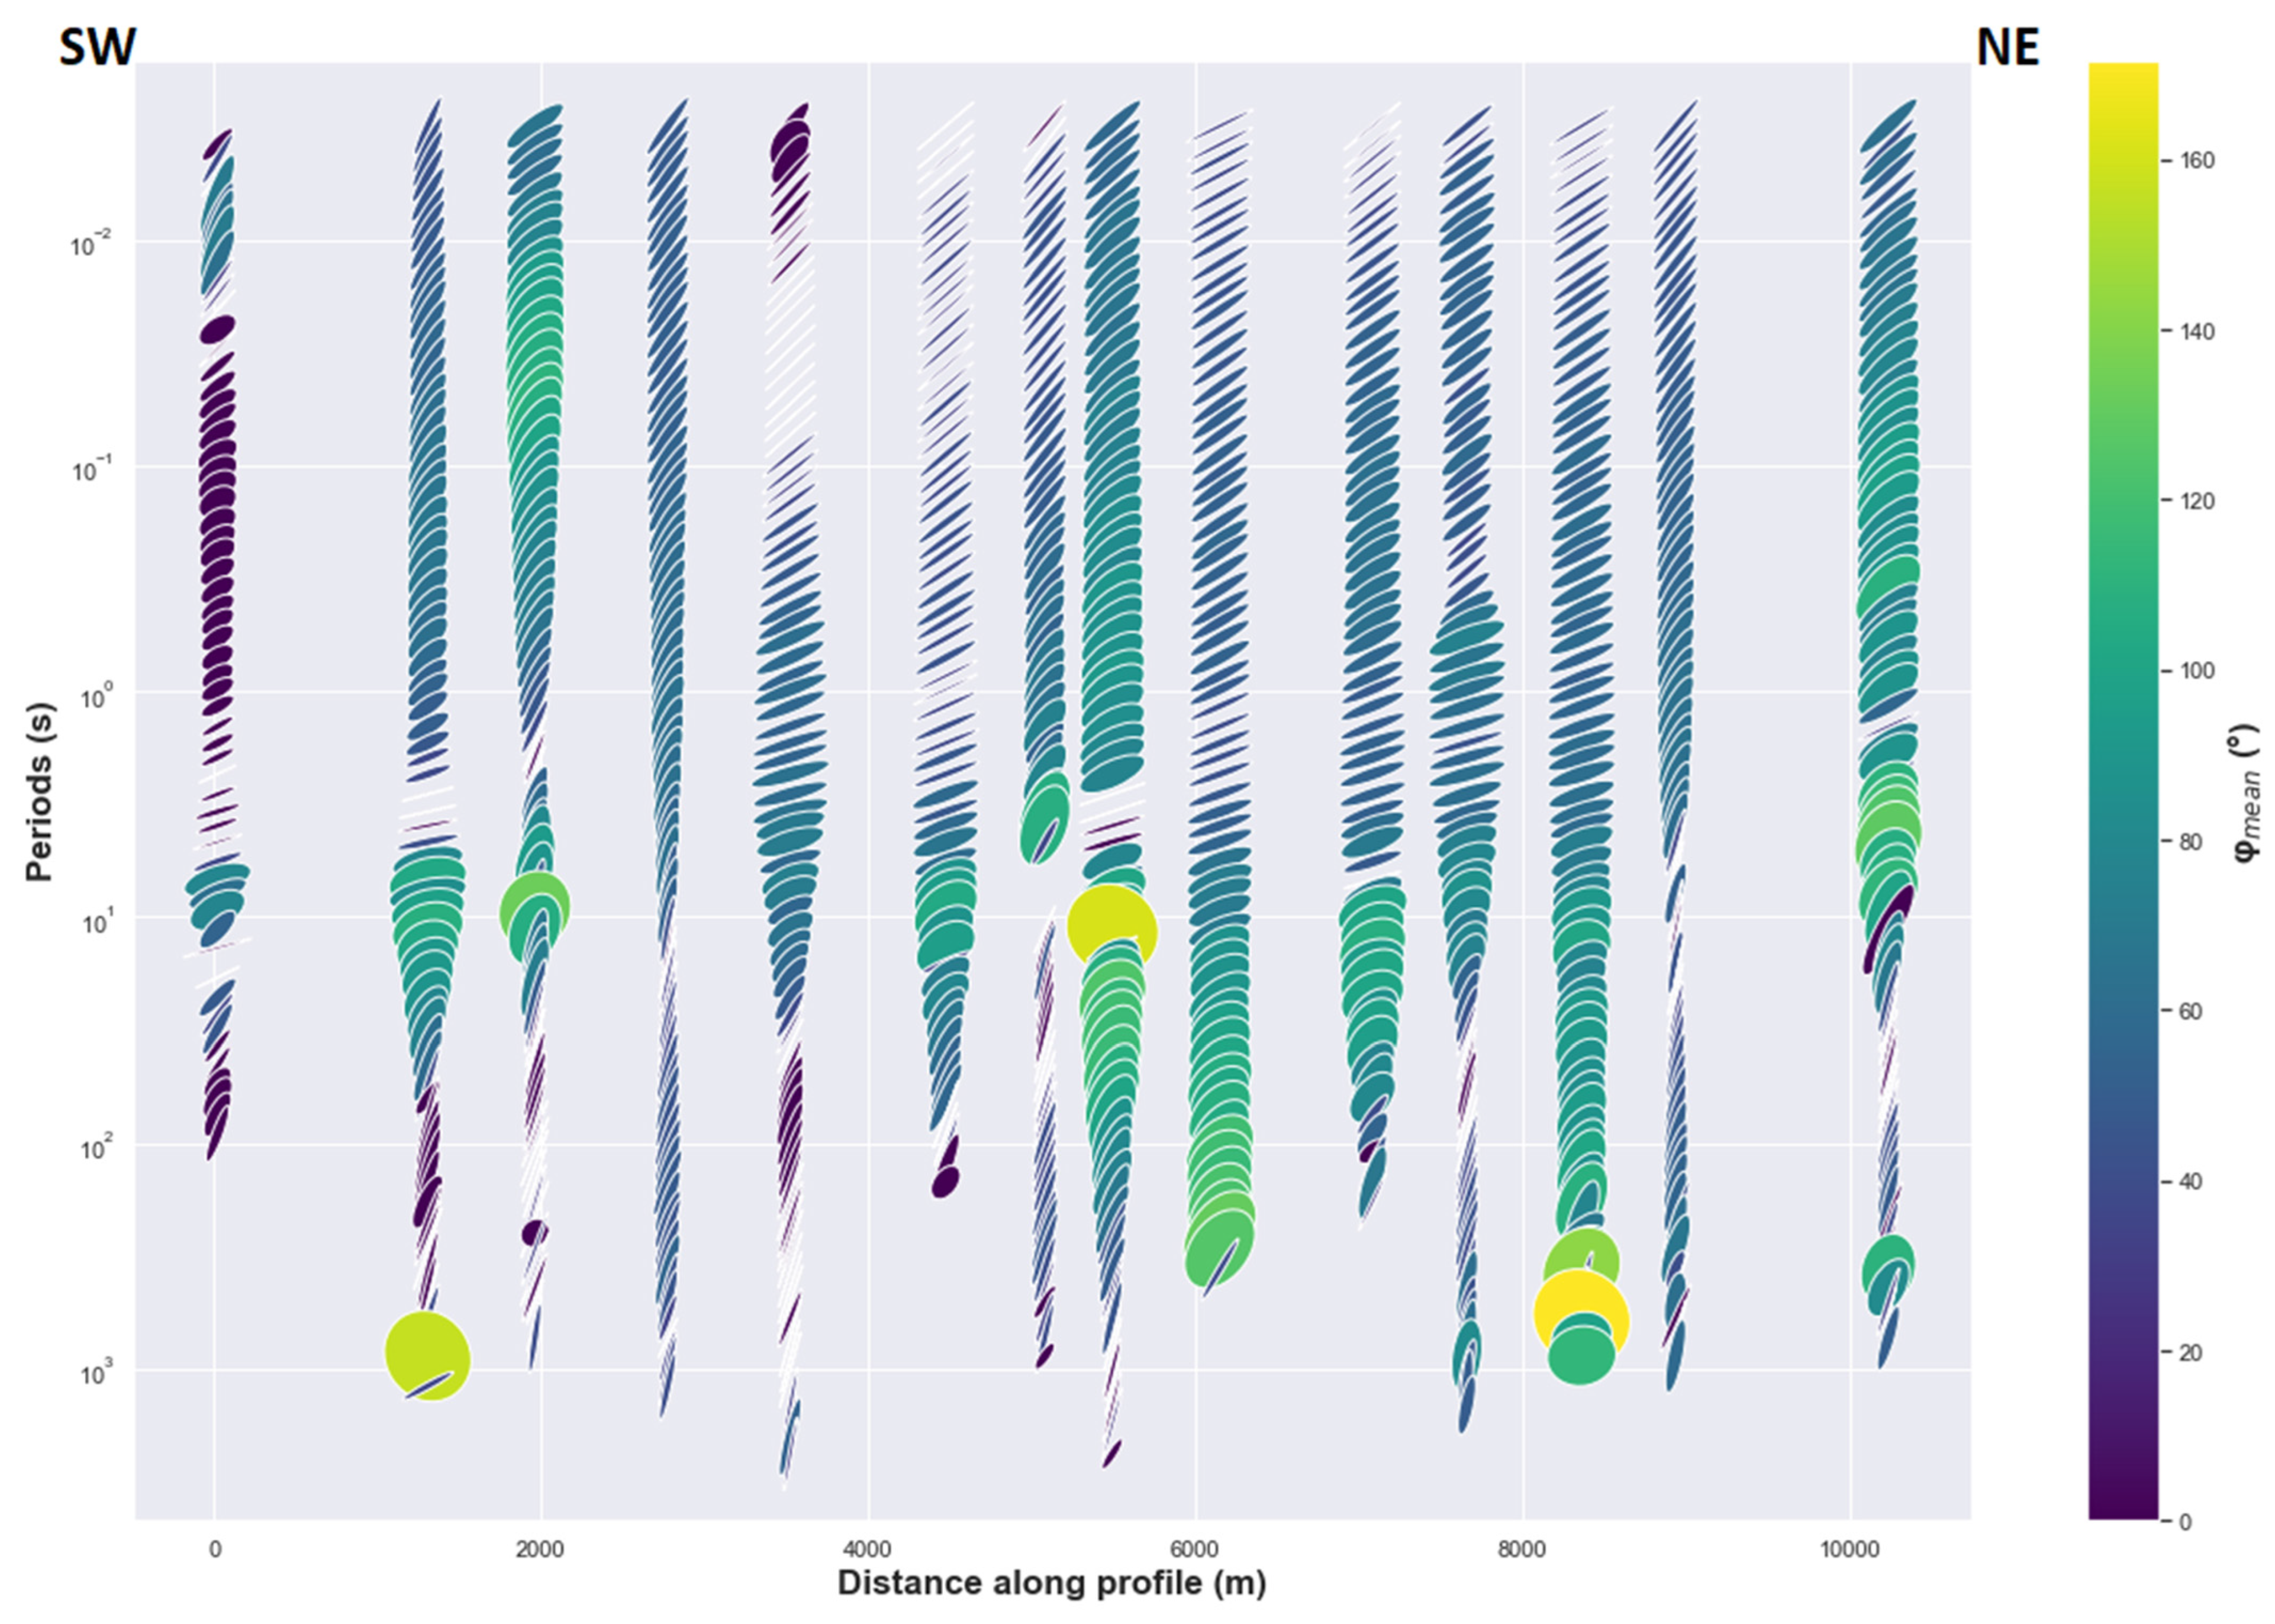
Furthermore, if a consistency of phase split along a 2D profile and with multiple stations is observed as shown in Figure 6, the presence of anisotropy is an interpretation that is preferred to the lateral variation of conductivity [28,39]. This can be explained considering the idea that if the lateral variation is the cause, the phase split should decrease or disappear for the MT sites far away from any lateral resistivity gradient. This is not what is observed in Figure 6, whereby the phase split remains for a range of periods and with most of MT sites along entire 2D profile. It is thus reasonable to attribute this to the electrical anisotropy of geological structures at the corresponding depth. Additionally, the period range (long periods) where the degree of phase split is large corresponds to the period range where an approximate constant geoelectrical strike is well defined for all dimensionality analysis methods described in Section 3.2. This preferred direction of regional electric fields is roughly north-south and remains almost constant for the entire range of periods where the phase split is manifested. The same pattern was demonstrated by [39] to indicate the presence of dyke in anisotropic crust. It is obvious that at the center of the rift the degree of phase difference is more pronounced and increases with depth.

4.2.2. The Ellipticity of the Phase Tensor

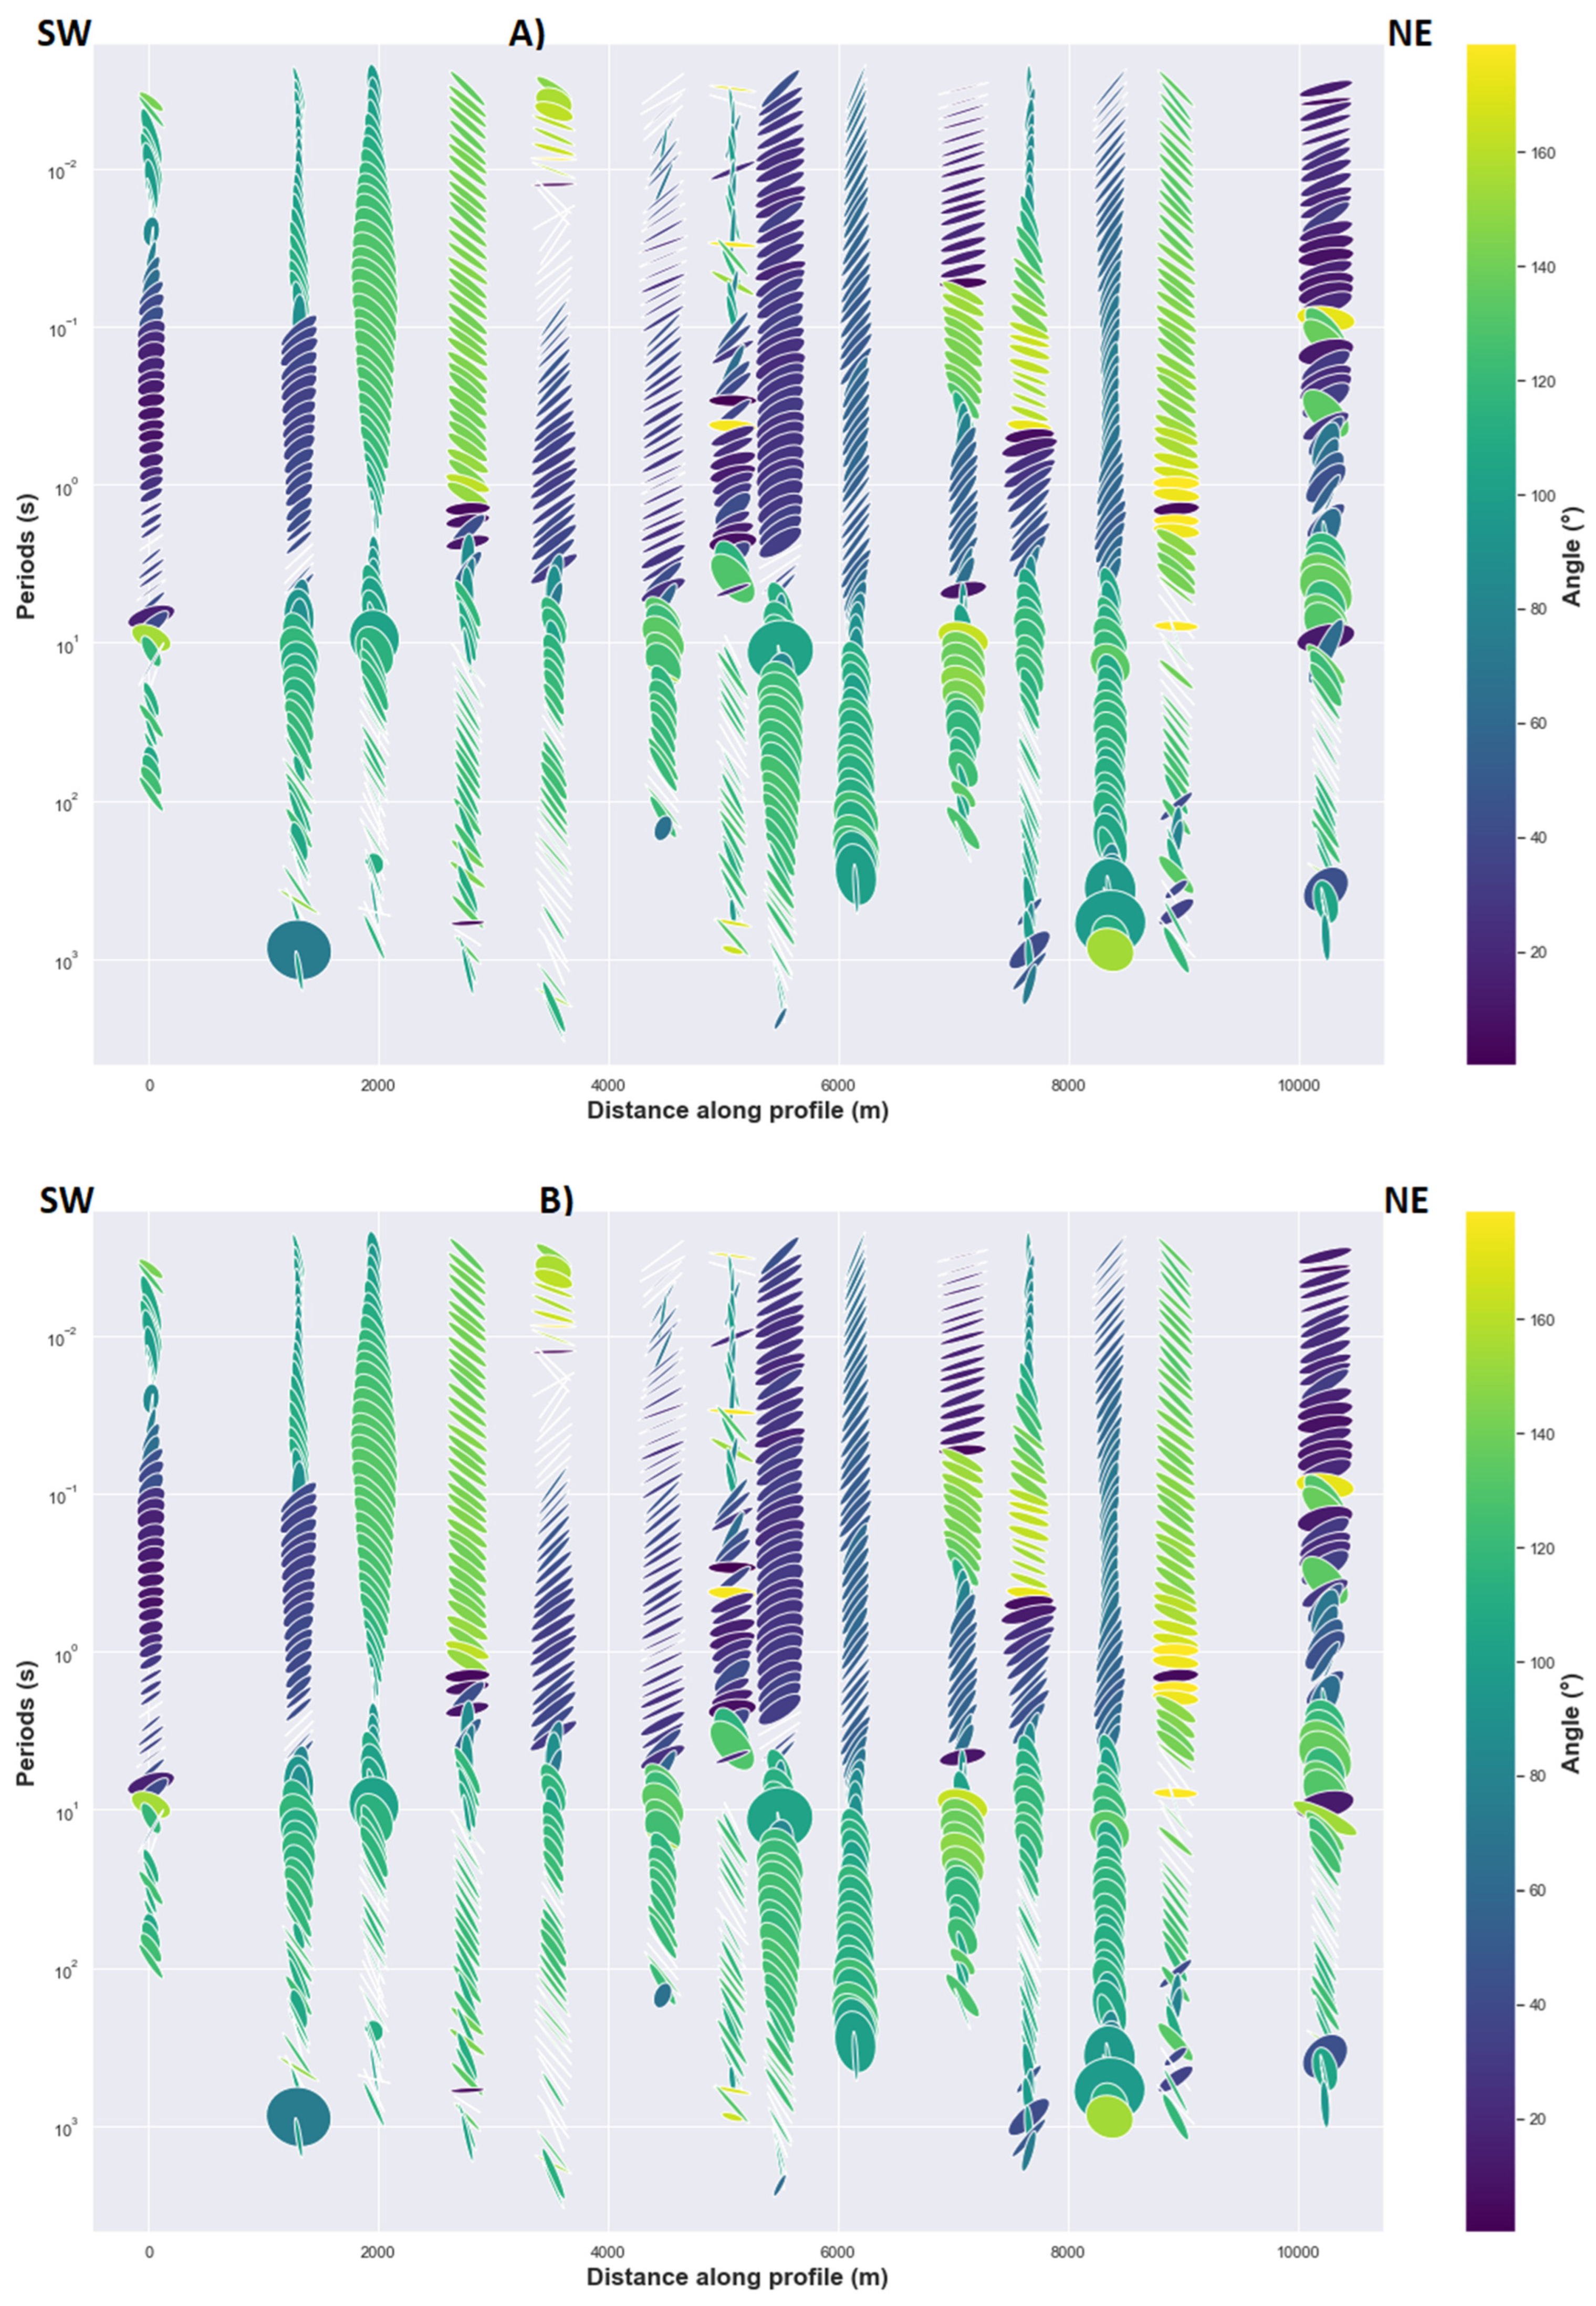
Evidence of the phase split can be observed in the presence of anisotropy for the long periods where near surface galvanic distortion has less effect on the regional phase response. In general cases, this phenomenon can be hidden or difficult to observed for the short periods due to the near surface galvanic distortion effects which are significant [24]. Thus, phase split derived from impedance phase is distorted in the same way as the impedance tensor is distorted for the short periods, whereas the phase tensor is not affected by the galvanic distortion for both the long and the short periods [22,24]. The maximum and minimum phases of the principal values of phase tensor [22,27] are invariant quantities, and their geometric mean φmean can be calculated to determine the magnitude of the phase tensor response. Moreover, the ellipticity of phase tensor can help to assess the presence of electrical anisotropy [24]. The major axes of ellipses are generally oriented N43°E at short periods, but for the long periods their direction tends to be north-south (Figure 7). Furthermore, ellipticity and the shape of ellipses for many MT sites are related to the phase split between the xy and yx polarization in a regional 2D resistivity where the minor axis of the ellipse decreased. The consistency of this feature at many periods (Figure 7) may be produced either by 2D conductivity structure or electrical anisotropic medium or an interface between isotropic and anisotropic medium. Logically, single large 2D electrical heterogeneity is not expected at depth in the study area over the entire 2D profile that can generate the consistent ellipticity because there is not one unique direction of induction vectors in Figure 5 that support the assumption of single large 2D electrical heterogeneity. Consequently, the potential cause of this consistent ellipticity with approximate preferred direction can be explained by the presence of anisotropy. The greatest values of the geometric mean φmean =max * Φmin)1/2 that are coincident with obvious ellipticity are observed for intermediate and long periods in the center and in the north-east indicating conductivity increase (Figure 7). The pattern displayed by the values of φmean is somehow different for MT sites between the center and the south-west where this pattern is more localized for the intermediate periods. A relative increase in φmean values appears in some MT sites in the center, south-west and north-east for short and intermediate periods, which can be interpreted as high contrast resistivity inside a macro-anisotropic medium and the surrounding rocks for the corresponding periods. For long periods, ellipticity reduces in the north-east and at the center of the rift, with an increase in φmean values. This increase in φmean values can suggest a possible interface between two anisotropic media with different geoelectric strikes and a high conductivity contrast between the two media where the deepest medium may be more conductive than the shallow medium (Figure 7).

4.2.3. Induction Vectors

The orientation of the induction vectors can be related to and depend on the presence of electrical anisotropy or lateral variation of the resistivity and the regional geoelectric strike direction. If the latter is not parallel to the eventual inferred anisotropy direction, it can also influence the direction of the induction vectors [24,40]. In cases where phase split and/or phase tensor ellipticity are generated by a lateral conductivity gradient that also generates induction vectors, a consistent correlation should be observed between the high magnitude induction vectors, ellipticity of the phase tensor and phase split (shown, respectively, in Figure 6, Figure 7 and Figure 8). High magnitude induction vectors seem to be confined to the intermediate periods and appear in a discontinuous form rather than in a lateral and continuous form that could be related to a large single 2D heterogeneity. That means the high magnitude induction vectors appears as a localized and isolated conductors along 2D profile having more elongated vertical scale rather than the lateral scale particularly at center of the rift (Figure 8). This pattern can also be related to the noise or uncertainty of magnitude induction data (Appendix A). On the other hand, a continuous phase split and consistent ellipticity are evidenced for the intermediate and long periods (Figure 6 and Figure 7) along the same 2D profile. High magnitude induction populated for the intermediate periods may explain high conductivity contrast related to the variation of geoelectric strike of short periods to the long periods, which corresponds to the two different directions of anisotropy (Figure 7). Moreover, the induction vectors may be deflected from isotropic layer to anisotropic layer or from two anisotropic medium having different anisotropy direction where anisotropy period dependent is generated by the magnitude of conductivity gradient or discontinuity between the two medium [40]. The latter affirmation may be hypothesized in the Asal rift case and that is why high magnitude induction vector exist at the intermediate periods between the first anisotropic medium corresponding for short periods and the second anisotropic medium for long periods. Additionally, a general pattern of low magnitudes induction vectors can be observed where a mean geoelectric strike is well-defined for each of both long and short periods (Figure 3, Figure 4, Figure 7 and Figure 8). Consequently, with this lack of correlation and the fact that 75% of magnitude induction vectors data are less than 0.2 (which can be interpreted as low values) except those related to the increase in uncertainty (Appendix A). Thus, in this case the anisotropy signature explains this data pattern and the idea that high induction vectors are generated by lateral conductivity gradient can be excluded. However, another possible explanation of the mechanism that can induce the high magnitude induction may be associated by the presence of oriented conductive dyke that intrudes inside relative resistive anisotropic medium, which in turn generate high magnitude of conductivity gradient between the conductive dykes and relative anisotropic medium. Evidence of vertical conductive zones that could be associated with dykes will be presented in the next section of the 2D inversion models.

4.3. 2D Inversion Models

Prior to performing a 2D inversion, a mean geoelectric strike of N45E direction was considered for the inversion models. Then, different inversions models were performed separately. Thus, inversion models of (TM): transverse magnetic field parallel to the structure or B polarisation, (TE): transverse electric field parallel to the structure or E polarisation, invariant model and (TE-TM): joint inversion of TE and TM modes, were run and data are rotated to a mean strike of N45E. The choice of geoelectric strike is not relevant for the derived apparent resistivity from the invariant impedance tensor as the quantity is invariant under any rotation angle and remain the same regardless of the geoelectric strike/rotation angle [26,41]. Inversion code performing Occam philosophy with finite difference mesh was used. This code is Occam2D and is an open-source tool which is available on MTNet. The number of MT stations inverted is 14 as showed by the 2D profile across the rift in Figure 1. The width of mesh cell is fixed at 100 m where the number of total layers is 100. The initial model was set to a homogeneous half-space with a resistivity of 100 Ωm. Another inversion model with an initial homogeneous half-space of resistivity of 10 Ωm was tested. The best final 2D inversion that fitted the data with the lowest RMS misfit was selected, which corresponds to the initial model of homogeneous half-space of 100 Ωm.
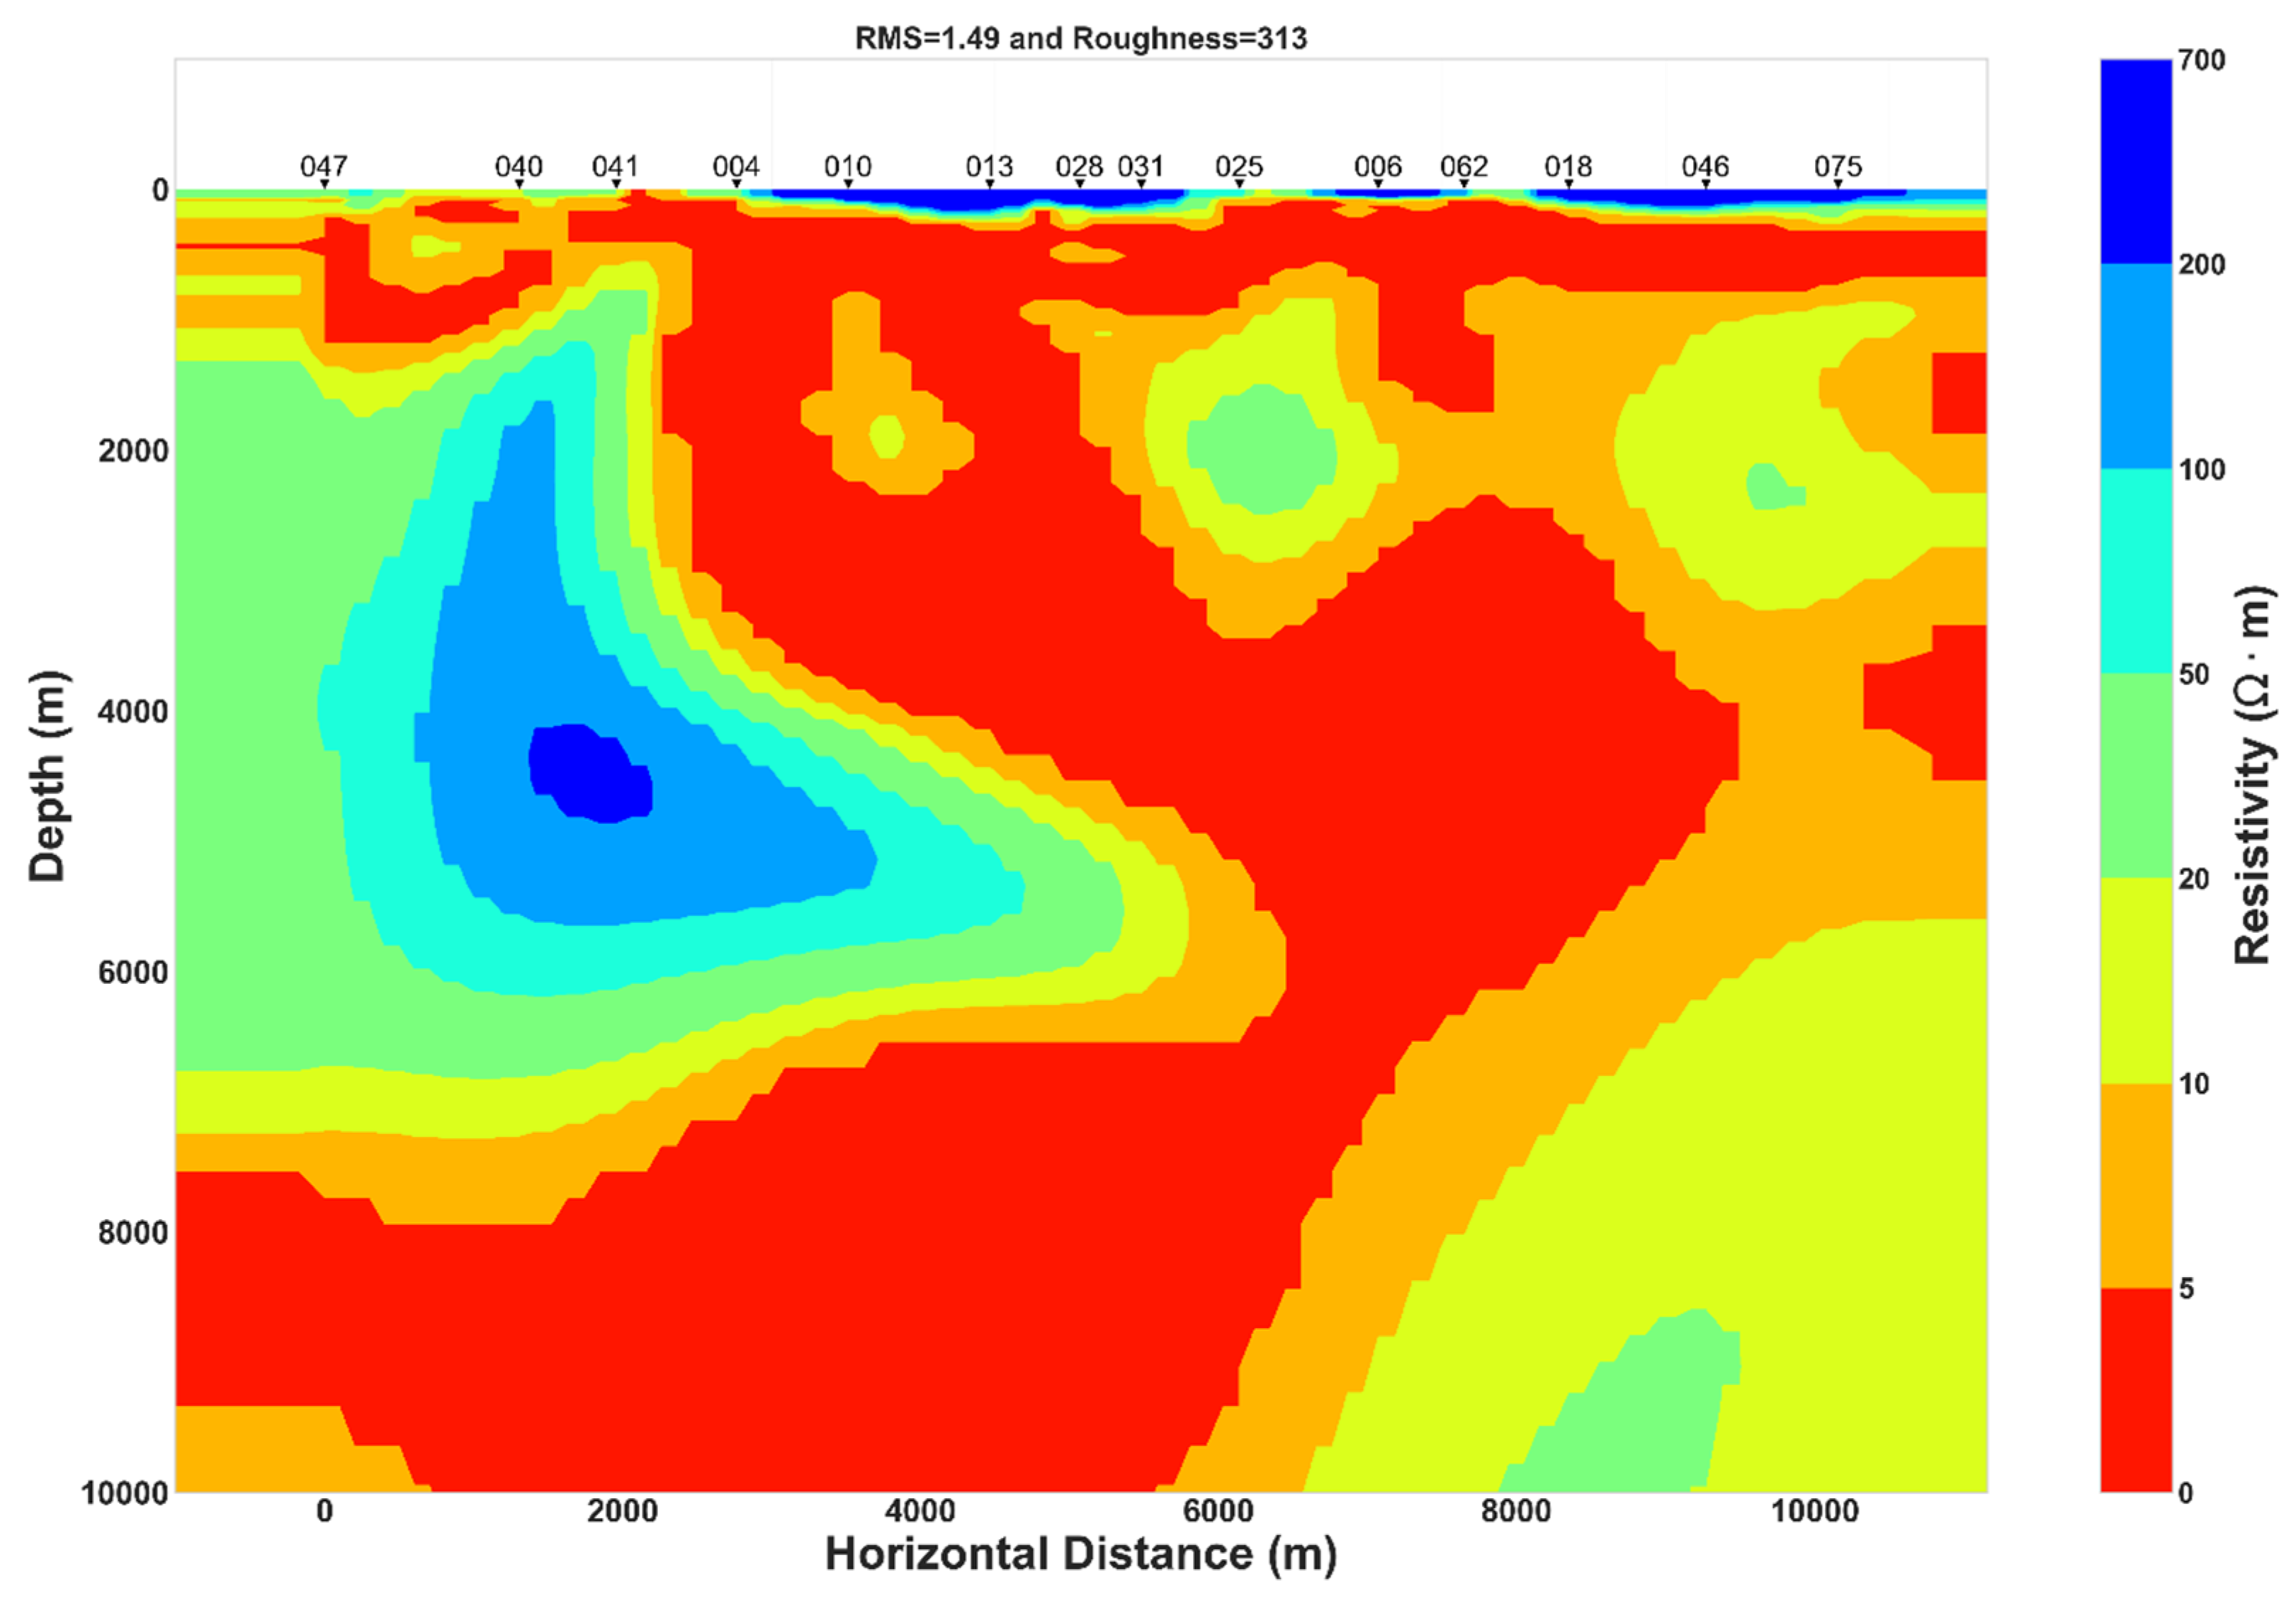
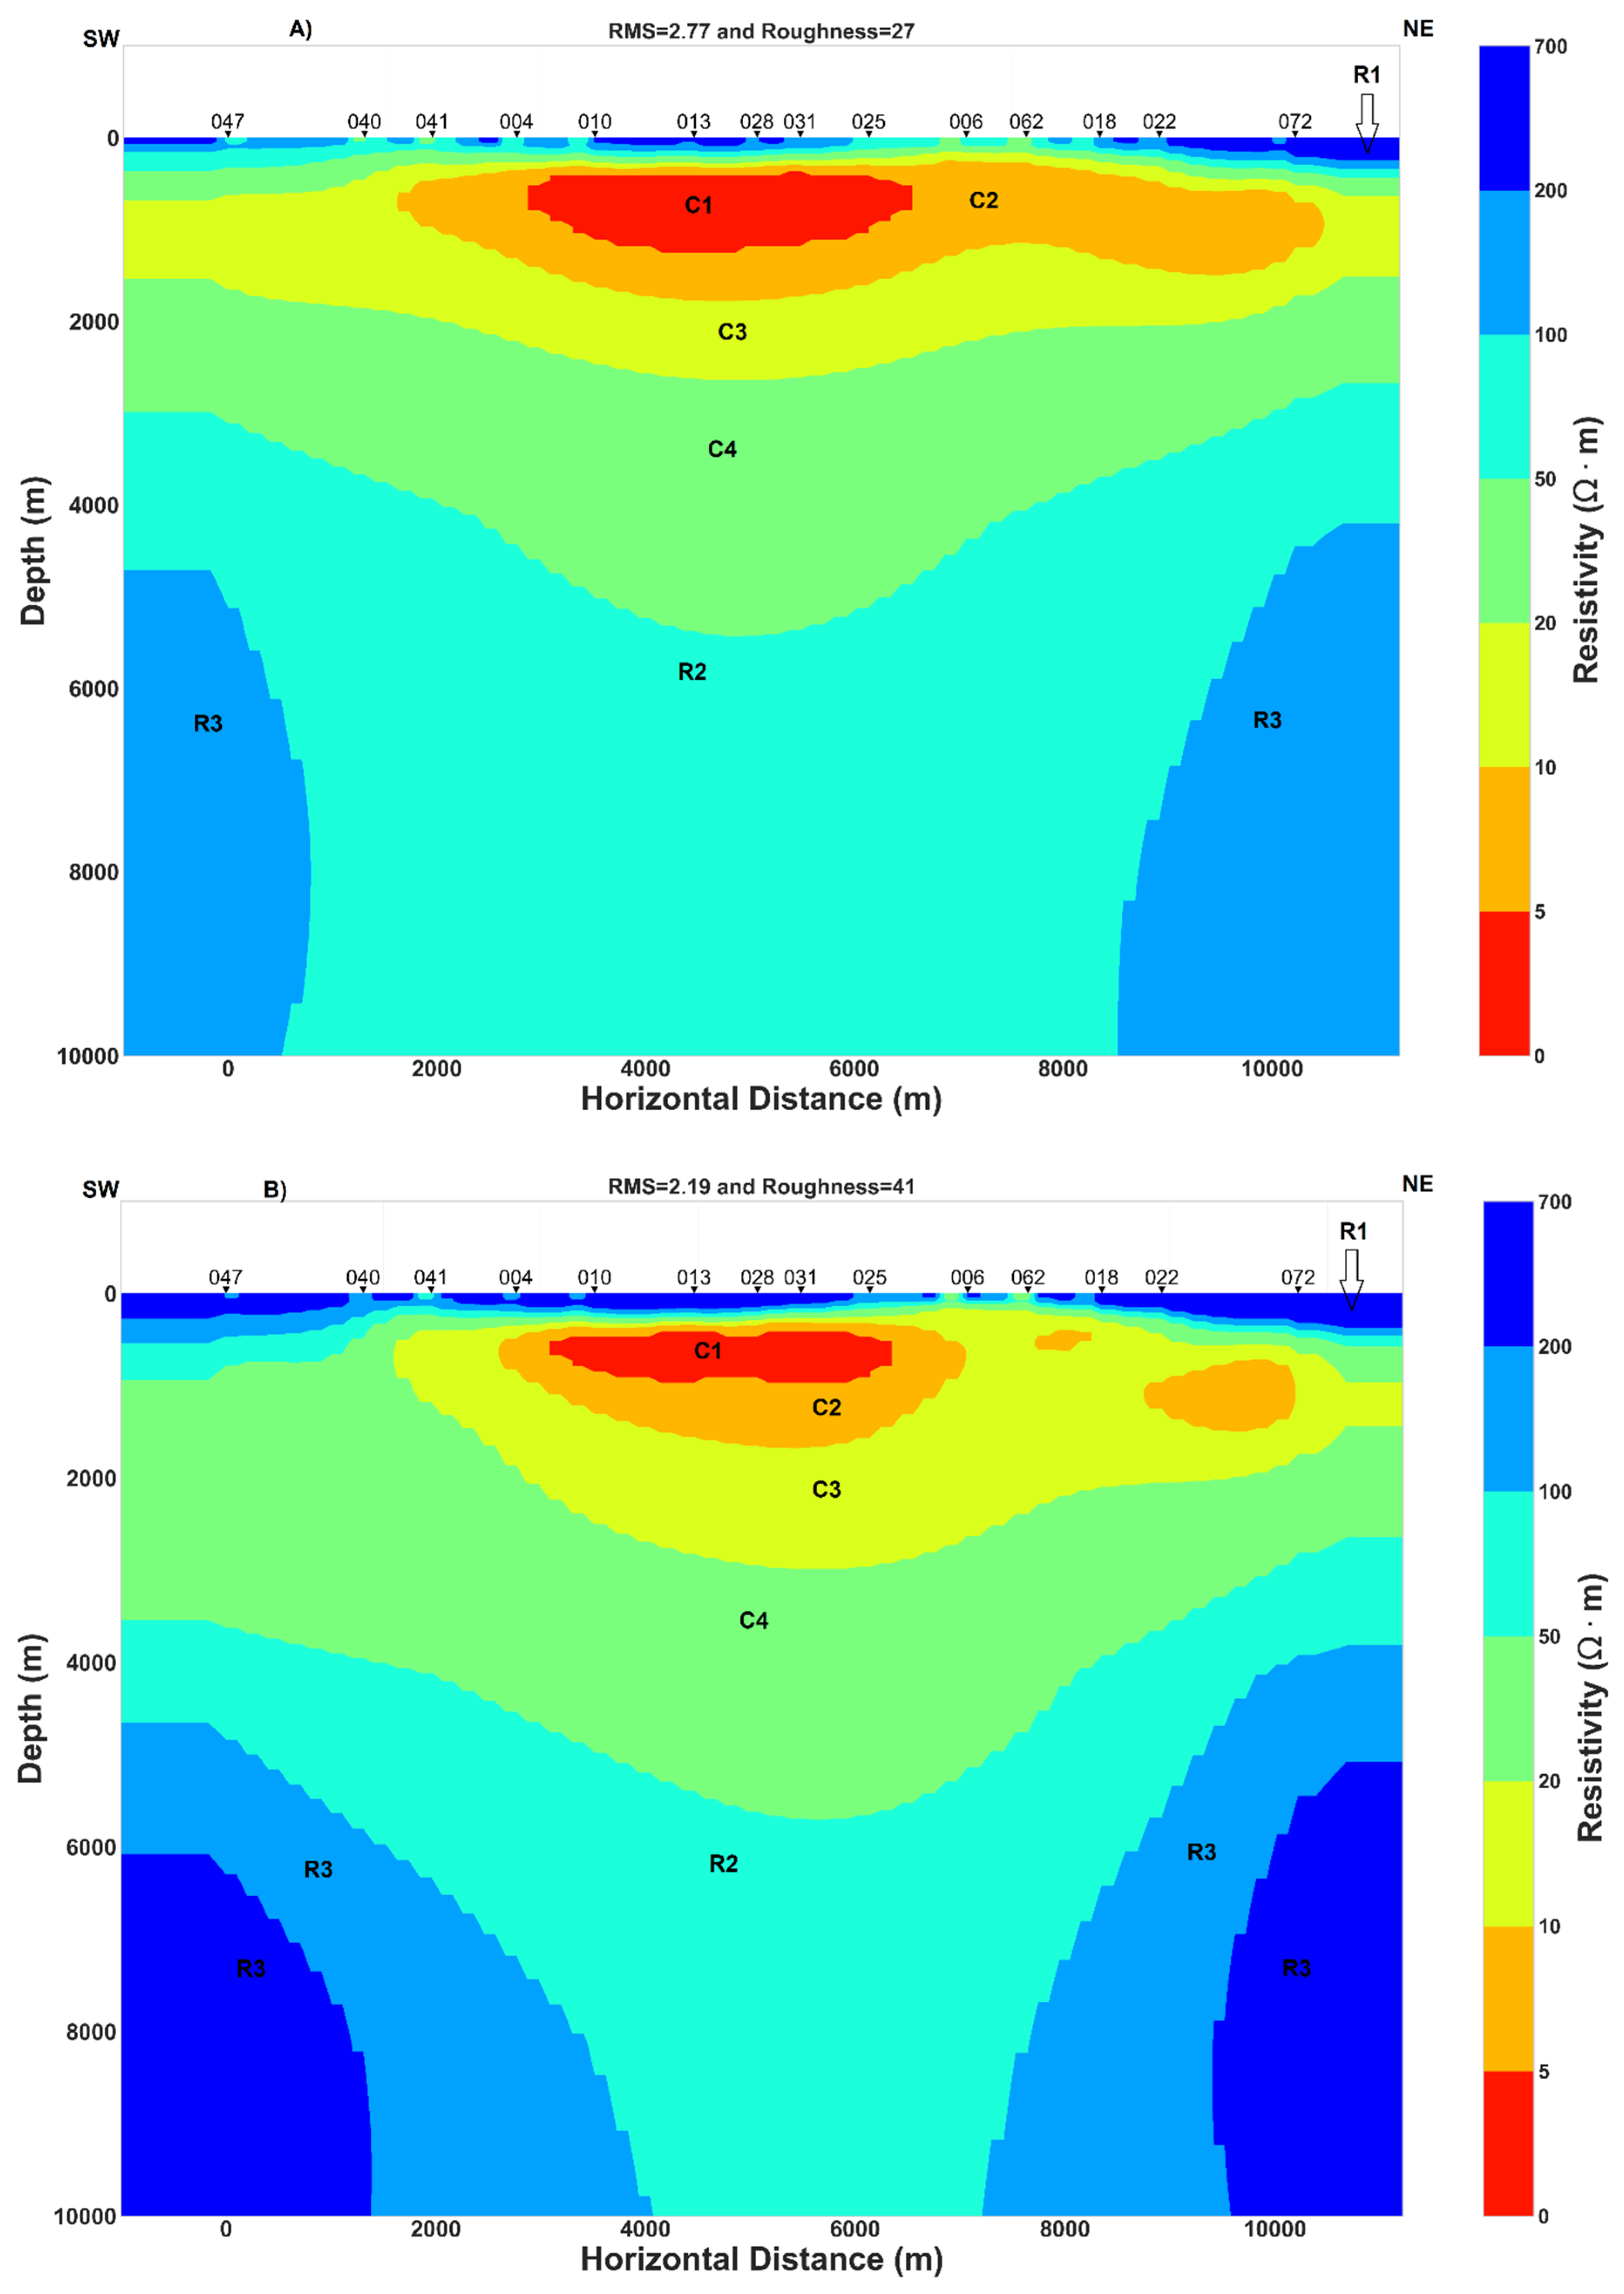
The results of the two models (TM and invariant) exhibit similar patterns of subsurface resistivity (Figure 9). While the TM mode is considered stable and robust, the TE data are very sensitive to the choice of geoelectrical strike and to the 3D effects of galvanic and inductive origin [42]. However, inversion model of TE data is presented in Figure 9 and the result is in agreement with the TM and invariant models. And higher conductivity is observed at the center of the TE model at a depth of 2 to 5 km. At the same time, the TE model displays lower resistivity at the shallow depth than the TM and invariant models (Figure 9). The mechanism that could generate this difference will be discussed in the discussion (Section 5). Due to the restrictions or limit of available 2D anisotropic inversion codes, a 2D inversion for isotropic models was used and followed the practical approach developed by [40]. The latter authors proposed that a 2D isotropic inversion model could resolve well macro-anisotropy or structural anisotropy when join inversion of TE and TM data are rotated to the anisotropy strike that coincide with the geoelectric strike direction and when the anisotropy ratio is higher than five. Joint inversion of TE and TM data rotated to N45°E is presented in Figure 9 while another joint inversion of TE and TM data rotated to N120°E is presented in Appendix A. As evidenced, the joint inversion model of TE-TM recovers the anisotropy signature as vertical conductive zone that can be interpreted as conductive dyke as proposed by [40].
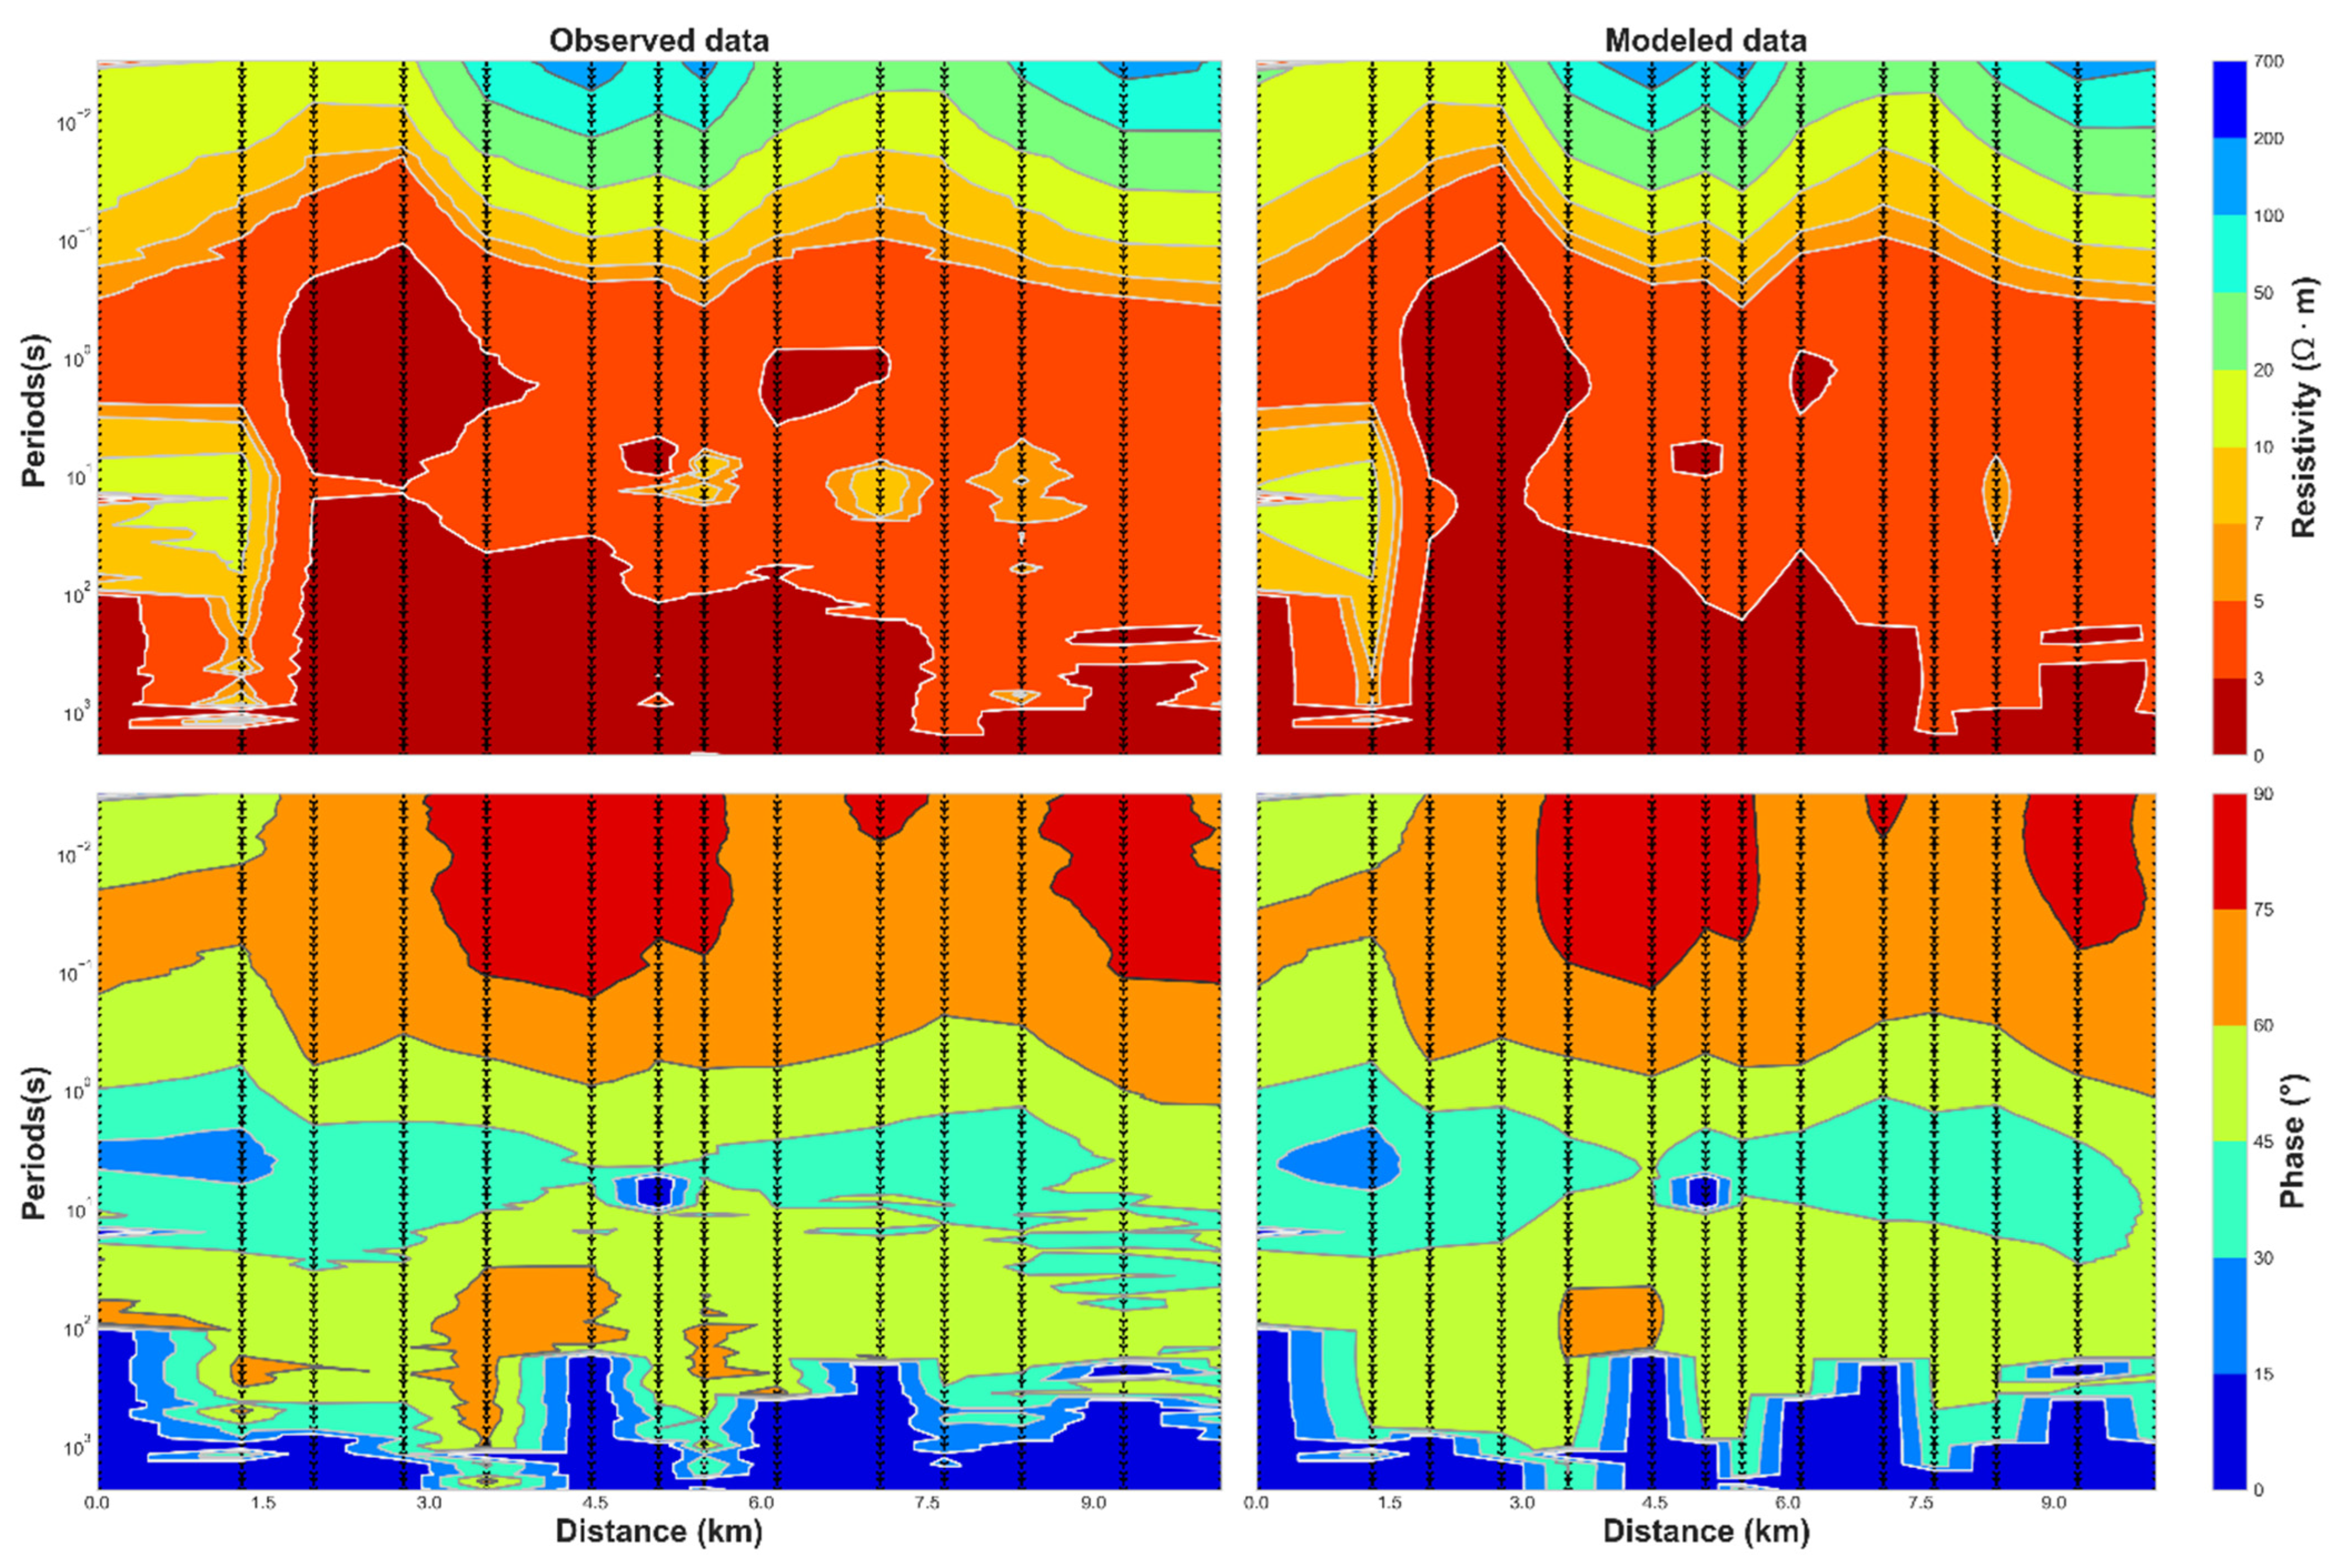
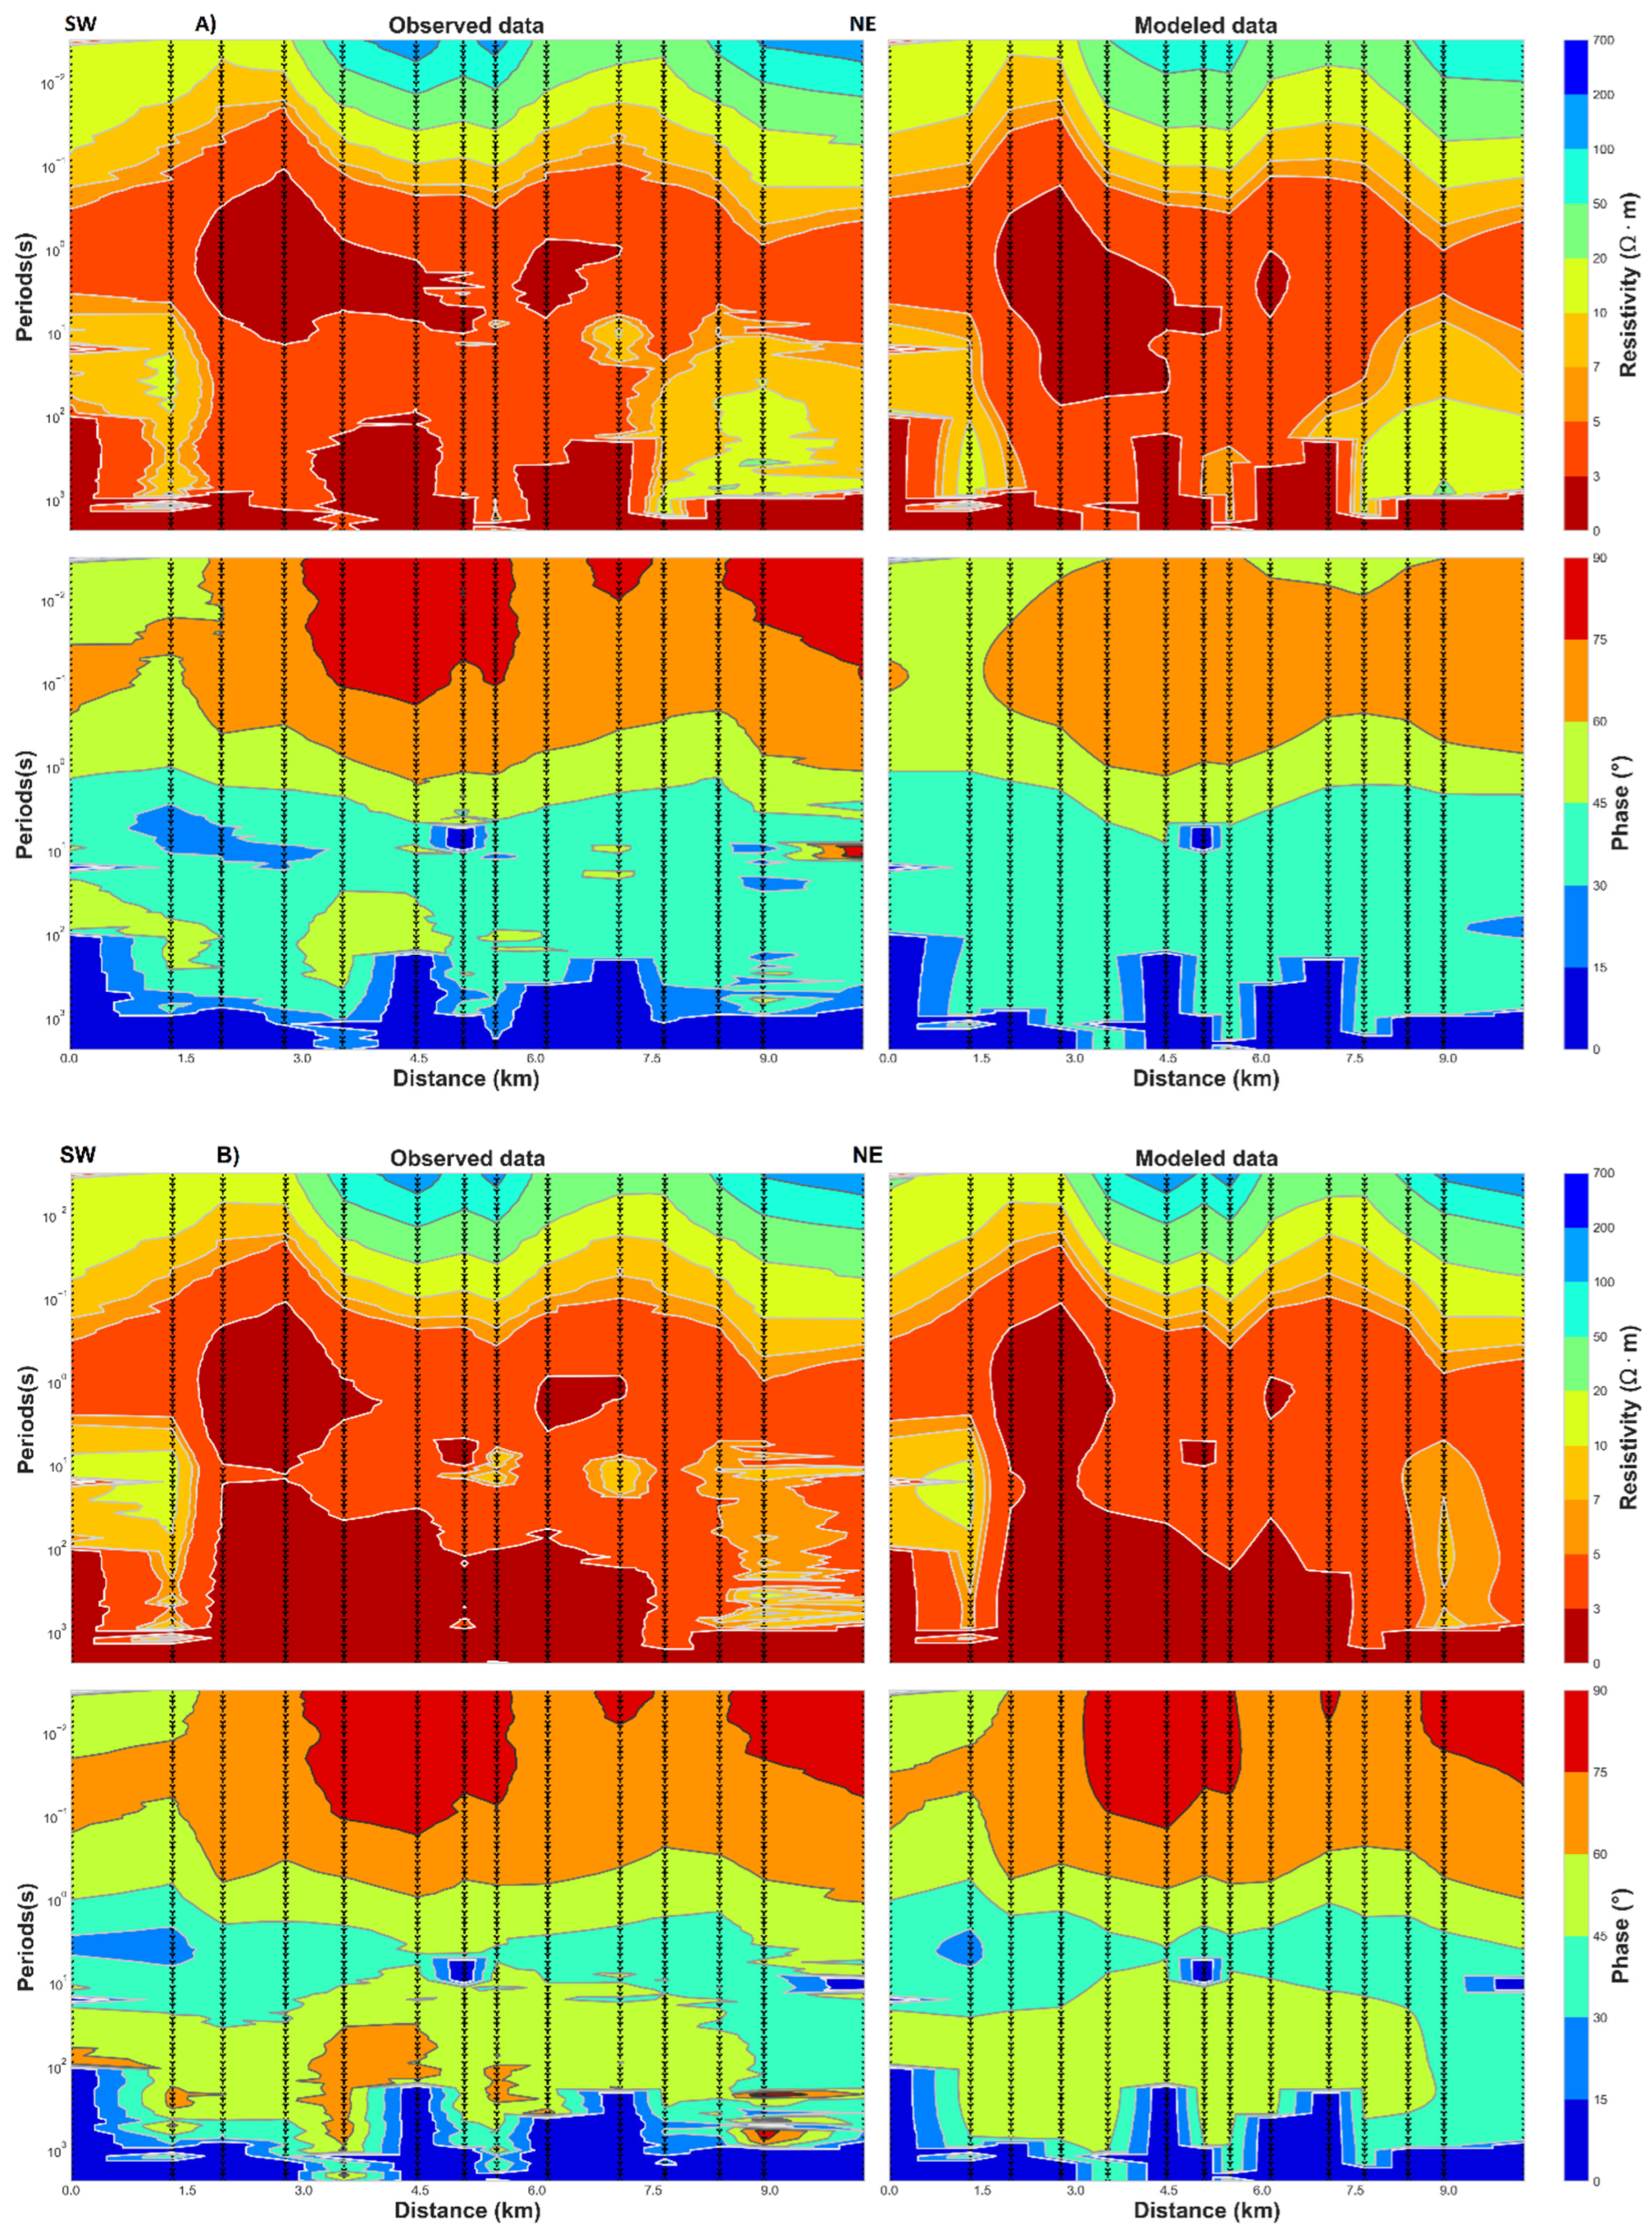
The resistivity pattern displayed in Figure 9 can be described as a succession of different subsurface resistivity from surface up to 10 km of the bottom model. The amplitude and phase of the observed impedance tensor data fit well with the model response (Figure 10). The dashed triangle indicates the position of the MT stations along the 2D profile (Figure 1).
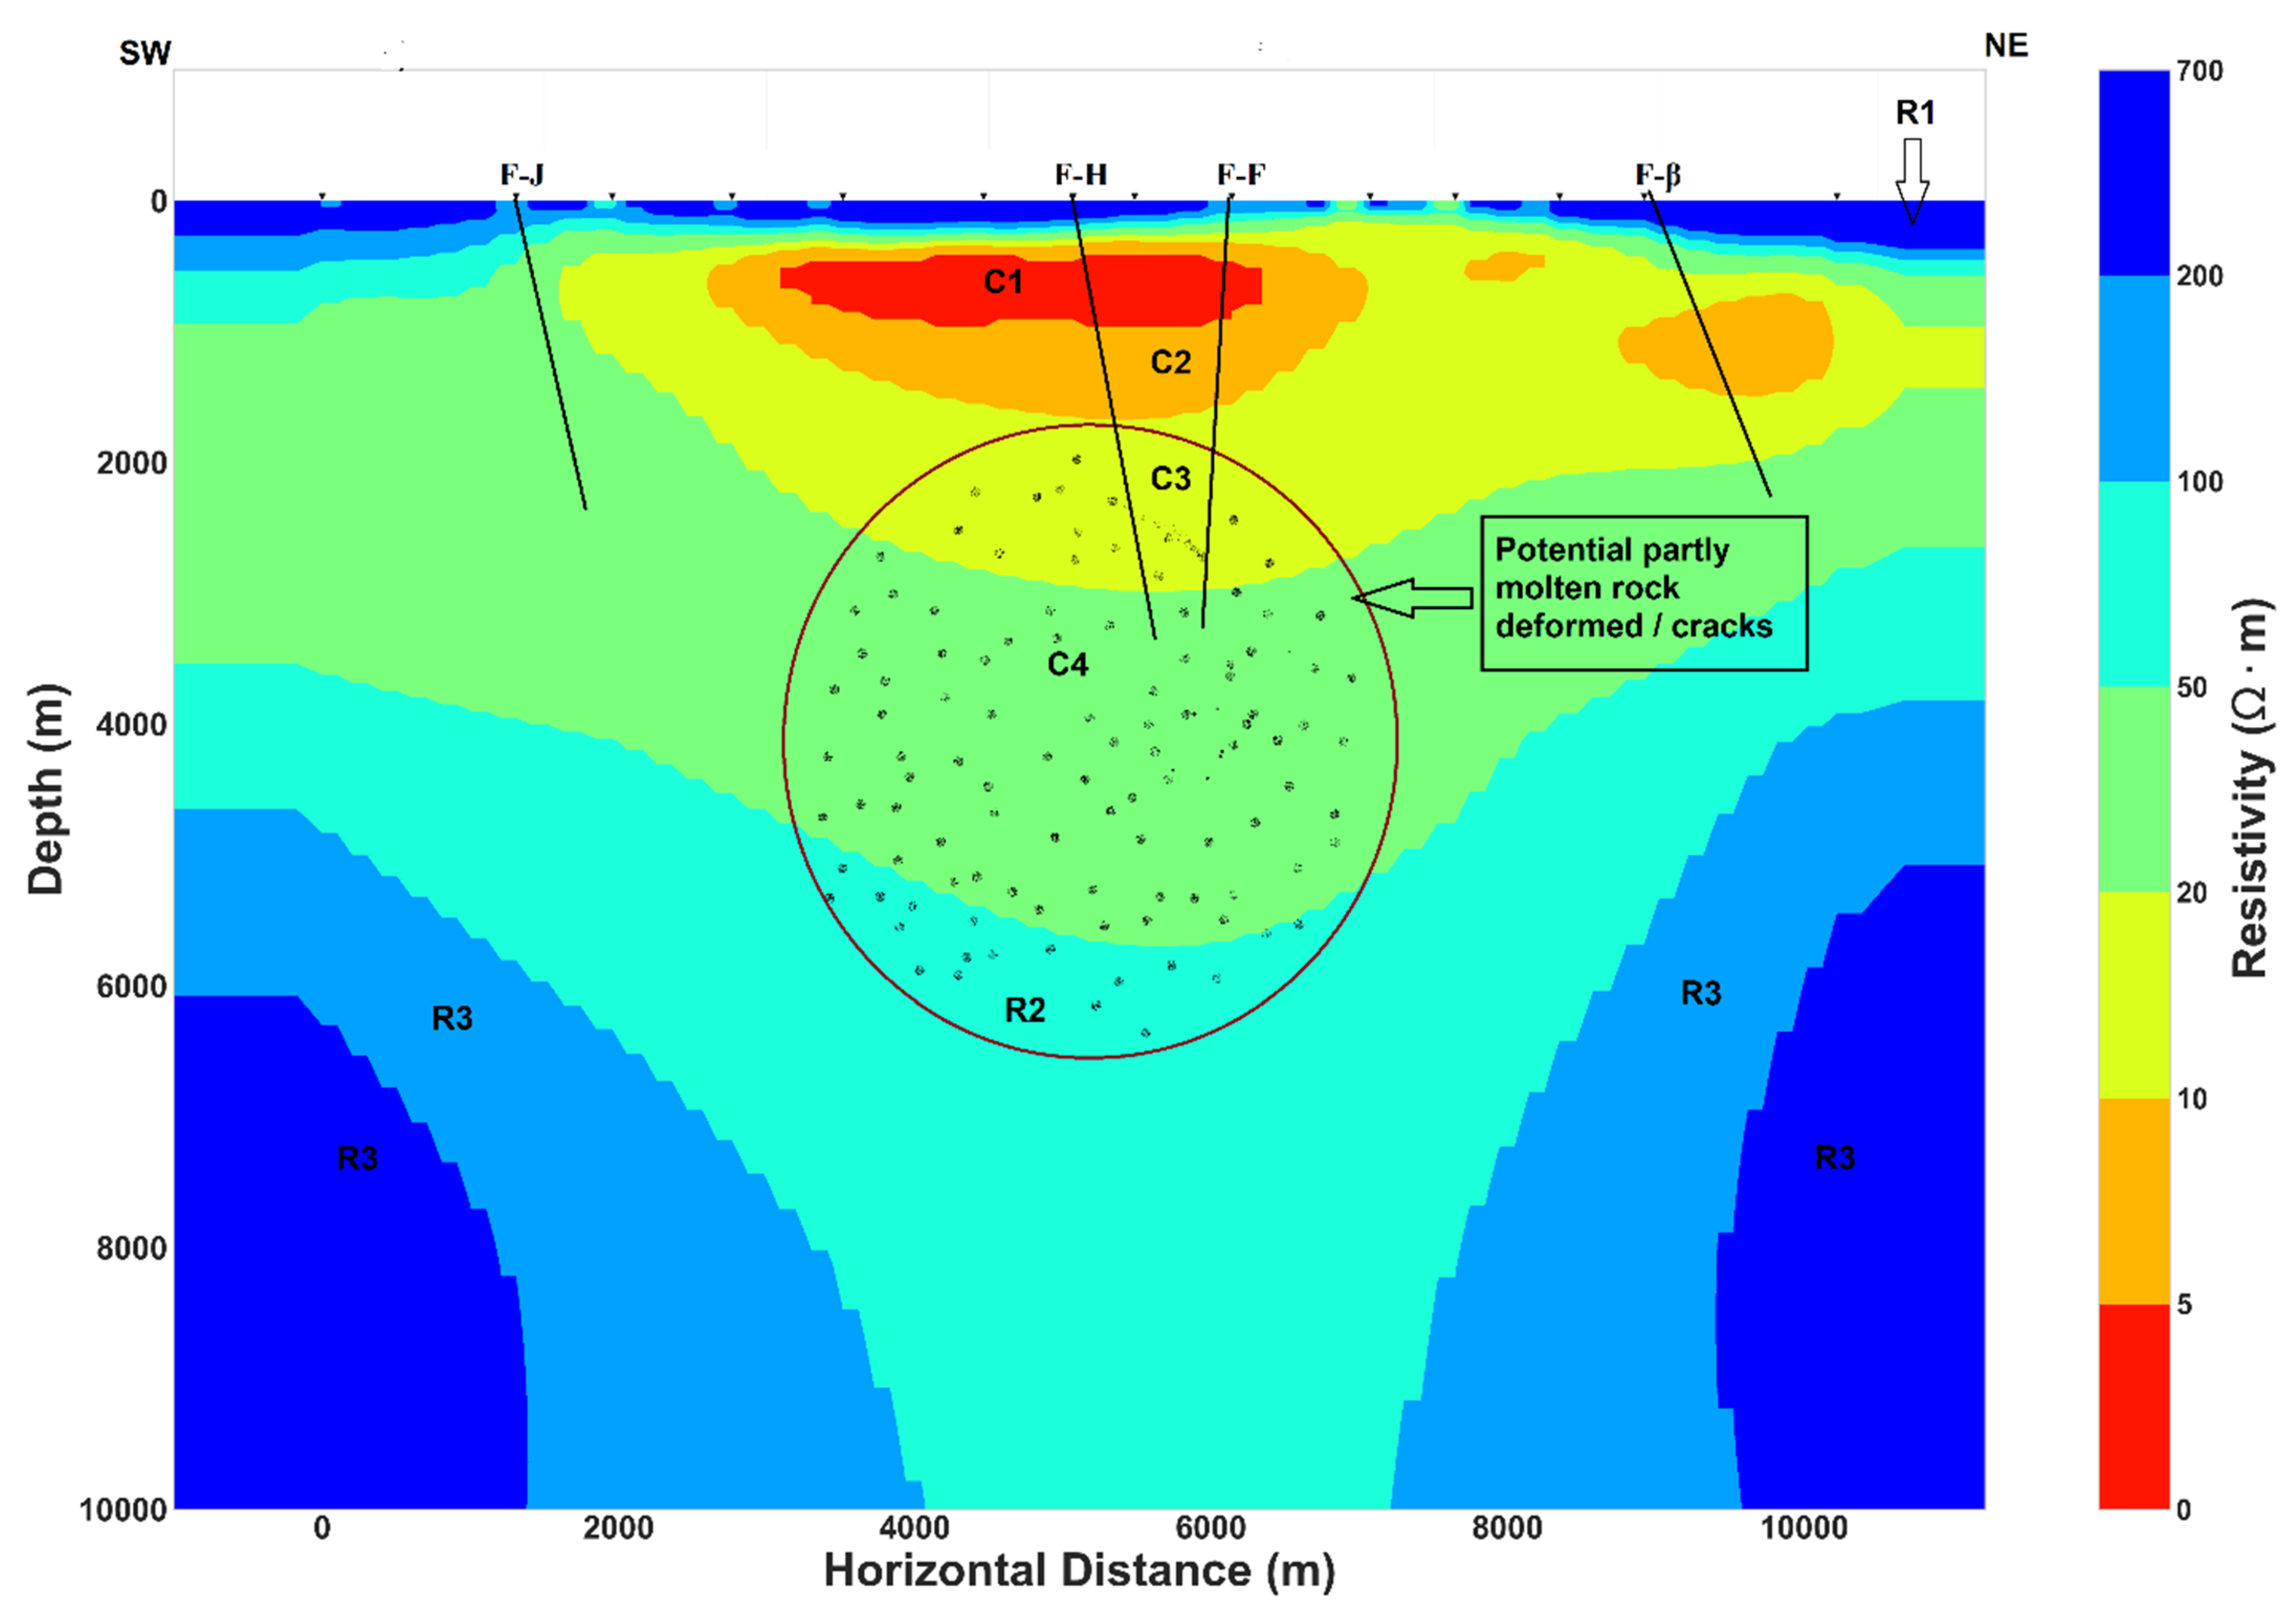
Near the surface, the high resistivity R1 layer can be related to the dry volcanic deposit close to the surface or to volcanoclastic rock with low water content. The thickness of R1 is almost the same in the north-east of the rift for both the TM and invariant models (Figure 9) but at the center of the rift and in the south-west, the invariant model shows a relative increase in the thickness of layer R1. While both models (TM and invariant) seem to have C1 layer of comparable width, it is a little thicker in the TM model. This high conductivity C1 layer can be the result of fluid trapped in the host rock. The C2 and C3 layers have a wider extension in the TM model than in the invariant model and their relative high conductivity could be interpreted as aquifers. The resistivity contrast between R2 and R3 can be related to the difference between a high resistive rock R3, which was perturbed by a localized hot ascendant material originating from the center of the rift that could be the expression of a magmatic fluid or melt having lower resistivity R2.
Comparing inversion results, the TE model and joint inversion of TE-TM model resolve better the conductive features (Figure 9 and Appendix A), while the invariant model and the TM model may resolve in reasonable way the conductive features (Figure 9). The same pattern and characteristic of TE, TM, joint inversion of TE-TM and invariant models was found by [43]. Moreover, the invariant model is less affected by galvanic distortion and is independent of the value of geoelectric strike and would be the best model. Additionally, previous studies concluded that stable TE inversion model or joint inversion model of the TE and TM data can better resolve both the resistive and conductive feature [32,42] and similar conclusions can be inferred from the results illustrated in Figure 9.
Results of two joint inversion of TE–TM data, one rotated to the geoelectric strike N45°E (Figure 9) and another one rotated to the geoelectric strike N120°E (Appendix A) display high conductivity areas at great depth. Those results with the 2D inversion models of TM, invariant and the TE model (Figure 9) have some similarities and consequently, regional 2D conductivity structure approximation can be considered to explain the subsurface geoelectric structure beneath the Asal rift.

5. Discussion

5.1. Geoelectric Strike Direction Dependent of the Periods

5.1.1. Comparison of Geoelectric Strike with Strike Determined from Other Studies

Magnetotelluric data analysis allowed us to infer the subsurface conductivity structure with evidence of defined geoelectric strike and anisotropy direction beneath Asal rift. The strike orientation estimated from the phase tensor for short period is north-east close to N40°E, whereas for the long periods it is north-north-east (Figure 3). While the geoelectric strike derived from both the invariant impedance and decomposition model showed the same results, a mean strike direction around N120°E can be deduced for the long periods (Figure 4). The majority of the induction vectors are parallel to the geoelectric strike derived from phase tensor with low skew angle (Figure 5). The latter is generally described as a consequence of a dominant 2D regional conductivity structure in the area [22,25]. Structural, geological and bathymetry studies conducted in the Asal-Ghoubbet indicated average strike of fissures and normal faults of N125°E [13,15,19]. Seismicity was recorded from 6 November to 10 November 1978, with epicenters trending along a N120°E alignment in the Ghoubbet Bay [13,19], which is believed to correspond to the direction of the dyke injection. The seismicity continued for 60 days after the 10 November 1978 event, in the eastern part of the Asal-Ghoubbet rift, particularly in the Ghoubbet Pass and the transfer zone between Asal-Ghoubbet and Tadjourah submerged rift segment [13]. In addition, telluric field polarized in the direction of N100°E was determined by [5] with the Telluric-Telluric (TT) method. This strike is close to the average strike determined from the decomposition model and the impedance invariant for the long periods and can be considered an approximate strike with the strike calculated from the phase tensor for the long period. Furthermore, it is surprising to note that some MT stations have an average strike of N120°E for the short periods (approximately at the depth of upper and lower crust) and those MT stations are close to the Major and Minor faults (Figure 1 and Figure 4). This indicates that a causal relationship between diking, striking, fracturing and dipping may exist. Moreover, in both Asal and Ghoubbet, normal faults are dipping to the north-east direction [15,19] and the mean strike calculated from all dimensionality analysis for the short-intermediate periods is approximately north-east and north-north-east (Figure 3, Figure 4, Figure 5 and Figure 7). Seismological studies have proposed a dipping angle of N50°E for normal faults far from the rift axis and also suggested sub-vertical dipping normal faults close to the rift axis [4]. Kinematics and 3D dimensional deformation of Fieale volcano (Figure 1) over the past 300 kyr indicated a spreading rate range of 17–30 mm yr−1 in the N40°E direction that mainly accommodates the separation between Arabia and Somali plates [16].

5.1.2. Origin and Possible Mechanism Inducing Geoelectric Strike in a Rift Context

Asal rift results from the westward propagation of Aden ridge and has an approximate extension rate of 17 mm yr−1 in the north-east direction, with many fissures and normal faults striking to the N120°E direction [13,17]. It can be argued that geoelectric strike estimated in this study and the strike determined from others studies [4,15,19] may have a common origin. It is likely safe to suggest that at the short periods, the geoelectric strike is the result of conductive shear zones which form as echelon structures and are perhaps cracks or fissures filled by fluids at shallow to intermediate depth corresponding to the upper and middle crust. Those cracks or fissures are mainly accommodated by the extension rate resulting from the horizontal deformation beneath Asal-Ghoubbet into the north-east direction (~N43°E). Additionally, the geoelectric strike estimated for the long periods is more related to the vertical deformation of the Asal rift (at lower lithosphere and/or upper mantle scale) due to the predominant activity of dyke/magma intrusion acting as a highly conductive medium. Then, dyke intrusion triggers the evolution and development of dipping active normal faults acting as conductive zones between the top of the dyke (the maximum depth reached by the magma pressure starting from the great depth to shallow depth) and the faults locations at the surface. This latter mechanism contributes to the subsidence of the volcanic rocks and may explain that both tectonic and magmatic activity controls the rift deformation and the rifting process at different depth scale. A geoelectric strike can be used to reveal structural hints at depth, lateral variation of shallow or deep geological structures, shear zones and can be used to understand the mantle flow. In a similar geological rifting context of Asal rift such as the Kenya rift located in the East African Rift system, a geoelectric strike that varies with periods and with site location has revealed hidden structures at depth where the geoelectric strike of north-south for short periods is interpreted as conductive sediments and the northwest–southeast striking for the long periods was interpreted as conductive lineaments [11]. Moreover, in an extensional area of Great Basin-Colorado, geoelectric strike determined from the MT phase tensor was interpreted as a faulting trends in the upper-middle crustal basement controlling the Paleozoic and Mesozoic uplifts [42]. That latter authors found a good correlation between the direction of induction vectors and phase tensor strike to justify the presence of dominant 2D structure as in the case of this study (Figure 5), which is an interesting similarity between the two extensional areas.

5.2. Two Main Directions of Anisotropy Varying with Depth

5.2.1. Presence of 2D Anisotropic Structure

A straightforward method to identify electrical anisotropy is the presence of consistent phase tensor split with low values of magnitude induction vectors [24,39] as shown in Figure 6 and Figure 8 for short periods. However, for the long periods, degree of consistent phase split is more important (Figure 6) and a moderate to low values of magnitude induction vectors is present for periods greater than 70 s (Figure 8) that can be interpreted again as anisotropy effect from 2D anisotropic structure or 2D heterogeneity. Furthermore, the high regional skew is influenced by induction and is related either to 3D inductive effects or to anisotropy [21,29,37]. Consistent correlation between high regional skew and the high magnitude induction vectors (Figure 2 and Figure 8) may result from a common origin that could be the consequence of the 2D anisotropic or 3D structure in the study area. Indeed, consistent and slightly varying geoelectric strike for the corresponding range of periods should not expected if a 3D conductivity structure was the origin of the consistent correlation between high regional skew and the high magnitude induction vectors. Moreover, the author argue that the common origin between them could be the anisotropy signature notably 2D anisotropic, since the moderate to low value of magnitude induction vectors exclude the assumption of the presence of a 1D anisotropic structure in which the absence of tipper is expected [24,25]. For the short periods, the consistent ellipticity of the phase tensor with the relative moderate values of geometric mean of the principal values of the phase tensor that has a well-defined geoelectric strike of N43°E (Figure 7) on one side, and the minor phase difference between the two polarizations (Figure 6) on the other side, can be interpreted together to linked to the presence of regular and homogenous anisotropic medium. Additionally, the assumption of absence 2D isotropic structure as in the case of this work, is evidenced by the values of phase tensor skew angle (Figure 5) greater than zero [25]. The latter author also suggested that a nonzero phase tensor skew angle can indicate structure having azimuthal anisotropy varying with depth if 3D isotropic structures can be excluded. This suggestion is what can be proposed in Asal rift because a well-defined geoelectric and anisotropy directions in both short and long periods (Figure 7) and a general low value of regional skew which is produced by 3D inductive structure can be inferred (Figure 2). For the long periods, the consistent moderate phase split, high regional skew and the high geometric mean angle of the principal value of the phase tensor (Figure 2, Figure 6 and Figure 7), notably for the MT stations close to the center of the rift (rift axis), can be associated with a pattern resulting from anisotropic medium which is more heterogenous, irregular and more conductive than for the MT stations located at the margins of rift (far from the rift center). A similar pattern was found by [44] in their study which argue that the middle crust conduction mechanism is governed by electronic conduction due to the graphite rather than electrolytic conduction.

5.2.2. Origin of Electrical Anisotropy and the Role of Stress Field

There is no published scientific work until now that studied crustal and mantle anisotropy in the Asal rift. However, in cases where consistent correlation between the geoelectric strike direction and the anisotropy direction exist as demonstrated in this study, it is likely a reasonable argument to suggest the presence of both paleo-stress field and actual stress direction in a geodynamic context such as the Asal rift where dynamic plates motion and magmatic activities co-exist and generate different direction of stress field [3,13,15,45]. In other words, stress field can change as plates motions can change their direction. Thus, it is likely possible to advance that electrical anisotropy direction in the Asal rift is mainly associated with the dominant stress field of plates motion. Indeed, the Asal rift is located at the junction of the three diverging plates (Somali, Arabia and Nubia), which result the westward propagation of Aden ridge, the jump of the Red Sea ridge into Afar depression and their interaction can change, rotate or alter the direction of plate motion over the geological time. The existence of a relic strain, possibly resulting from ancient continental collision processes, is interpreted to have induced a general alignment of olivine down to mantle depths beneath the continental rigid plate which in turn generally produce electrical anisotropy direction coincident with the surface trend deformation pattern that was preserved since the last tectono-thermal event responsible for the deformation [46]. Additionally, chemical and petrological analysis of Asal rift lavas indicated a presence of olivine with size up to 1 cm [47] and it is likely possible that hydrous olivine may exist in the upper mantle of the Asal rift that can cause electrical anisotropy as suggested in similar geodynamic context by [48]. Thus, the preserved traces of past and remanent directions of magmatic-tectonic activities can be determined from joint analysis of the geoelectric strike and anisotropy direction as proposed previously [46,48,49]. Moreover, combined magmatic-tectonic activities play an important role in defining the stress field direction where tectonic activity accommodates the extension, the preferred emplacement direction of recent volcanic materials coming from the cooling magmatic intrusion. Moreover, both magmatic-tectonic activities can likely change the orientation of old subsurface geological materials to the direction of the existing maximum stress that can be parallel to the maximum conductivity direction.

5.2.3. Electrical Anisotropy Direction Related to the Plates Motion

In others tectonic contexts such as the Asal rift, geoelectrical strike and electrical anisotropy direction were correlated and electrical anisotropy direction was interpreted to be linked directly or indirectly to plate motion direction, as discussed next. For instance, [50] found consistent correlation between shear wave splitting (SKS) direction and geoelectric strike direction in the same direction as the plate motion direction, and interpreted these observations as an upper lithosphere that contain thin anisotropic layers related to the paleo-subduction and a uniform and ductile anisotropic lower lithosphere. Moreover, consistent phase splitting and low magnitude induction vectors with a geoelectric strike direction oblique to the present day Indian plate-movement were associated with an anisotropic mantle [51]. The discrepancy between the geoelectric strike and the actual Indian plate-movement direction was interpreted by the effects due to the heterogenous and complex convection of the mantle or a resistance to mantle flow by the actual stress field of plate motion [51]. In active extensional at the Great Basin province of north-central Nevada, geoelectrical strike direction parallel to the initial direction of extension was found with small values of magnitude induction vectors that was interpreted as consequence of electrical anisotropy direction [52]. Furthermore, high conductivity direction which is consistent with the shear wave splitting was found to be close to the direction of plate motion of the western Europe [53]. Seismic activity and surface deformation produced by injection of magma into dykes are often occurring during rifting episodes where the velocity of plate opening is mainly controlled by the magmatic intrusion [54]. And intrusive activity mainly controls the faults system activity where magma plumbing system is key of primary control on the rifting process [55].

5.2.4. Electrical Anisotropy Direction Related to the Fluid-Filled in Oriented Fractures

In this section, the author discusses if the stress field that induces electrical anisotropy direction is likely a possible mechanism that can also generate fluid-filled oriented fractures or in shear zones in the study area. In the transpressional region, existence of shear zones with preferred orientation inducing electrical anisotropy direction is not unexpected. Indeed, in the early stage of transpression region, the degree of progressive shearing zones interconnected along strike may increase with the degree of electrical anisotropy and hence shears may act as elements of fluid-driven weakening and growth [56]. Upper mantle electrical anisotropy is mainly related to the presence of bound water allowing the diffusion of hydrogen [57]. Although, others mechanism as the presence of aligned high conductive mineral such wet olivine or hydrous olivine may cause electrical anisotropy in the upper mantle [48]. In contrast, dry olivine is only weakly anisotropic [58]. Finally, it is surprising to note that electrical anisotropy directions for both short and long periods determined in this study (Figure 3 and Figure 7) are in agreement with the electrical anisotropy direction determined in central Germany by [59]. The latter authors found that electrical anisotropy for the lithosphere is close to E40°N and electrical anisotropy direction of the asthenosphere is close to E72°N. Moreover, in the same area of central Germany, the origin of high electrical anisotropy observed, was interpreted to be likely controlled by hydrogen diffusion [59,60]. Thus, it is possible to hypothesize that the same condition mechanism associated with the hydrogen diffusion can exist in the context of Asal rift. Electrical anisotropy direction was found in the shear zone of Great Slave Lake in Canada [52] and the graphitic films along shear zones and wet olivine may be the causes of enhanced electrical anisotropy. Moreover, another possible explanation is that subsequent retrograde metamorphism can remobilize graphite during fluid-based leaching and redeposit it as vein zones or tabular textures [52]. However, presence of over pressured fluid and hydrated clays at the interface of tectonic plates inferred from 3D MT inversion were suggested to be the major factor controlling plate coupling [61]. Recently, in the Otway Basin of Australia, electrical anisotropy direction inferred from MT data was interpreted in terms of fluid-filled fractures oriented favourably for reactivation in the current stress field that resulted in enhanced electrical and hydraulic conductivity [62].

5.3. Subsurface Conductivity Structure and Associated Interpretations

5.3.1. Hydrothermal System and Fluid Circulation

Results from 2D inversion show the conductivity structure under the Asal rift, with a general pattern of relative conductive environment (C4 and C3) bounded at the bottom by dipping moderately resistive layers (R2 and R3) and at the top by highly conductive layers (C1 and C2). Similar structures found in hydrothermal systems and geothermal prospect zones [8,9,63,64] were interpreted as shallow hot aquifer or cap rock that covers high enthalpy hydrothermal/geothermal reservoir. In the present case, the latter is likely fractured due to the extension rate of rift and the presence of approximate horizontal electrical anisotropy direction and could host significant quantities of fluids (liquid or steam) in the rift zones, where the activity of an overpressure magmatic reservoir at the center inject either a hot material into dyke or magmatic fluid. The latter is often considered as the source of vertical heat transfer that can migrate laterally toward the rift segment termination [65,66,67].
Surface deformation studies [3,17,18] and related interpretations of the presence of deep hydrothermal fluid circulation will be compared with the electrical conductivity structure model developed in this study (Figure 9). Numerical modelling results of 2D thermo-mechanical [18] yielded temperatures consistent with the measured temperatures of deep geothermal wells. However, some disagreement between the measured and modeled temperature of A5 located close to the center of the rift (Figure 1) was interpreted as local thermal effects generated by the fluid circulation [18], which corresponds to the high conductance zones of the three conductive layers C2, C3 and C4 (Figure 9). Furthermore, [3] noted that a faulting process, mainly controlled by deep hydrothermal fluid circulation coming from an over pressurized magmatic system, injects fluid into fractured zones connected to the deep part of the faults and hence triggers in a decrease in the effective normal stress on the locked section at depth of faults which in turn induces faults slip. These authors focused their study on active faults located at the center and at the north-east of the rift. Their results corroborate to the width extension of conductive layers C1, C2 and C3 between the center and the north-east part of the rift (Figure 9). In addition, as proposed by [17], 70% of the actual deformation beneath the rift is concentrated toward the northeastern part rather than the southwestern part. And the northeastern part was recently interpreted as a preferred zone of fluid filled fractures with a potential hydrothermal fluid circulation at shallow crust that can likely be a geothermal target [6]. Groundwater circulation between Asal lake and Ghoubbet Bay inferred from self-potential (SP) measurements in the study of [5] proposed a schematic representation of fluid circulation where two large zones at the shoulders of the rift have positives SP anomalies that were interpreted as slow and rewarmed fluid flow, whereas a narrow zone with negative SP at the center of rift separating the two previous zones is more related to a rapid and cold fluid flow. The latter study is in good agreement with the resistivity model, where high conductance of the superposed conductive layers (C2, C3 and C4) is clearly visible at the center whereas at the shoulders of the rift, thickness of those layers decreases (Figure 9). Thus, an alternative explanation of the general pattern of fluid circulation can be proposed. And this general pattern is related to the interaction of a deep heat source likely located in the center with a wide hydrothermal reservoir (C3 and C4) that responds to the pressure changes in fluid-filled rocks deformed. Thus, the cause of rocks deformation is likely due to the extension of the rift, which creates the development of shear zones and fractures at the crust where dyke can intrude. Considering both the low geothermal gradient temperature of A5 well (between 500 and 1200 m depth; see Figure 2 in [6] located in the center of the rift [12,68] and associated interpretation of the negative SP anomaly in the same area [5], it is possible that the high conductivity of C1 layer can be interpreted as a saline (implying high conductivity) aquifer with fluids flowing toward Asal Lake through the faults and fracture networks at the center of the rift.

5.3.2. The Importance of Conductive Major Normal Fault H

Another interesting feature is the major normal fault H (Figure 1) which is close to MT station 028 (Figure 9). The hanging wall of this fault has been qualified as hydrogeological barrier separating the rift to a conductive northeastern zone and relative resistive southwestern [6]. The latter study is in agreement with the 2D conductivity model developed in this work (Figure 9), where the extent of C2 layer is more pronounced in the northeastern zone. Additionally, the synclinal form of C3, C4 and R2 at the center close to the vertical projection of H fault at great depth (Figure 9) may suggest a possible direct link of a sub-vertical dipping and sub-vertical dyke in an approximate north-south striking direction, as inferred by dimensionality analysis at long periods (Figure 3, Figure 4 and Figure 5). The author argued that the H fault is the main active fault in Asal rift, and it is likely connected to a deep hydrothermal system which change the hydrostatic and lithostatic pressure when the state of the underlying overpressure magma reservoir changes at the deeper level. This may be evidenced by the high conductance of conductive layers (C2, C3, C4 in Figure 9) observed at the center of rift close to the vertical projection of H fault. And the TE and TE-TM models (Figure 9 and Appendix A) display high conductive medium between 2 and 5 km depth for the same zone. Similar patterns where a high conductance of conductive layer was associated with a reservoir hosting the source of deformation and where upward release triggers micro-earthquakes were found for a hydrothermal system in Japan [63]. In the hydrothermal system of Unzen graben of Japan, vertical conductive zone having a width of 2 km and an extend down to below 4 km was also interpreted as interconnected fractures network generated by the main active normal fault in which magmatic volatiles are supplied from a deeper pressure source causing surface deformation [69]. The resistivity structure estimated by new 2D inversion method allowed to resolve narrow conductors zones beneath three main faults in the central Japan [70]. The later authors interpreted the narrow conductive zones under faults as localized ductile shear zones with highly connected fluid which are responsible for the strain accumulation along the active faults. Additionally, in a rift zone, steep crustal-scale faults inferred from MT data analysis were interpreted as preferred path that connect between the deep dominantly magmatic fluid and upper crustal meteoric regime [42].

5.3.3. Potential Magma Reservoir Inferred from Joint Interpretation

The presence of magma reservoir at depth will be inferred with joint interpretation of the 2D conductivity model proposed in this study and previous studies. The passive seismic study of [4] revealed that the main volcanic activity with the most seismicity recorded under the rift was concentrated beneath Fieale caldera zone (Figure 1). Those authors interpreted it as volume of hot rocks where the main seismogenic crust lie between 3–5 km depth overlying above a deeper magma chamber. They argued that the deformation due to the volume of hot molten rocks is mainly aseismic and that the brittle to ductile transition is shallower at the center of the rift than at its shoulders. Thus, in this case, the deformed partly hot molten rock may contain open fissures/fractures that can potentially induce seismicity determined between 3–5 km depth. Seismic reflection profiles suggested low velocity mantle beneath the Asal rift where the presence of the dyke under the rift axis was inferred [13]. Geochemical and petrological constraints revealed evidence of shallow melting path beneath the rift axis and deeper melting path at the rift shoulders [47]. Moreover, molten rock or magma reservoir are expected to be highly conductive medium due to the high temperature [71] but neither beneath Fieale Caldera nor beneath the center or close to the rift axis can be found a high conductivity anomaly for the invariant and TM models at great depth (Figure 9). Consequently, magma reservoir and/or molten rocks does not exist at great depth surveyed by the 2D conductivity of the invariant and TM models or those models are not able to detect magma that would result in a high conductive medium. Moreover, the TE and TE-TM models (Figure 9 and Appendix A) are able to resolve a high conductivity anomaly at the center of rift between 2 and 5 km depth that may correspond to the magma reservoir. Since the last 30 kyr, the rifting process reached a steady state and a cooling magma is expected under the rift [13,15,17]. In this case, a cooling magma intruding the shallow crust during the past magmatic-tectonic events will likely be imaged as relative resistive medium having approximate electrical properties of the embedding geological layer [71]. Thus, the author argue that R2 relative resistive layer (Figure 9) may contain potential partly molten rock based on the following elements. Sub-vertical dipping of R2 can be observed at the center of Asal rift with significant conductance, whereas the conductance decreases at the shoulders of the rift suggesting lateral migration of the injected hot material into dykes. Moreover, the conductivity contrast between R2 and R3 can indicate a considerable petrophysical properties contrast, notably the temperature which in turn affect the density where the low conductive layer may correspond to the layer of high-density. In this scenario, buoyancy variation generated by the density difference facilitate the migration of the molten rocks from greater depth level to a shallow depth. Furthermore, when the buoyancy force is not enough to maintain the upwelling magma reservoir to the shallow strata losing its buoyancy, the hot magmatic materials intruded forms a magmatic reservoir or intrusion at the corresponding depth.
It is surprising that most models of ground deformations [15,18] proposed a maximum depth of 4 km from the surface reached by the dyke injection close to the center of the rift where lie the source of deformation which is consistent with the top of the R2 layer and the bottom of C4 layer (Figure 9). Vertical resistive structures at the center of Unzen graben in Japan was interpreted as cooled dyke that may have acted previously as volcanic conduit [69]. However, the synclinal form of C4 and R2 can reveal the symmetrical lateral propagation of molten rocks to the shoulders of the rift. It is surprising that this symmetrical propagation can be observed at the surface of the rift where basalt flow vectors seem distributed with the same symmetrical propagation as evidenced in the structural map representation presented by [15]. Additionally, potential magma reservoir inferred from 2D resistivity models (Figure 9 and Appendix A) are in agreement with the depth of potential magma or molten rocks determined from the previous conceptual models of the Asal rift developed by [4,13,68]. The steep and vertical high conductive zone evidenced by the joint inversion model of TE-TM data (Figure 9 and Appendix A) may also be associated with a magmatic fluid pathway. The same pattern was recognized previously by [72] with 3D inversion of MT data in volcanic context where a narrow vertical low resistivity range of about 10 Ωm (as showed in this study, see Figure 9 and Appendix A). The low resistivity extended from 2 to 9 km at depth and was assumed to correspond to a magmatic fluid pathway. Moreover, many studies conducted in eroded rift zones, passive volcanic margins, slow-spreading mid-oceanic ridge and incipient spreading centers (East Africa) conclude that in the middle of the rift segments exist a central and shallow (< 6 km) magma reservoir that can inject hot material into dykes with magma migrating laterally toward the rift segment termination [65,66,67], where the velocity of plate opening is mainly controlled by the intrusion [54].

6. Conclusions

Different methods of dimensionality analysis conducted in this work together with 2D inversion of 14 MT stations along a profile perpendicular to the rift axis allowed to further understand geoelectric structure beneath Asal rift. Dimensionality analysis was found to determine the dominant geoelectric strike which depend on the periods of natural electromagnetic fields for both the short and long periods. For the short period, a mean strike of N43°E was estimated, whereas a dominant strike of north-south direction was estimated for the long periods. Additionally, electrical anisotropy direction aligned or parallel with the geoelectric strike direction for both the short and long periods was presented in this study. Joint interpretation of electrical anisotropy direction with previous studies demonstrate that anisotropy direction is mainly related to the paleo and recent stress field direction that controls the horizontal and vertical deformation of Asal rift. Electrical anisotropy direction in Asal can be linked to the dominant stress field of three diverging plates (Somali, Arabia and Nubia). However, the westward propagation of Aden ridge, the jump of the Red sea ridge into Afar depression and their interaction can change the direction of plates motion over the geological time which induce a preferred electrical anisotropy direction. The presence of well-defined geoelectric strike permits to develop 2D inversion models (TM, invariant, TE and TE-TM mode), which can justify the presence of regional 2D conductivity structure in the study area. Conductive layers in the crust (C1, C2, C3 and C4 in Figure 9) were interpreted to be shallow aquifer and potential geothermal/hydrothermal reservoirs, whereas the resistive layer at the bottom of the 2D model (R3 in Figure 9) is associated with the basement rocks. The dipping relative resistive layer (R2 in Figure 9) can be a magma system or magma domain which hosted partly molten rock. 2D conceptual model of Asal rift inferred from inversion results is presented in Appendix A. This conceptual model of Asal rift was recently used for numerical modeling of hydrothermal system circulation [73] assuming that electrical anisotropy could be interpreted as permeability anisotropy. And simulated scenarios with permeability anisotropy evidenced that significant hydrothermal fluid circulation exists inside the high conductance layers (C3 and C4) [73].
For geothermal exploration, the author suggest that future drilling can be at the center of rift close to the H Fault where the conductive layers have high conductance and are close to the heat source or magma domain (R2). Additionally, shallow geothermal wells should be drilled parallel to the electrical anisotropy direction of north-east, which could be aligned to the oriented fractures direction.

Funding

This research was funded by the Islamic Development Bank through a PhD scholarship awarded to the author. Therefore, the author gratefully acknowledges the financial support from the Islamic Development Bank.

Data Availability Statement

The data presented in this study can be obtained on request from the corresponding author. Data are not publicly available due to privacy concerns.

Acknowledgments

The author would like to thank Jasmin Raymond, Philippe Pasquier, Michel Chouteau, Erwan Gloaguen, Bernard Giroux, Gaetan Sakindi, Oubah Aden and Shamso Hassan for useful discussions. Three anonymous reviewers are also acknowledged for their useful comments of earlier version of this manuscript, which improved the manuscript.

Conflicts of Interest

The author declare that he has no known competing financial interests or personal relationships that could have appeared to influence the research work reported in this article.

Appendix A

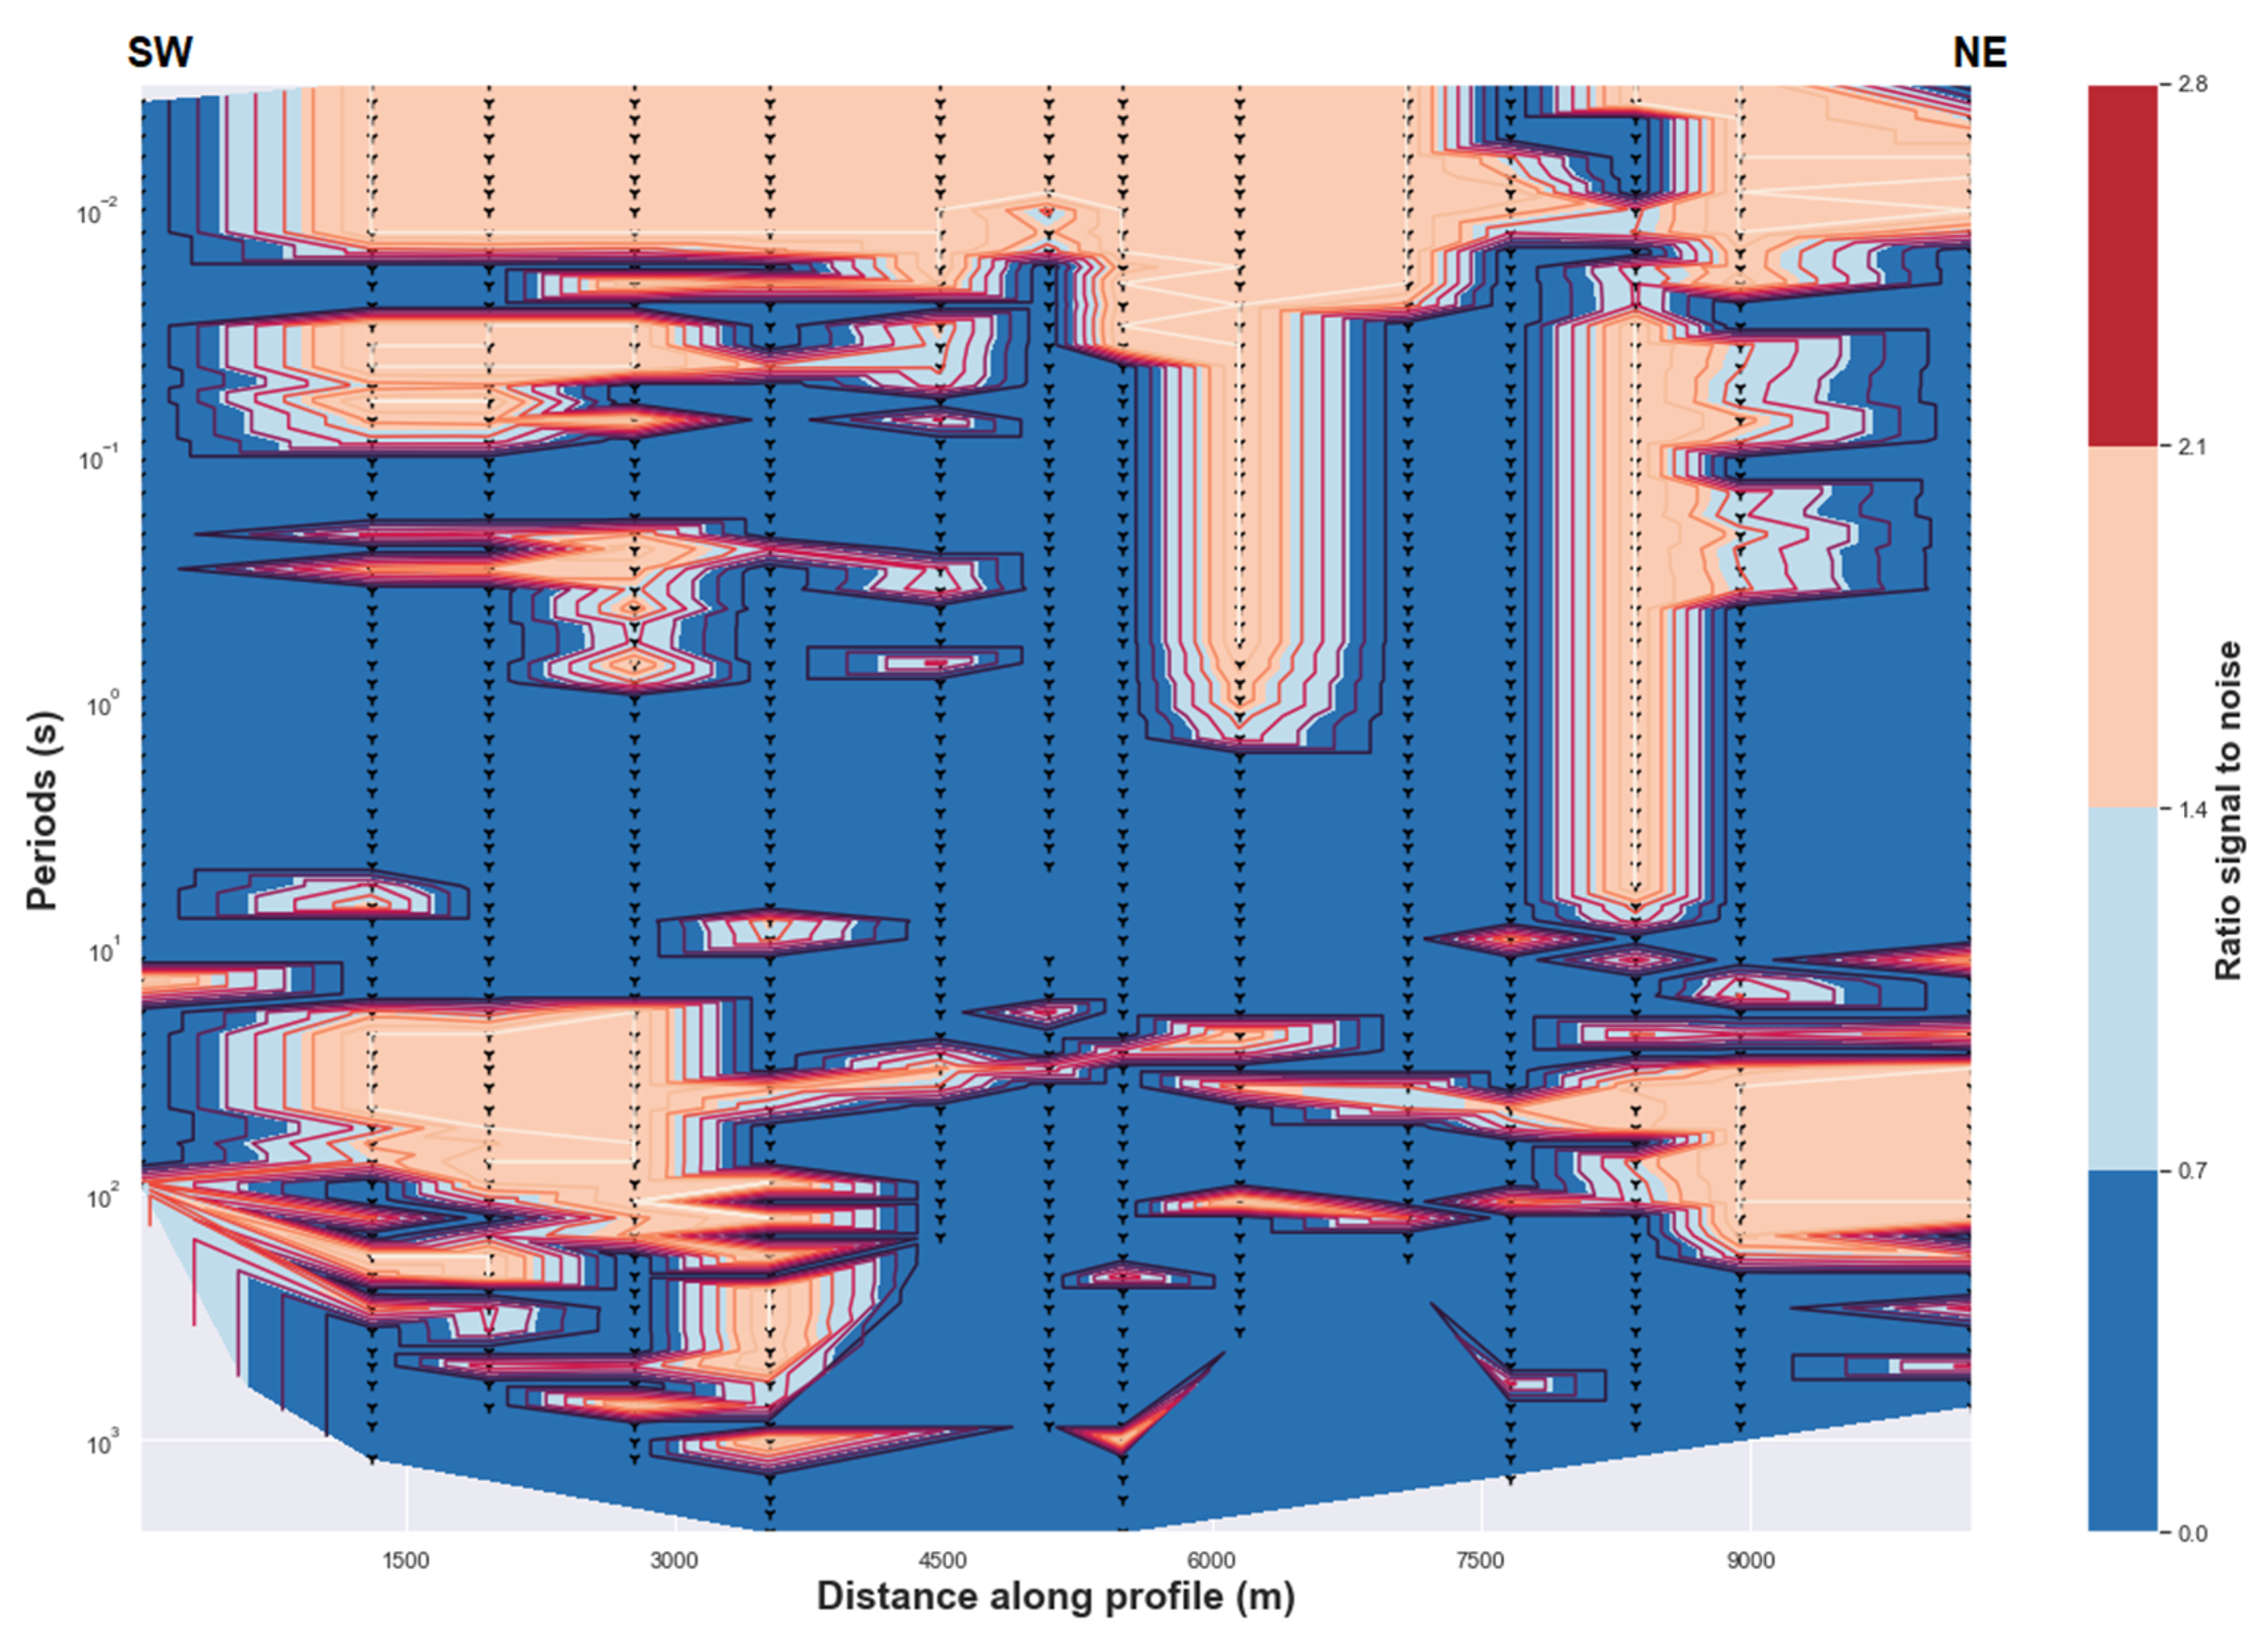
Figure A1. (Above) Uncertainty of the impedance estimates. (Below) Uncertainty of the tipper estimates.
Applsci 13 01157 g0a1aApplsci 13 01157 g0a1b
Figure A2. (Above) Joint Inversion model of TE and TM data for geoelectric strike of N120°E. (Below) Comparison between observed and modeled data.
Applsci 13 01157 g0a2aApplsci 13 01157 g0a2b
Figure A3. Conceptual model of Asal rift derived from the 2D inversion of invariant model. F-J, F-H, F-F and F- β are the main normal faults (see Figure 1).
Applsci 13 01157 g0a3

References

  1. Sanjuan, B.; Michard, G.; Michard, A. Origine des substances dissoutes dans les eaux des sources thermales et des forages de la région Asal-Ghoubbet (République de Djibouti). J. Volcanol. Geotherm. Res. 1990, 43, 333–352. [Google Scholar] [CrossRef]
  2. Manighetti, I.; Tapponnier, P.; Courtillot, V.; Gruszow, S.; Gillot, P.-Y. Propagation of rifting along the Arabia-Somalia Plate Boundary: The Gulfs of Aden and Tadjoura. J. Geophys. Res. Solid Earth 1997, 102, 2681–2710. [Google Scholar] [CrossRef]
  3. Doubre, C.; Peltzer, G. Fluid-controlled faulting process in the Asal Rift, Djibouti, from 8 yr of radar interferometry observations. Geol 2007, 35, 69. [Google Scholar] [CrossRef]
  4. Doubre, C.; Manighetti, I.; Dorbath, L.; Dorbath, C.; Bertil, D.; Delmond, J.C. Crustal structure and magmato-tectonic processes in an active rift (Asal-Ghoubbet, Afar, East Africa): 2. Insights from the 23-year recording of seismicity since the last rifting event. J. Geophys. Res. Solid Earth 2007, 112. [Google Scholar] [CrossRef] [Green Version]
  5. Mlynarski, M.; Zlotnicki, J. Fluid circulation in the active emerged Asal rift (east Africa, Djibouti) inferred from self-potential and Telluric–Telluric prospecting. Tectonophysics 2001, 339, 455–472. [Google Scholar] [CrossRef]
  6. Hassan Aden, A.; Raymond, J.; Giroux, B.; Sanjuan, B. New Insights into Hydrothermal Fluid Circulation Affected by Regional Groundwater Flow in the Asal Rift, Republic of Djibouti. Energies 2021, 14, 1166. [Google Scholar] [CrossRef]
  7. Giroux, B.; Chouteau, M.; Descloîtres, M.; Ritz, M. Use of the magnetotelluric method in the study of the deep Maestrichtian aquifer in Senegal. J. Appl. Geophys. 1997, 38, 77–96. [Google Scholar] [CrossRef]
  8. Meju, M.A. Geoelectromagnetic Exploration for Natural Resources: Models, Case Studies and Challenges. Surv. Geophys. 2002, 23, 133–206. [Google Scholar] [CrossRef]
  9. Spichak, V.; Manzella, A. Electromagnetic sounding of geothermal zones. J. Appl. Geophys. 2009, 68, 459–478. [Google Scholar] [CrossRef]
  10. Piña-Varas, P.; Ledo, J.; Queralt, P.; Marcuello, A.; Perez, N. On the detectability of Teide volcano magma chambers (Tenerife, Canary Islands) with magnetotelluric data. Earth Planets Space 2018, 70, 14. [Google Scholar] [CrossRef]
  11. Simpson, F. A three-dimensional electromagnetic model of the southern Kenya Rift: Departure from two dimensionality as a possible consequence of a rotating stress field. J. Geophys. Res. Solid Earth 2000, 105, 19321–19334. [Google Scholar] [CrossRef]
  12. Houssein, D.E.; Axelsson, G. Geothermal resources in the Asal Region, Republic of Djibouti: An update with emphasis on reservoir engineering studies. Geothermics 2010, 39, 220–227. [Google Scholar] [CrossRef]
  13. Manighetti, I.; Tapponnier, P.; Gillot, P.Y.; Jacques, E.; Courtillot, V.; Armijo, R.; Ruegg, J.C.; King, G. Propagation of rifting along the Arabia-Somalia Plate Boundary: Into Afar. J. Geophys. Res. Solid Earth 1998, 103, 4947–4974. [Google Scholar] [CrossRef]
  14. Gasse, F.; Fontes, J.-C. Palaeoenvironments and palaeohydrology of a tropical closed lake (Lake Asal, Djibouti) since 10,000 yr B.P. Palaeogeogr. Palaeoclimatol. Palaeoecol. 1989, 69, 67–102. [Google Scholar] [CrossRef]
  15. Stein, R.S.; Briole, P.; Ruegg, J.-C.; Tapponnier, P.; Gasse, F. Contemporary, Holocene, and Quaternary deformation of the Asal Rift, Djibouti: Implications for the mechanics of slow spreading ridges. J. Geophys. Res. Solid Earth 1991, 96, 21789–21806. [Google Scholar] [CrossRef] [Green Version]
  16. De Chabalier, J.-B.; Avouac, J.-P. Kinematics of the Asal Rift (Djibouti) Determined from the Deformation of Fieale Volcano. Science 1994, 265, 1677–1681. [Google Scholar] [CrossRef] [Green Version]
  17. Vigny, C.; de Chabalier, J.-B.; Ruegg, J.-C.; Huchon, P.; Kurt, L.F.; Cattin, R.; Asfaw, L.; Kanbari, K. Twenty-five years of geodetic measurements along the Tadjoura-Asal rift system, Djibouti, East Africa. J. Geophys. Res. Solid Earth 2007, 112. [Google Scholar] [CrossRef] [Green Version]
  18. Cattin, R.; Doubre, C.; de Chabalier, J.-B.; King, G.; Vigny, C.; Avouac, J.-P.; Ruegg, J.-C. Numerical modelling of quaternary deformation and post-rifting displacement in the Asal–Ghoubbet rift (Djibouti, Africa). Earth Planet. Sci. Lett. 2005, 239, 352–367. [Google Scholar] [CrossRef]
  19. Audin, L.; Manighetti, I.; Tapponnier, P.; Métivier, F.; Jacques, E.; Huchon, P. Fault propagation and climatic control of sedimentation on the Ghoubbet Rift Floor: Insights from the Tadjouraden cruise in the western Gulf of Aden. Geophys. J. Int. 2001, 144, 391–413. [Google Scholar] [CrossRef] [Green Version]
  20. Sakindi, G.U.G.T.P. (Iceland) Three-Dimensional Inversion of Magnetotelluric Data: Geological-Geothermal Interpretation of Asal Geothermal Field, Djibouti; United Nations University: Reykjavic, Iceland, 2015. [Google Scholar]
  21. Bahr, K. Interpretation of the magnetotelluric impedance tensor: Regional induction and local telluric distortion. J. Geophys. 1987, 62, 119–127. [Google Scholar]
  22. Caldwell, T.G.; Bibby, H.M.; Brown, C. The magnetotelluric phase tensor. Geophys. J. Int. 2004, 158, 457–469. [Google Scholar] [CrossRef]
  23. Weaver, J.T.; Agarwal, A.K.; Lilley, F.E.M. The relationship between the magnetotelluric tensor invariants and the phase tensor of Caldwell, Bibby, and Brown. ASEG Ext. Abstr. 2003, 2003, 1–8. [Google Scholar] [CrossRef] [Green Version]
  24. Heise, W.; Caldwell, T.G.; Bibby, H.M.; Brown, C. Anisotropy and phase splits in magnetotellurics. Phys. Earth Planet. Inter. 2006, 158, 107–121. [Google Scholar] [CrossRef]
  25. Booker, J.R. The Magnetotelluric Phase Tensor: A Critical Review. Surv. Geophys. 2014, 35, 7–40. [Google Scholar] [CrossRef]
  26. Szarka, L.; Menvielle, M. Analysis of rotational invariants of the magnetotelluric impedance tensor. Geophys. J. Int. 1997, 129, 133–142. [Google Scholar] [CrossRef] [Green Version]
  27. Lilley, F.E.M. Magnetotellurics: The CBB or phase tensor and Bahr’s 1988 analysis. Explor. Geophys. 2020, 51, 401–421. [Google Scholar] [CrossRef]
  28. Eisel, M.; Haak, V.; Pek, J.; Červ, V. A magnetotelluric profile across the German Deep Drilling Project (KTB) area: Two- and three-dimensional modeling results. J. Geophys. Res. Solid Earth 2001, 106, 16061–16073. [Google Scholar] [CrossRef]
  29. García Juanatey, M.A.; Hübert, J.; Tryggvason, A.; Juhlin, C.; Pedersen, L.B.; Bauer, T.E.; Dehghannejad, M. 2D and 3D MT in the central Skellefte Ore District, northern Sweden. Tectonophysics 2019, 764, 124–138. [Google Scholar] [CrossRef] [Green Version]
  30. Tournerie, B.; Chouteau, M.; Marcotte, D. Magnetotelluric static shift: Estimation and removal using the cokriging method. Geophysics 2007, 72, F25. [Google Scholar] [CrossRef]
  31. Arnason, K. The Static Shift Problem in MT Soundings. In Proceedings of the World Geothermal Congress, Melbourne, Australia, 19–25 April 2015. [Google Scholar]
  32. Gómez-Treviño, E.; Esparza, F.J.; Muñiz, Y.; Calderón, A. The magnetotelluric transverse electric mode as a natural filter for static effects: Application to the COPROD2 and COPROD2S2 data sets. Geophysics 2014, 79, E91–E99. [Google Scholar] [CrossRef]
  33. Moorkamp, M.; Avdeeva, A.; Basokur, A.T.; Erdogan, E. Inverting magnetotelluric data with distortion correction—Stability, uniqueness and trade-off with model structure. Geophys. J. Int. 2020, 222, 1620–1638. [Google Scholar] [CrossRef]
  34. Pellerin, L.D.; Hohmann, G.W. Transient electromagnetic inversion; a remedy for magnetotelluric static shifts. Geophysics 1990, 55, 1242–1250. [Google Scholar] [CrossRef] [Green Version]
  35. Krivochieva, S.; Chouteau, M. Integrating TDEM and MT methods for characterization and delineation of the Santa Catarina aquifer (Chalco Sub-Basin, Mexico). J. Appl. Geophys. 2003, 52, 23–43. [Google Scholar] [CrossRef]
  36. Nam, M.J.; Kim, H.J.; Song, Y.; Lee, T.J.; Suh, J.H. Three-dimensional topographic and bathymetric effects on magnetotelluric responses in Jeju Island, Korea. Geophys. J. Int. 2009, 176, 457–466. [Google Scholar] [CrossRef] [Green Version]
  37. Eisel, M.; Bahr, K. Electrical Anisotropy in the Lower Crust of British Columbia: An Interpretation of a Magnetotelluric Profile after Tensor Decomposition. J. Geomagn. Geoelec. 1993, 45, 1115–1126. [Google Scholar] [CrossRef]
  38. Bibby, H.M.; Caldwell, T.G.; Brown, C. Determinable and non-determinable parameters of galvanic distortion in magnetotellurics. Geophys. J. Int. 2005, 163, 915–930. [Google Scholar] [CrossRef] [Green Version]
  39. Kellett, R.L.; Mareschal, M.; Kurtz, R.D. A model of lower crustal electrical anisotropy for the Pontiac Subprovince of the Canadian Shield. Geophys. J. Int. 1992, 111, 141–150. [Google Scholar] [CrossRef]
  40. Heise, W.; Pous, J. Effects of anisotropy on the two-dimensional inversion procedure. Geophys. J. Int. 2001, 147, 610–621. [Google Scholar] [CrossRef] [Green Version]
  41. Tong, X.; Liu, J.; Li, A. Two-dimensional regularized inversion of AMT data based on rotation invariant of Central impedance tensor. Earth Planet. Phys. 2018, 2, 430–437. [Google Scholar] [CrossRef]
  42. Wannamaker, P.E.; Hasterok, D.P.; Johnston, J.M.; Stodt, J.A.; Hall, D.B.; Sodergren, T.L.; Pellerin, L.; Maris, V.; Doerner, W.M.; Groenewold, K.A.; et al. Lithospheric dismemberment and magmatic processes of the Great Basin–Colorado Plateau transition, Utah, implied from magnetotellurics. Geochem. Geophys. Geosyst. 2008, 9. [Google Scholar] [CrossRef]
  43. Pedersen, L.B.; Engels, M. Routine 2D inversion of magnetotelluric data using the determinant of the impedance tensor. Geophysics 2005, 70, G33–G41. [Google Scholar] [CrossRef]
  44. Bahr, K.; Bantin, M.; Jantos, C.; Schneider, E.; Storz, W. Electrical anisotropy from electromagnetic array data: Implications for the conduction mechanism and for distortion at long periods. Phys. Earth Planet. Inter. 2000, 119, 237–257. [Google Scholar] [CrossRef]
  45. Smittarello, D.; Grandin, R.; Chabalier, J.-B.D.; Doubre, C.; Deprez, A.; Masson, F.; Socquet, A.; Saad, I.A. Transient deformation in the Asal-Ghoubbet Rift (Djibouti) since the 1978 diking event: Is deformation controlled by magma supply rates? J. Geophys. Res. Solid Earth 2016, 121, 6030–6052. [Google Scholar] [CrossRef] [Green Version]
  46. Padilha, A.L.; Vitorello, Í.; Pádua, M.B.; Bologna, M.S. Lithospheric and sublithospheric anisotropy beneath central-southeastern Brazil constrained by long period magnetotelluric data. Phys. Earth Planet. Inter. 2006, 158, 190–209. [Google Scholar] [CrossRef]
  47. Pinzuti, P.; Humler, E.; Manighetti, I.; Gaudemer, Y. Petrological constraints on melt generation beneath the Asal Rift (Djibouti) using quaternary basalts. Geochem. Geophys. Geosyst. 2013, 14, 2932–2953. [Google Scholar] [CrossRef]
  48. Bahr, K.; Simpson, F. Electrical Anisotropy below Slow- and Fast-Moving Plates: Paleoflow in the Upper Mantle? Science 2002, 295, 1270–1272. [Google Scholar] [CrossRef] [PubMed] [Green Version]
  49. Brasse, H.; Kapinos, G.; Li, Y.; Mütschard, L.; Soyer, W.; Eydam, D. Structural electrical anisotropy in the crust at the South-Central Chilean continental margin as inferred from geomagnetic transfer functions. Phys. Earth Planet. Inter. 2009, 173, 7–16. [Google Scholar] [CrossRef] [Green Version]
  50. Frederiksen, A.W.; Ferguson, I.J.; Eaton, D.; Miong, S.-K.; Gowan, E. Mantle fabric at multiple scales across an Archean–Proterozoic boundary, Grenville Front, Canada. Phys. Earth Planet. Inter. 2006, 158, 240–263. [Google Scholar] [CrossRef]
  51. Shalivahan; Bhattacharya, B.B. Electrical anisotropy of asthenosphere in a region of window to mantle underneath Eastern Indian Craton. Phys. Earth Planet. Inter. 2005, 152, 43–61. [Google Scholar] [CrossRef]
  52. Wannamaker, P.E. Anisotropy versus Heterogeneity in Continental Solid Earth Electromagnetic Studies: Fundamental Response Characteristics and Implications for Physicochemical State. Surv. Geophys. 2005, 26, 733–765. [Google Scholar] [CrossRef]
  53. Prawirodirdjo, L.; Bock, Y. Instantaneous global plate motion model from 12 years of continuous GPS observations. J. Geophys. Res. Solid Earth 2004, 109. [Google Scholar] [CrossRef]
  54. Einarsson, P. Earthquakes and present-day tectonism in Iceland. Tectonophysics 1991, 189, 261–279. [Google Scholar] [CrossRef]
  55. Medynski, S.; Pik, R.; Burnard, P.; Dumont, S.; Grandin, R.; Williams, A.; Blard, P.-H.; Schimmelpfennig, I.; Vye-Brown, C.; France, L.; et al. Magmatic cycles pace tectonic and morphological expression of rifting (Afar depression, Ethiopia). Earth Planet. Sci. Lett. 2016, 446, 77–88. [Google Scholar] [CrossRef] [Green Version]
  56. Cox, S.F.; Knackstedt, M.A.; Braun, J. Principles of Structural Control on Permeability and Fluid Flow in Hydrothermal Systems. Rev. Econ. Geol. 2001. [Google Scholar] [CrossRef]
  57. Karato, S. The role of hydrogen in the electrical conductivity of the upper mantle. Nature 1990, 347, 272–273. [Google Scholar] [CrossRef]
  58. Duba, A.; Constable, S. The electrical conductivity of lherzolite. J. Geophys. Res. 1993, 98, 11885–11899. [Google Scholar] [CrossRef]
  59. Roux, E.; Moorkamp, M.; Jones, A.G.; Bischoff, M.; Endrun, B.; Lebedev, S.; Meier, T. Joint inversion of long-period magnetotelluric data and surface-wave dispersion curves for anisotropic structure: Application to data from Central Germany: Joint Inversion of Mt and Sw Data. Geophys. Res. Lett. 2011, 38. [Google Scholar] [CrossRef] [Green Version]
  60. Gatzemeier, A.; Tommasi, A. Flow and electrical anisotropy in the upper mantle: Finite-element models constraints on the effects of olivine crystal preferred orientation and microstructure. Phys. Earth Planet. Inter. 2006, 158, 92–106. [Google Scholar] [CrossRef]
  61. Heise, W.; Caldwell, T.G.; Bertrand, E.A.; Hill, G.J.; Bennie, S.L.; Ogawa, Y. Changes in electrical resistivity track changes in tectonic plate coupling. Geophys. Res. Lett. 2013, 40, 5029–5033. [Google Scholar] [CrossRef] [Green Version]
  62. Kirkby, A.; Heinson, G.; Holford, S.; Thiel, S. Mapping fractures using 1D anisotropic modelling of magnetotelluric data: A case study from the Otway Basin, Victoria, Australia. Geophys. J. Int. 2015, 201, 1961–1976. [Google Scholar] [CrossRef] [Green Version]
  63. Nurhasan; Ogawa, Y.; Ujihara, N.; Tank, S.B.; Honkura, Y.; Onizawa, S.; Mori, T.; Makino, M. Two electrical conductors beneath Kusatsu-Shirane volcano, Japan, imaged by audiomagnetotellurics, and their implications for the hydrothermal system. Earth Planets Space 2006, 58, 1053–1059. [Google Scholar] [CrossRef]
  64. Usui, Y.; Ogawa, Y.; Aizawa, K.; Kanda, W.; Hashimoto, T.; Koyama, T.; Yamaya, Y.; Kagiyama, T. Three-dimensional resistivity structure of Asama Volcano revealed by data-space magnetotelluric inversion using unstructured tetrahedral elements. Geophys. J. Int. 2017, 208, 1359–1372. [Google Scholar] [CrossRef]
  65. Ebinger, C.J.; Casey, M. Continental breakup in magmatic provinces: An Ethiopian example. Geology 2001, 29, 527–530. [Google Scholar] [CrossRef]
  66. Doubre, C.; Geoffroy, L. Rift-zone development around a plume-related magma centre on the Isle of Skye (Scotland): A model for stress inversions. Terra Nova 2003, 15, 230–237. [Google Scholar] [CrossRef]
  67. Keir, D.; Hamling, I.J.; Ayele, A.; Calais, E.; Ebinger, C.; Wright, T.J.; Jacques, E.; Mohamed, K.; Hammond, J.O.S.; Belachew, M.; et al. Evidence for focused magmatic accretion at segment centers from lateral dike injections captured beneath the Red Sea rift in Afar. Geology 2009, 37, 59–62. [Google Scholar] [CrossRef]
  68. Zan, L.; Gianelli, G.; Passerini, P.; Troisi, C.; Haga, A.O. Geothermal exploration in the republic of djibouti: Thermal and geological data of the hanlé and asal areas. Geothermics 1990, 19, 561–582. [Google Scholar] [CrossRef]
  69. Triahadini, A.; Aizawa, K.; Teguri, Y.; Koyama, T.; Tsukamoto, K.; Muramatsu, D.; Chiba, K.; Uyeshima, M. Magnetotelluric transect of Unzen graben, Japan: Conductors associated with normal faults. Earth Planets Space 2019, 71, 28. [Google Scholar] [CrossRef]
  70. Usui, Y.; Uyeshima, M.; Ogawa, T.; Yoshimura, R.; Oshiman, N.; Yamaguchi, S.; Toh, H.; Murakami, H.; Aizawa, K.; Tanbo, T.; et al. Electrical Resistivity Structure around the Atotsugawa Fault, Central Japan, Revealed by a New 2-D Inversion Method Combining Wideband-MT and Network-MT Data Sets. J. Geophys. Res. Solid Earth 2021, 126, e2020JB020904. [Google Scholar] [CrossRef]
  71. Partzsch, G.M.; Schilling, F.R.; Arndt, J. The influence of partial melting on the electrical behavior of crustal rocks: Laboratory examinations, model calculations and geological interpretations. Tectonophysics 2000, 317, 189–203. [Google Scholar] [CrossRef]
  72. Abdallah, S.; Utsugi, M.; Aizawa, K.; Uyeshima, M.; Kanda, W.; Koyama, T.; Shiotani, T. Three-dimensional electrical resistivity structure of the Kuju volcanic group, Central Kyushu, Japan revealed by magnetotelluric survey data. J. Volcanol. Geotherm. Res. 2020, 400, 106898. [Google Scholar] [CrossRef]
  73. Hassan Aden, A.; Raymond, J.; Giroux, B. Numerical Modeling of Hydrothermal System Circulation Beneath Asal Rift, Republic of Djibouti. Energies 2022, 15, 9310. [Google Scholar] [CrossRef]
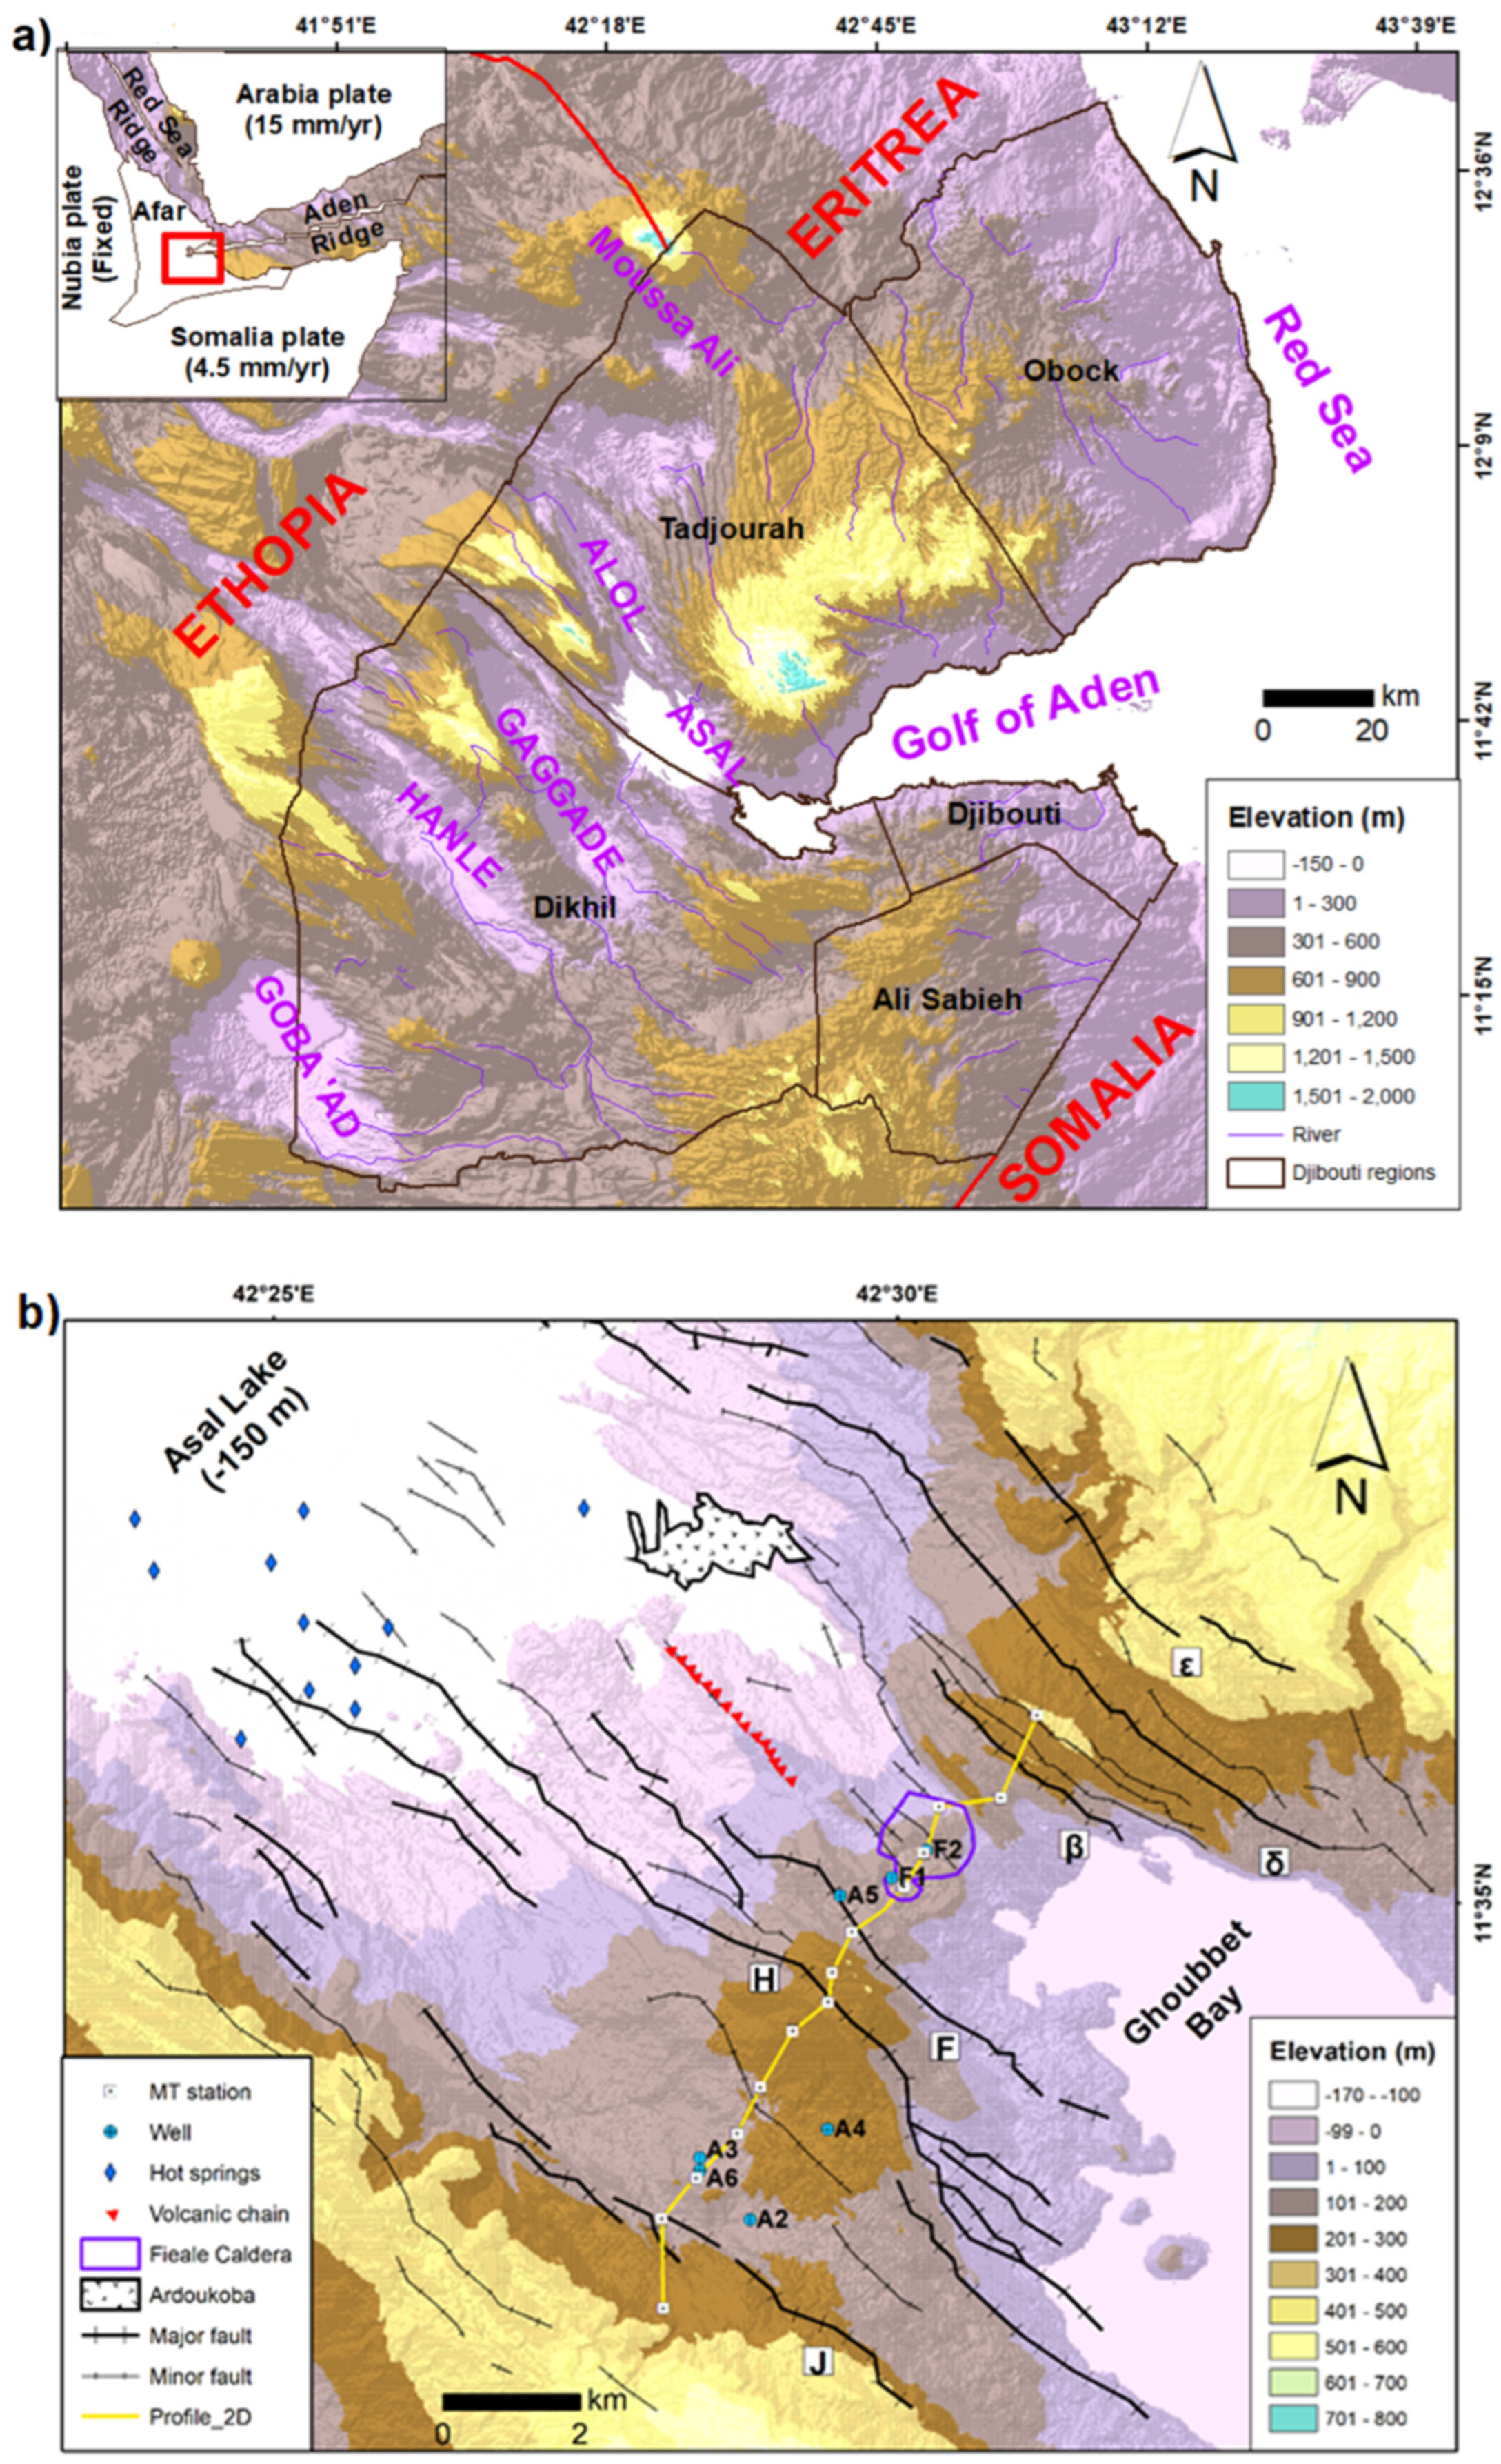
Figure 1. Topographic and main structural elements of (a) Djibouti and (b) Asal rift. The red rectangle is Djibouti; Greek characters represent the name of major normal faults; MT: Magnetotelluric (modified from [6]).
Applsci 13 01157 g001
Figure 2. Phase sensitive skew (or regional skew). Values higher than 0.3 are considered high whereas values less than 0.3 are considered low. Delaunay triangulation method is used.
Applsci 13 01157 g002
Figure 3. Rose diagram of the orientation of the phase tensor strike for the stations along 2D profile (Figure 1) where each rose diagram corresponds to the mean strike estimated over all 14 MT stations along with the corresponding period range.
Applsci 13 01157 g003
Figure 4. (A) Strike angle from impedance invariants and (B) strike angle from decomposition model. The major and minor axes of ellipse, respectively, correspond to the Φmax and Φmin of phase tensor. Each ellipse is in map view, so up is North and to the right is East.
Applsci 13 01157 g004
Figure 5. Real induction vectors with phase tensor ellipse.
Applsci 13 01157 g005aApplsci 13 01157 g005b
Figure 6. Phase difference between the two orthogonal components (TE and TM) phases. The dashed black triangles indicate the locations of MT stations at various periods. Values of phase difference greater than 10° are considered high. Delaunay triangulation method is used.
Applsci 13 01157 g006
Figure 7. Pseudo-section of phases tensor ellipses along 2D profile MT sites (Figure 1).
Applsci 13 01157 g007
Figure 8. Magnitude of the real induction vectors. Delaunay triangulation method is used.
Applsci 13 01157 g008
Figure 9. Inversion models. (A) TM resistivity model, (B) Invariant resistivity model, (C) TE resistivity model and (D) Joint inversion model of TE-TM.
Applsci 13 01157 g009aApplsci 13 01157 g009b
Figure 10. Observed vs. modeled apparent resistivity and phase data. (A) for the TM data and (B) for TE−TM data.
Applsci 13 01157 g010
Disclaimer/Publisher’s Note: The statements, opinions and data contained in all publications are solely those of the individual author(s) and contributor(s) and not of MDPI and/or the editor(s). MDPI and/or the editor(s) disclaim responsibility for any injury to people or property resulting from any ideas, methods, instructions or products referred to in the content.