Abstract
Battery storage is one of the important units in the optimal scheduling of integrated energy systems. To give full play to the advantages of battery storage in stabilizing power quality and smoothing the output of intermittent new energy generation, the battery life decay problem needs to be considered in optimal scheduling. In this paper, we studied the energy storage life decay model and established an electric–gas integrated energy system model considering energy storage life decay to minimize the economic cost of system operations and to compare the optimal dispatch results with and without energy storage life decay through simulation analysis to verify the rationality and economy of the energy storage life decay model used in this paper.
1. Introduction
Along with the rapid development of the globalization trend in the world economy, the supply of energy cannot meet the growing production and living needs of people, and the situation of energy shortages and waste has become more and more serious in recent years. As the lifeblood of the national economy, energy is fundamental to national development, so a series of problems such as the excessive use of energy will be a common challenge for human beings [1,2,3]. An integrated energy system covers several energy subsystems, which can realize the complementary advantages of different energy sources in operation [4] and help improve energy utilization efficiency. They are widely valued, especially the increasing maturity of electricity to gas technology has further strengthened the coupling between energy sources, while gas turbines, heat exchangers, electric chillers, energy storage, and other technologies have been more widely used as important components in integrated energy systems [5,6]. At the same time, renewable energy is clean, environmentally friendly, and inexpensive, which makes the whole system more efficient and cleaner. However, solar, wind, and other renewable energy sources are susceptible to natural environmental factors, resulting in randomness, volatility, and uncertainty in the output of photovoltaic wind turbines [7,8]. As one of the most important parts of an integrated energy system, energy storage plays a big role in increasing grid flexibility, improving power quality, and promoting new energy consumption [9,10]. However, during the operation of the system, the life of energy storage is affected by the number of times of charging and discharging, the depth of discharge, temperature, etc. The capacity of energy storage, the number of cycles, etc., will change, as will the operating efficiency and life decay characteristics of energy storage. The impact of the reliability and the economy of power system operations is increasing [11]. Therefore, the impact due to the decay of the energy storage life must be considered in the process of the study of the economic optimal dispatch of the integrated energy system.
A lot of research has been carried out at home and abroad on integrated energy optimization scheduling that has included energy storage lifetime decay. In the literature [12,13,14] studies have been carried out on the economic dispatch of integrated energy systems, but they have not considered the impact of energy storage lifetime decay. The literature [15] proposes to use a large amount of experimental data to estimate the remaining capacity of the battery and thus characterize its health status. The literature [5] uses a rainflow-like counting method to simulate the energy operation state and calculate the lifetime of the energy storage. The literature [16] uses the rainflow-like counting method to analyze battery performance and calculate the battery aging cost. The literature [17] considered the full cell capacity life decay with instability on the surface of the silicon component. Among the existing studies conducted to study battery capacity decay, one model is based on physical and data-driven models, and the literature [18,19] uses raw input signals (current, voltage, and temperature) to train machine learning models. The literature [20,21,22,23,24] uses preprocessed features from voltage, current, temperature, impedance, or power curves as input to the machine learning model. Still, another model is a continuum approach using porous electrode theory, where the model can be extended to capture potential degradation mechanisms leading to capacity decay, including differential voltage analysis models [25] and first-principles degradation models based on porous electrode theory [26].
The literature [27] selected a commutation factor to measure energy storage life decay in terms of exchange power, but the fixed commutation ratio makes it difficult to measure the dynamic change process of the battery during the actual operation. A method for estimating the residual life of lithium-ion batteries based on data hybrid drive is proposed in the literature [28]. The literature [29] defines the main parameters affecting life decay, selects the suitable stress conditions for retired power cells, and identifies the life decay characteristics of retired power cell modules using an accelerated life test method based on an inverse power law model. The literature [30,31] is based on the accurate measurement of energy storage lifetime losses based on experimental data, and the method is again too complex and computationally overwhelming. The literature [32,33] limits the number of cycles of energy storage and the charging and discharging time, and the model’s accuracy is not accurate enough. Therefore, constructing a suitable energy storage lifetime decay model and using it to evaluate the lifetime decay of energy storage during operation is crucial in the process of the optimal scheduling of integrated energy systems.
In the process of solving search and optimal scheduling problems, the most common approach is to use optimal scheduling algorithms for solving them, where particle swarm algorithms show good performance in multi-objective, multi-constrained, and nonlinear optimization problems and can be applied to nonlinear systems, computer science, robotics, engineering, and many other fields in real-world applications [34,35]. They have been widely used with the advantages of few constraints on the fitness function, simple structure, easy coding, and fast convergence. The literature [36] uses a particle swarm algorithm to optimize the scaling factor of a PID controller, thus improving the performance of a permanent magnet DC motor for a photovoltaic wire feeding system. The literature [37] uses a particle swarm algorithm combined with an MPPT controller to control the PV output power near the maximum point. The literature [38] uses a particle swarm algorithm to optimize the coefficients of a dynamic regulator for the purpose of increasing the power of a solar PV feeder system. The literature [39] evaluates different PSO approaches in the scheduling and control of different residential energy sources such as smart appliances, electric vehicles (EVs), heating/cooling equipment, and energy storage, so that particle swarm optimization algorithms can be widely used for distributed energy scheduling and control in real demand response applications.
In summary, this paper establishes a life decay model of energy storage, measures the life decay of energy storage by studying the changes in the capacity and charge state of energy storage during system operations, and introduces it to the changes in objective function and constraints in the process of system optimal scheduling, solves the integrated energy system optimization and dispatch model by the particle swarm algorithm, and finally verifies the reasonableness and the validity of the model by arithmetic analysis.
2. Integrated Electricity–Gas Energy System Model with Energy Storage
The structure of the electric–gas integrated energy system model including energy storage studied in this paper is shown in Figure 1. The source side of the model mainly consists of a wind turbine, PV, a grid, and a gas network, and the load side consists of an electric load, a gas load, a cooling load, and a thermal load, and the main equipment in the model includes an electric boiler, an electric chiller, P2G, and a gas turbine.
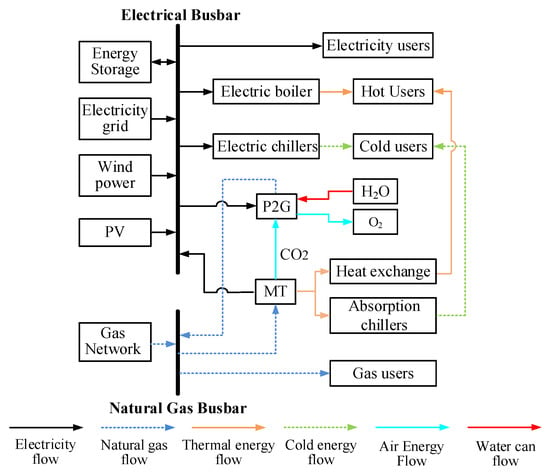
Figure 1.
Framework of the electrical integrated energy system.
2.1. Micro Gas Turbine Mathematical Model
The micro gas turbine is one of the core equipment of an electric–gas integrated energy system, which has received great attention for its small size and low pollution emission [40]. The micro gas turbine can convert clean energy such as methane and natural gas into various forms of energy such as electricity, heat, and cold, etc. It can provide electricity to the electric load and the waste heat generated can also provide energy to the heat and cold load. The gas consumption of a micro gas turbine can be expressed by Equation (1) [41].
where is the output power; is the output waste heat; is the low-level heat value, taken as 9.7 ; is the generation efficiency; is the heat loss rate; and is the unit dispatch time, taken as 1 .
2.2. Mathematical Model of the Electric Boiler
The working principle of an electric boiler is the thermal effect of the electric current, which is a heating device that converts electrical energy into thermal energy. The mathematical model can be represented by Equation (2) [42].
where , , and are the thermal efficiency, heating power, and power consumption of the electric boiler at the time , respectively.
2.3. Mathematical Model of Electric Chillers
The use of electrical energy to drive the compressor to convert electrical energy into cold energy is the main mode of operation of the electric refrigeration machine. The mathematical model can be represented by the following Equation (3).
where , , and are the refrigeration efficiency, refrigeration power, and power consumption of the electric refrigeration machine at the moment , respectively.
2.4. P2G Mathematical Model
The electricity-to-gas equipment electrolyzes water into hydrogen and oxygen, and hydrogen can be synthesized with carbon dioxide into methane and other gases, thus converting electrical energy into a more storable gas and realizing the graded use of energy, which is of vital importance for the consumption of new energy. The mathematical model can be represented by the following Equation (4) [43].
where is the conversion factor of the gas-to-electric equipment and , , and are the gas flow rate, heat generation, and power consumption of the gas-to-electric equipment at the time , respectively.
2.5. Mathematical Model of Heat Exchangers and Absorption Chillers
The heat exchanger and absorption chiller can process the waste heat generated by the micro gas turbine to provide energy for the heat load and the cooling load, respectively. The mathematical model can be represented by Equation (5) [44].
where , , , and are the heat production and cooling capacity of the heat exchanger and absorption refrigerant at the input side and output side, respectively and , , , and are the heat production efficiency and cooling efficiency as well as the heat production coefficient and cooling coefficient of the heat exchanger and absorption refrigerator, respectively.
3. Energy Storage Life Decay Model
Energy storage is one of the important units of an integrated energy system, and the deployment of energy storage in the system has multiple roles. On the one hand, it can avoid the fluctuation of the power grid caused by the uncertainty of the new energy output; on the other hand, it can maintain the transient power balance of the new energy [45], and in addition, it can be used as an emergency power source to ensure the reliability of the whole system.
Battery energy storage is a widely used energy storage method in the current power system. As the cycle proceeds, the capacity gradually decreases due to an increase in the positive and negative polarization of the battery, which is selected as the object of study in this paper, and its life decay model is investigated. The important parameters to measure the decay of energy storage life are capacity and charge state.
3.1. Capacity Decay Model
Capacity is a key parameter to measure the battery life decay model. The main factors affecting capacity decay are calendar capacity decay and cycle capacity decay, calendar capacity decay is small, and this paper focuses on the study of battery cycle capacity decay. Battery cycle capacity decay is influenced by the charge/discharge rate, ambient temperature, and cycle times. During the use of the battery, the temperature can be maintained at a constant temperature by the corresponding equipment; as the time-sharing tariff mechanism is used in the dispatching process, the charge/discharge multiplier can also be constrained to about 1C, so this paper mainly studies the influence of the number of cycles on the battery capacity decay [46].
During the operation of the battery, the capacity of the battery will keep changing as the time and the frequency of charging and discharging increase; it was found through the research that the capacity loss rate of the battery shows a positive relationship with the testing time [47]. As shown in Equation (6).
where indicates the capacity of the battery at the time , is the initial capacity of the battery, and is the capacity loss rate at the moment of 1C discharge of the battery.
3.2. Charge State Decay Model
The state of charge is another key parameter to measure battery life decay. The state of charge at the time and its value are related to two parameters, which are the state of charge at the time and the charge/discharge rate at the time . Without taking into account battery life decay, the state of charge can be expressed as Equation (7).
Taking into account battery life decay, the charge state is expressed as Equation (8).
where and are the charging and discharging efficiency of the battery, respectively, and are the charging and discharging power of the battery, respectively, and is the unit dispatch time interval.
4. Integrated Energy System Optimization Scheduling
In this paper, an energy storage life decay model was established and based on this, an optimal dispatching model of an electric–gas integrated energy system with energy storage life decay was built, and the lowest daily operating cost was the objective function to meet its operating constraints, and the output of each device was analyzed according to the known load data.
4.1. Optimal Scheduling Model without Accounting for Energy Storage Lifetime Decay
4.1.1. Objective Function
Not taking into account the decay of energy storage life, energy storage does not generate direct freight costs when the system is operating, the system’s operating costs include the initial investment cost of energy storage, power purchase cost, gas purchase cost, system operating costs, and abandoned scenery generation costs, and the objective function that the sum of all types of operating costs is the lowest.
where is the cost of electricity purchase; is the cost of gas purchase; is the cost of system operation, including operation and maintenance costs and depreciation costs; is the cost of abandoned scenery penalty; and is the initial investment cost of energy storage.
(1) Cost of electricity purchase .
where is the purchase price of electricity and is the electric power purchased from the power grid.
(2) Gas purchase cost .
where is the price of purchased natural gas and is the flow rate of gas purchased from natural gas.
(3) Abandoned scenery penalty cost .
where is the penalty factor for light abandonment; is the penalty factor for wind abandonment; is the photovoltaic power; is the wind power; is the photovoltaic power used to supply the electricity–gas integrated energy system; and is the wind power used to supply the electricity–gas integrated energy system.
(4) System operation cost .
where is the operating cost of the -th device at the time .
In the formula, is the operation and maintenance coefficient of the equipment, is the depreciation coefficient of the equipment, is the unit price of water consumed by the P2G equipment during operation, is the oxygen unit price sold during the operation of the P2G equipment, is the energy storage capacity maintenance cost coefficient [48], and is the energy storage power maintenance cost coefficient.
(5) Initial investment cost of energy storage .
The initial investment cost of energy storage is a fixed value.
4.1.2. Constraints
(1) Coupling device constraint:
where and are the electric and thermal power of the coupled equipment of the electric–gas integrated energy system, respectively.
(2) Energy storage constraint:
where the superscripts and correspond to the upper and lower limits of the physical quantity, respectively.
(3) Energy balance constraint:
a. Electrical balance constraint:
where is the electrical load.
b. Natural gas balance constraint:
where is the gas load.
c. Thermal equilibrium constraint:
where is the heat load.
d. Cold equilibrium constraint:
where is the cold load.
e. Balance of waste heat output from gas turbines and heat input from heat exchangers and absorption chillers.
4.2. Optimal Scheduling Model for Energy Storage Life Decay and Calculation
4.2.1. Objective Function
When taking into account the decay of energy storage life, the system in operation, energy storage will be continuously charged and discharged resulting in the decay of capacity, resulting in life loss costs, and the capacity of energy storage operations and maintenance costs will also change accordingly.
where is used for the consideration of energy storage life decay after the cost of life loss, represents the decay of energy storage capacity from the moment to the moment , and is the energy storage operation cost after the operation and maintenance costs of energy storage has changed. When the cost of energy storage life loss and the cost of operation and maintenance are taken into account, the operation goal of the system is as follows Equation (23):
where represents the system operating cost after the change in energy storage operations and maintenance costs and represents the total system cost after taking into account the decay of energy storage life.
4.2.2. Constraints
The charge state of the energy storage will change when the energy storage life decay is taken into account; therefore, the operating constraint of energy storage becomes Equation (24):
The rest of the constraints are the same as in Section 4.1.2.
5. Example Analysis
In this paper, the typical daily load data of a park are selected, and the structural model diagram of an electricity–gas integrated energy system shown in Figure 1 is used for simulation analysis, and the parameters of each piece of equipment are shown in Table 1 [49,50,51,52]. The system’s new energy generation and load forecast data are shown in Figure 2, using peak and valley tariffs as shown in Table 2. In this paper, a particle swarm algorithm is used to simulate and analyze the optimal dispatching model of an integrated electricity–gas energy system to minimize the daily operating cost of the system.

Table 1.
System equipment parameters.
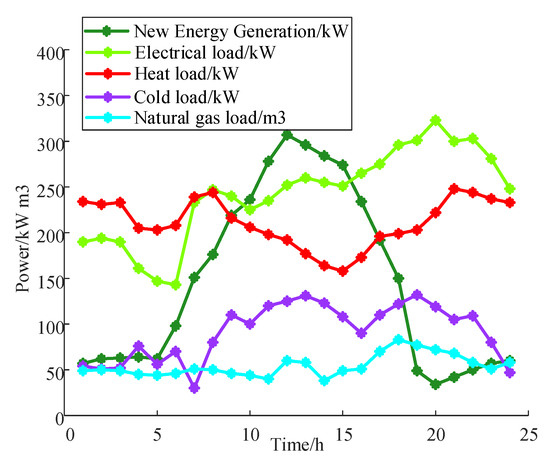
Figure 2.
New energy power generation and load day prediction.

Table 2.
Peak and valley period electricity prices.
From Figure 3, it can be seen that during the valley tariff period, the new energy output is not enough to provide the electric load required, so it is necessary to purchase power from the grid, and the battery is charged at this time so that it can be discharged during the peak tariff period to reduce the power purchased from the grid; during the peak tariff period, the new energy and gas turbine coordinate to supply power, and when the new energy output is insufficient, the battery starts to discharge to provide the rest of the required power together with the gas turbine.
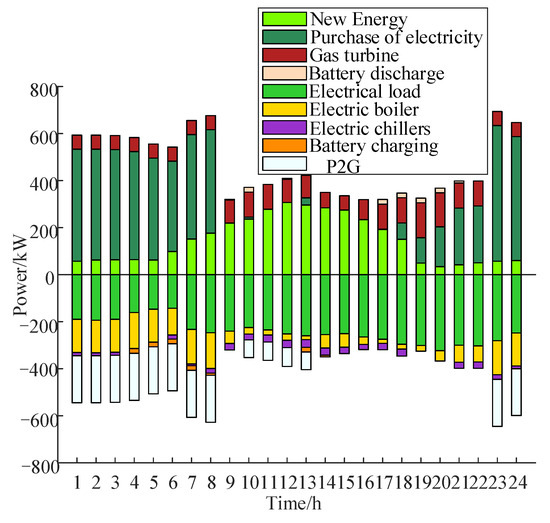
Figure 3.
Electric power optimization diagram.
From the thermal power optimization results in Figure 4, it can be seen that the heat load demand is high, and the electric boiler and heat exchanger are needed to provide heat energy at the same time. In the period of the flat tariff, the heat load demand is relatively small, and the heat energy is mainly provided by the gas turbine and the heat exchanger, and in the period of the valley tariff, the electric boiler is subject to the upper limit of output, and the heat exchanger is required to provide heat energy together.
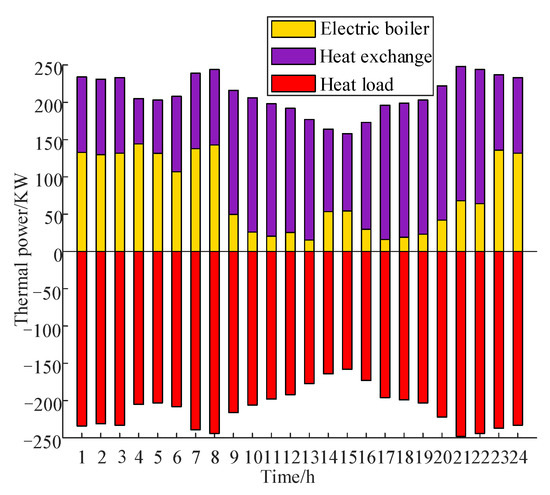
Figure 4.
Thermal power optimization diagram.
From the cold power optimization results in Figure 5, it can be seen that the energy required for the cold load is mainly provided by the electric chiller, which is because the electric chiller has lower operating costs than the gas turbine. When the waste heat generated by the gas turbine is not fully utilized by the heat exchanger, the absorption chiller uses the remaining waste heat to provide energy to the cold load at this time, avoiding the excess cost of the gas turbine due to heat dissipation.
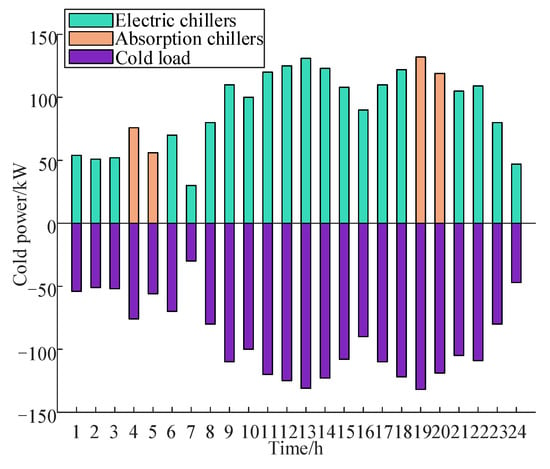
Figure 5.
Cold power optimization diagram.
From the gas power optimization results in Figure 6, it can be seen that the electric-to-gas equipment mainly participates in system optimization and dispatch during the valley tariff, which is because, during the valley tariff, the operating costs of electric-to-gas equipment are lower than the costs of gas purchase, while during the peak tariff, the operating costs of electric-to-gas equipment are higher, so the energy required by the gas load mainly comes from the gas grid.
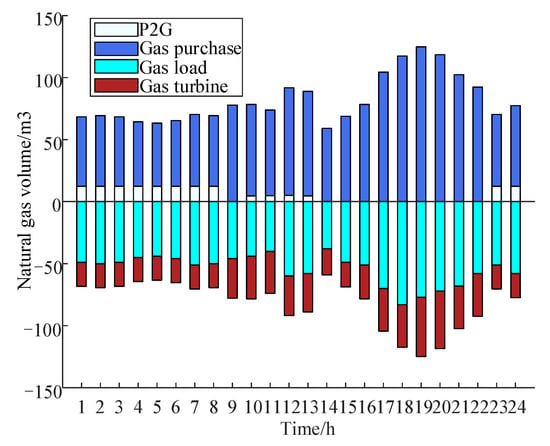
Figure 6.
Gas power optimization diagram.
From the optimization results in Figure 7, Figure 8 and Figure 9, it can be seen that the battery charging power is equal to the discharging power in a scheduling cycle, and there is no simultaneous charging and discharging; when storage life decay is not taken into account, the stored energy is frequently charging and discharging, and the change is more drastic; the SOC curve after taking into account storage life decay is more gentle, and the relative charging and discharging depth is lower, which achieves the effect of shallow charging and shallow discharging and prolongs the service life of the stored energy.
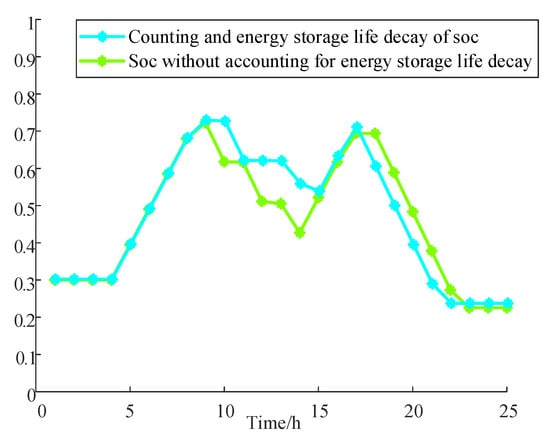
Figure 7.
SOC comparison of two cases.
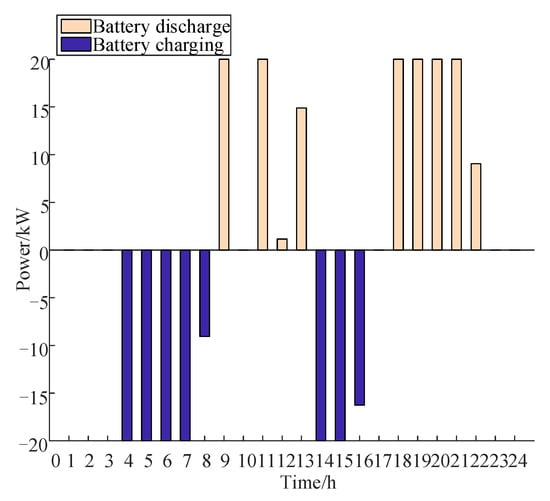
Figure 8.
Not counting the battery charge and discharge optimization map without energy storage life attenuation.
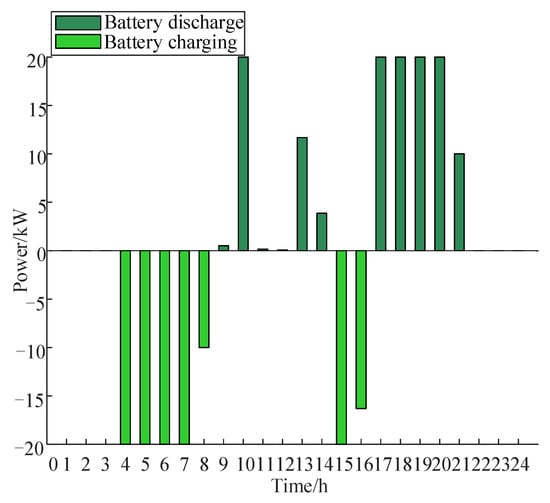
Figure 9.
Matching and discharging optimization of battery life attenuation battery.
Figure 10 shows the daily operating cost of the system under the two cases. The daily operating cost of the system is CNY 9139.3656 when storage life decay is not taken into account and CNY 9081.6026 when storage life decay is taken into account, with a comprehensive cost reduction of CNY 57.763. During the operation of the system, the battery not only effectively plays the role of peak-shaving and valley-filling, shortening the peak-to-valley difference of the system, but also reduces the operating costs of the system and improves the economy of the system.
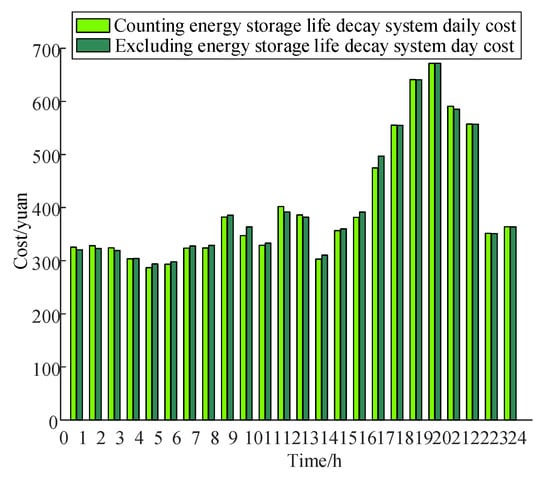
Figure 10.
Total cost diagram of system operations in two cases.
6. Conclusions
In this paper, we studied the energy storage life decay model and considered the influence of this factor in integrated energy system optimization scheduling, and we used the typical daily load data to analyze the calculation cases and optimize the power output of each piece of equipment in an electric–gas integrated energy system. We can obtain the following conclusions: comparing the results of the electric–gas integrated energy system optimization scheduling with and without energy storage life decay, the formerly established energy storage life decay model can not only measure the life decay of the energy storage battery during system operations but also optimize the charging and discharging process of the energy storage battery to extend its service life. Considering the influence of energy storage life decay in the process of system optimization and scheduling can also reduce system scheduling costs, which is of great significance for the economic operation of the system.
Author Contributions
Conceptualization, H.Z.; methodology, H.Z. and W.D.; software, H.Z., W.D. and J.D.; writing–review, H.Z.; data curation, W.D.; validation, W.D.; writing–original draft, W.D.; writing–review & editing, H.Z. and W.D.; resources, R.J. and J.D.; supervision, R.J. and J.D.; funding acquisition, R.J. and J.D. All authors have read and agreed to the published version of the manuscript.
Funding
This work was partly supported by the National Natural Science Foundation of China (Grant No. 52009106, 51779206) and the Key R&D Projects of Shaanxi Province (No. 2019ZDLJY18-03).
Institutional Review Board Statement
Not applicable.
Informed Consent Statement
Not applicable.
Data Availability Statement
Not applicable.
Conflicts of Interest
The authors declare no conflict of interest.
References
- Zhao, J.; Patwary, A.K.; Qayyum, A.; Alharthi, M.; Bashir, F.; Mohsin, M.; Hanif, I.; Abbas, Q. The determinants of renewable energy sources for the fueling of green and sustainable economy. Energy 2022, 238, 122029. [Google Scholar] [CrossRef]
- Al-Shahri, O.A.; Ismail, F.B.; Hannan, M.A.; Lipu, M.S.H.; Al-Shetwi, A.Q.; Begum, R.A.; Al-Muhsen, N.F.O.; Soujeri, E. Solar photovoltaic energy optimization methods, challenges and issues: A comprehensive review. J. Clean. Prod. 2021, 284, 125465. [Google Scholar] [CrossRef]
- Yoro, K.O.; Daramola, M.O.; Sekoai, P.T.; Wilson, U.N.; Eterigho-Ikelegbe, O. Update on current approaches, challenges, and prospects of modeling and simulation in renewable and sustainable energy systems. Renew. Sustain. Energy Rev. 2021, 150, 111506. [Google Scholar] [CrossRef]
- Guo, M.; Xia, M.; Chen, Q. A review of regional energy internet in smart city from the perspective of energy community. Energy Rep. 2022, 8, 161–182. [Google Scholar] [CrossRef]
- Li, P.; Wang, Z.; Wang, N.; Yang, W.; Li, M.; Zhou, X.; Yin, Y.; Wang, J.; Guo, T. Stochastic robust optimal operation of community integrated energy system based on integrated demand response. Int. J. Electr. Power Energy Syst. 2021, 128, 106735. [Google Scholar] [CrossRef]
- Li, Y.; Zou, Y.; Tan, Y.; Cao, Y.; Liu, X.; Shahidehpour, M.; Tian, S.; Bu, F. Optimal Stochastic Operation of Integrated Low-Carbon Electric Power, Natural Gas, and Heat Delivery System. IEEE Trans. Sustain. Energy 2018, 9, 273–283. [Google Scholar] [CrossRef]
- Nengroo, S.H.; Jin, H.; Lee, S. Management of Distributed Renewable Energy Resources with the Help of a Wireless Sensor Network. Appl. Sci. 2022, 12, 6908. [Google Scholar] [CrossRef]
- Xuewei, S.; Xuefang, S.; Wenqi, D.; Peng, Z.; Hongyan, J.; Jinfang, W.; Yang, W. Research on energy storage configuration method based on wind and solar volatility. In Proceedings of the 2020 10th International Conference on Power and Energy Systems (ICPES), Chengdu, China, 25–27 December 2020. [Google Scholar]
- Kebede, A.A.; Kalogiannis, T.; Van Mierlo, J.; Berecibar, M. A comprehensive review of stationary energy storage devices for large scale renewable energy sources grid integration. Renew. Sustain. Energy Rev. 2022, 159, 112213. [Google Scholar] [CrossRef]
- Amiryar, M.E.; Pullen, K.R. A Review of Flywheel Energy Storage System Technologies and Their Applications. Appl. Sci. 2017, 7, 286. [Google Scholar] [CrossRef]
- da Silva Lima, L.; Quartier, M.; Buchmayr, A.; Sanjuan-Delmás, D.; Laget, H.; Corbisier, D.; Mertens, J.; Dewulf, J. Life cycle assessment of lithium-ion batteries and vanadium redox flow batteries-based renewable energy storage systems. Sustain. Energy Technol. Assess. 2021, 46, 101286. [Google Scholar] [CrossRef]
- Gao, J.; Yang, Y.; Gao, F.; Wu, H. Two-Stage Robust Economic Dispatch of Regional Integrated Energy System Considering Source-Load Uncertainty Based on Carbon Neutral Vision. Energies 2022, 15, 1596. [Google Scholar] [CrossRef]
- Zhang, N.; Jian, X.; Ding, Y.; Wang, Y.; Chen, L. Day-ahead Low-Carbon Economical Dispatch of Integrated Energy System with CSP and ORC Based on Improved Imperialist Competitive Algorithm. In IOP Conference Series: Earth and Environmental Science; IOP Publishing: Bristol, UK, 2021; Volume 814, No. 1. [Google Scholar]
- Gao, Y.; Ai, Q. A novel optimal dispatch method for multiple energy sources in regional integrated energy systems considering wind curtailment. CSEE J. Power Energy Syst. 2022. [Google Scholar] [CrossRef]
- Yan, X.W.; Deng, H.R.; Guo, Q.; Qu, W. Study on the stateof health detection of power batteries based on adaptiveunscented kalman filters and the battery echelon utilization. Trans. China Electrotech. Soc. 2019, 34, 3937–3948. [Google Scholar]
- Bai, Y.; He, H.; Li, J.; Li, S.; Wang, Y.-X.; Yang, Q. Battery anti-aging control for a plug-in hybrid electric vehicle with a hierarchical optimization energy management strategy. J. Clean. Prod. 2019, 237, 117841. [Google Scholar] [CrossRef]
- Zhang, W.; Son, S.B.; Guthrey, H.; Ban, C. Mitigation of rapid capacity decay in silicon-LiNi0. 6Mn0. 2Co0. 2O2 full batteries. Energy Storage Mater. 2022, 49, 111–121. [Google Scholar] [CrossRef]
- Zhang, Y.; Tang, Q.; Zhang, Y.; Wang, J.; Stimming, U.; Lee, A.A. Identifying degradation patterns of lithium ion batteries from impedance spectroscopy using machine learning. Nat. Commun. 2020, 11, 1706. [Google Scholar] [CrossRef]
- Tang, X.; Liu, K.; Wang, X.; Gao, F.; MacRo, J.; Widanage, W.D. Model migration neural network for predicting battery aging trajectories. IEEE Trans. Transp. Electrific. 2020, 6, 363–374. [Google Scholar] [CrossRef]
- Wang, Z.; Zeng, S.; Guo, J.; Qin, T. State of health estimation of lithium-ion batteries based on the constant voltage charging curve. Energy 2019, 167, 661–669. [Google Scholar] [CrossRef]
- Richardson, R.R.; Birkl, C.R.; Osborne, M.A.; Howey, D.A. Gaussian process regression for in situ capacity estimation of lithium-ion batteries. IEEE Trans. Ind. Inf. 2019, 15, 127–138. [Google Scholar] [CrossRef]
- Richardson, R.R.; Osborne, M.A.; Howey, D.A. Battery health prediction under generalized conditions using a Gaussian process transition model. J. Energy Storage 2019, 23, 320–328. [Google Scholar] [CrossRef]
- Chinomona, B.; Chung, C.; Chang, L.-K.; Su, W.-C.; Tsai, M.-C. Long short-term memory approach to estimate battery remaining useful life using partial data. IEEE Access 2020, 8, 165419–165431. [Google Scholar] [CrossRef]
- Lucu, M.; Martinez-Laserna, E.; Gandiaga, I.; Liu, K.; Camblong, H.; Widanage, W.D.; Marco, J. Data-driven nonparametric Li-ion battery ageing model aiming at learning from real operation data—Part A: Storage operation. J. Energy Storage 2020, 30, 101409. [Google Scholar] [CrossRef]
- Lee, S.; Siegel, J.B.; Stefanopoulou, A.G.; Lee, J.-W.; Lee, T.-K. Electrode state of health estimation for lithium ion batteries considering half-cell potential change due to aging. J. Electrochem. Soc. 2020, 167, 090531. [Google Scholar] [CrossRef]
- Atalay, S.; Sheikh, M.; Mariani, A.; Merla, Y.; Bower, E.; Widanage, W.D. Theory of battery ageing in a lithium-ion battery: Capacity fade, nonlinear ageing and lifetime prediction. J. Power Sources 2020, 478, 229026. [Google Scholar] [CrossRef]
- Shi, Y.; Xu, B.; Wang, D.; Zhang, B. Using battery storage for peak shaving and frequency regulation: Joint optimization for superlinear gains. IEEE Trans. Power Syst. 2017, 33, 2882–2894. [Google Scholar] [CrossRef]
- Hu, X.; Zou, C.; Tang, X. Cost-optimal energy management of hybrid electric vehicles using fuel cell/battery health-aware predictive control. IEEE Trans. Power Electron. 2020, 35, 382–389. [Google Scholar] [CrossRef]
- Yan, N.; Li, X.; Zhong, Y. Life decay characteristics identification method of retired power batteries based on inverse power law model of accelerated life test. Energy Rep. 2022, 8, 950–956. [Google Scholar] [CrossRef]
- Han, S.; Han, S.; Aki, H. A practical battery wear model for electric vehicle charging applications. Appl. Energy 2014, 113, 1100–1108. [Google Scholar] [CrossRef]
- Foggo, B.; Yu, N. Improved battery storage valuation through degradation reduction. IEEE Trans. Smart Grid 2017, 9, 5721–5732. [Google Scholar] [CrossRef]
- Wang, L.; Chen, Q.; He, G.; Zhong, G.; Kang, C. Plasticity plan optimization considering battery energy storage life model. Autom. Electr. Power Syst. 2019, 43, 93–100. [Google Scholar]
- Feng, Z.; Xu, Y.; Wang, K.; Yin, H. Optimized configuration of microcarbon battery storage capacity considering life loss. J. Power Supply 2022, 1–16. [Google Scholar]
- Hamouda, N.; Babes, B.; Boutaghane, A.; Kahla, S.; Mezaache, M. Optimal tuning of PIλDμ controller for PMDC motor speed control using ant colony optimization algorithm for enhancing robustness of WFSs. In Proceedings of the 2020 1st International Conference on Communications, Control Systems and Signal Processing (CCSSP), EL Oued, Algeria, 16–17 May 2020; pp. 364–369. [Google Scholar]
- Krama, A.; Zellouma, L.; Benaissa, A.; Rabhi, B.; Bouzidi, M. Design and experimentalinvestigation of predictive direct power control of three-phase shunt active filter with space vector modulationusing anti-windup PI controller optimized by PSO. Arab. J. Sci. Eng. 2019, 44, 6741–6755. [Google Scholar] [CrossRef]
- Babes, B.; Boutaghane, A.; Hamouda, N.; Kahla, S.; Kellai, A.; Ellinger, T.; Petzoldt, J. New Optimal Control of Permanent Magnet DC Motor for Photovoltaic Wire FeederSystems. J. Eur. Des Systèmes Autom. 2020, 53, 811–823. [Google Scholar] [CrossRef]
- Hamouda, N.; Babes, B.; Kahla, S.; Boutaghane, A.; Beddar, A.; Aissa, O. ANFIS controller design using PSO algorithm for MPPT of solar PV system powered brushless DC motor based wire feeder unit. In Proceedings of the 2020 International Conference on Electrical Engineering (ICEE), Istanbul, Turkey, 25–27 September 2020. [Google Scholar]
- Babes, B.; Albalawi, F.; Hamouda, N.; Kahla, S.; Ghoneim, S.S.M. Fractional-fuzzy PID control approach of photovoltaic-wire feeder system (PV-WFS): Simulation and HIL-based experimental investigation. IEEE Access 2021, 9, 159933–159954. [Google Scholar] [CrossRef]
- Menos-Aikateriniadis, C.; Lamprinos, I.; Georgilakis, P.S. Particle Swarm Optimization in Residential Demand-Side Management: A Review on Scheduling and Control Algorithms for Demand Response Provision. Energies 2022, 15, 2211. [Google Scholar] [CrossRef]
- Reale, F.; Sannino, R. Numerical Modeling of Energy Systems Based on Micro Gas Turbine: A Review. Energies 2022, 15, 900. [Google Scholar] [CrossRef]
- Mao, A.; Yu, T.; Ding, Z.; Fang, S.; Guo, J.; Sheng, Q. Optimal scheduling for seaport integrated energy system considering flexible berth allocation. Appl. Energy 2022, 308, 118386. [Google Scholar] [CrossRef]
- Teng, Y.; Sun, P.; Leng, O.; Chen, Z.; Zhou, G. Optimal operation strategy for combined heat and power system based on solid electric thermal storage boiler and thermal inertia. IEEE Access 2019, 7, 180761–180770. [Google Scholar] [CrossRef]
- Luo, Z.; Wang, J.; Xiao, N.; Yang, L.; Zhao, W.; Geng, J.; Lu, T.; Luo, M.; Dong, C. Low Carbon Economic Dispatch Optimization of Regional Integrated Energy Systems Considering Heating Network and P2G. Energies 2022, 15, 5494. [Google Scholar] [CrossRef]
- Wang, L.; Dong, H.; Lin, J.; Zeng, M. Multi-objective optimal scheduling model with IGDT method of integrated energy system considering ladder-type carbon trading mechanism. Int. J. Electr. Power Energy Syst. 2022, 143, 108386. [Google Scholar] [CrossRef]
- Kalair, A.; Abas, N.; Saleem, M.S.; Kalair, A.R.; Khan, N. Role of energy storage systems in energy transition from fossil fuels to renewables. Energy Storage 2021, 3, e135. [Google Scholar] [CrossRef]
- Xu, C. Optimal configuration of energy storage capacity under the access of electric vehicles in V2G mode. Nanjing Univ. Posts Telecommun. 2021, 001098. [Google Scholar] [CrossRef]
- Wang, H.; Yu, H.; Jin, Y.; Wang, S.; Guo, X.; Xiao, X.; Huang, X. Commercial Li_4TI_5O_(12) Battery Rate Circulation Capacity Attenuation Model. Energy Storage Sci. Technol. 2017, 6, 584–589. [Google Scholar]
- Ren, J.; Sun, Z.; Gu, Q.; Geng, S.; Chang, F.; Wang, Q. Optimized configuration of integrated energy system for energy storage full life cycle operation and maintenance. Guangdong Electr. Power 2019, 32, 71–78. [Google Scholar]
- Du, L. Research on economic scheduling for integrated electricity and natural gas energy systems. Tohoku Univ. Electr. Power 2018. [Google Scholar]
- Xu, Q.; Li, L.; Cai, J.; Luan, K.; Yang, B. Day-ahead Optimization of Economic Dispatching of Cold, Hot and electric Multi-micro grid System considering electrical energy interaction. Power Syst. Autom. 2018, 42, 36–46. [Google Scholar]
- Xu, C.; Dong, S.; Zhang, S.; Liu, Y.; Xiong, W. Centralized distributed integrated Demand Response Method for Industrial Parks. Power Grid Technol. 2021, 45, 489–500. [Google Scholar]
- Huang, W.; Liu, W. Optimization planning of integrated energy station in the Park based on multi-energy complementation. Autom. Power Syst. 2020, 44, 20–28. [Google Scholar]
Disclaimer/Publisher’s Note: The statements, opinions and data contained in all publications are solely those of the individual author(s) and contributor(s) and not of MDPI and/or the editor(s). MDPI and/or the editor(s) disclaim responsibility for any injury to people or property resulting from any ideas, methods, instructions or products referred to in the content. |
© 2023 by the authors. Licensee MDPI, Basel, Switzerland. This article is an open access article distributed under the terms and conditions of the Creative Commons Attribution (CC BY) license (https://creativecommons.org/licenses/by/4.0/).