Article

Learning Models for Bone Marrow Edema Detection in Magnetic Resonance Imaging

1
INESC TEC— Institute for Systems and Computer Engineering, Technology and Science, 4200-465 Porto, Portugal
2
FEUP—Faculty of Engineering, University of Porto, 4200-465 Porto, Portugal
3
FCUP—Faculty of Science, University of Porto, 4169-007 Porto, Portugal
4
UHCSJ—University Hospital Center of São João, 4200-319 Porto, Portugal
5
FMUP—Faculty of Medicine, University of Porto, 4200-319 Porto, Portugal
*
Author to whom correspondence should be addressed.
Appl. Sci. 2023, 13(2), 1024; https://doi.org/10.3390/app13021024
Submission received: 15 December 2022 / Revised: 6 January 2023 / Accepted: 8 January 2023 / Published: 12 January 2023
(This article belongs to the Special Issue Applications of Artificial Intelligence in Medical Imaging)

Abstract

:
Bone marrow edema (BME) is the term given to the abnormal fluid signal seen within the bone marrow on magnetic resonance imaging (MRI). It usually indicates the presence of underlying pathology and is associated with a myriad of conditions/causes. However, it can be misleading, as in some cases, it may be associated with normal changes in the bone, especially during the growth period of childhood, and objective methods for assessment are lacking. In this work, learning models for BME detection were developed. Transfer learning was used to overcome the size limitations of the dataset, and two different regions of interest (ROI) were defined and compared to evaluate their impact on the performance of the model: bone segmention and intensity mask. The best model was obtained for the high intensity masking technique, which achieved a balanced accuracy of 0.792 ± 0.034. This study represents a comparison of different models and data regularization techniques for BME detection and showed promising results, even in the most difficult range of ages: children and adolescents. The application of machine learning methods will help to decrease the dependence on the clinicians, providing an initial stratification of the patients based on the probability of edema presence and supporting their decisions on the diagnosis.

1. Introduction

Bone marrow (BM) is a highly cellular connective tissue contained within the bones. Bone marrow edema (BME) or the more recently termed edema-like marrow signal intensity (ELMSI) [1], is the generic term applied to bone marrow signal intensity changes in magnetic resonance imaging (MRI) and is characterized by areas of high signal intensity in fluid-sensitive sequences (T2 or proton-density (PD) weighted images with fat-suppression, or short tau inversion-recovery (STIR)), and areas of intermediate-to-low signal intensity in T1-weighted images [2]. MRI has been, in recent decades, the most common imaging modality for evaluating patients affected by pain in the bones or joints, for whom X-rays images are first assessed by clinicians as inconclusive [3]. Since BME is characterized by replacing fat-rich components with water-based components, MRI is the most adequate method for its detection; however, there are several challenges associated with this finding. Changes at the biochemical level in the bone marrow can occur physiologically during the development of the skeleton, which represents additional difficulty in diagnosing this clinical condition, especially in children and young adults. With such heterogeneity in imaging BME manifestations, visual detection is more susceptible to error and highly depends on the experience of the physician and the equipment used for image acquisition.
Developing machine learning (ML) strategies for the classification of BME in MRI will help clinicians by reducing their workload and the time associated with decision-making, as well as decreasing the error related to the diagnostic challenges previously mentioned. However, the application of the pattern recognition power of deep learning applied to this problem is still in its early days. One of the biggest problems with these approaches is data scarcity, which limits the development of robust solutions. The proposal of regions of interest to reduce the search space for BME-related patterns has been widely explored [4,5], reducing the amount of redundant information that should be ignored by the learning model. However, since these approaches require more clinical annotation efforts, intensity-based masking (IBM) is a promising strategy to select the part of an image that can be relevant to a prediction when the physiological signal that wants to be measured is related to the intensity of the pixels [6]. On the other hand, the small size of the data collection is prone to produce biased solutions, incapable of generalizing in real-world scenarios; therefore, the use of pre-trained networks represents an option to overcome this limitation [7]. The pre-trained approaches have been extensively used in the medical domain and in very close challenges, such as for malignant lesion detection in the bone using MRI [8,9]. Works dedicated to BME detection in MRI are very scarce and are focused mainly on adult patients. In the work of Lee et al. [4], a convolutional neural network (CNN) was trained using data augmentation and transfer learning to detect BME of the sacroiliac joint [4]. The ROIs containing the sacral and iliac bones were extracted from the MRI slices, and random noise was added to them in order to increase the robustness of the model to possible noise formed during the acquisition of the MRI. The learning model achieved an accuracy of 83% for images containing the full and non-cropped MRI scan and 93% for the images containing only the ROI. Another work developed learning models for osteoarthritis detection, which presents morphological and degenerative changes in the hip joint, which could be detected in MRI sequences by identifying abnormalities in the bone and cartilage, as is the case with BME [5]. A pre-trained DenseNet-100 was used to classify the patients as healthy or unhealthy, achieving a sensitivity of 73% and specificity of 92%. A three-dimensional CNN was trained for a more generalist detection of lesions, trying to identify abnormalities on the knee using MRI [10]. The learning model for the abnormality detection showed more difficulty on the BME lesions with the lowest sensitivity of 70%. Due to the relevance to determine the BME, other strategies were developed, trying to combine other medical imaging techniques and artificial intelligence methods. Dual-energy computed tomography was used as a substitute for magnetic resonance imaging, and a standard CNN was trained to identify the disease from axial bone images and the local positions of BME [11]. The classification model achieved an F1-score of 79.4%.
The few works dedicated to BME have neglected younger patients, which represents a source of diagnostic challenges due to the changes that occur in bone development during this phase of life [12]. Changes in the bone marrow can occur naturally in children and young adults, making BME detection more difficult and representing an important target for AI-based clinical decision-making support. For this specific population, a CNN-based method was trained to segment the bone marrow signal [13]. The T2-weighted images were split by three intensity levels for bone marrow signal: 1 = slightly increased; 2 = mildly increased; 3 = moderately to highly increased. The performance of the bone marrow signal segmentation showed the poorest results for the highest signal intensity.
An automated method for the classification of BME is extremely relevant, as there are no base guidelines for quantitative measurements. This work is dedicated to developing learning models for BME prediction and exploring the challenges surrounding the visual classification of BME in MRI sequences of children and adolescents. Transfer learning and data augmentation techniques were used to prevent overfitting due to the small size of the dataset available for this work. Two different regions on the MRI were studied: bone segmention and regions from intensity-based masking. The performance results were compared in order to assess the impact of the extension of the region for the analysis. The intensity masking was performed to help select regions in the image for the BME detection, reducing the information on the input image that can be noisy for the learning models. With this reduction to the small parts of the bone, it was expected that the learning model would be more focused on the relevant regions and improve the performance of the BME prediction.

2. Materials and Methods

This section contains a description of the dataset used for the experiments, the implemented pre-processing steps, and the learning models developed for BME prediction.

2.1. Dataset and Pre-Processing

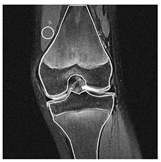
The dataset collected at the University Hospital Center of São João (UHCSJ) contains T1 and fluid-sensitive sequences of 36 non-edema and 28 edema patients. This dataset contains MRI examinations of the coronal, axial, and sagittal planes of the knee. The MRI was analyzed in the different planes, and annotations were performed in the coronal plane. Clinical annotations of the MRI scans were conducted by one radiologist and one radiology resident, and all of the annotations were double-checked with a concordance review. All sequences were annotated, namely with the shape of the bones (femur and tibia), and, in patients with BME, the areas that corresponded to this finding were also annotated. One slice of each sequence was also annotated with a circle in the quadriceps muscle for a possible normalization process. Examples of MRI slices from edema and non-edema patients and the correspondent annotations are present in Figure 1.
In total, the dataset of edema patients with bone segmented contains 313 slices (approximately 11 slices per patient with bone segmented), 228 slices positive with BME regions, and 85 slices without BME regions. For the non-edema patients, the radiologists annotated the bone region in only one slice, which originated only 36 non-edema slices. Since there are only 36 bone segmentations from non-edema patients in the dataset, the segmented slices from edema patients with BME regions were labeled as edema, while the ones without BME regions were labeled as non-edema. This process was inspired by the work of Chuah et al. [14], in which slices of edema patients that did not contain BME regions appeared to show no differences when compared to slices of non-edema patients. Table 1 summarizes the number of slices and patients on the dataset.
The mean age of all patients is 14.35 ± 2.81 years old in a range between 4 and 17 years old. Among the studied classes, the mean age of edema patients is very similar to non-edema ones (14.68 ± 1.93 and 14.14 ± 3.36, respectively).
The pre-processing of the data consisted of two steps: segmentation and normalization. The annotations from the clinicians, such as the ones represented in Figure 1, were used to segment the bone region. Each image was then normalized, dividing each pixel intensity by the corresponding maximum intensity of its image.

2.2. High Intensity Masking (IBM)

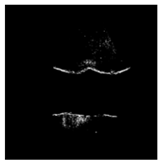
Since BME regions are defined by areas of bone with abnormal (higher) signal intensity in fluid-sensitive sequences, a masking method was used to highlight the range of intensities of BME. The bone pixel intensities vary between different patients, and, for this reason, a fixed range could not be used to isolate the BME regions across all patients; rather, an adaptive range was computed. As described in Figure 2, computing the target mean ( μ ) and standard deviation ( σ ) values was attempted using the segmentation masks of the bone regions provided by clinicians. Afterward, the values of all pixels were bounded to a range given by [ μ + α × σ , μ + β × σ ] . The values of 0.5, 1, 1.5, 2, and 2.5 were tested for α and β in order to determine the best limits for IBM implementation. All the intensities below the minimum value of the threshold are set to this minimum value ( μ + α × σ ), and intensities above the maximum value are set to the maximum value of the range ( μ + β × σ ). After that, the images are normalized using the MinMax algorithm with 0 and 255 as the final lower and upper limits of the image.

2.3. Learning Models

The learning models developed in this work were based on the architecture of Resnet-18 [15], exploring the possibility of training the whole network from scratch or using the pre-trained weights from ImageNet [16]. Table 2 presents the list of values considered for the hyperparameter manual search applied. Transfer learning has proven to be a helpful technique to decrease overfitting across multiple medical imaging applications, mostly in small data regimes [17,18]. In particular, Resnet-18 has been employed in previous BME classification works [4] and has shown great data efficiency in feature extraction. Initially, a pre-trained model was used with all layers kept frozen except for the classifier. The layers are progressively unfrozen; i.e., the weights are loaded from the pre-training on ImageNet, and then, layer by layer, Resnet-18 is unfrozen, allowing for fine-tuning of the weights of the unfrozen later layers. Then, the model is trained and tested.

2.4. Experimental Design

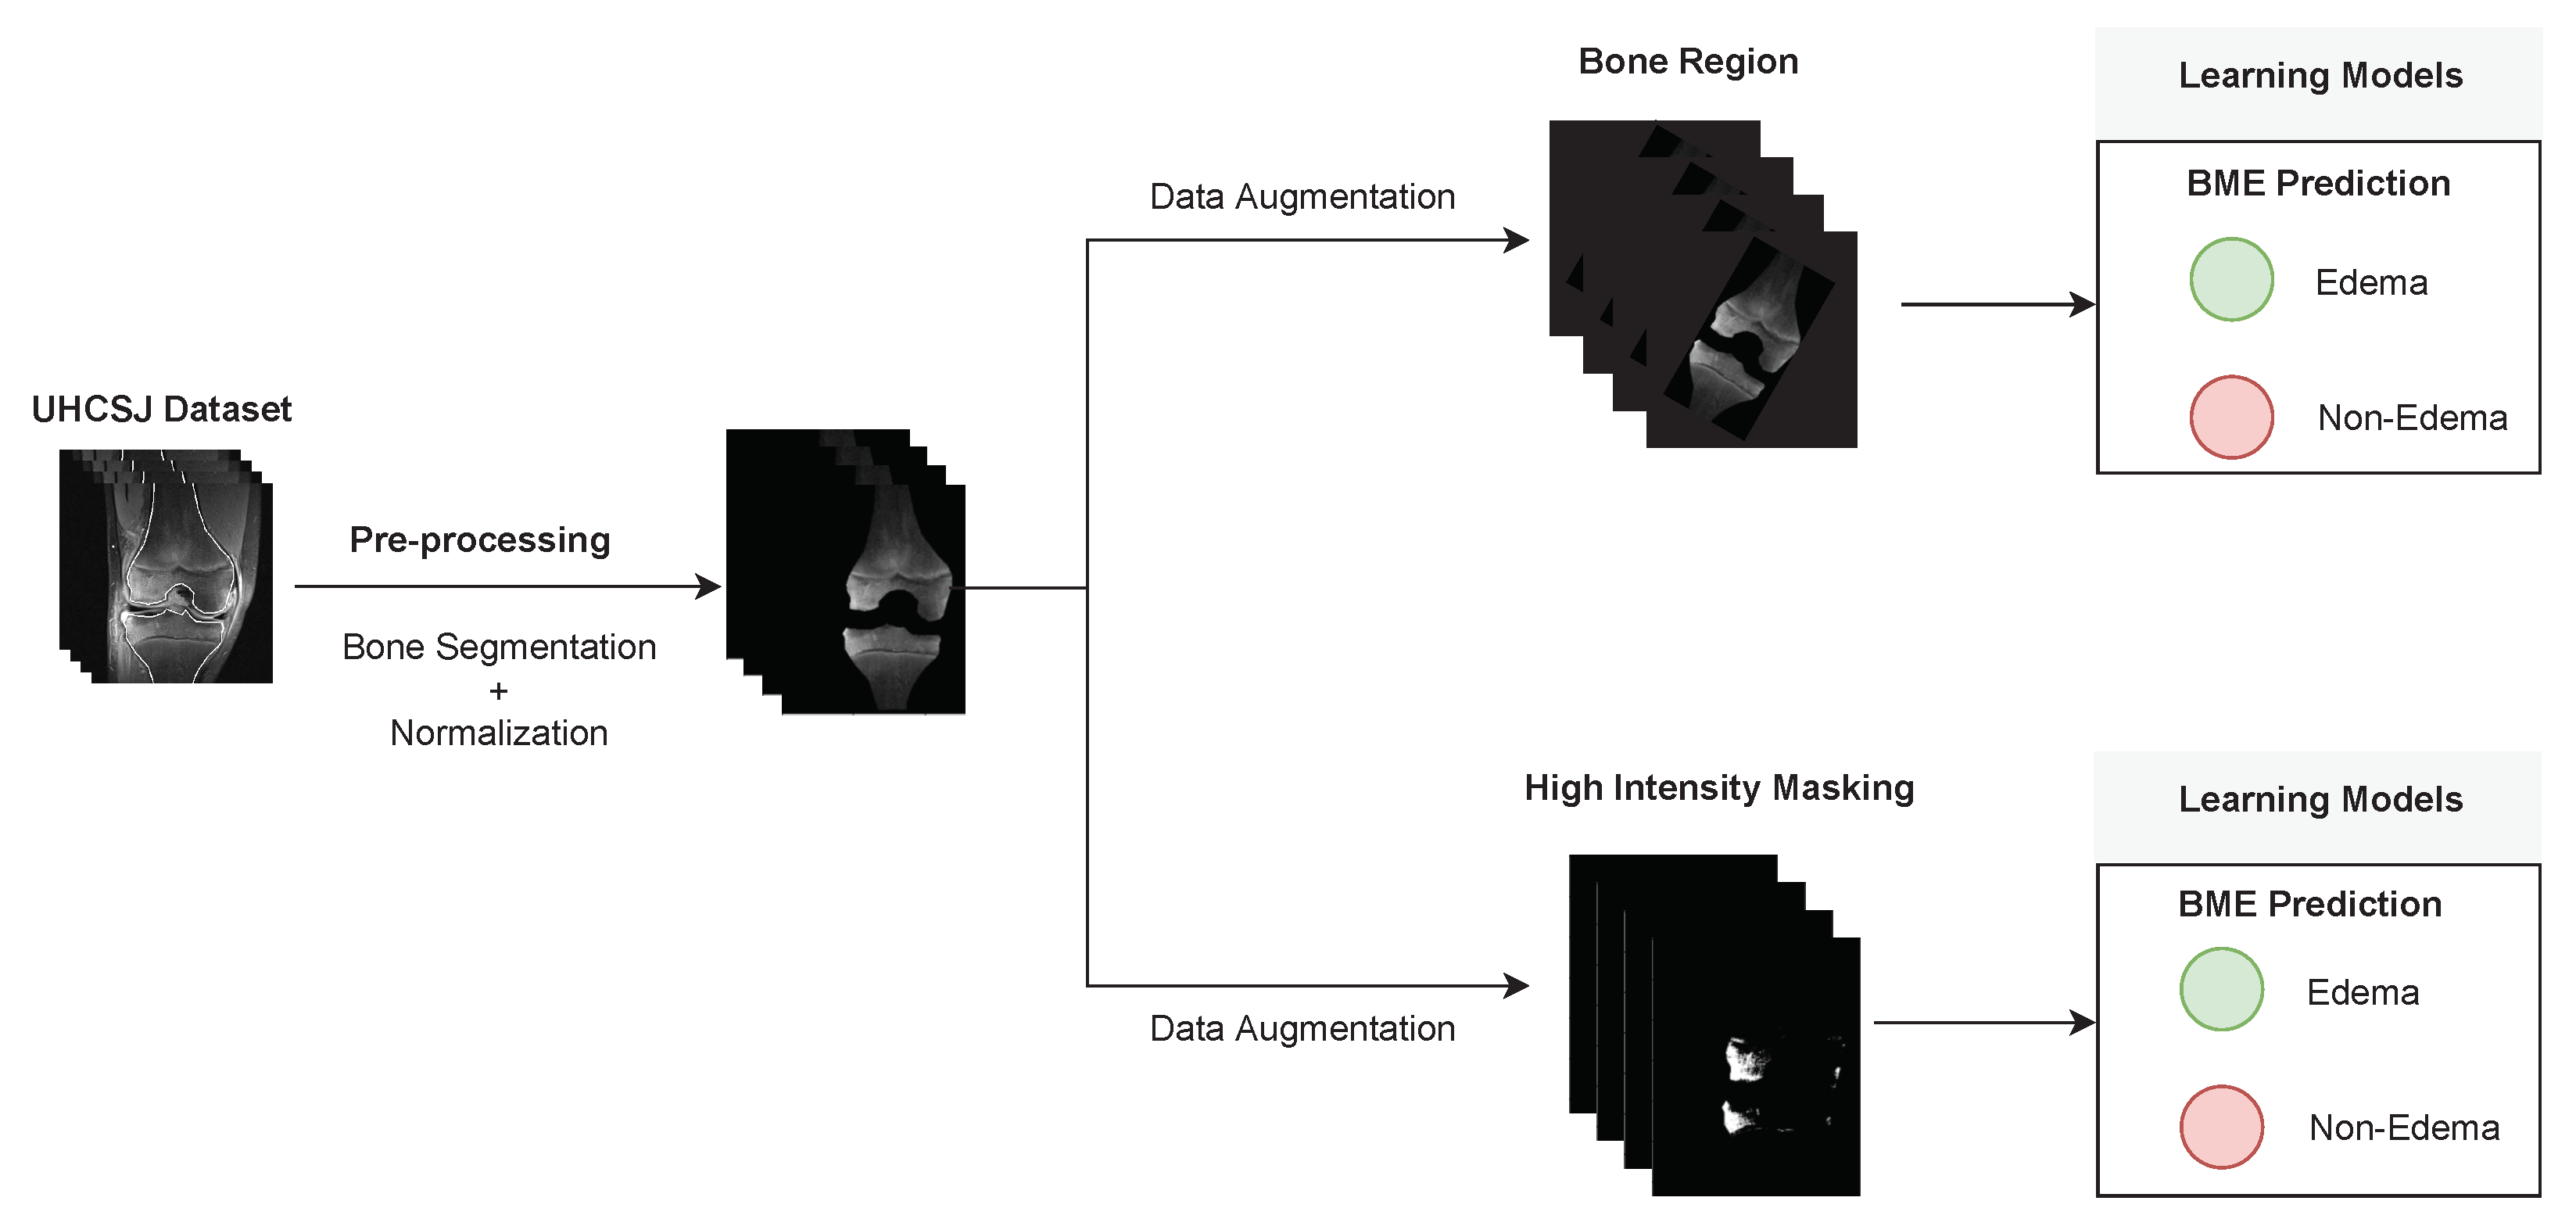
An overview of the developed work is presented in Figure 3, showing the combination of the learning models and ROIs used in this work.
In order to decrease the overfitting effect, data augmentation techniques were used: horizontal flip, vertical flip, random shear, random perspective, rotation, and Gaussian blur.
For each experiment, the dataset was split into train/validation/test sets and was shuffled by patients following a 60%/20%/20% distribution. Since the dataset was originally unbalanced, oversampling on the non-edema label was performed for the training set by adding a copy of the images before applying data augmentation. Balanced accuracy was the metric used to evaluate the performance. The 36 bone segmentations extracted from the 36 non-edema patients were added to the test set at a later stage to evaluate the robustness of the model.

3. Results and Discussion

From the experimental tune, for the high intensity masking technique, α = 1.5 × σ and β = 2 × σ were selected. These thresholds were determined by visually assessing the final image with the goal of detecting the BME regions while avoiding the detection of noise and structures, such as the growth plate.
Initially, experiments with hyperparameters were conducted to reach stable and efficient training. The results of these experiments were a learning rate of 0.001 and a batch size of 112 (due to computational limits), and the best optimizer was stochastic gradient descent with a momentum of 0. These hyperparameters were kept throughout the experiments, and cross-entropy was used as the loss function.
To fine-tune the models combined with high intensity masking technique, the best result corresponds to freezing 6 of the 10 layers of the Resnet-18. This model achieved a balanced accuracy of 0.852 and an AUC of 0.964 (Table 3). The confusion matrix of the test set for the best predictive model is presented in Table 4. For the bone segmentation approach, the best result after fine-tuning the model was a balanced accuracy of 0.568 and an AUC of 0.550, achieved when freezing six layers.
Fine-tuning the best model that uses high intensity masking leads to much better results; however, it is possible that these approaches are way too hindered by the small size of the datasets. The progressive unfreezing of layers during training, using the high intensity masking technique, achieved the highest validation balanced accuracy when six layers were frozen. After that mark, the validation balanced accuracy decreased, but that may be due to the model already being overfitted. The balanced accuracy on the test set improved massively due to the model now correctly predicting 8 of the 10 non-edema patients. This result was a big improvement compared to the model trained from scratch and had a very promising outcome. Considering the different regularization methods applied to overcome the evident overfitting effect during training, Table 3 suggests that only a specific combination is capable of achieving a satisfactory hypothesis concerning not only the search-space complexity of BME-related imaging patterns but also the number of trainable parameters. In related approaches, model-level regularization techniques are the most common choices to manage the overfitting problem (e.g., use of pre-trained networks [7], dropout [19], and weight decay [20]); however, our results show that even with strong attempts at this level, only a data-level regularization, such as the HIM, enabled the construction of a more generalizable model by significantly reducing the presence of noisy and irrelevant information. This result may create helpful implications for future works, in which data scarcity still prevents the application of deep learning solutions.
In an attempt to more confidently assess the performance of the high intensity masking method, the dataset was shuffled five times to produce five different train/validation/test sets, and the Resnet-18 was trained and tested in each experiment. The random splits performed allow to assess the impact of the dataset used for train and testing, which normally have a huge impact on the performance results of the model when trained with small datasets and difficult problems of the classification. Additionally, in order to determine the robustness of this method on non-edema slices, the 36 segmentations of bones from non-edema patients were added to the test set as a validation set. The results are depicted in Table 5 by directly comparing the averaged performance obtained with and without merging the samples from the validation set of 36 non-edema patients.
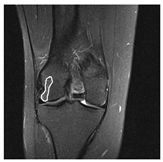
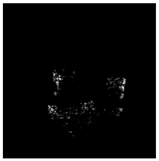
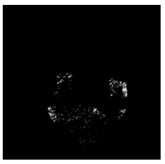
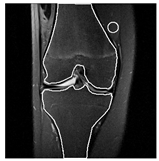
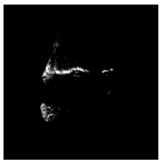
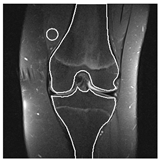
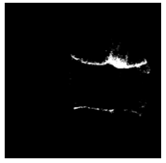
The model achieved satisfactory predictions, reaching an average balanced accuracy of 0.792 on the test sets without non-edema patient segmentations and 0.672 on the test sets with non-edema patient segmentations. When looking at the slices that the model misclassified (see Table 6), it is clear that it was underperforming more on the non-edema samples, especially the ones which contained noise that looked similar to BME regions.

Limitations

This work presents limitations. The main one is related to the dataset’s size, but others can be discussed. Due to the higher sensitivity of fluid-sensitive sequences, the final image can include noise that wrongfully appears to be a BME region. The results suggest that the growth plate regions, also highlighted by the high intensity masking technique, could represent an issue for the network. Other structures still remain wrongfully highlighted, confounding the model by appearing to be similar to real BME regions (these artifacts can be seen in row 3 of Table 6). These noise areas were more common on non-edema slices, which could explain the underperformance of the model in this class. On the other hand, the incorrect classification could be a consequence of having non-edema slices from patients with edema in other slices. The patients with edema have regions without a clear signal of BME for the radiologists, and in this case, those slices were not annotated as edema; however, the masking method can still capture BME intensities, which is a limitation from not having a ground-truth based on an objective measurement of BME, but, instead, on a visual assessment from the radiologists.
Another important limitation relies on the fact that this method requires the availability of bone segmentation masks in order to remove intensities detected in other tissues. The development of an automatic bone segmentation method to be used before the application of the high intensity mask could be a possible option to avoid the need for manually acquired masks; however, this additional task brings several challenges [21,22,23]. On the other hand, an end-to-end approach can use the entire MRI slice and deal with parts of the image that do not contribute to the final detection of the BME. Either way, each of these options requires larger datasets for model training, and can only be possible if more data is accessible in the future.

4. Conclusions

In many medical problems, it is often hard to obtain large datasets, which hinders the use of deep learning methods. The experiments performed in this work attempted to find a solution for BME classification using a small collection of MRI data, with the additional challenge of focusing on under-18 patients. To reduce overfitting, an extensive search for a different model- and data-level regularization techniques was made, showing that a specific combination of these methods must be found to tackle the particular overfitting effect that might be occurring; in this case, the high intensity masking technique applied to fluid-sensitive sequences played a crucial role and provided the most promising results. The high intensity masking technique applied to fluid-sensitive sequences achieved the most promising results.
The next step, after the automatic edema detection, will be the quantification of the lesion. The Radiologist usually performs a qualitative assessment of the edema grade. A quantitative score of the severity may help the clinicians to make a more objective analysis and better assessment of the treatment impact. Additionally, for future work, the high intensity masking technique should be refined to improve results on non-edema cases. Furthermore, developing a variation of this technique for T1 sequences (less sensitive than fluid-sensitive sequences) would make the combination of both MRI sequences possible, which could result in a much more robust final prediction.

Author Contributions

G.R., F.S., S.C.D., T.P. and H.P.O. conceived this study. D.C.C. and S.C.D. provided clinical and radiological insights. G.R. and F.S. developed the software. G.R., T.P. and J.S. drafted the manuscript. All authors provided critical feedback and contributed to the final manuscript. All authors have read and agreed to the published version of the manuscript.

Funding

This work was partially financed by National Funds through the Portuguese funding agency, FCT-Foundation for Science and Technology Portugal, within a PhD Grant Number: 2021.05767.BD.

Institutional Review Board Statement

All procedures performed were in accordance with the ethical standards of the institutional research ethics commission of UHCSJ.

Informed Consent Statement

Since this study is a retrospective review and does not involve prospective enrollment of subjects, no consent was obtained. All procedures were performed in accordance with the ethical standards of the Institutional Research Ethics Commission.

Data Availability Statement

Data is unavailable due to privacy and ethical restrictions.

Acknowledgments

The authors acknowledge the Director of the Radiology Department of the UHCSJ, António Madureira.

Conflicts of Interest

The authors declare no conflict of interest.

References

  1. Maraghelli, D.; Brandi, M.L.; Matucci Cerinic, M.; Peired, A.J.; Colagrande, S. Edema-like marrow signal intensity: A narrative review with a pictorial essay. Skelet. Radiol. 2021, 50, 645–663. [Google Scholar] [CrossRef] [PubMed]
  2. von Brandis, E.; Zadig, P.K.; Avenarius, D.F.; Flatø, B.; Kristian Knudsen, P.; Lilleby, V.; Nguyen, B.; Rosendahl, K.; Ording Müller, L.S. Whole body magnetic resonance imaging in healthy children and adolescents. bone marrow appearances of the axial skeleton. Eur. J. Radiol. 2022, 154, 110425. [Google Scholar] [CrossRef] [PubMed]
  3. Hofmann, S.; Kramer, J.; Vakil-Adli, A.; Aigner, N.; Breitenseher, M. Painful bone marrow edema of the knee: Differential diagnosis and therapeutic concepts. Orthop. Clin. North Am. 2004, 35, 321–333. [Google Scholar] [CrossRef] [PubMed]
  4. Lee, K.H.; Choi, S.T.; Lee, G.Y.; Ha, Y.J.; Choi, S.I. Method for diagnosing the bone marrow edema of sacroiliac joint in patients with axial spondyloarthritis using magnetic resonance image analysis based on deep learning. Diagnostics 2021, 11, 1156. [Google Scholar] [CrossRef] [PubMed]
  5. Tibrewala, R.; Ozhinsky, E.; Shah, R.; Foreman, S.C.; Pedoia, V.; Majumdar, S. Detecting hip osteoarthritic degenerative changes in MRI using deep learning. Osteoarthr. Cartil. 2019, 27, S387–S388. [Google Scholar] [CrossRef] [Green Version]
  6. Peer, M.; Abboud, S.; Hertz, U.; Amedi, A.; Arzy, S. Intensity-based masking: A tool to improve functional connectivity results of resting-state fMRI. Hum. Brain Mapp. 2016, 37, 2407–2418. [Google Scholar] [CrossRef] [PubMed] [Green Version]
  7. Deng, J.; Dong, W.; Socher, R.; Li, L.J.; Li, K.; Fei-Fei, L. Imagenet: A large-scale hierarchical image database. In Proceedings of the 2009 IEEE Conference on Computer Vision and Pattern Recognition, Miami, FL, USA, 20–25 June 2009; pp. 248–255. [Google Scholar]
  8. Eweje, F.R.; Bao, B.; Wu, J.; Dalal, D.; hua Liao, W.; He, Y.; Luo, Y.; Lu, S.; Zhang, P.; Peng, X.; et al. Deep Learning for Classification of Bone Lesions on Routine MRI. EBioMedicine 2021, 68, 103402. [Google Scholar] [CrossRef] [PubMed]
  9. Georgeanu, V.A.; Mămuleanu, M.; Ghiea, S.; Selișteanu, D. Malignant Bone Tumors Diagnosis Using Magnetic Resonance Imaging Based on Deep Learning Algorithms. Medicina 2022, 58, 636. [Google Scholar] [CrossRef] [PubMed]
  10. Astuto, B.; Flament, I.; Namiri, N.K.; Shah, R.; Bharadwaj, U.; Link, T.M.; Bucknor, M.D.; Pedoia, V.; Majumdar, S. Automatic deep learning-assisted detection and grading of abnormalities in knee MRI studies. Radiol. Artif. Intell. 2021, 3, 1–12. [Google Scholar] [CrossRef] [PubMed]
  11. Park, C.; Kang, J.W.; Lee, D.E.; Son, W.; Lee, S.M.; Park, C.; Kim, M. Deep learning approaches for bone marrow edema detection and interpretation in dual-energy CT. SSRN Electron. J. 2022. [Google Scholar] [CrossRef]
  12. Levine, M. Assessing Bone Health in children and adolescents. Indian J. Endocrinol. Metab. 2012, 16, 205. [Google Scholar] [CrossRef] [PubMed]
  13. von Brandis, E.; Jenssen, H.B.; Avenarius, D.F.; Bjørnerud, A.; Flatø, B.; Tomterstad, A.H.; Lilleby, V.; Rosendahl, K.; Sakinis, T.; Zadig, P.K.; et al. Automated segmentation of Magnetic Resonance Bone Marrow Signal: A feasibility study. Pediatr. Radiol. 2022, 52, 1104–1114. [Google Scholar] [CrossRef] [PubMed]
  14. Chuah, T.K.; Poh, C.L.; Sheah, K. Quantitative texture analysis of MRI images for detection of cartilage-related bone marrow edema. In Proceedings of the 2011 Annual International Conference of the IEEE Engineering in Medicine and Biology Society, Boston, MA, USA, 30 August–3 September 2011; pp. 5112–5115. [Google Scholar] [CrossRef]
  15. He, K.; Zhang, X.; Ren, S.; Sun, J. Deep Residual Learning for Image Recognition. arXiv 2015, arXiv:1512.03385. [Google Scholar]
  16. Russakovsky, O.; Deng, J.; Su, H.; Krause, J.; Satheesh, S.; Ma, S.; Huang, Z.; Karpathy, A.; Khosla, A.; Bernstein, M.; et al. ImageNet Large Scale Visual Recognition Challenge. Int. J. Comput. Vis. (IJCV) 2015, 115, 211–252. [Google Scholar] [CrossRef] [Green Version]
  17. Silva, F.; Pereira, T.; Neves, I.; Morgado, J.; Freitas, C.; Malafaia, M.; Sousa, J.; Fonseca, J.; Negrão, E.; Flor de Lima, B.; et al. Towards Machine Learning-Aided Lung Cancer Clinical Routines: Approaches and Open Challenges. J. Pers. Med. 2022, 12, 480. [Google Scholar] [CrossRef] [PubMed]
  18. Raghu, M.; Zhang, C.; Kleinberg, J.; Bengio, S. Transfusion: Understanding transfer learning for medical imaging. In Proceedings of the 33rd Conference on Neural Information Processing Systems (NeurIPS 2019), Vancouver, BC, Canada, 8–14 December 2019; Volume 32, pp. 3347–3357. [Google Scholar]
  19. Hinton, G.E.; Srivastava, N.; Krizhevsky, A.; Sutskever, I.; Salakhutdinov, R.R. Improving neural networks by preventing co-adaptation of feature detectors. arXiv 2012, arXiv:1207.0580. [Google Scholar]
  20. Krogh, A.; Hertz, J. A simple weight decay can improve generalization. Adv. Neural Inf. Process. Syst. 1991, 4, 950–957. [Google Scholar]
  21. Almajalid, R.; Zhang, M.; Shan, J. Fully automatic knee bone detection and segmentation on three-dimensional MRI. Diagnostics 2022, 12, 123. [Google Scholar] [CrossRef] [PubMed]
  22. Faisal, A.; Ng, S.C.; Goh, S.L.; George, J.; Supriyanto, E.; Lai, K.W. Multiple LREK active contours for knee meniscus ultrasound image segmentation. IEEE Trans. Med. Imaging 2015, 34, 2162–2171. [Google Scholar] [CrossRef] [PubMed]
  23. Faisal, A.; Ng, S.C.; Goh, S.L.; Lai, K.W. Knee cartilage segmentation and thickness computation from ultrasound images. Med. Biol. Eng. Comput. 2017, 56, 657–669. [Google Scholar] [CrossRef]
Figure 1. Examples of fluid-sensitive sequences for patients with and without BME. The first and second rows represent examples of MRI of BME patients with the bone segmentations in the first row and the segmentation of the BME regions in the second row; the third row contains the bone annotations from three different non-BME patients, as well as a rounded annotation in the quadriceps muscle.
Applsci 13 01024 g001
Figure 2. The high intensity masking technique developed to extract BME features on fluid-sensitive sequences. First, the mean ( μ ) and standard deviation ( σ ) of the bone signal intensities are calculated; then, using these values, the image intensities are clamped, and a histogram equalization using the MinMax algorithm with values 0 and 255 applied. The resultant image is obtained by only considering the regions within the bone.
Applsci 13 01024 g002
Figure 3. General overview of the developed pipeline for bone edema prediction in fluid-sensitive sequences based on two different strategies for input image transformation.
Applsci 13 01024 g003
Table 1. UHCSJ Dataset distribution of the number of patients and slices per class.
# Slices with Bones Segmented# Patients
With Edema RegionsWithout Edema RegionsTotal SlicesTotal Patients
Edema Patients2288531328
Non-Edema Patients-363636
Table 2. List of values used for hyperparameter optimization in the training from scratch.
HyperparameterRange of Values
Learning Rate0.01, 0.005, 0.001, 0.0001, 0.00001
Batch size16, 32, 64, 112
Momentum0, 0.5, 0.9
OptimizerSGD, Adam
Table 3. Results of the test set using different training strategies and two regions of analysis.
TrainingROIBalanced AccuracyAUC
ScratchBone Region0.5450.534
HIM0.5500.971
TL (fixed feature extractor)Bone Region0.5830.618
HIM0.5880.683
TL (fine-tuned feature extractor)Bone Region0.5680.550
HIM0.8520.964
The best results are presented in bold.
Table 4. Confusion matrix for the best predictive model.
Predicted Class
Non-EdemaEdema
True classNon-edema82
Edema438
Table 5. Results on the test set (mean ( μ ) and standard deviation ( σ )) using 5 different distributions of the dataset.
RunBalanded Accuracy
without New Non-Edema Slices
Balanded Accuracy
with New Non-Edema Slices
#10.8520.739
#20.7910.687
#30.8010.630
#40.7590.613
#50.7600.693
μ ± σ 0.792 ± 0.0340.672 ± 0.045
Table 6. Examples of misclassified slices by the best performing model.
PatientPatient IDImage LabelImage PredictionOriginal ImageHigh Intensity Masking Image
Edema21EdemaNon-edemaApplsci 13 01024 i001Applsci 13 01024 i002
Edema 21Non-edemaEdemaApplsci 13 01024 i003Applsci 13 01024 i004
Non-edema2Non-edemaEdema Applsci 13 01024 i005Applsci 13 01024 i006
Non-edema5Non-edemaEdemaApplsci 13 01024 i007Applsci 13 01024 i008
Non-edema20Non-edemaEdemaApplsci 13 01024 i009Applsci 13 01024 i010
Non-edema30Non-edemaEdemaApplsci 13 01024 i011Applsci 13 01024 i012
Disclaimer/Publisher’s Note: The statements, opinions and data contained in all publications are solely those of the individual author(s) and contributor(s) and not of MDPI and/or the editor(s). MDPI and/or the editor(s) disclaim responsibility for any injury to people or property resulting from any ideas, methods, instructions or products referred to in the content.