

Evaluation and Validation of Photovoltaic Potential Based on Time and Pathway of Solar-Powered Electric Vehicle


Abstract
1. Introduction
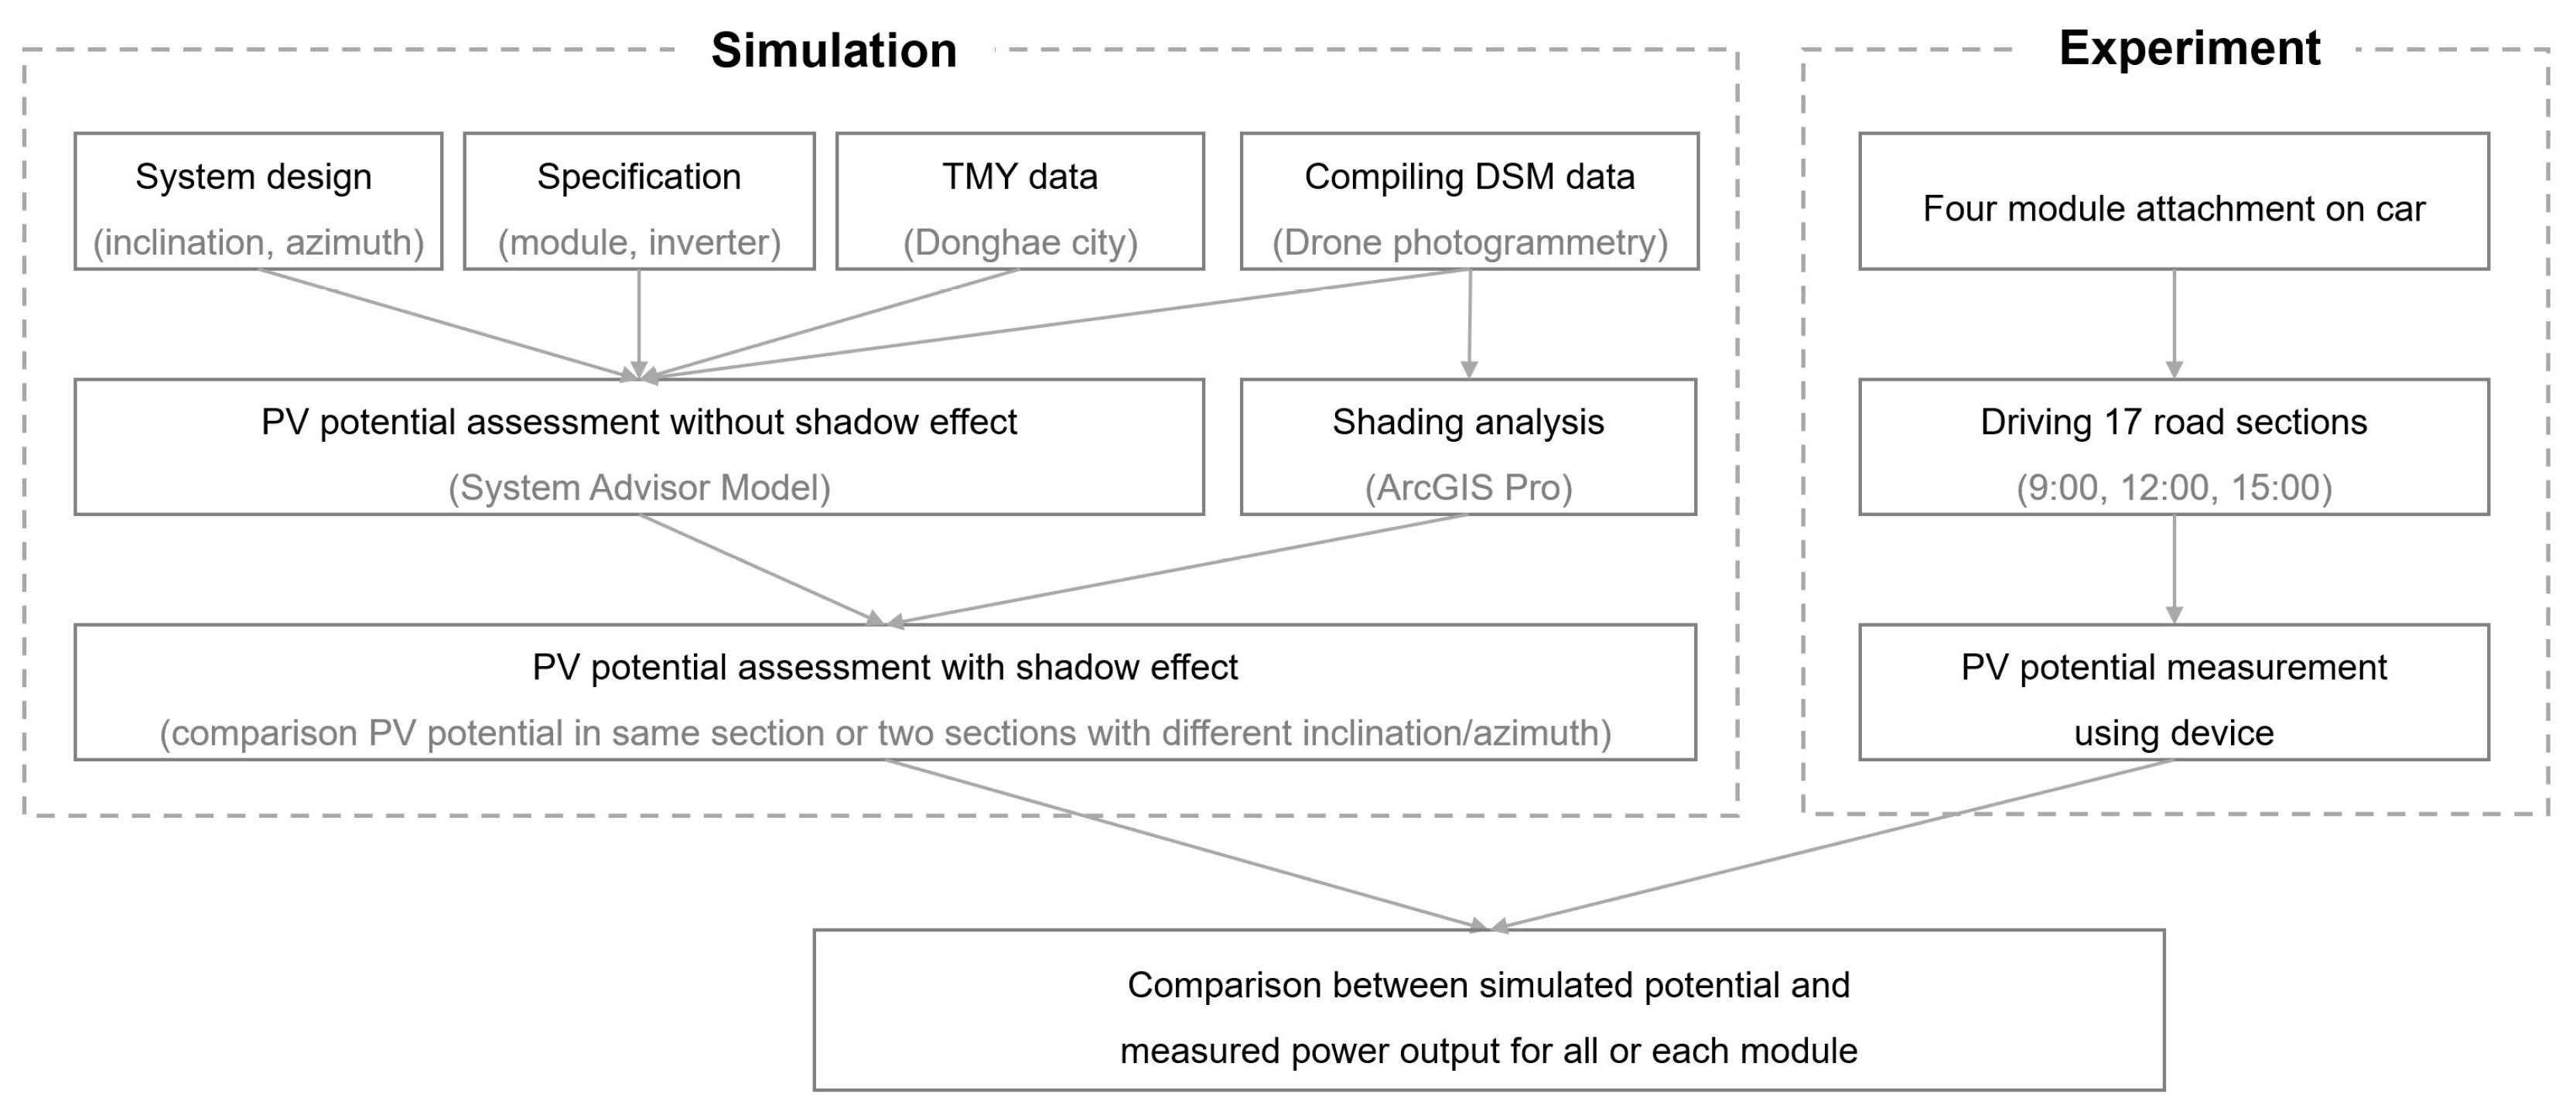
2. Methodology
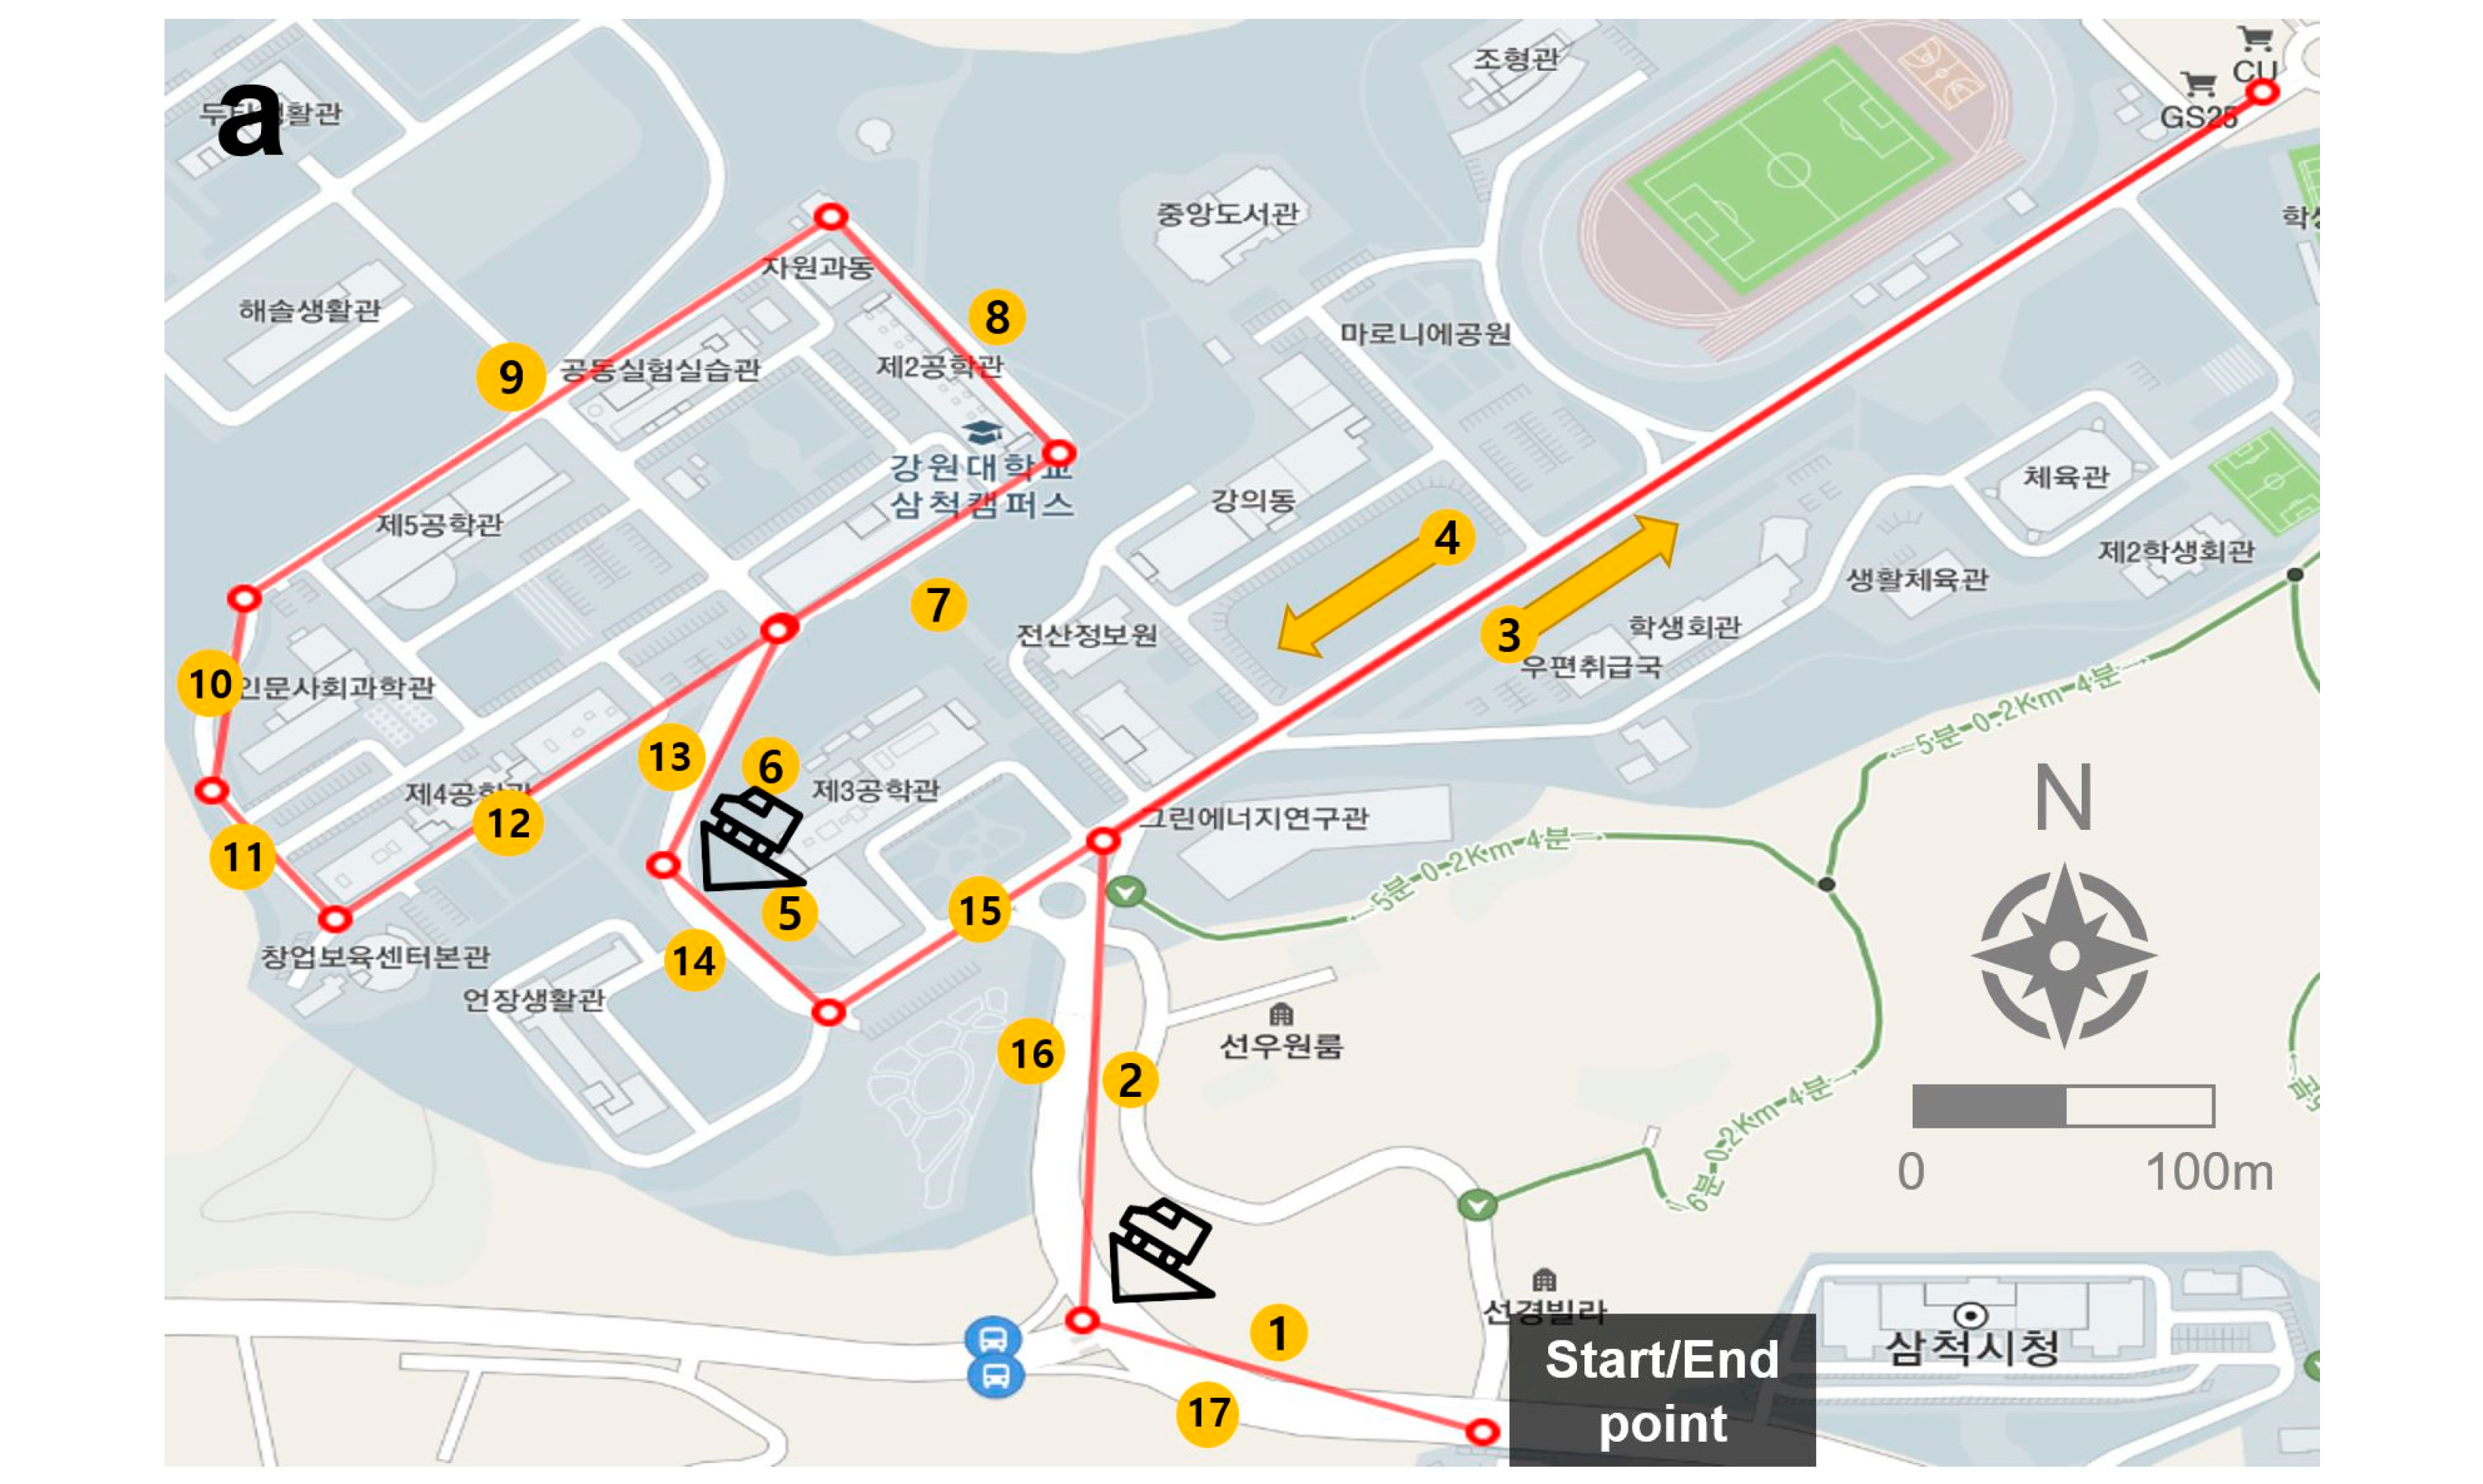
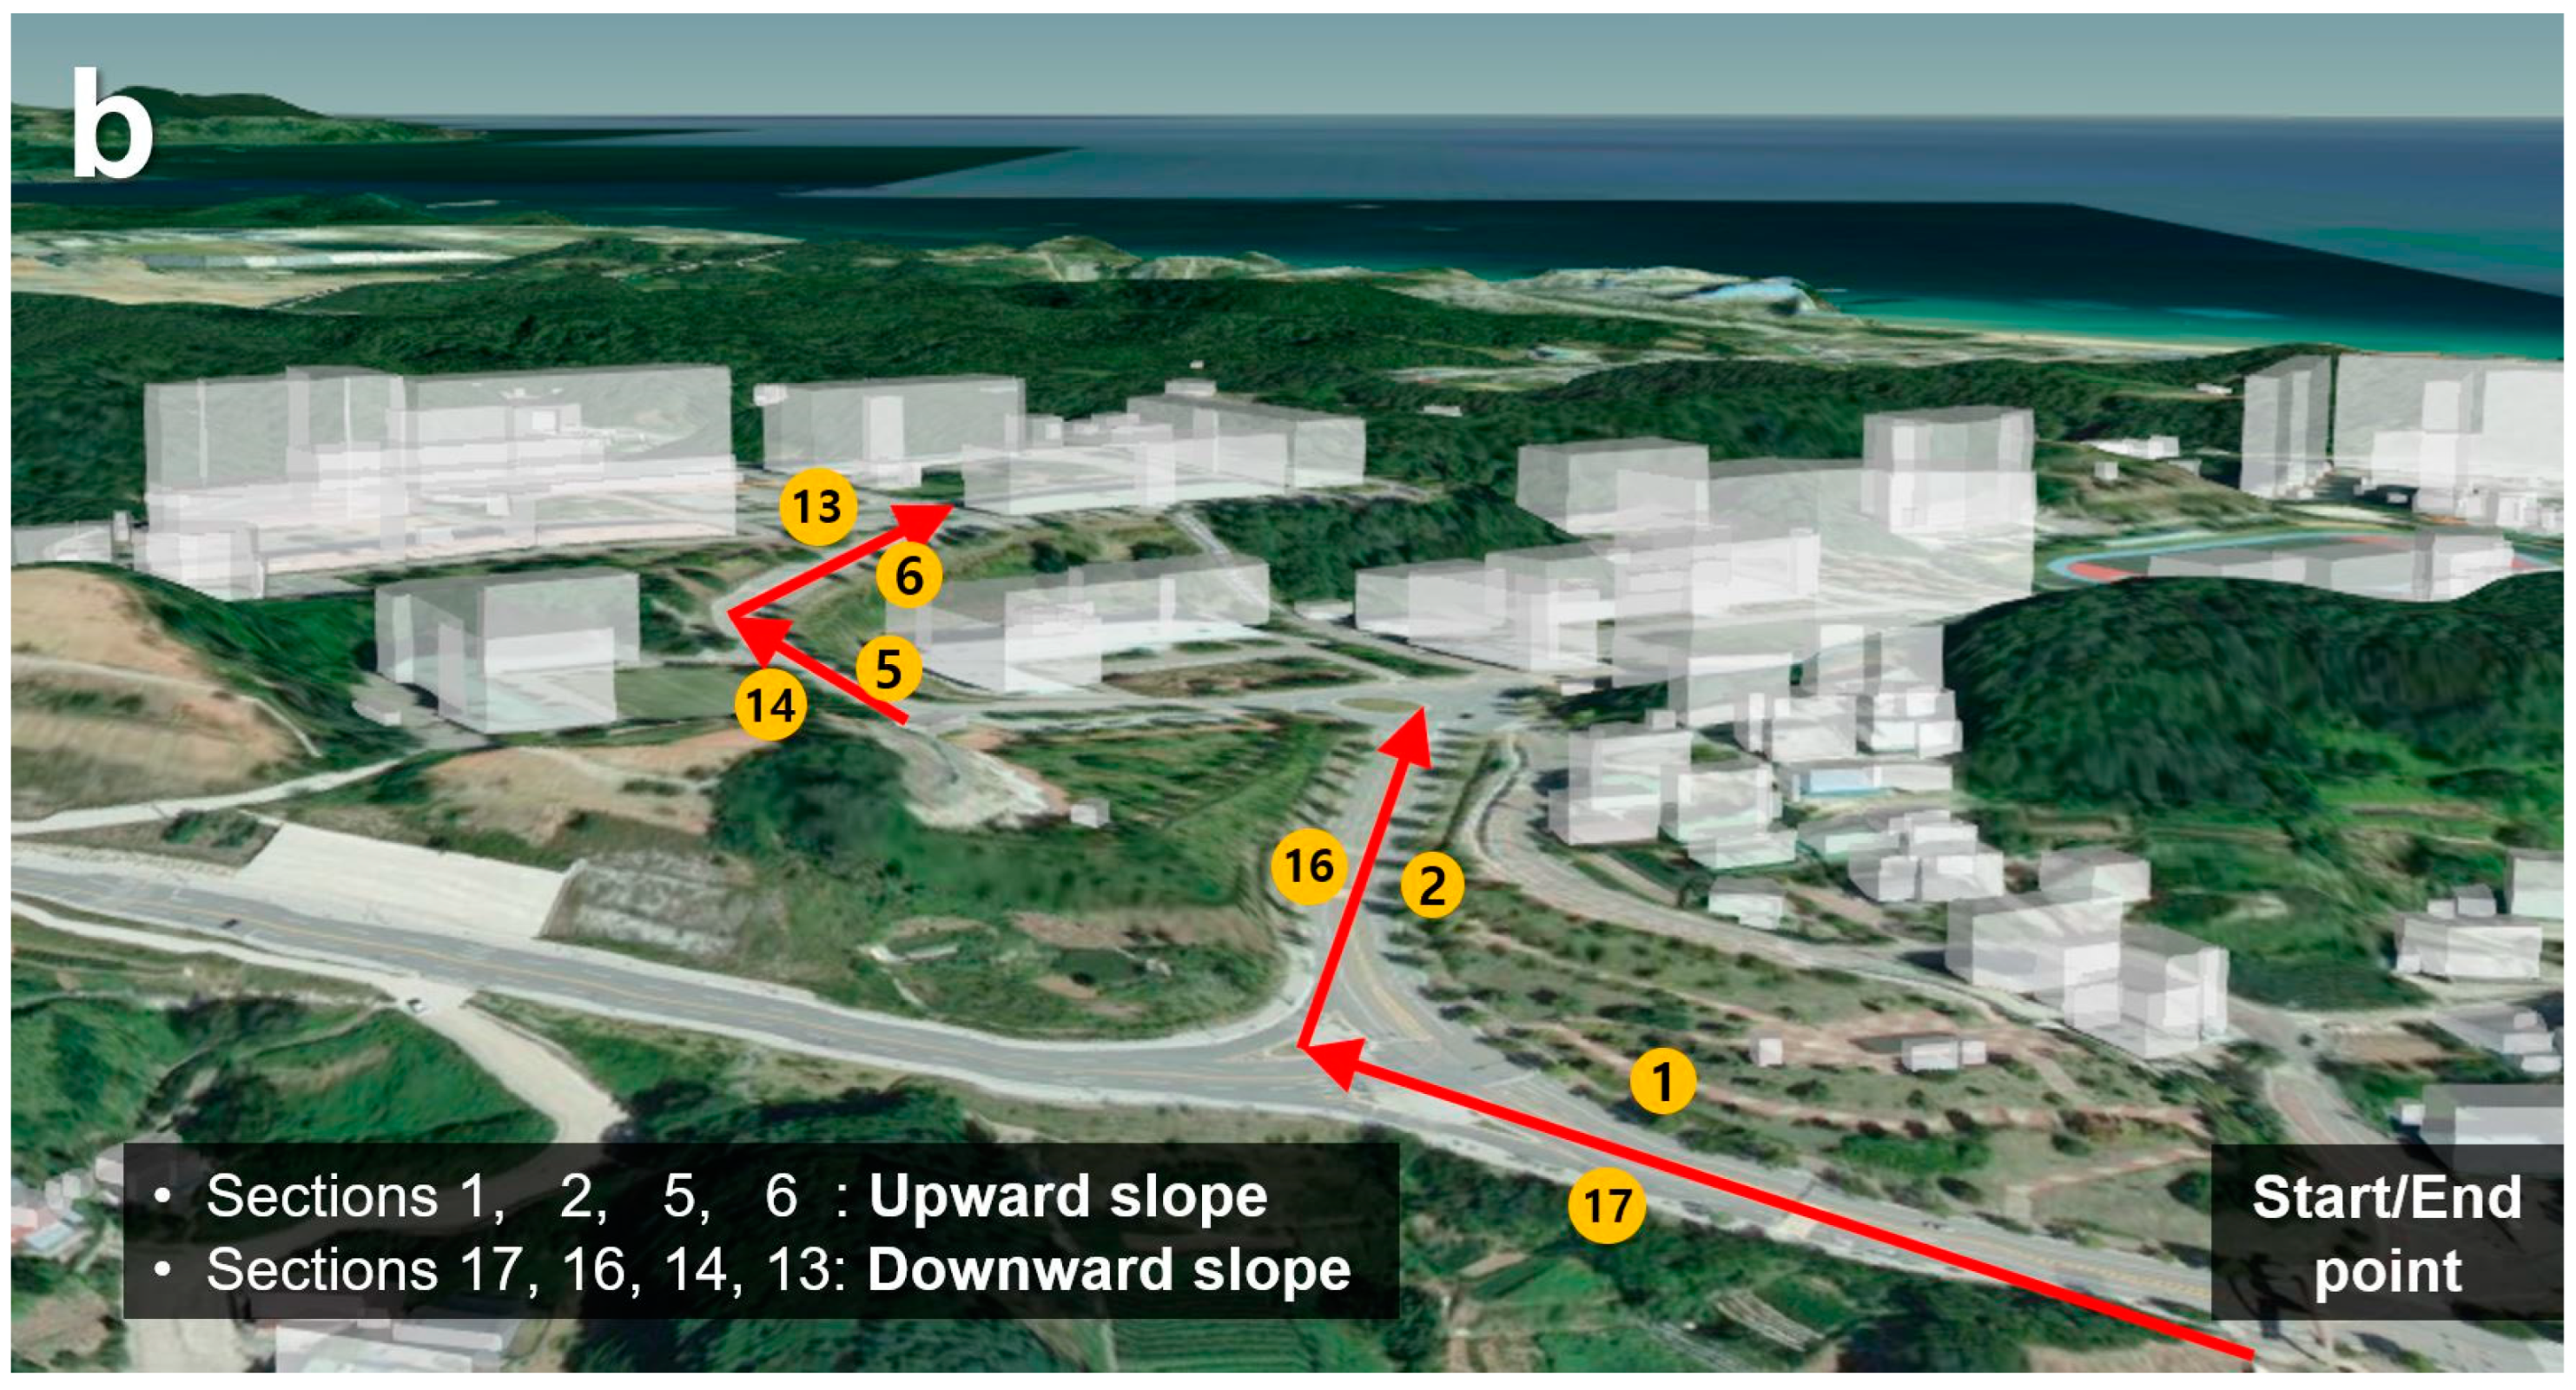
2.1. Study Area
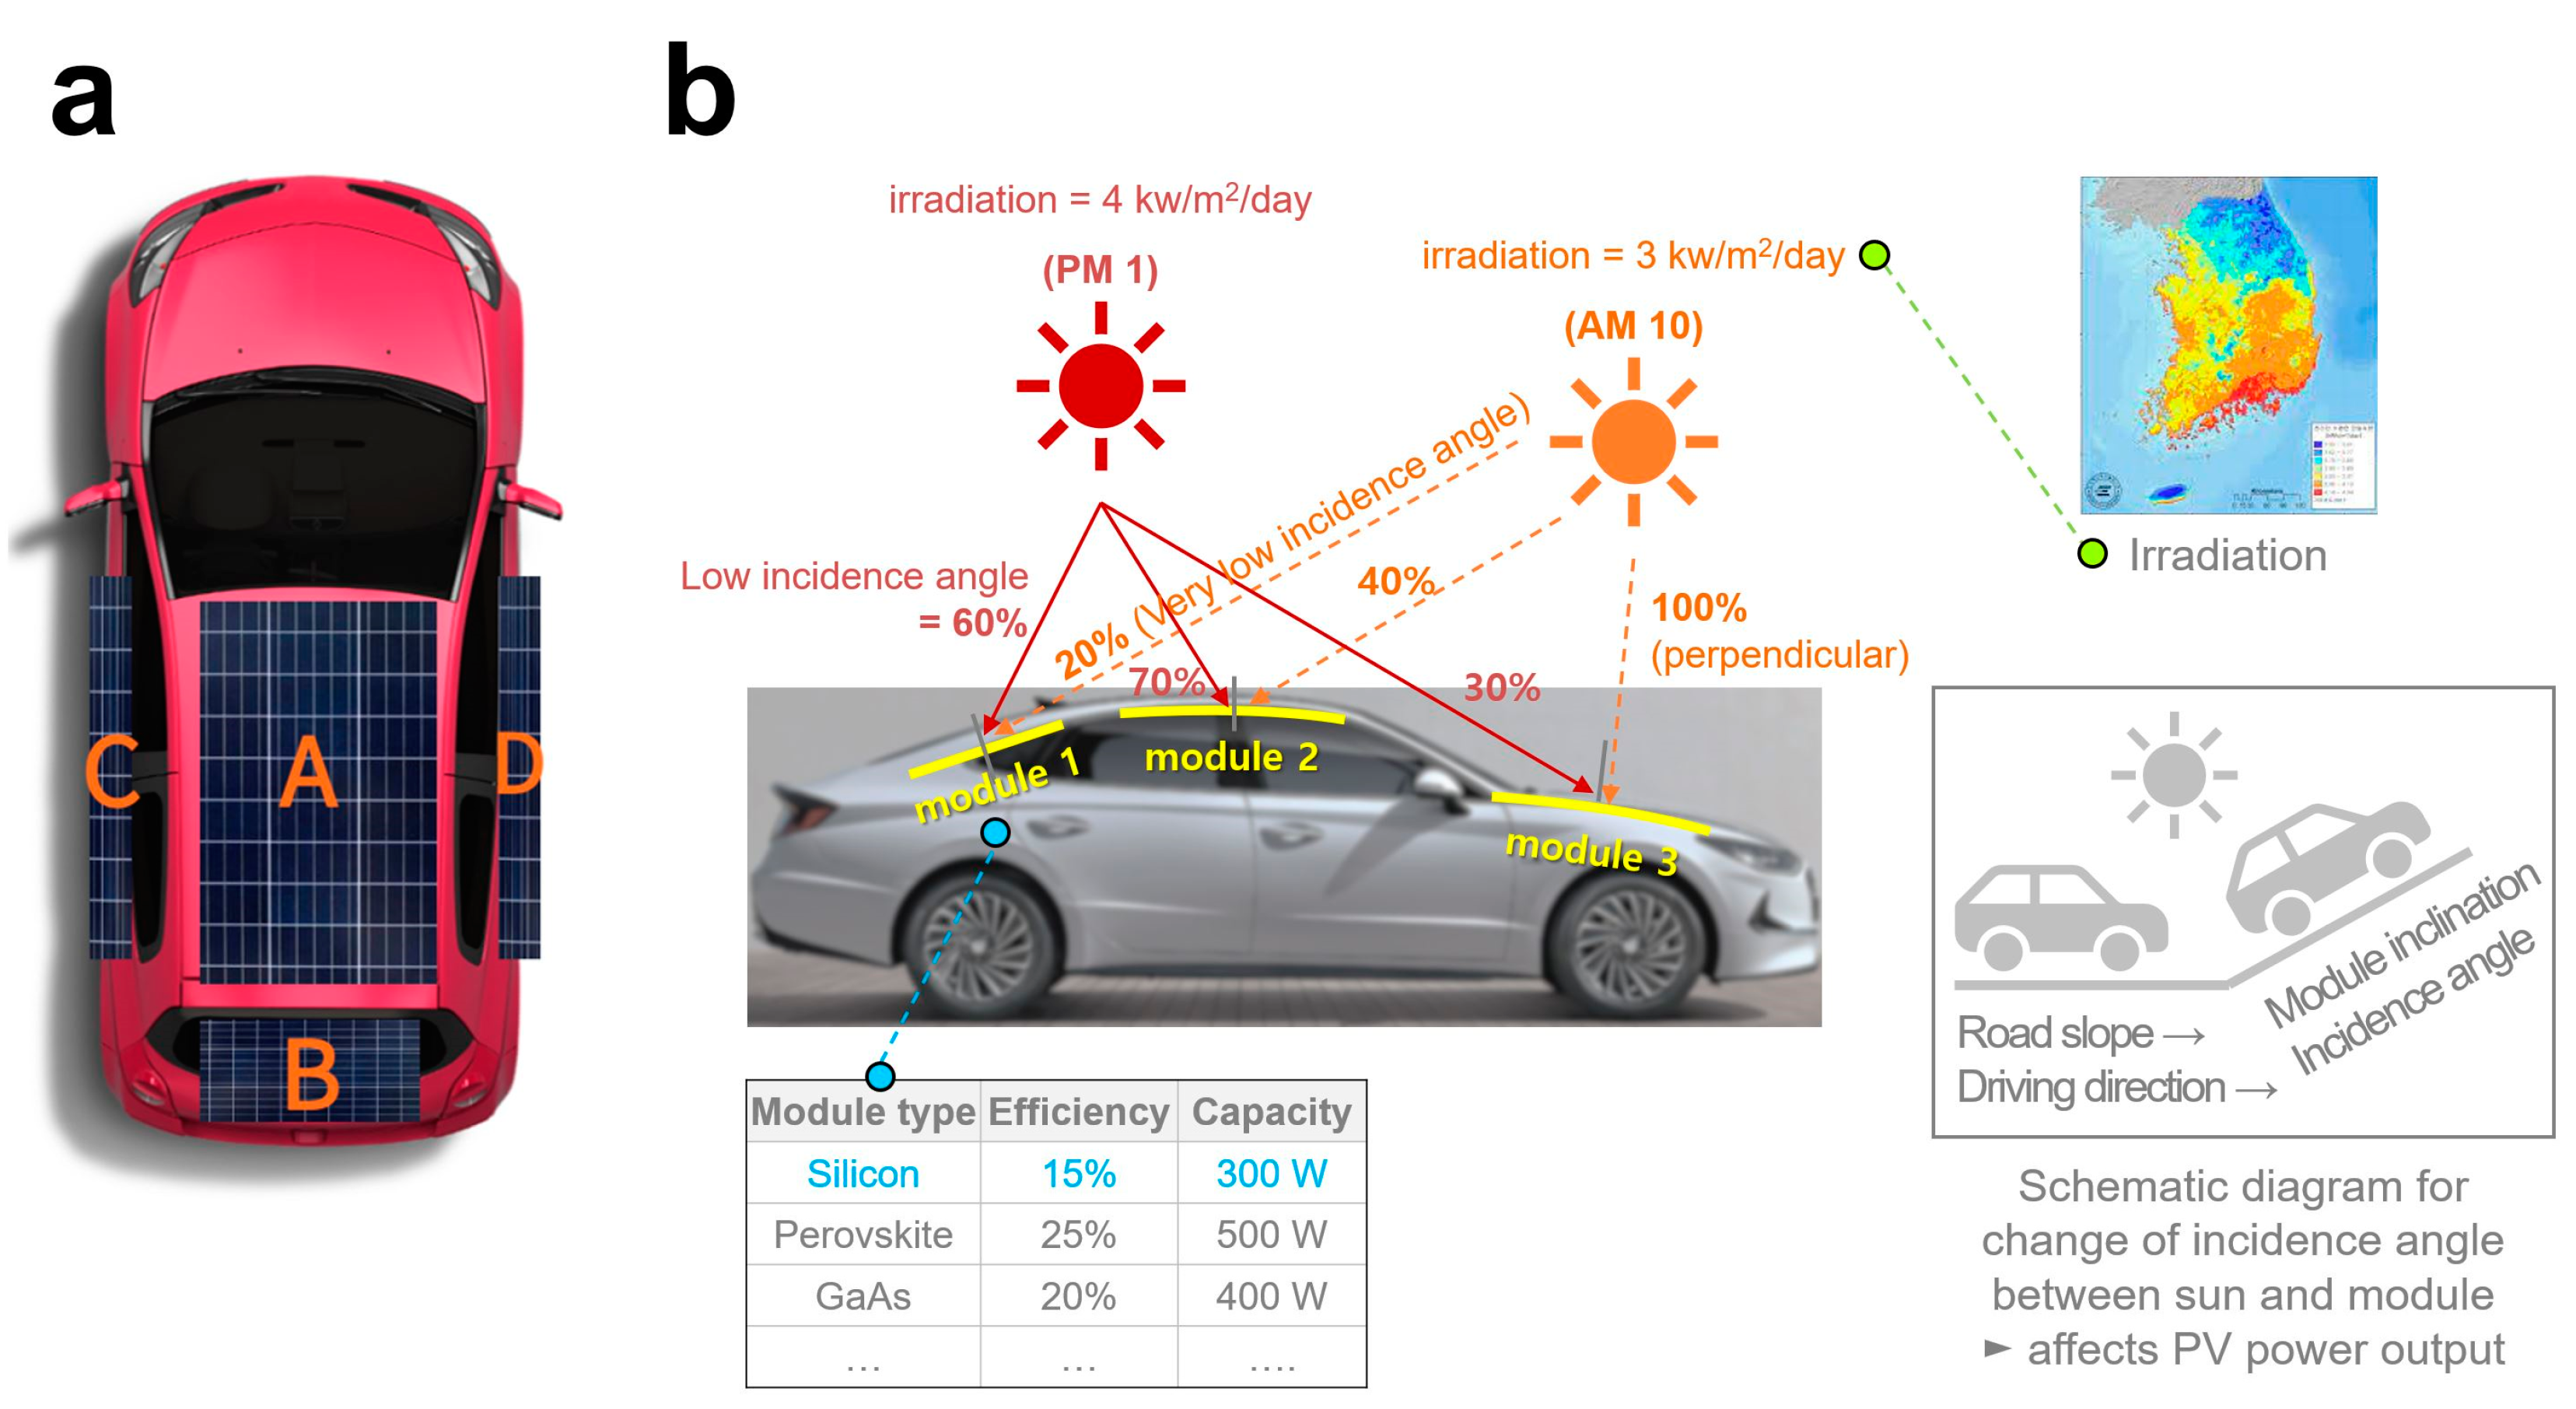
2.2. Settings and Driving Scenarios of PV-Powered EV
2.3. Estimation of PV Potential from PV-Powered EV
2.3.1. Estimation of PV Potential Excluding Shadow Effect
2.3.2. Estimation of PV Potential Considering the Shadow Effect
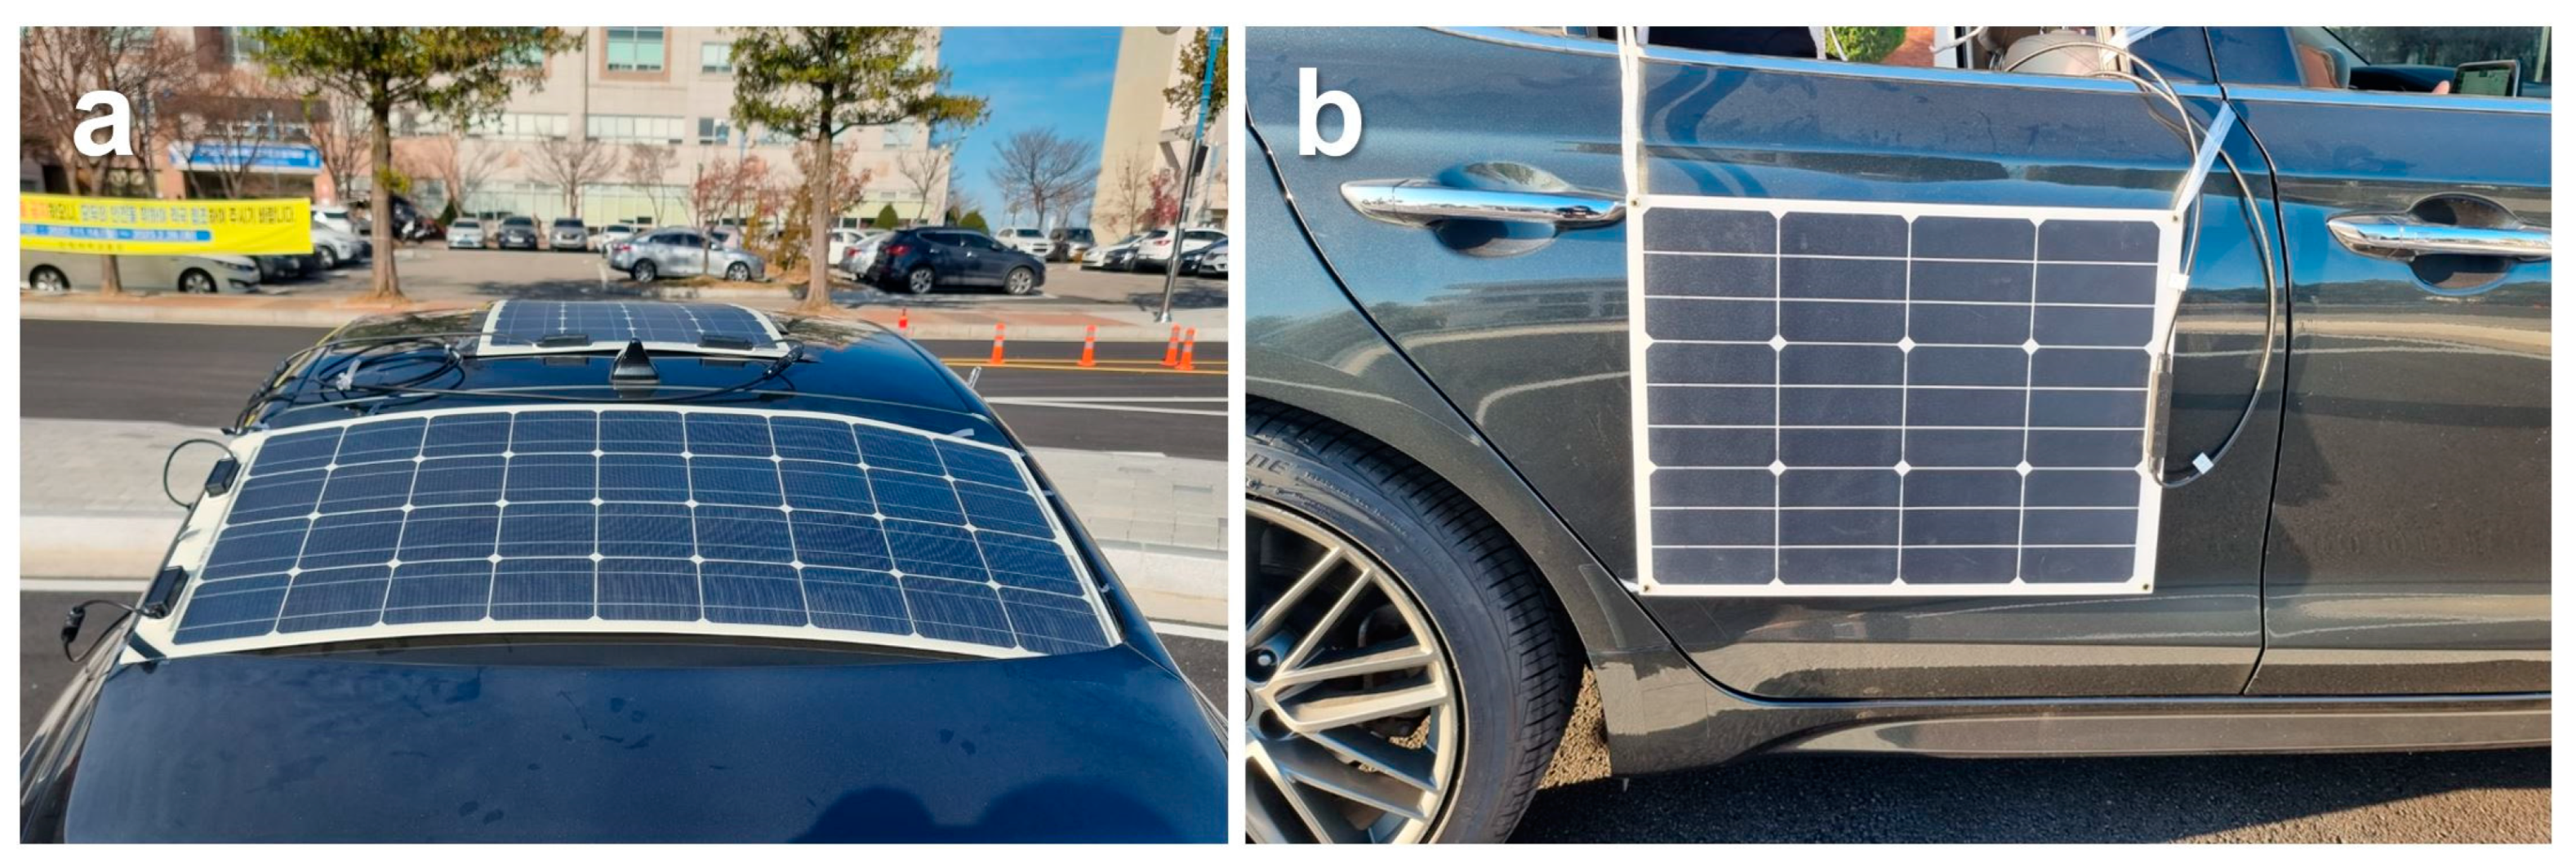
2.4. Measurement of PV Power Output via Field Experiments
3. Results
3.1. PV Potential of the Entire Section
3.2. Comparison of PV Potential in Individual Sections
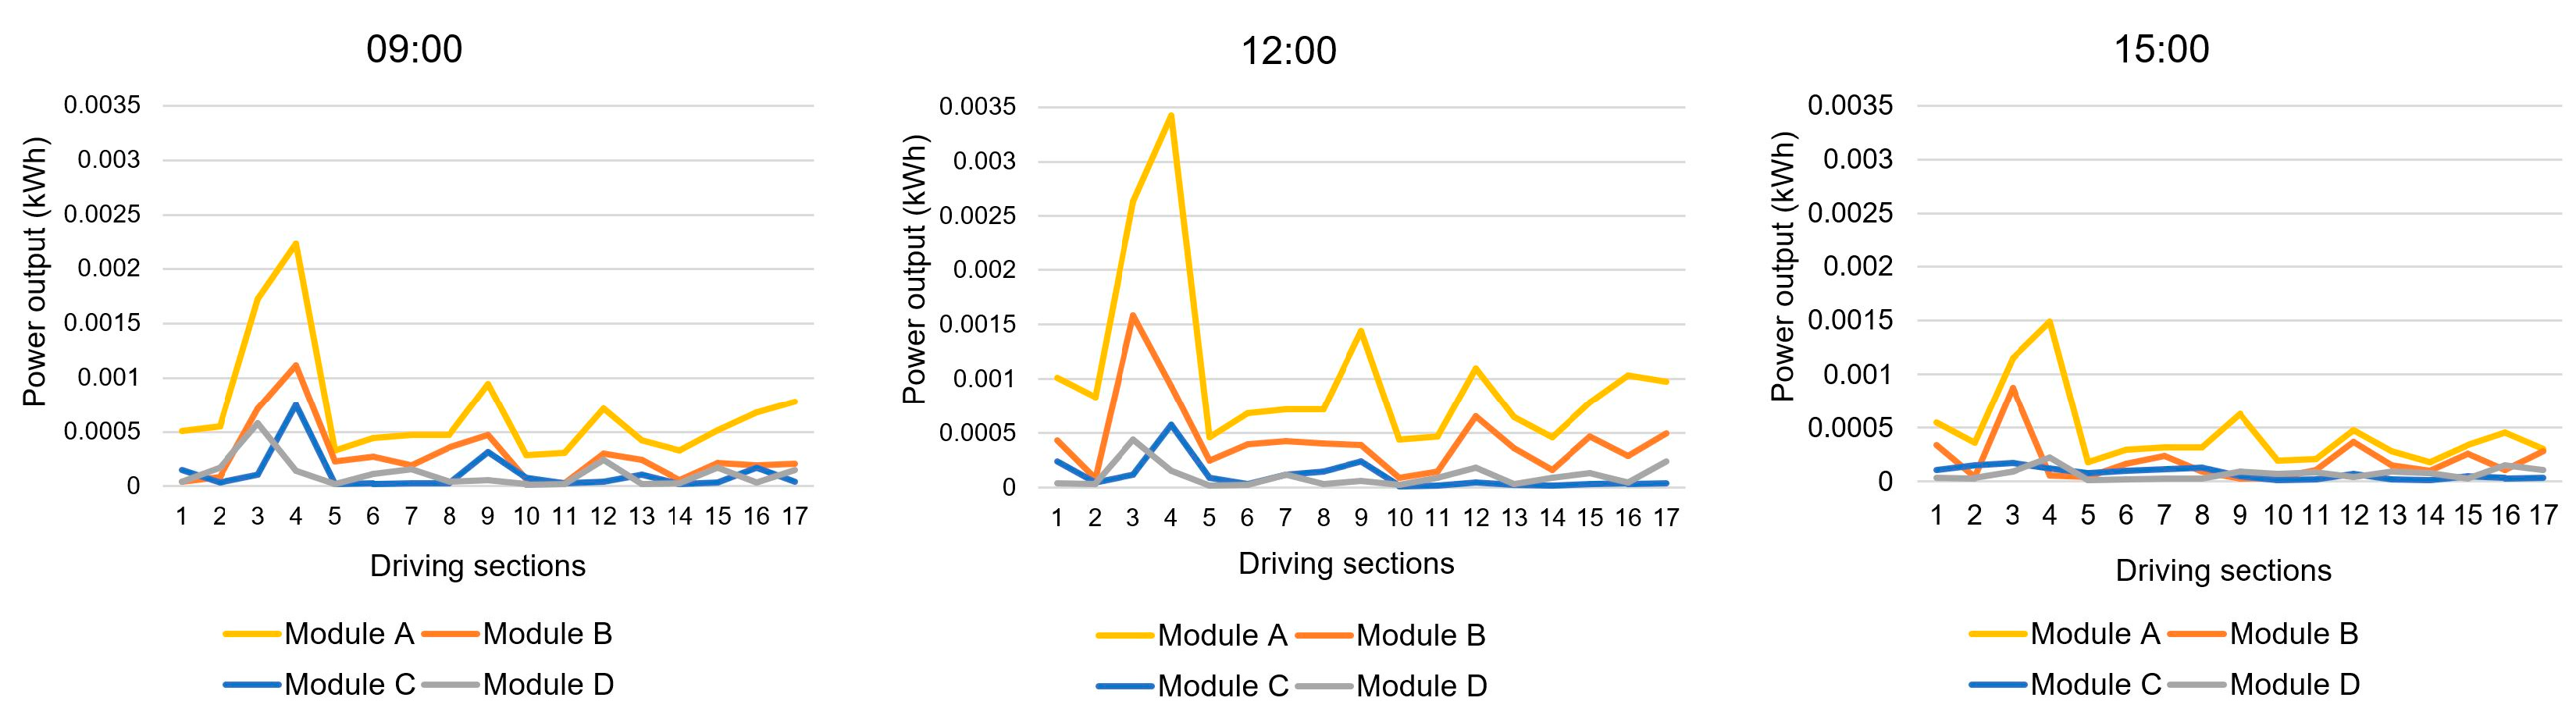
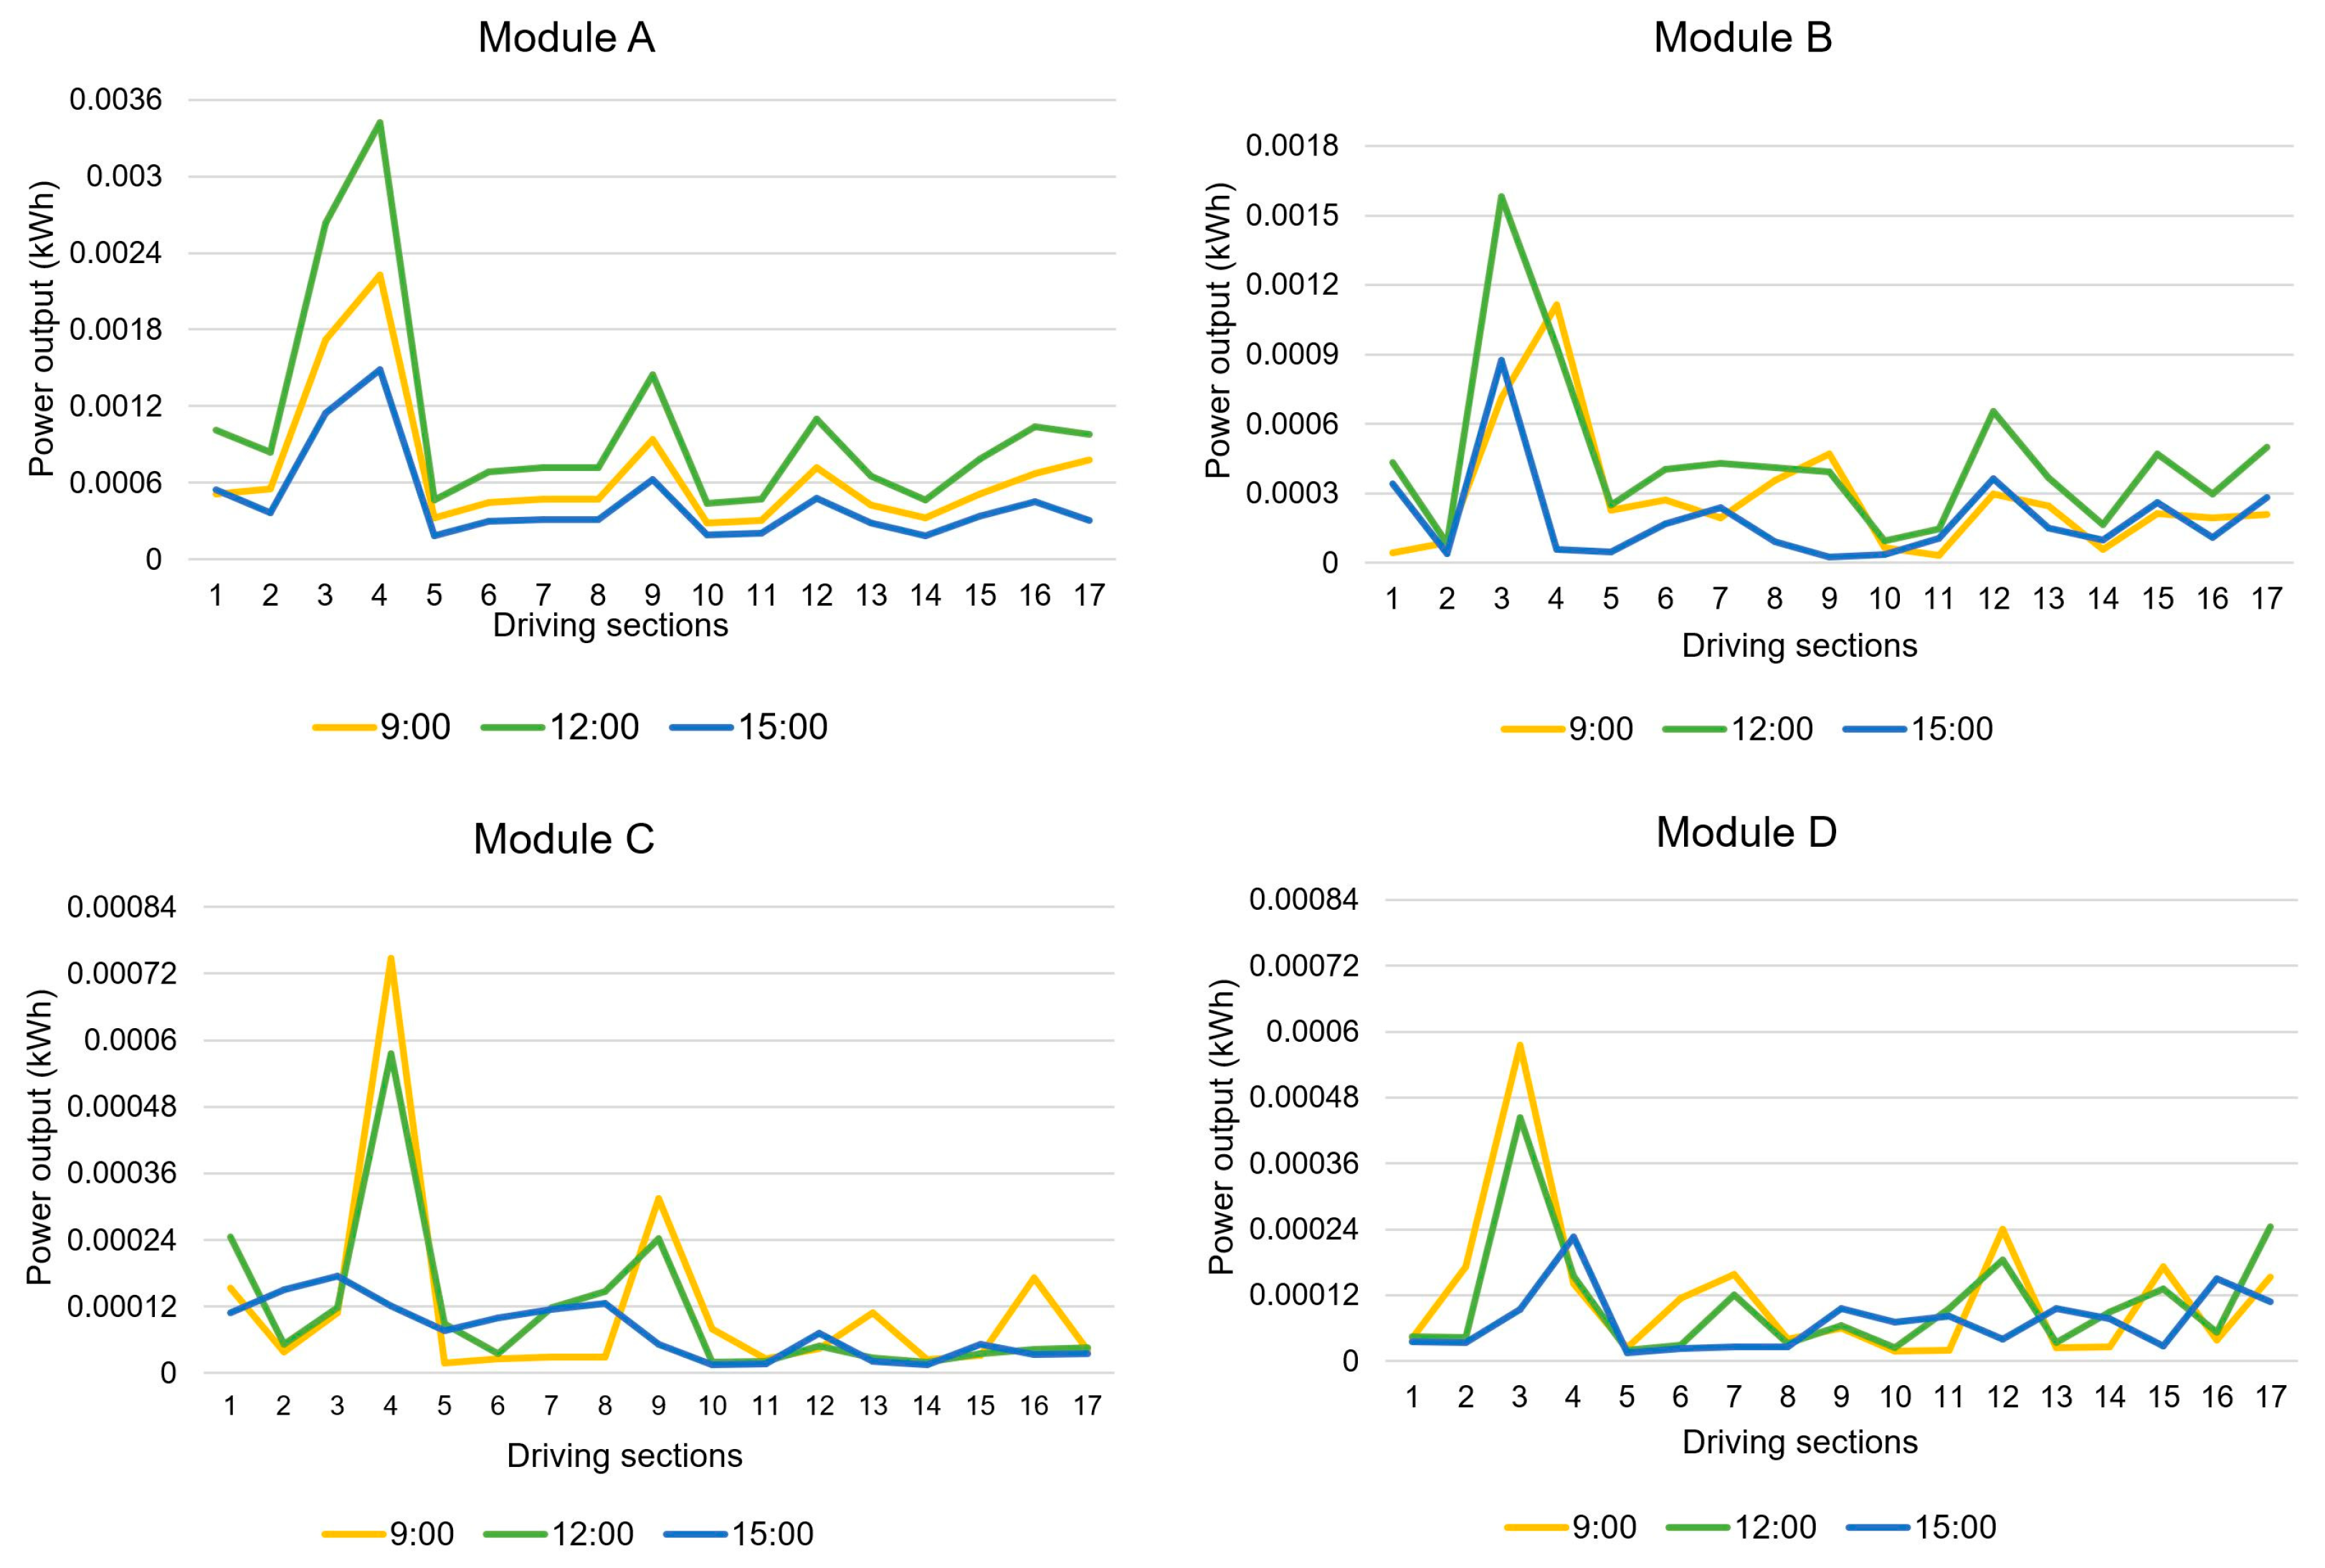
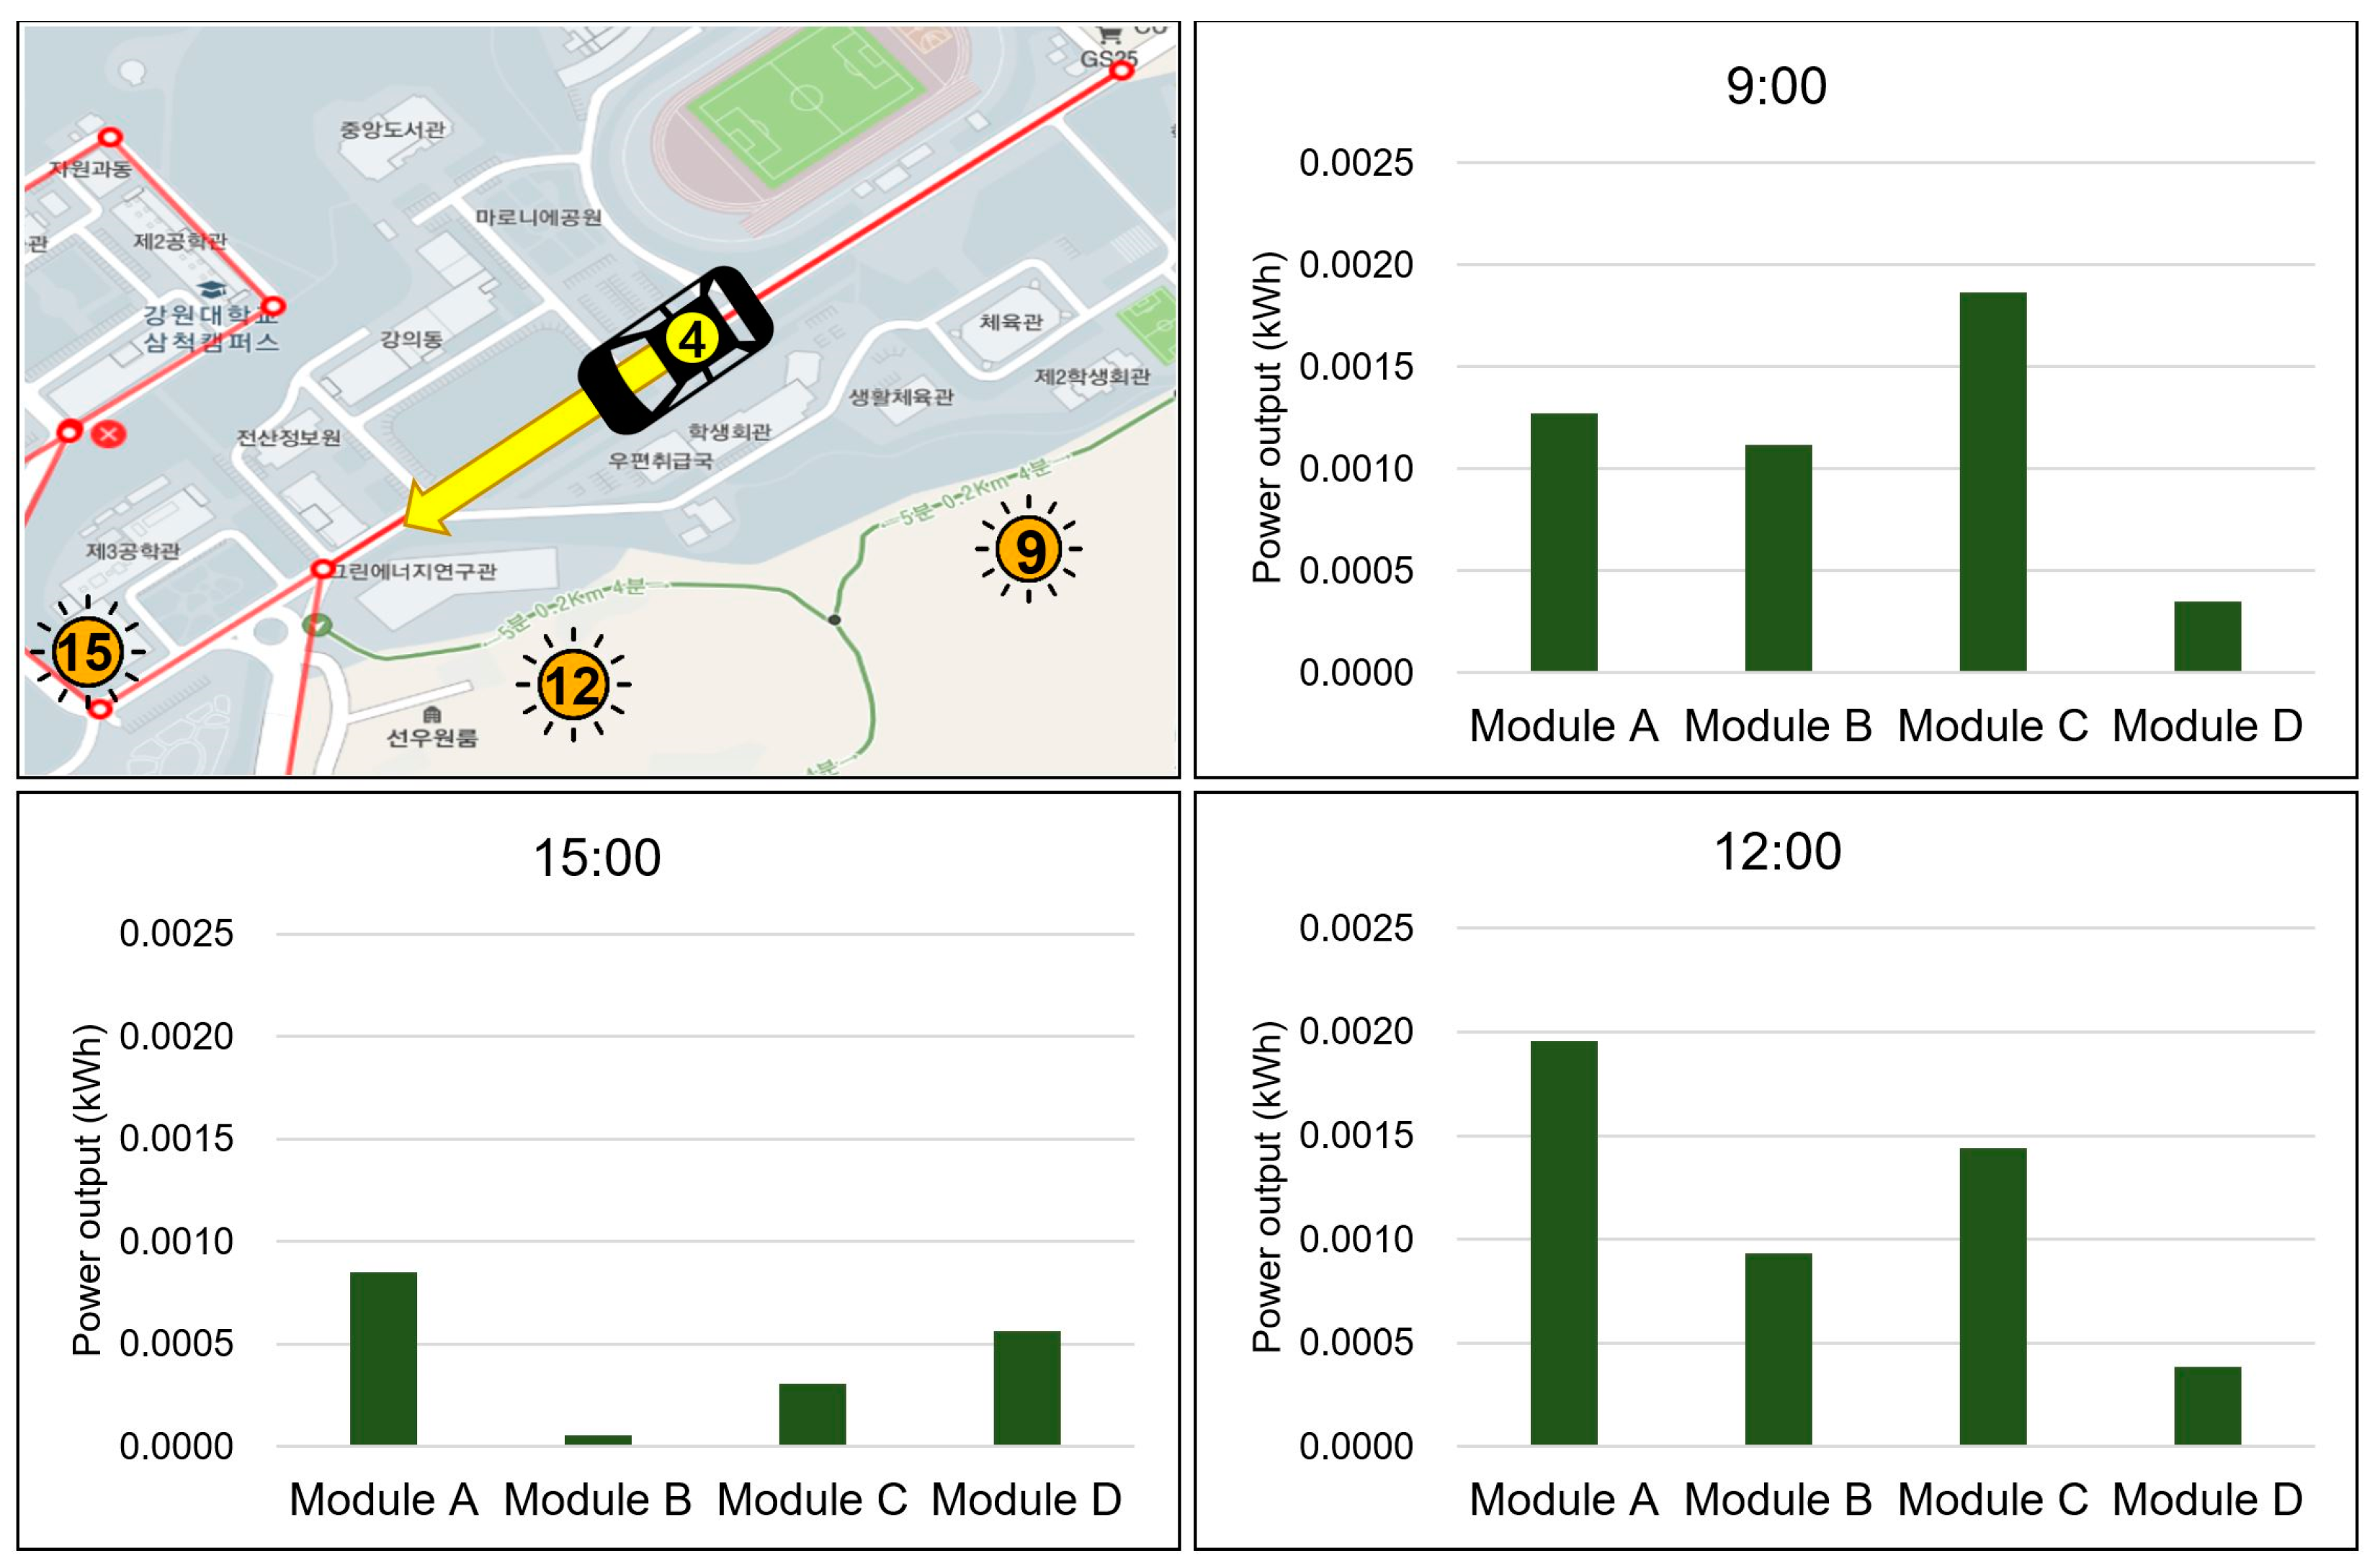
3.2.1. Comparison of PV Potential of the Four Modules in Same Section
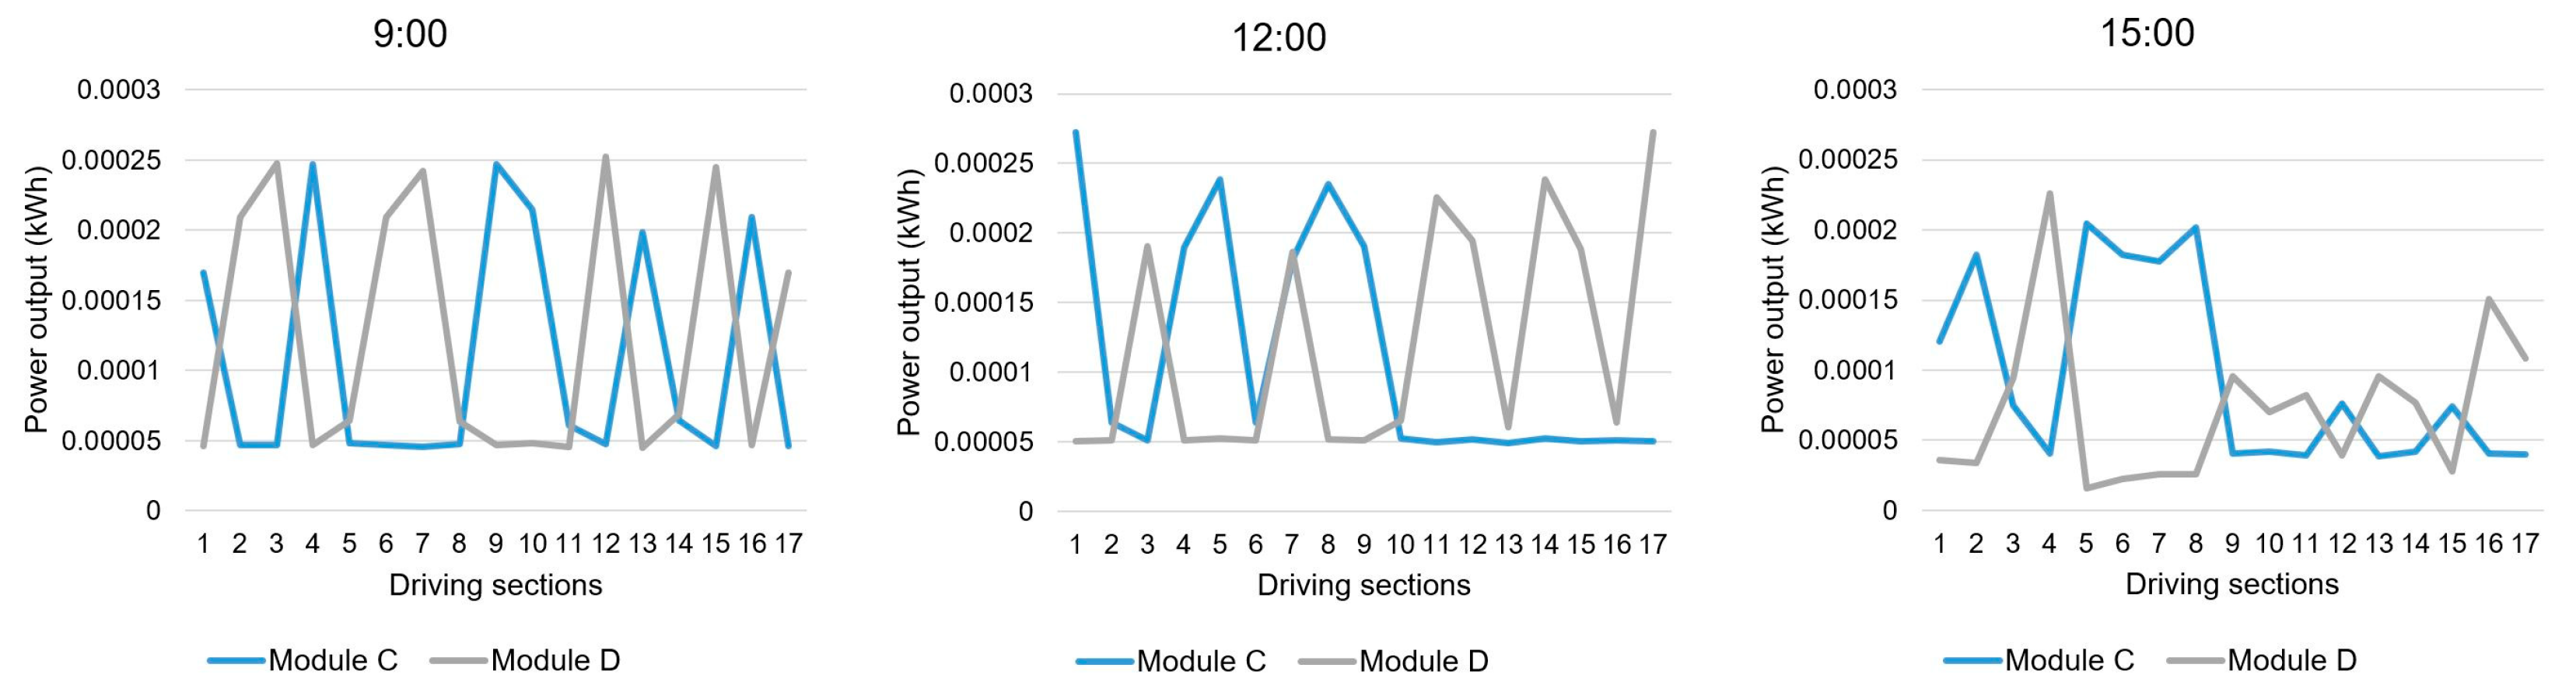
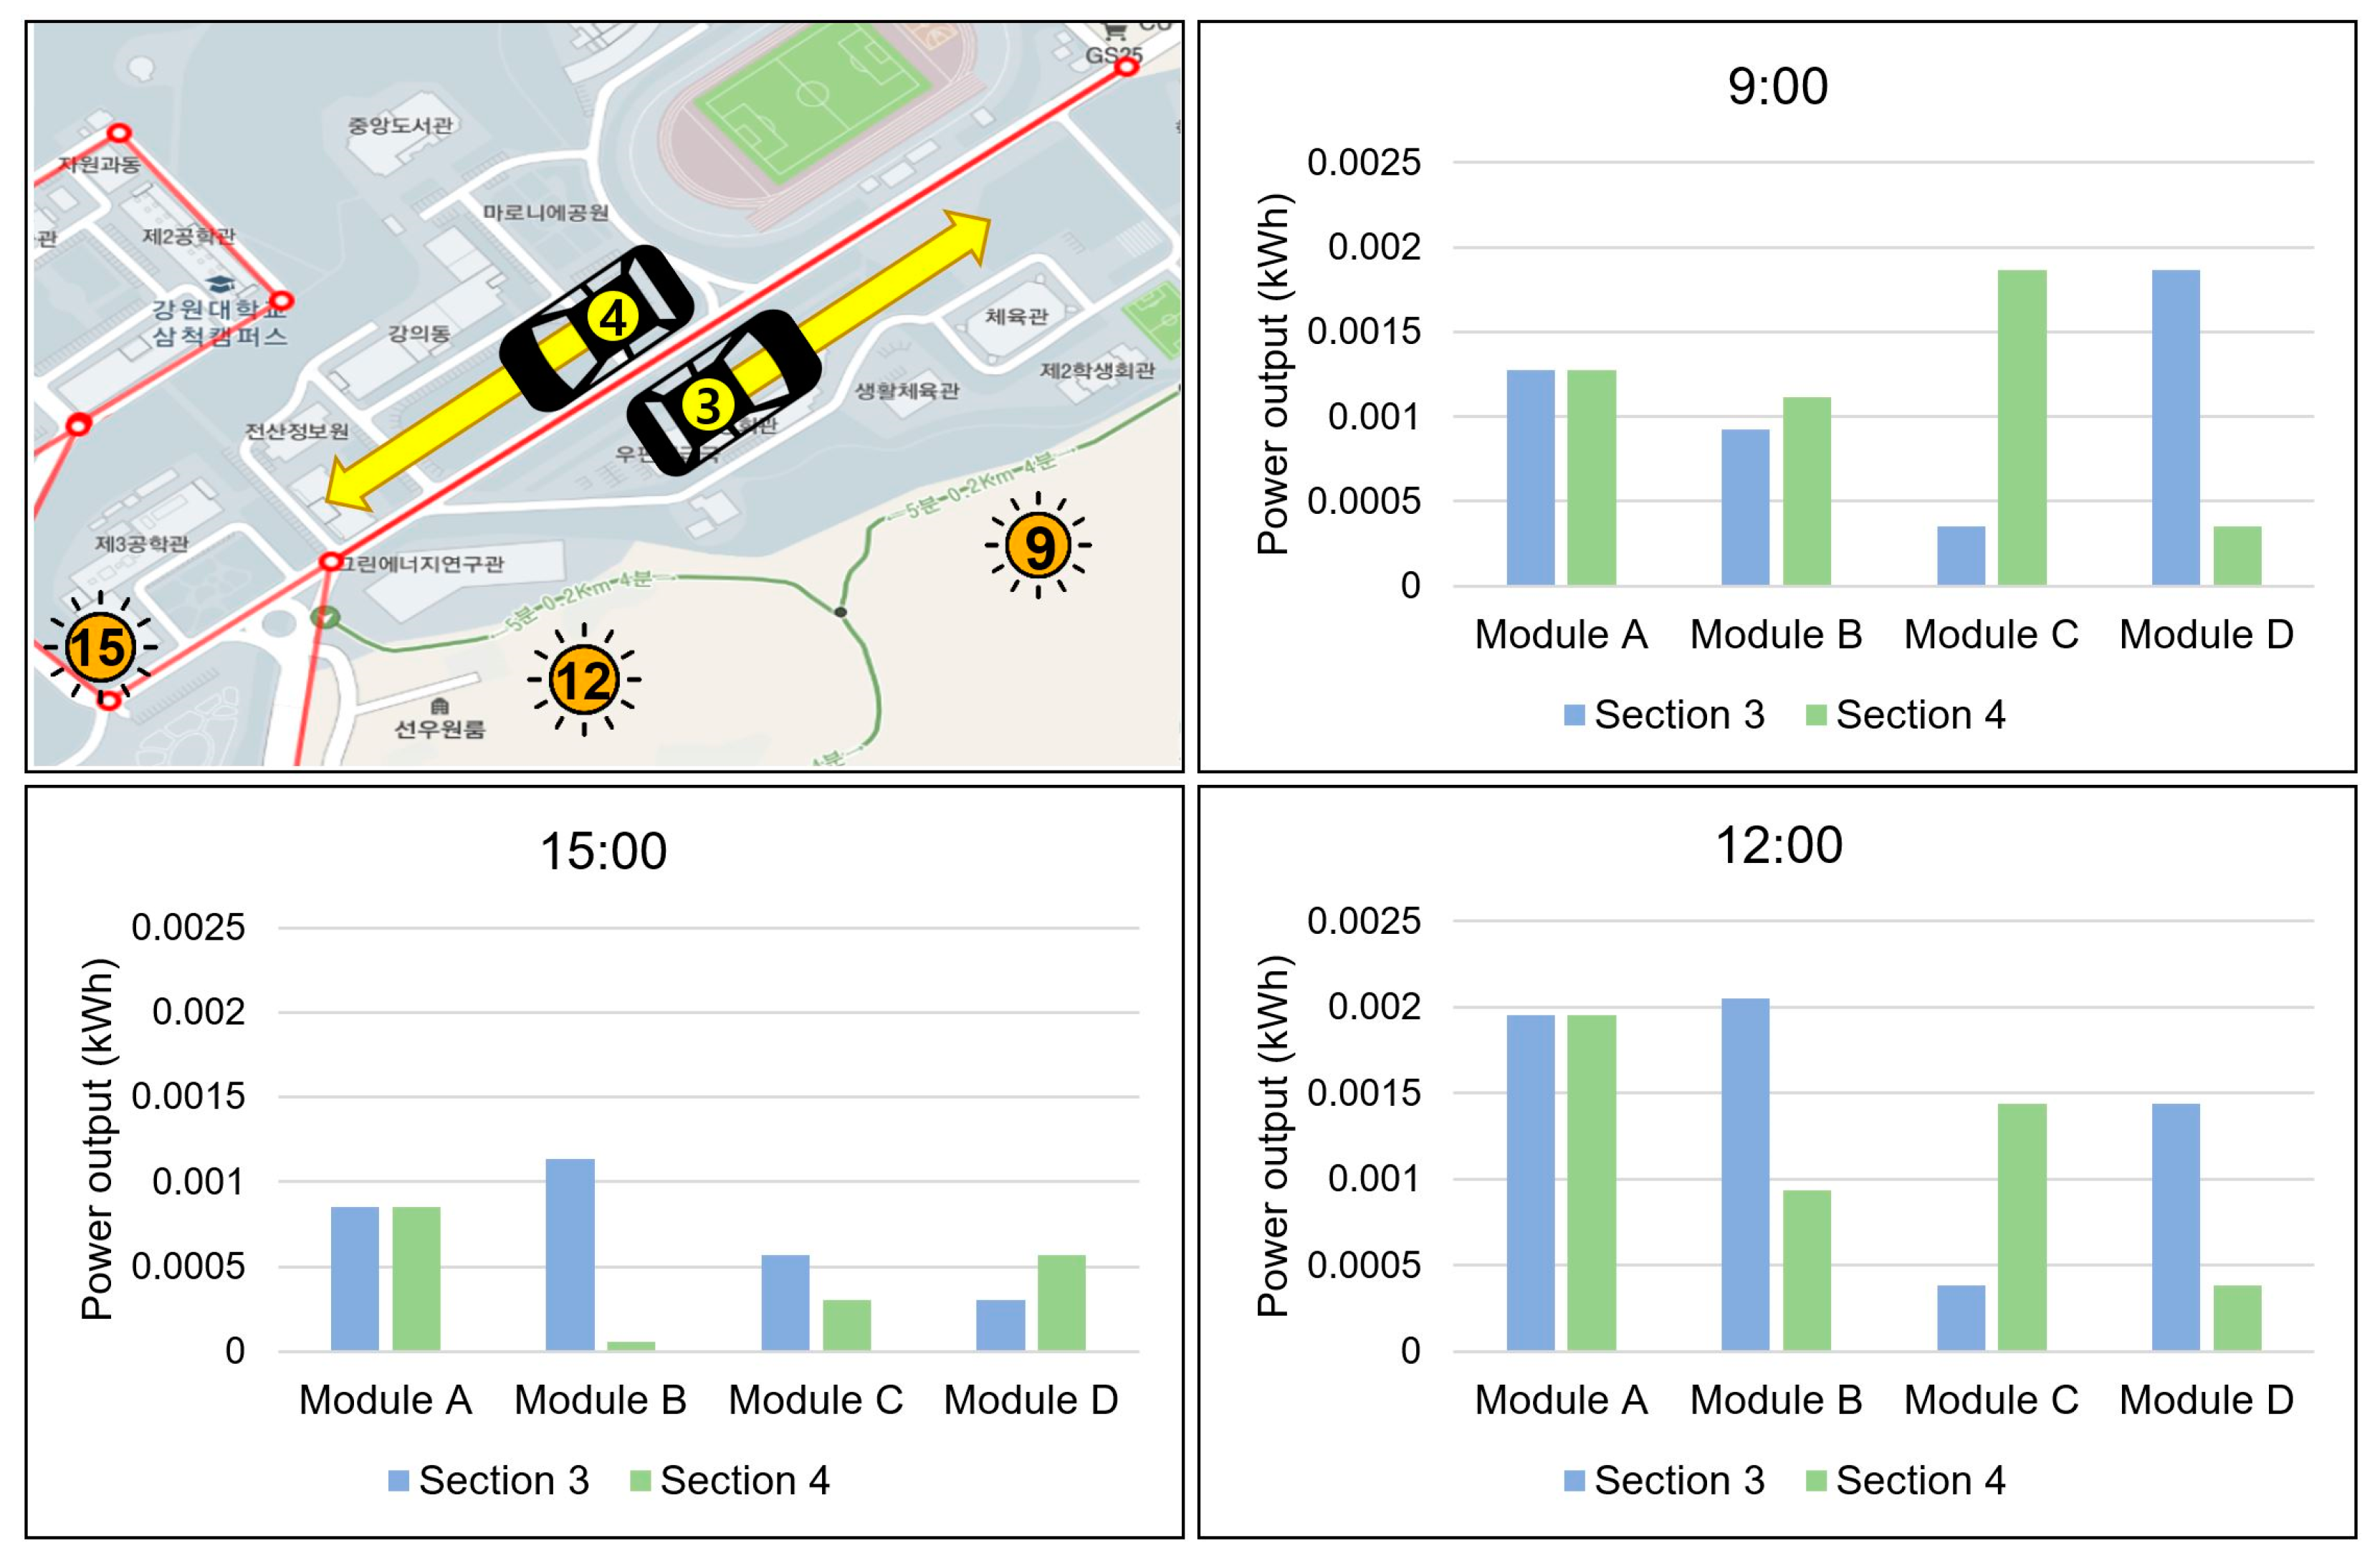
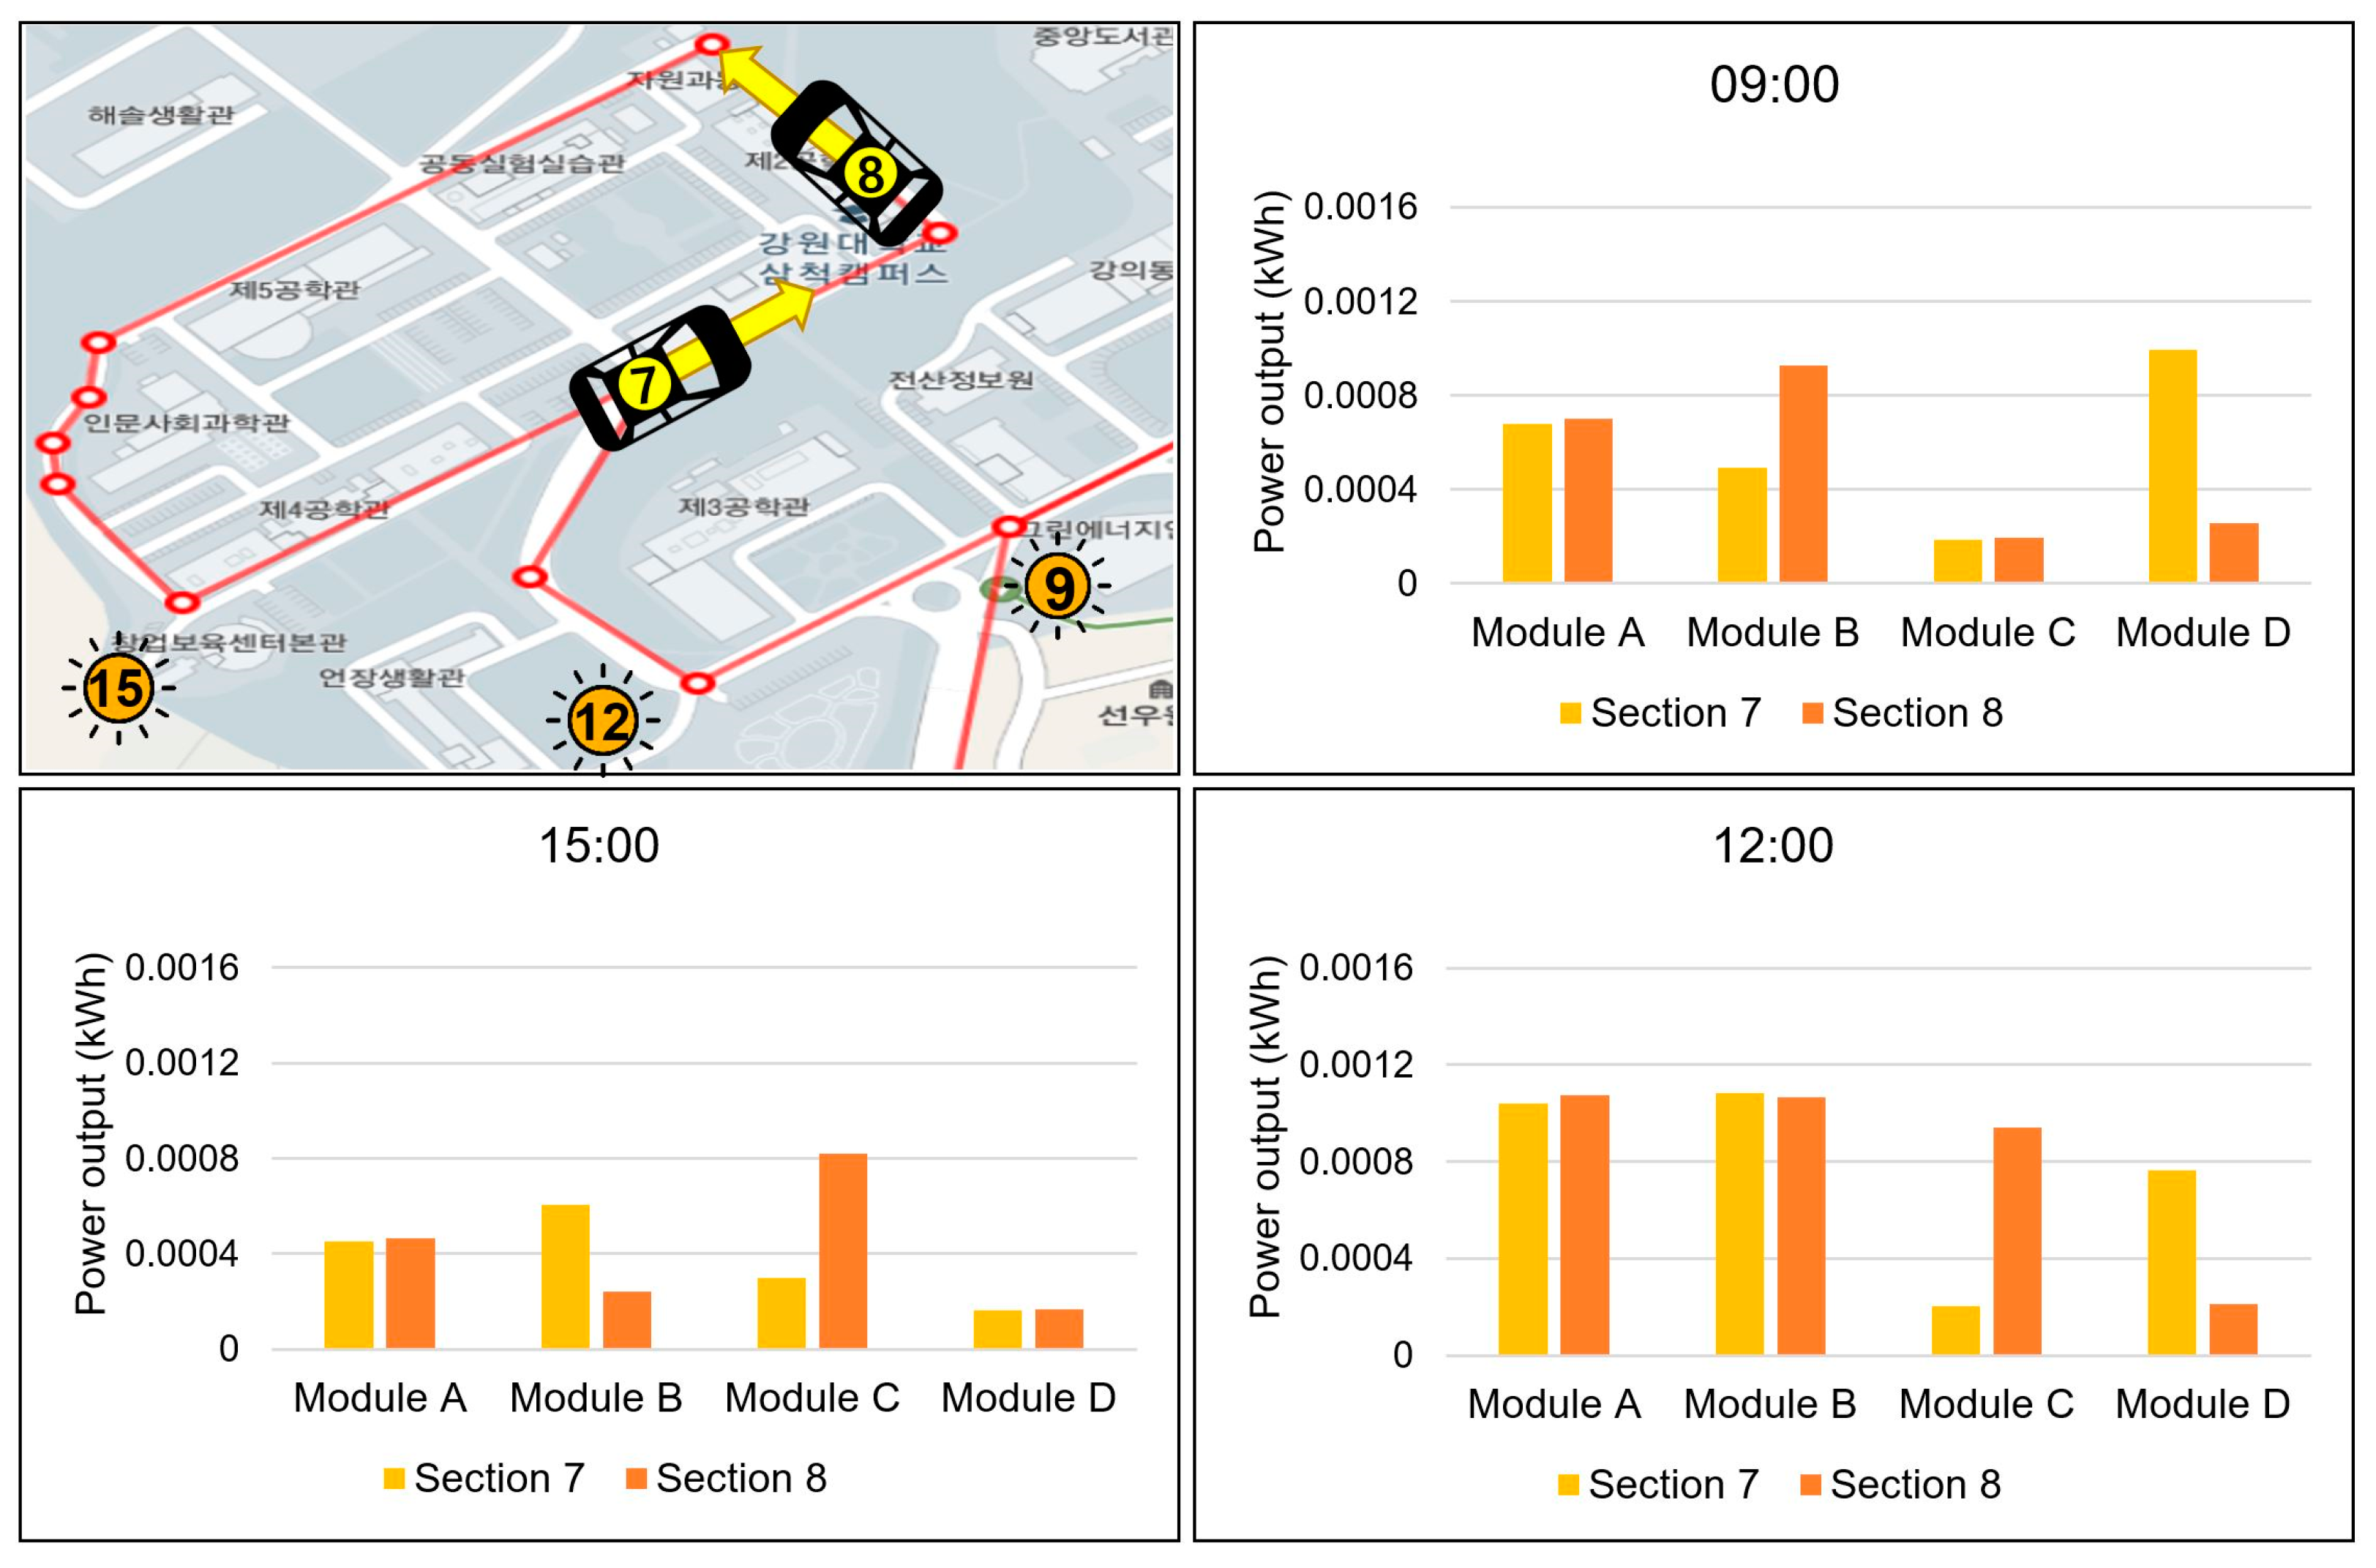
3.2.2. Comparison of PV Potential in Two Sections with Different Azimuth (Same Slope)
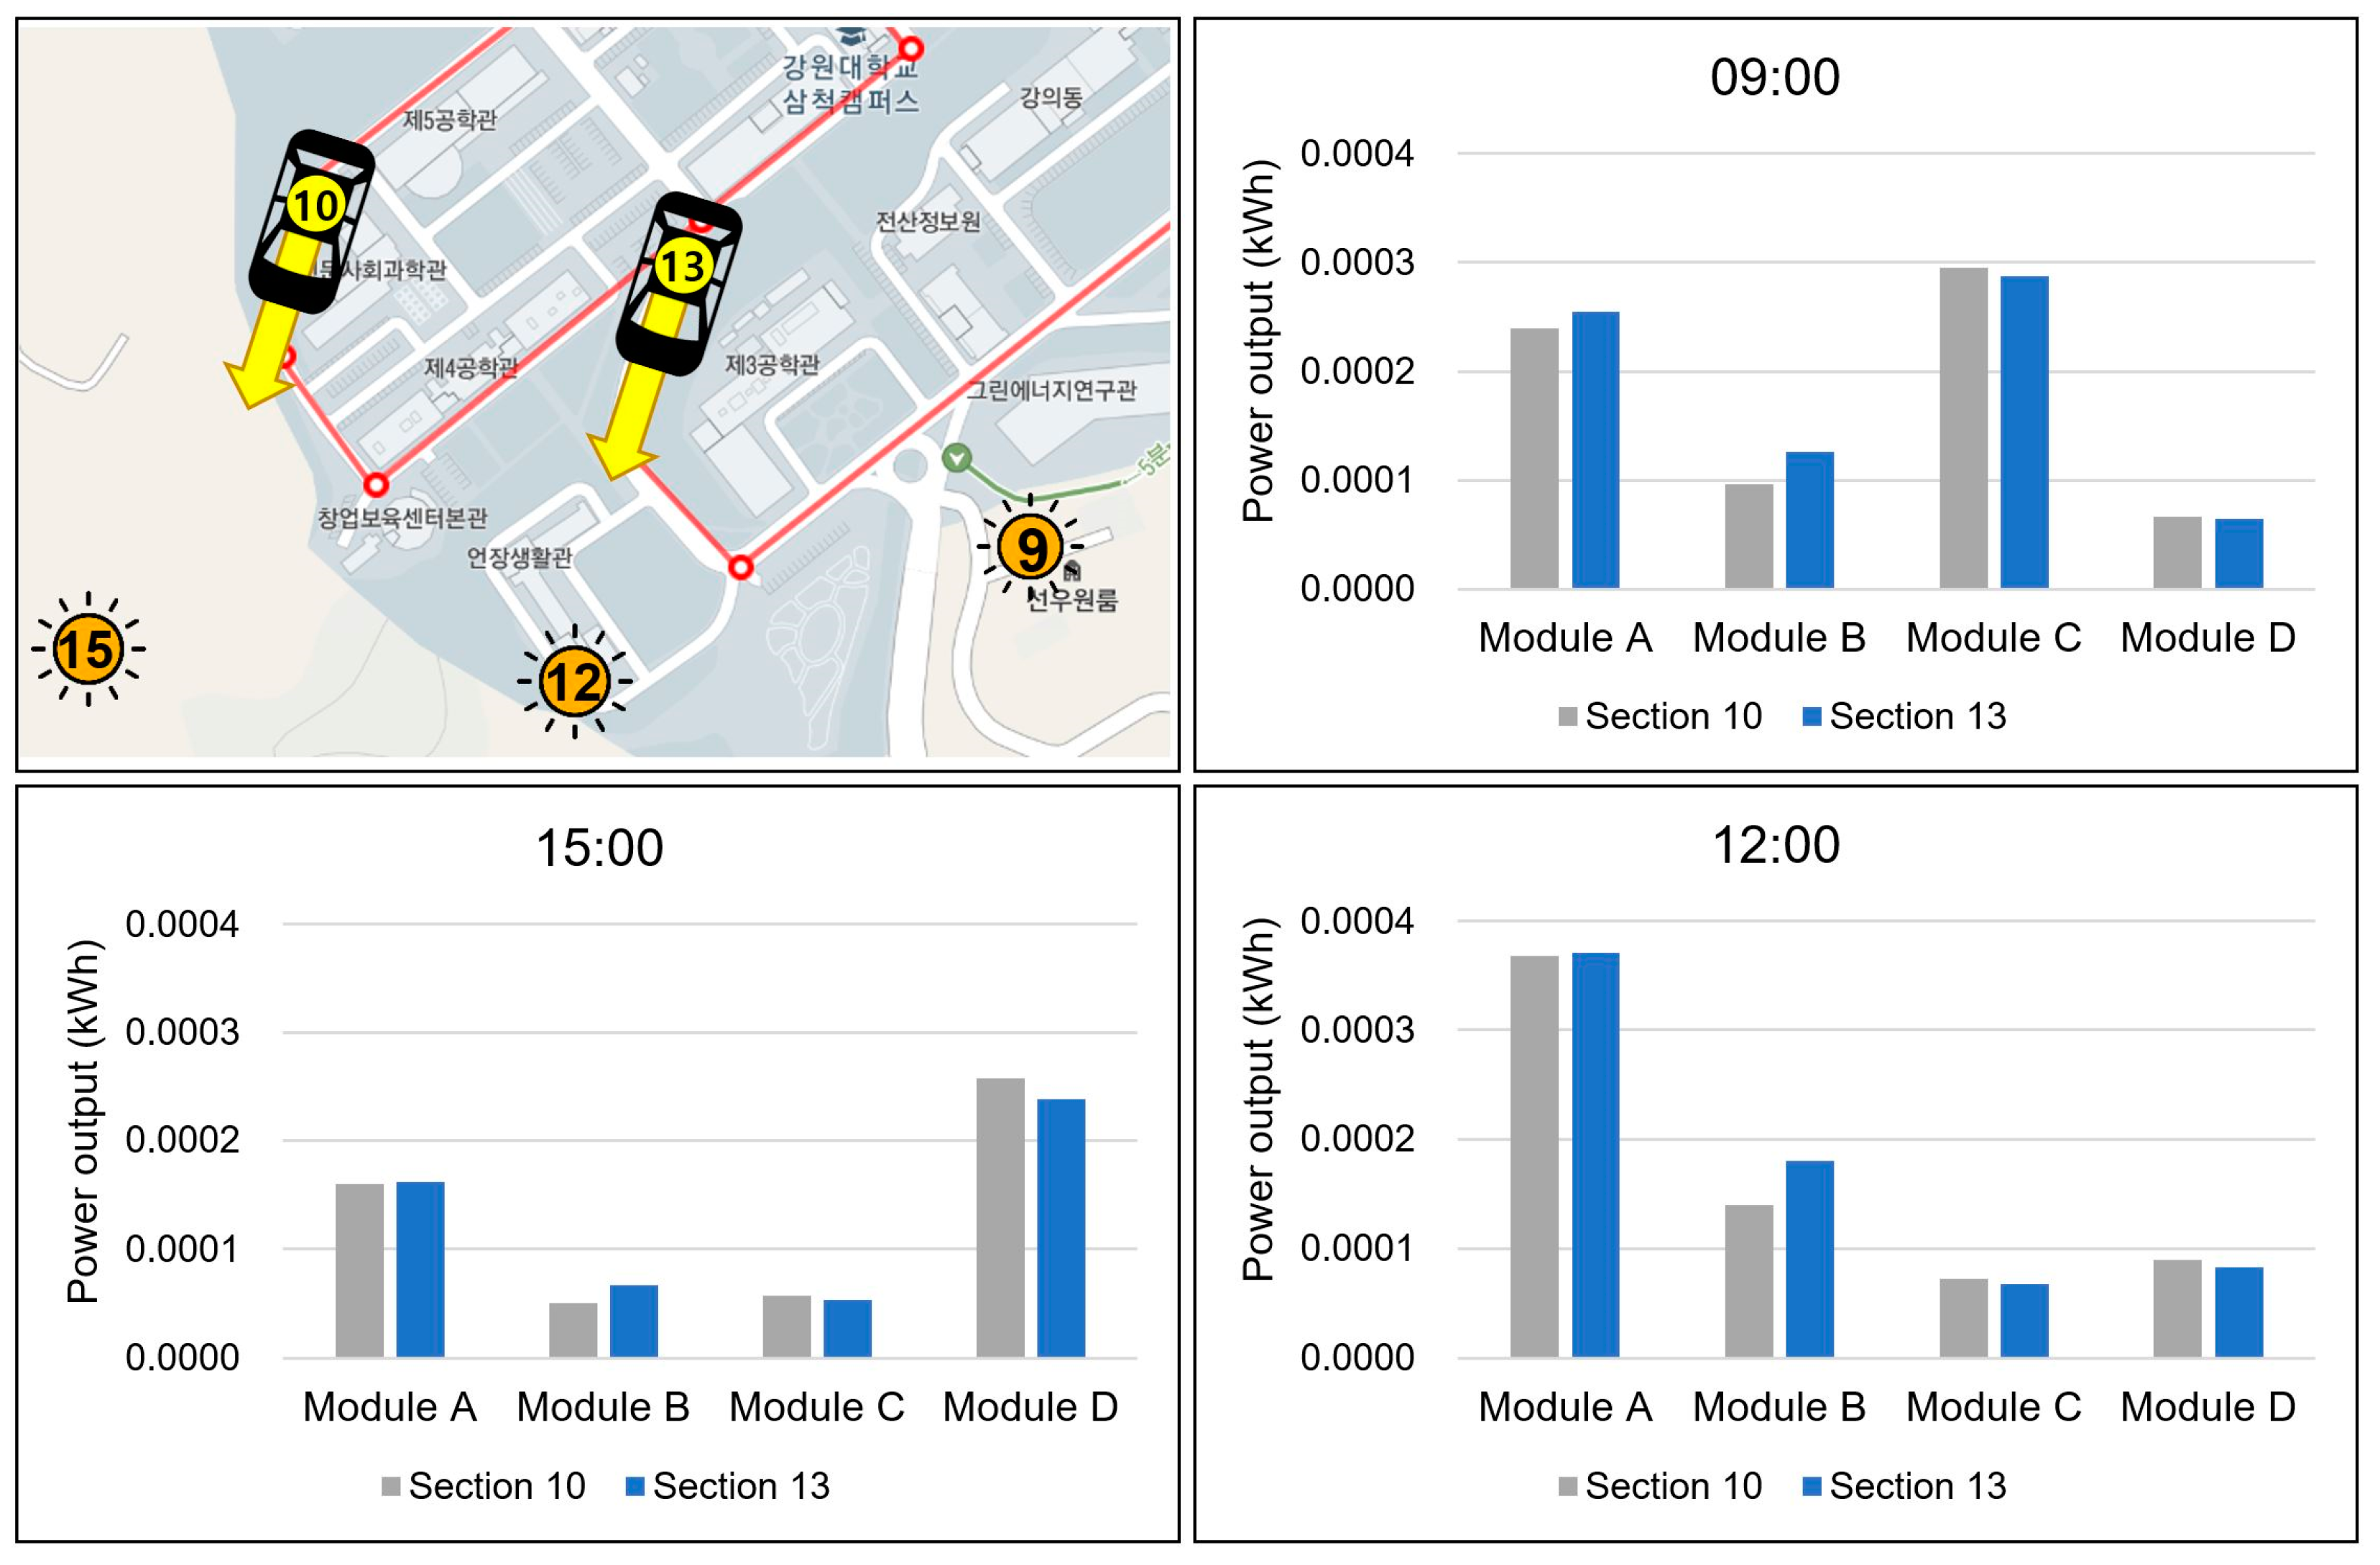
3.2.3. Comparison of PV Potential in Two Sections with Different Slopes (Same Azimuth)
3.3. Estimation of PV Potential Considering the Shaded Areas
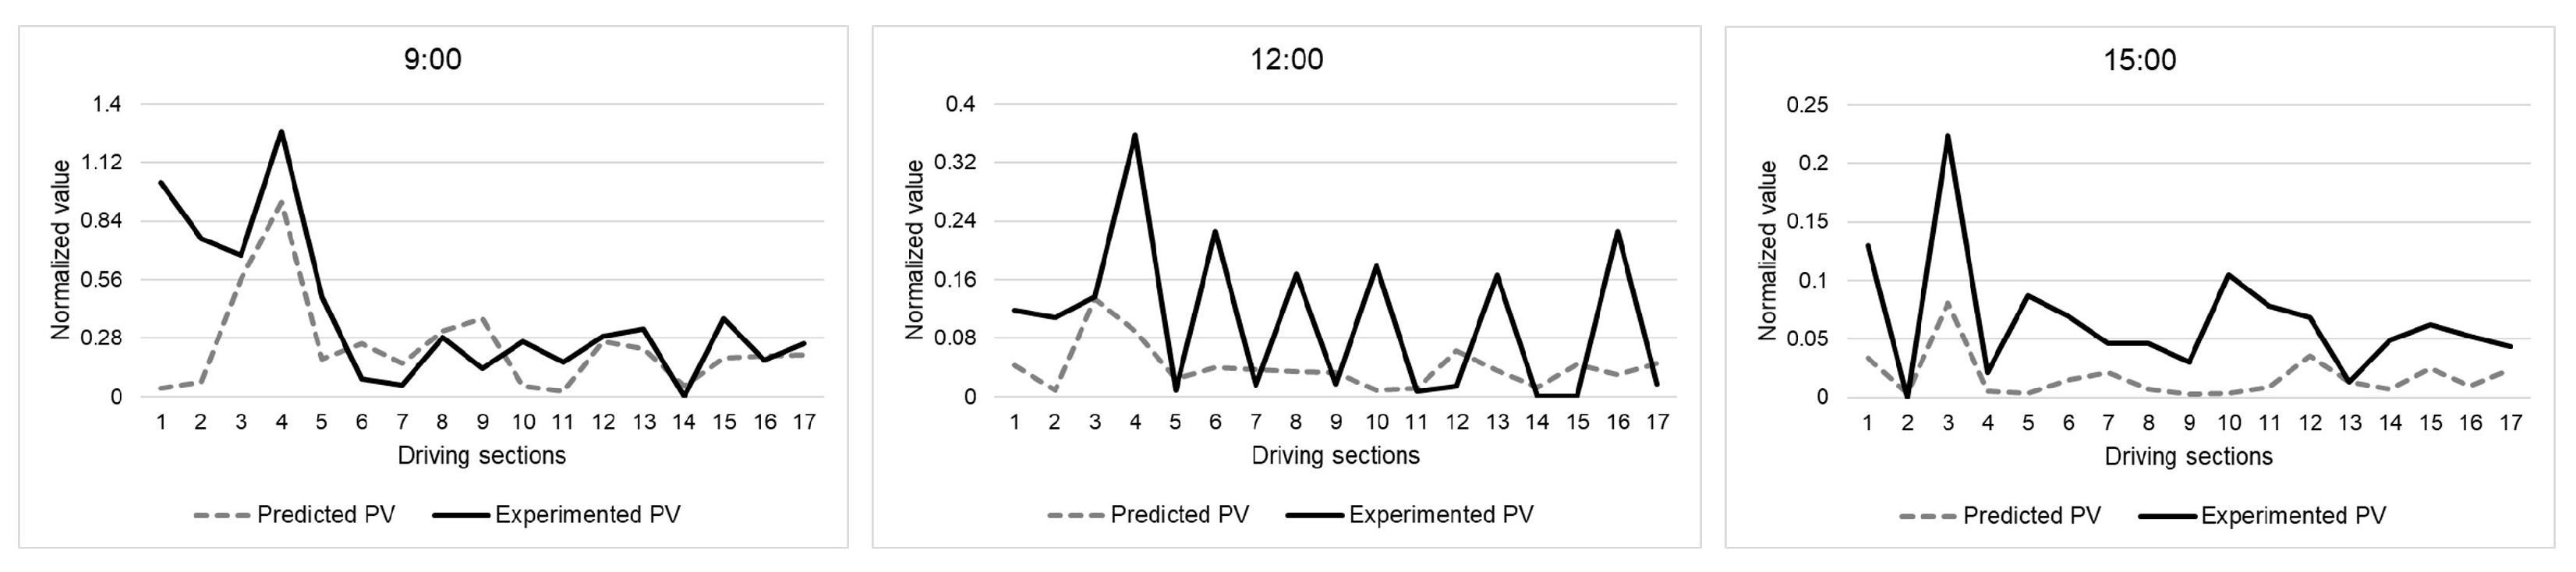
3.4. Comparison between Estimated and Measured PV Potentials through Field Experiment
4. Discussion
4.1. Effectiveness of the Modules Attached at the Rear Window and Doors of the Vehicle
4.2. Possibility of Expanding Power Output of Future PV-Powered EVs
5. Conclusions
Author Contributions
Funding
Institutional Review Board Statement
Informed Consent Statement
Data Availability Statement
Conflicts of Interest
Abbreviations
References
- Foley, A.; Olabi, A.G. Renewable energy technology developments, trends and policy implications that can underpin the drive for global climate change. Renew. Sustain. Energy Rev. 2017, 68, 1112–1114. [Google Scholar] [CrossRef]
- Koengkan, M.; Fuinhas, J.A.; Teixeira, M.; Kazemzadeh, E.; Auza, A.; Dehdar, F.; Osmani, F. The Capacity of Battery-Electric and Plug-in Hybrid Electric Vehicles to Mitigate CO2 Emissions: Macroeconomic Evidence from European Union Countries. World Electr. Veh. J. 2022, 13, 58. [Google Scholar] [CrossRef]
- Jakučionytė-Skodienė, M.; Krikštolaitis, R.; Liobikienė, G. The contribution of changes in climate-friendly behaviour, climate change concern and personal responsibility to household greenhouse gas emissions: Heating/cooling and transport activities in the European Union. Energy 2022, 246, 123387. [Google Scholar] [CrossRef]
- Sierra, A.; Reinders, A. Designing innovative solutions for solar-powered electric mobility applications. Prog. Photovolt. Res. Appl. 2021, 29, 802–818. [Google Scholar] [CrossRef]
- Hannan, M.A.; Hoque, M.M.; Mohamed, A.; Ayob, A. Review of energy storage systems for electric vehicle applications: Issues and challenges. Renew. Sustain. Energy Rev. 2017, 69, 771–789. [Google Scholar] [CrossRef]
- Sierra Rodriguez, A.; de Santana, T.; MacGill, I.; Ekins-Daukes, N.J.; Reinders, A. A feasibility study of solar PV-powered electric cars using an interdisciplinary modeling approach for the electricity balance, CO2 emissions, and economic aspects: The cases of The Netherlands, Norway, Brazil, and Australia. Prog. Photovolt. Res. Appl. 2020, 28, 517–532. [Google Scholar] [CrossRef]
- Yamaguchi, M.; Masuda, T.; Nakado, T.; Zushi, Y.; Araki, K.; Takamoto, T.; Okumura, K.; Satou, A.; Yamada, K.; Ota, Y.; et al. Importance of Developing Photovoltaics-Powered Vehicles. Energy Power Eng. 2021, 13, 147–162. [Google Scholar] [CrossRef]
- Allied Market Research. Available online: https://www.openpr.com/news/2035028/solar-car-market-growth-to-hit-4-087-6-million-by-2030-solar (accessed on 15 December 2022).
- Un-Noor, F.; Padmanaban, S.; Mihet-Popa, L.; Mollah, M.N.; Hossain, E. A comprehensive study of key electric vehicle (EV) components, technologies, challenges, impacts, and future direction of development. Energies 2017, 10, 1217. [Google Scholar] [CrossRef]
- Yamaguchi, M.; Masuda, T.; Araki, K.; Sato, D.; Lee, K.-H.; Kojima, N.; Takamoto, T.; Okumura, K.; Satou, A.; Yamada, K.; et al. Role of PV-Powered Vehicles in Low-Carbon Society and Some Approaches of High-Efficiency Solar Cell Modules for Cars. Energy Power Eng. 2020, 12, 375–395. [Google Scholar] [CrossRef]
- Yamaguchi, M.; Masuda, T.; Araki, K.; Sato, D.; Lee, K.H.; Kojima, N.; Takamoto, T.; Okumura, K.; Satou, A.; Yamada, K.; et al. Development of high-efficiency and low-cost solar cells for PV-powered vehicles application. Prog. Photovolt. Res. Appl. 2021, 29, 684–693. [Google Scholar] [CrossRef]
- Yamaguchi, M.; Ozaki, R.; Nakamura, K.; Lee, K.H.; Kojima, N.; Ohshita, Y.; Masuda, T.; Okumura, K.; Satou, A.; Nakado, T.; et al. Development of High-Efficiency Solar Cell Modules for Photovoltaic-Powered Vehicles. Sol. RRL 2021, 6, 2100429. [Google Scholar] [CrossRef]
- Ye, B.; Jiang, J.; Miao, L.; Yang, P.; Li, J.; Shen, B. Feasibility study of a solar-powered electric vehicle charging station model. Energies 2015, 8, 13265–13283. [Google Scholar] [CrossRef]
- Esfandyari, A.; Norton, B.; Conlon, M.; McCormack, S.J. Performance of a campus photovoltaic electric vehicle charging station in a temperate climate. Sol. Energy 2019, 177, 762–771. [Google Scholar] [CrossRef]
- Goli, P.; Shireen, W. PV powered smart charging station for PHEVs. Renew. Energy 2014, 66, 280–287. [Google Scholar] [CrossRef]
- Cheikh-Mohamad, S.; Sechilariu, M.; Locment, F.; Krim, Y. Pv-powered electric vehicle charging stations: Preliminary requirements and feasibility conditions. Appl. Sci. 2021, 11, 1770. [Google Scholar] [CrossRef]
- Minh, P.V.; Le Quang, S.; Pham, M.H. Technical economic analysis of photovoltaic-powered electric vehicle charging stations under different solar irradiation conditions in Vietnam. Sustainability 2021, 13, 3528. [Google Scholar] [CrossRef]
- Mitova, S.; Henao, A.; Kahsar, R.; Farmer, C.J. Smart Charging for Electric Ride-Hailing Vehicles using Renewables: A San Francisco Case Study. Int. J. Sustain. Energy Environ. Res. 2022, 11, 67–85. [Google Scholar] [CrossRef]
- Deshmukh, S.S.; Pearce, J.M. Electric vehicle charging potential from retail parking lot solar photovoltaic awnings. Renew. Energy 2021, 169, 608–617. [Google Scholar] [CrossRef]
- Farahmand, M.Z.; Javadi, S.; Sadati, S.M.B.; Laaksonen, H.; Shafie-khah, M. Optimal Operation of Solar Powered Electric Vehicle Parking Lots Considering Different Photovoltaic Technologies. Clean Technol. 2021, 3, 503–518. [Google Scholar] [CrossRef]
- Choi, Y.; Kang, B.; Kang, M.; Kim, M.; Lee, S.; Han, S.; Ha, W.; Lee, S.W.; Ahn, S. Analysis of Optimal Location for Campus Solar-powered Electric Vehicle Parking Lots Using a Fisheye Lens Camera. J. Korean Soc. Miner. Energy Resour. Eng. 2021, 58, 307–318. [Google Scholar] [CrossRef]
- Baek, J.; Choi, Y. An Experimental Study on Performance Evaluation of Shading Matrix to Select Optimal Parking Space for Solar-Powered Electric Vehicles. Sustainability 2022, 14, 14922. [Google Scholar] [CrossRef]
- Baek, J.; Choi, Y. Comparative Study on Shading Database Construction for Urban Roads Using 3D Models and Fisheye Images for Efficient Operation of Solar-Powered Electric Vehicles. Energies 2022, 15, 8228. [Google Scholar] [CrossRef]
- Hasicic, M.; Siljak, H. Putting the SC in SCORE: Solar Car Optimized Route Estimation and Smart Cities. In Modeling and Optimization in Green Logistics; Springer: Cham, Switzerland, 2020; pp. 75–86. [Google Scholar] [CrossRef]
- ur Rehman, N.; Hijazi, M.; Uzair, M. Solar potential assessment of public bus routes for solar buses. Renew. Energy 2020, 156, 193–200. [Google Scholar] [CrossRef]
- Jiang, L.; Hua, Y.; Ma, C.; Liu, X. SunChase: Energy-Efficient Route Planning for Solar-Powered EVs. In Proceedings of the 2017 IEEE 37th International Conference on Distributed Computing Systems (ICDCS), Atlanta, GA, USA, 5–8 June 2017; pp. 383–393. [Google Scholar] [CrossRef]
- Artmeier, A.; Haselmayr, J. The Optimal Routing Problem in the Context of Battery-Powered Electric Vehicles. 2020, pp. 1–13. Available online: https://mediatum.ub.tum.de/993198 (accessed on 20 December 2022).
- Goli, A.; Golmohammadi, A.-M.; Verdegay, J.-L. Two-echelon electric vehicle routing problem with a developed moth-flame meta-heuristic algorithm. Oper. Manag. Res. 2022, 15, 891–912. [Google Scholar] [CrossRef]
- Seo, H. Estimation of PV-Powered Electric Vehicle Potential by Hour in the Expressway Using GIS. Master’s Thesis, Kangwon National University, Chuncheon, Republic of Korea, 2022. [Google Scholar]
- Oh, M.; Kim, S.M.; Park, H.D. Estimation of photovoltaic potential of solar bus in an urban area: Case study in Gwanak, Seoul, Korea. Renew. Energy 2020, 160, 1335–1348. [Google Scholar] [CrossRef]
- Kim, H.; Ku, J.; Kim, S.M.; Park, H.D. A new GIS-based algorithm to estimate photovoltaic potential of solar train: Case study in Gyeongbu line, Korea. Renew. Energy 2022, 190, 713–729. [Google Scholar] [CrossRef]
- Suh, J.; Jang, Y.; Choi, Y. Comparison of electric power output observed and estimated from floating photovoltaic systems: A case study on the hapcheon dam, Korea. Sustainability 2020, 12, 276. [Google Scholar] [CrossRef]


| References | Type | Module Attachment | Slope/Aspect of Pathway | Temporal Unit | Validation |
|---|---|---|---|---|---|
| Seo [29] | Solar car | Roof | Not considered | Hourly | No |
| Oh et al. [30] | Solar bus | Roof | Not considered | Minutely | Yes |
| Kim et al. [31] | Solar train | Roof | Not considered | Minutely | No |
| This study | Solar car | Roof, rear window, side doors | Considered | <Minutely | Yes |
| PV System | Items | Module A | Module B | Module C | Module D |
|---|---|---|---|---|---|
| Module | Model | smf-175w | smf-100w | fs40w | fs40w |
| Rated maximum power (Pmax) | 175 W | 100 W | 40 W | 40 W | |
| Efficiency | 17.30% | 15.49% | 19.60% | 19.60% | |
| Attaching position | Roof | Rear window | Left door | Right door | |
| Inverter | Efficiency | 96% | 96% | 96% | 96% |
| System design | Inclination (on flat area) | 0° | 30° | 90° | 90° |
| Azimuth (when car is heading north) | N/A | South | West | East | |
| Tracking mode | Fixed | Fixed | Fixed | Fixed |
| Sections | Distance (m) | PV Potential (kWh) (without Shadow) | Shadow (Ratio) | PV Potential (kWh) (with Shadow) | ||||||
|---|---|---|---|---|---|---|---|---|---|---|
| 9:00 | 12:00 | 15:00 | 9:00 | 12:00 | 15:00 | 9:00 | 12:00 | 15:00 | ||
| 1 | 180 | 0.0015 | 0.0029 | 0.0016 | 35.0% | 25.0% | 25.0% | 0.0010 | 0.0022 | 0.0012 |
| 2 | 165 | 0.0017 | 0.0014 | 0.0013 | 73.7% | 25.0% | 25.0% | 0.0004 | 0.0010 | 0.0010 |
| 3 | 465 | 0.0059 | 0.0070 | 0.0034 | 88.0% | 70.5% | 39.6% | 0.0007 | 0.0021 | 0.0020 |
| 4 | 605 | 0.0078 | 0.0080 | 0.0033 | 74.4% | 37.2% | 26.2% | 0.0020 | 0.0050 | 0.0024 |
| 5 | 75 | 0.0008 | 0.0013 | 0.0007 | 86.0% | 25.0% | 84.8% | 0.0001 | 0.0009 | 0.0001 |
| 6 | 110 | 0.0014 | 0.0014 | 0.0011 | 41.2% | 25.0% | 45.6% | 0.0008 | 0.0011 | 0.0006 |
| 7 | 130 | 0.0016 | 0.0023 | 0.0013 | 78.4% | 66.8% | 42.9% | 0.0003 | 0.0008 | 0.0007 |
| 8 | 125 | 0.0012 | 0.0020 | 0.0012 | 62.6% | 68.8% | 93.1% | 0.0004 | 0.0006 | 0.0001 |
| 9 | 255 | 0.0033 | 0.0034 | 0.0014 | 87.0% | 77.7% | 18.5% | 0.0004 | 0.0008 | 0.0011 |
| 10 | 75 | 0.0008 | 0.0008 | 0.0007 | 100.0% | 30.3% | 25.0% | 0.0000 | 0.0005 | 0.0005 |
| 11 | 85 | 0.0006 | 0.0012 | 0.0008 | 83.4% | 57.1% | 73.2% | 0.0001 | 0.0005 | 0.0002 |
| 12 | 195 | 0.0024 | 0.0029 | 0.0014 | 56.9% | 39.7% | 27.4% | 0.0011 | 0.0018 | 0.0010 |
| 13 | 110 | 0.0013 | 0.0013 | 0.0010 | 41.2% | 25.0% | 67.3% | 0.0008 | 0.0010 | 0.0003 |
| 14 | 75 | 0.0006 | 0.0012 | 0.0007 | 55.7% | 76.8% | 91.0% | 0.0003 | 0.0003 | 0.0001 |
| 15 | 140 | 0.0017 | 0.0021 | 0.0010 | 66.0% | 43.3% | 30.3% | 0.0006 | 0.0012 | 0.0007 |
| 16 | 165 | 0.0019 | 0.0018 | 0.0015 | 28.6% | 25.0% | 48.4% | 0.0014 | 0.0014 | 0.0008 |
| 17 | 180 | 0.0020 | 0.0029 | 0.0013 | 35.9% | 52.6% | 68.0% | 0.0013 | 0.0014 | 0.0004 |
| Total | 3135 | 0.0365 | 0.0439 | 0.0236 | 67.1% | 47.4% | 40.9% | 0.0117 | 0.0225 | 0.0133 |
| Time | PV Potential per Car (kWh) | PV Potential for 243,000 Cars (MWh) | ||
|---|---|---|---|---|
| Cell Efficiency | Cell Efficiency | |||
| 15% | 30% | 15% | 30% | |
| 564 s | 0.0158 | 0.0316 | 3.84 | 7.68 |
| 1 h | 0.1011 | 0.2022 | 24.57 | 49.13 |
| 1 day | 0.6064 | 1.2128 | 147.36 | 294.71 |
| 1 year | 221.3298 | 442.6596 | 53,783.14 | 107,556.28 |
Disclaimer/Publisher’s Note: The statements, opinions and data contained in all publications are solely those of the individual author(s) and contributor(s) and not of MDPI and/or the editor(s). MDPI and/or the editor(s) disclaim responsibility for any injury to people or property resulting from any ideas, methods, instructions or products referred to in the content. |
© 2023 by the authors. Licensee MDPI, Basel, Switzerland. This article is an open access article distributed under the terms and conditions of the Creative Commons Attribution (CC BY) license (https://creativecommons.org/licenses/by/4.0/).
Share and Cite
Park, C.; Park, H.; Jeon, H.; Choi, K.; Suh, J. Evaluation and Validation of Photovoltaic Potential Based on Time and Pathway of Solar-Powered Electric Vehicle. Appl. Sci. 2023, 13, 1025. https://doi.org/10.3390/app13021025
Park C, Park H, Jeon H, Choi K, Suh J. Evaluation and Validation of Photovoltaic Potential Based on Time and Pathway of Solar-Powered Electric Vehicle. Applied Sciences. 2023; 13(2):1025. https://doi.org/10.3390/app13021025
Chicago/Turabian StylePark, Chanwook, Haneul Park, Hwanhee Jeon, Kyoik Choi, and Jangwon Suh. 2023. "Evaluation and Validation of Photovoltaic Potential Based on Time and Pathway of Solar-Powered Electric Vehicle" Applied Sciences 13, no. 2: 1025. https://doi.org/10.3390/app13021025
APA StylePark, C., Park, H., Jeon, H., Choi, K., & Suh, J. (2023). Evaluation and Validation of Photovoltaic Potential Based on Time and Pathway of Solar-Powered Electric Vehicle. Applied Sciences, 13(2), 1025. https://doi.org/10.3390/app13021025