


The Impact of Data Pre-Processing on Hate Speech Detection in a Mix of English and Hindi–English (Code-Mixed) Tweets


_Karamitsos.jpg)
Abstract
:1. Introduction
“Agar is team ka captain Dhoni nhi to ye team kuch nhi, chahe kisi Ko bhi le aao, Lakho log aaj apki team Ko hate krne lge h”.
“If Dhoni is not the captain of this team, then this team is nothing, no matter whoever you bring, millions of people have started hating your team today”.
“Magar ye media walay to jaan boojh ker paise ke liye sab karrahe hain”.
“But these media people are deliberately doing everything for money”.
1.1. Contribution
1.2. Organization
2. Related Work
2.1. Toxic Speech Detection in English Text
2.2. Toxic Speech Detection in Hindi–English Code-Mixed Text
2.3. Toxic Speech Detection in Multilingual Text
3. Description of the Dataset
- The first portion of our dataset is collected from the dataset used by Davidson et al. [23]. Davidson et al.’s dataset contains tweets written in the English language and labels tweets as “hate”, “offensive”, or “neither”. However, for the sake of integrating this dataset into our work (i.e., keeping only two class labels), we relabeled the “offensive” class as hate and “neither” as non-hate. As a result, we had a dataset containing 24,783 tweets in English, where 4163 tweets were classified as non-hate and 20,620 as hate.
- The second portion of our dataset is collected from the dataset used by Bohra et al. [12]. This dataset contains tweets written in Hindi–English code-mixed language and tweets labeled as “hate” or “non-hate”. Overall, this dataset contains 4579 tweets, where 2918 of them are classified as non-hate and 1661 as hate.
- The third portion of our dataset is collected from the dataset used by Mathur et al. [21]. Mathur et al.’s dataset contains tweets written in Hindi–English code-mixed language tweets labeled as “hate-inducing”, “non-offensive”, or “abusive”. For the sake of having two class labels, we relabeled “hate-inducing” and “abusive” as hate and relabeled “non-offensive” as non-hate. In total, this dataset contains 3189 tweets in code-mixed Hindi–English, where 1121 of them are classified as non-hate and 2068 as hate.
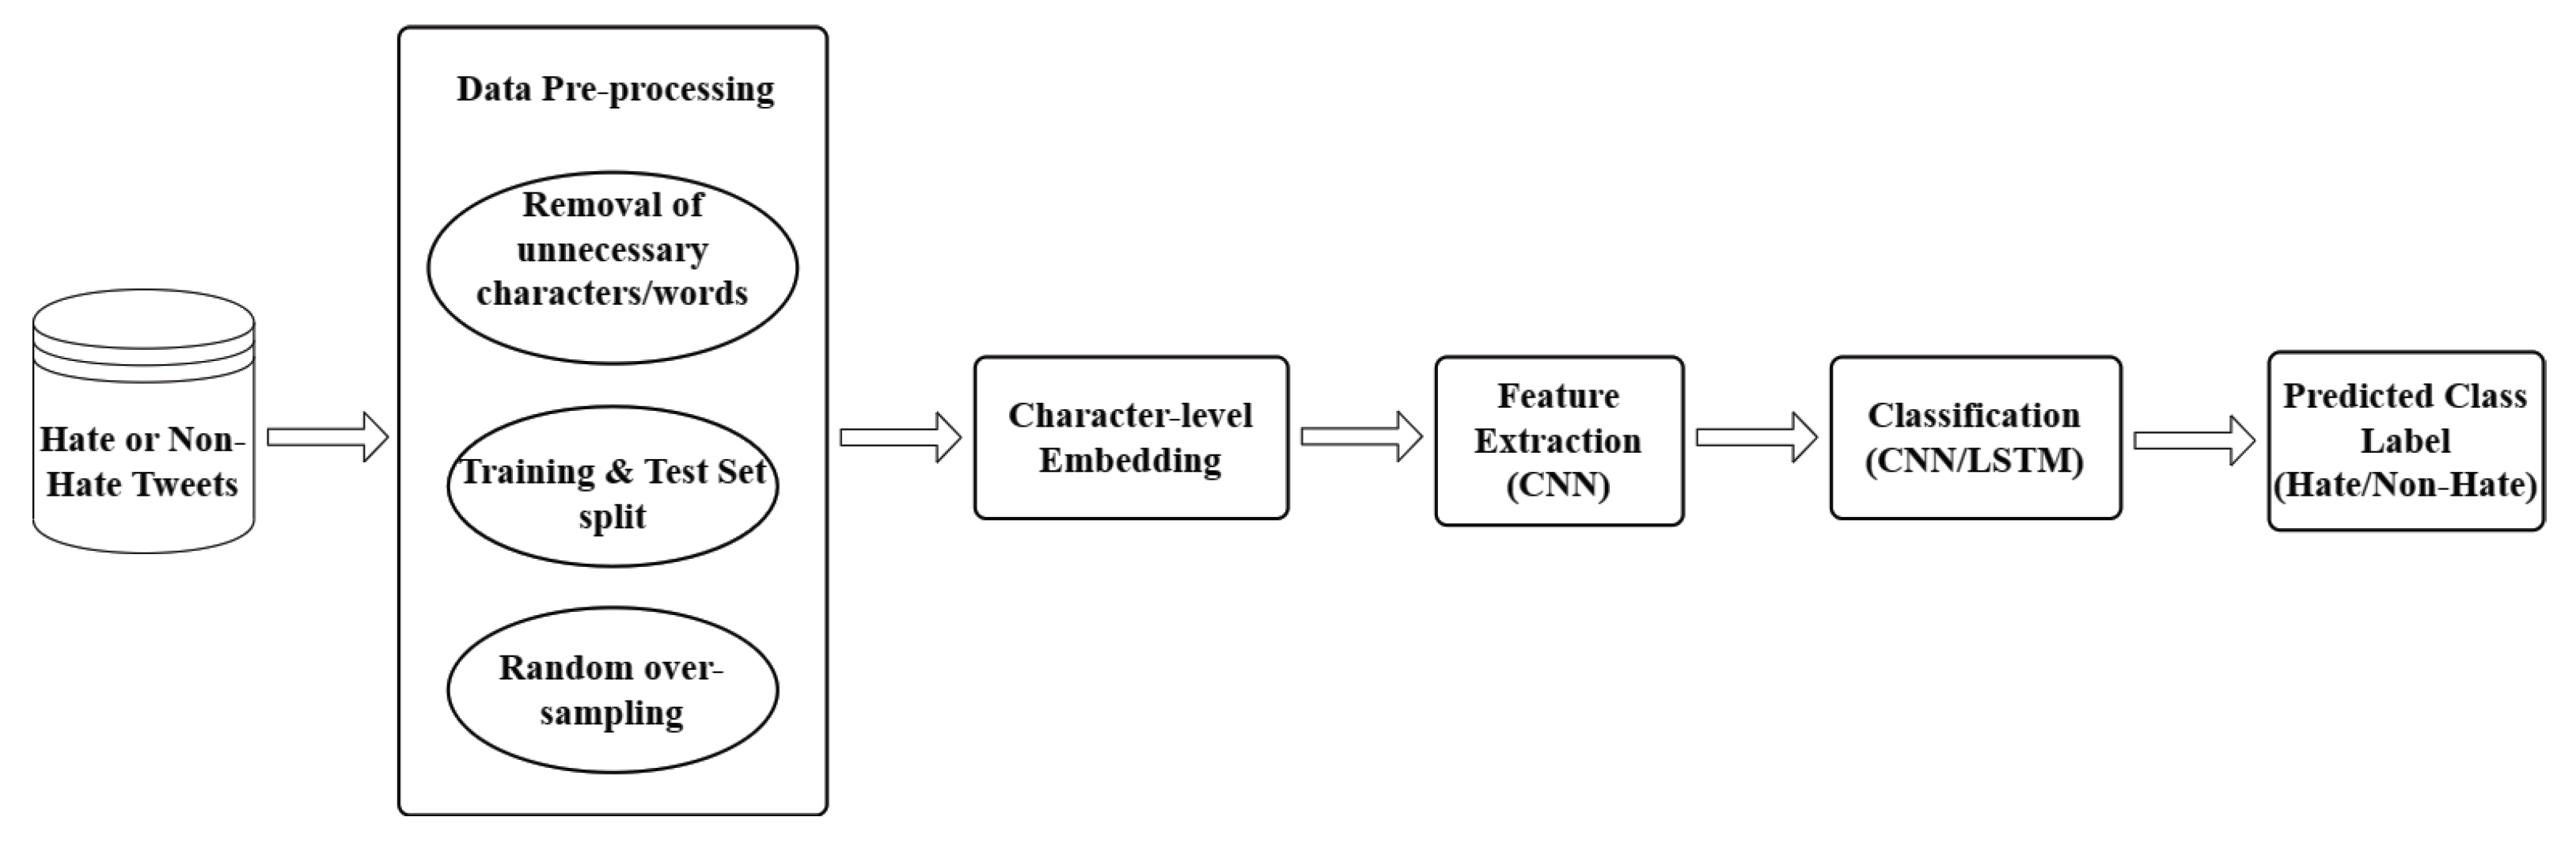
4. Proposed Method
4.1. Data Cleaning (Pre-Processing)
 ,
,  ), special characters (e.g., @, +), punctuation marks (e.g., ?, !), and URLs (e.g., http://t.co/hH50P5pytX). Indeed, the experiments in Section 5 further corroborate this assumption. Therefore, the following pre-processing steps are carried out on all input tweets:
- Decoding HTML: The encoded HTML parts are decoded by replacing the HTML entity names or numbers with their original text representation. Some encoded HTML parts, such as “&”, are not correctly decoded and, thus, are removed.
- Removal of emoticons: All the emoticons encoded with UTF-8 BOM (Byte Order Marks) in the original text are first decoded and then removed.
- Removal of mentions (usernames): Since mentions are just other individuals’ usernames tagged in the tweets, they do not contribute to any kind of sentiment in the tweet. Hence, they are removed.
- Removal of URL links: All the URLs (http/https/www) and other links (including links of pictures/videos) in the tweets are removed, since they do not contribute to any kind of sentiment in the tweet.
- Conversion to lower case: All the tweets are converted to lower case in order to have only lower-case letters for character-level representation/embedding.
- Expansion of negations: As a special character, all apostrophes are removed. However, in doing so, the negative contractions lose their meaning. For example, words like “can’t” end up as “can t”, which is not an English word. Therefore, to avoid this situation, all negative contractions are appropriately expanded. Thus, a contraction such as “can’t” is converted to “cannot”.
- Removal of hashtags, punctuation marks, numbers, and special characters: There are cases where the words/phrases used with the hashtag symbol (#) provide useful information about the tweets and their sentiment. Hence, only the “#” symbols are removed, in addition to other special characters, punctuation marks, and numbers.
- Removal of extra white spaces: Any extra white space in the tweets is removed.
- Removal of duplicates: A dataset may contain duplicate tweets (same tweet repeated multiple times). All such instances of duplications are removed, keeping only unique tweets to avoid these duplicates from falling in both the training and test set during the train–test split step and hence avoid overfitting. However, some duplicate tweets are mistakenly labeled as both hate and non-hate. With careful examination, all erroneously labeled duplicates are removed.
- Removal of null values: Some tweets may be composed of entirely removable parts, such as mentions, links, and emoticons. Consequently, pre-processing such tweets renders them empty strings (null). Such tweets are removed entirely.
4.2. Training and Test Sets Split
4.3. Handling Data Imbalance
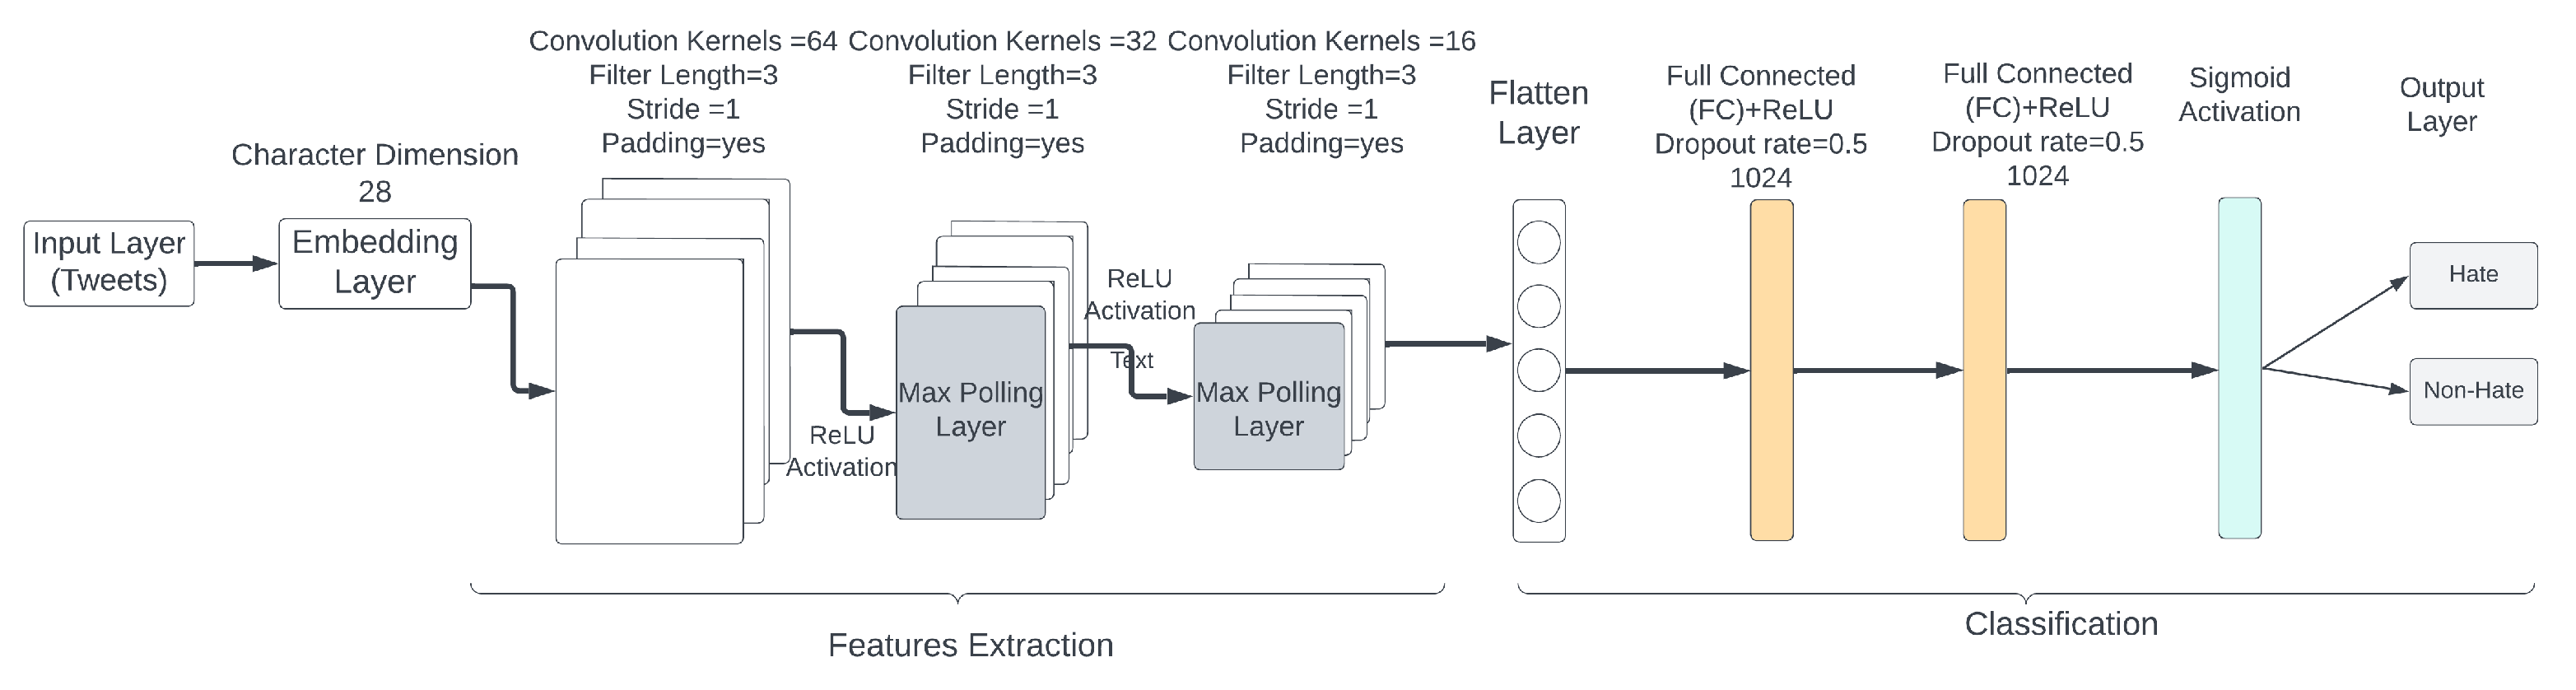
4.4. Proposed Model Architecture
- a.
- One input layer, where the shape of the layer is 280 (maximum length of a tweet).
- b.
- One embedding layer, with an embedding size of 28 (dimension of each character).
- c.
- Three convolution layers, each with 100 filters, a window size of 3, stride 1, padding as “valid”, and “relu” activation function. Two of the convolution layers are followed by a max-pooling layer with a window size of 3.
- d.
- One flatten layer.
- e.
- Two fully/densely connected layers, with dense size of 1024 neurons and “relu” activation function. Each layer is followed by a dropout layer with a dropout rate of 0.5 to regularize.
- f.
- One output layer, with two neurons and “sigmoid” activation function (where the number of neurons is the number of target class labels).
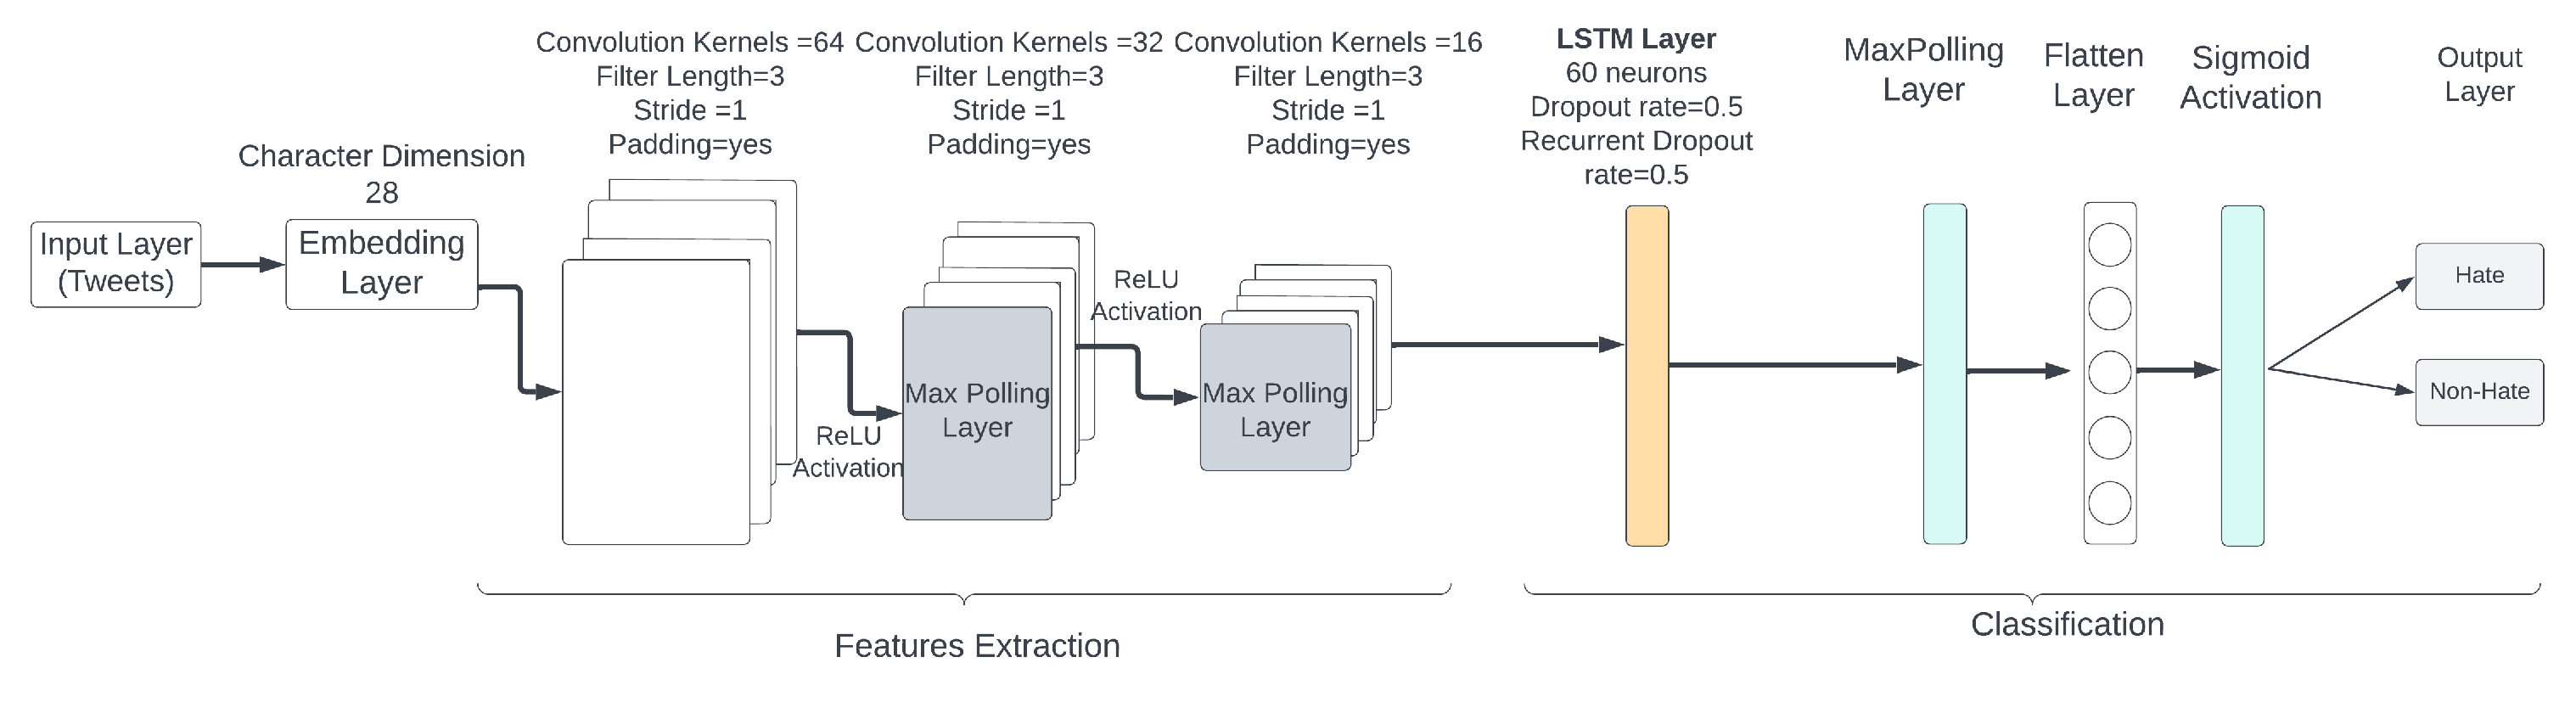
- a.
- One input layer, where the shape of the layer is 280 (maximum length of a tweet).
- b.
- One embedding layer, with an embedding size of 28 (dimension of each character).
- c.
- Three convolution layers, each with 100 filters, a window size of 3, stride 1, padding as “valid”, and “relu” activation function. Two of the convolution layers are followed by a max-pooling layer with a window size of 3.
- d.
- One LSTM layer, with a size of 60 neurons, a dropout rate of 0.5, and a recurrent dropout rate of 0.5.
- e.
- One max-pooling layer, with a window size of 3.
- f.
- One flatten layer.
- g.
- One output layer, with two neurons and “sigmoid” activation function (where the number of neurons is the number of target class labels).
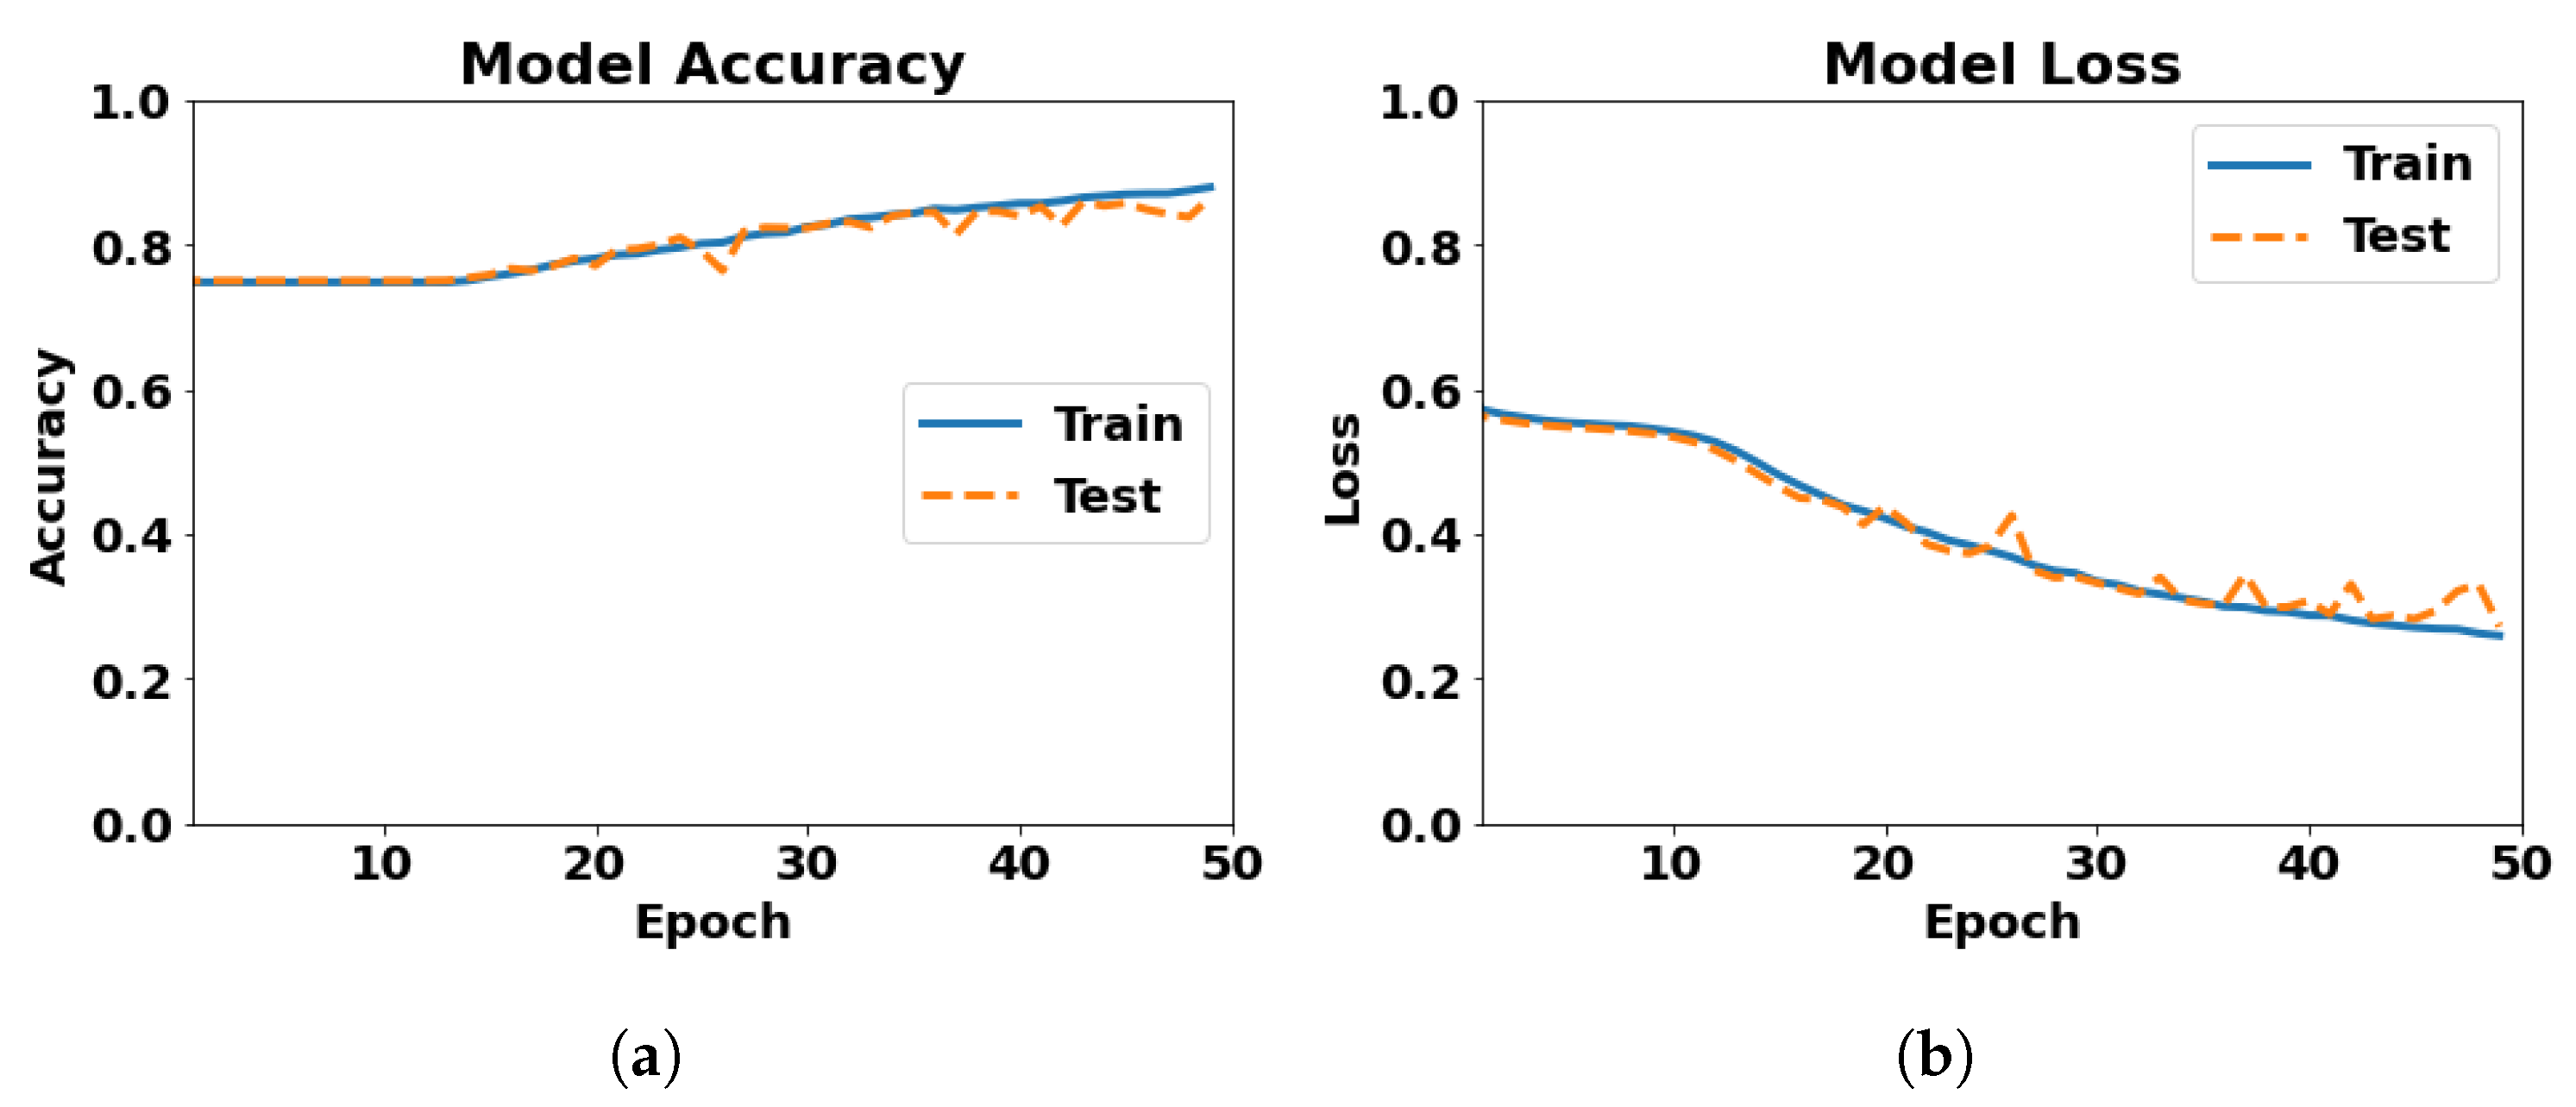
5. Performance Evaluation
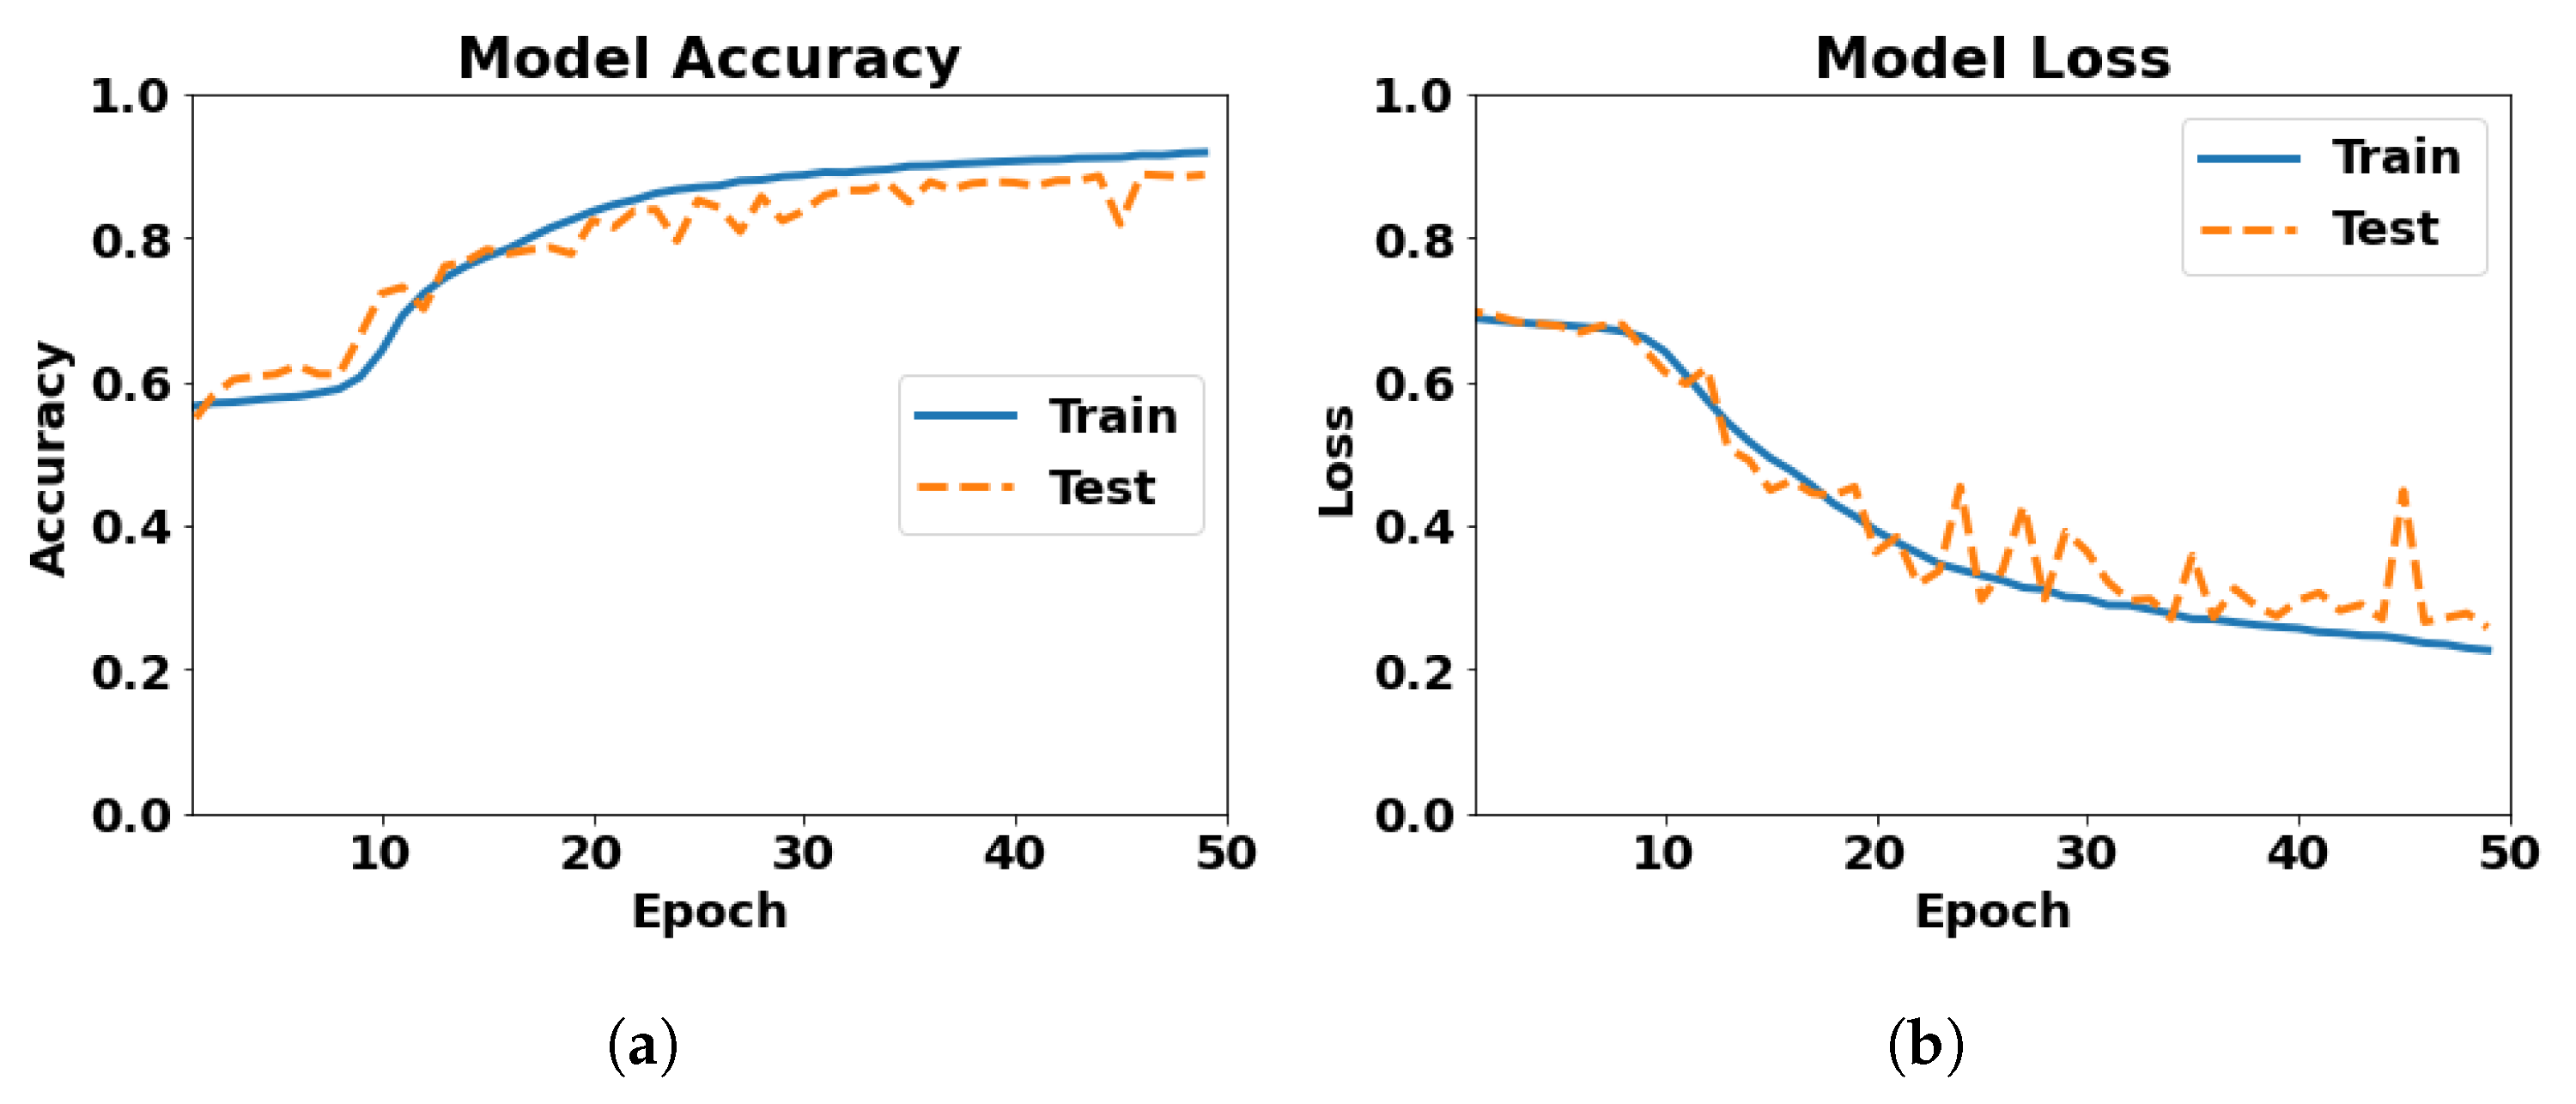
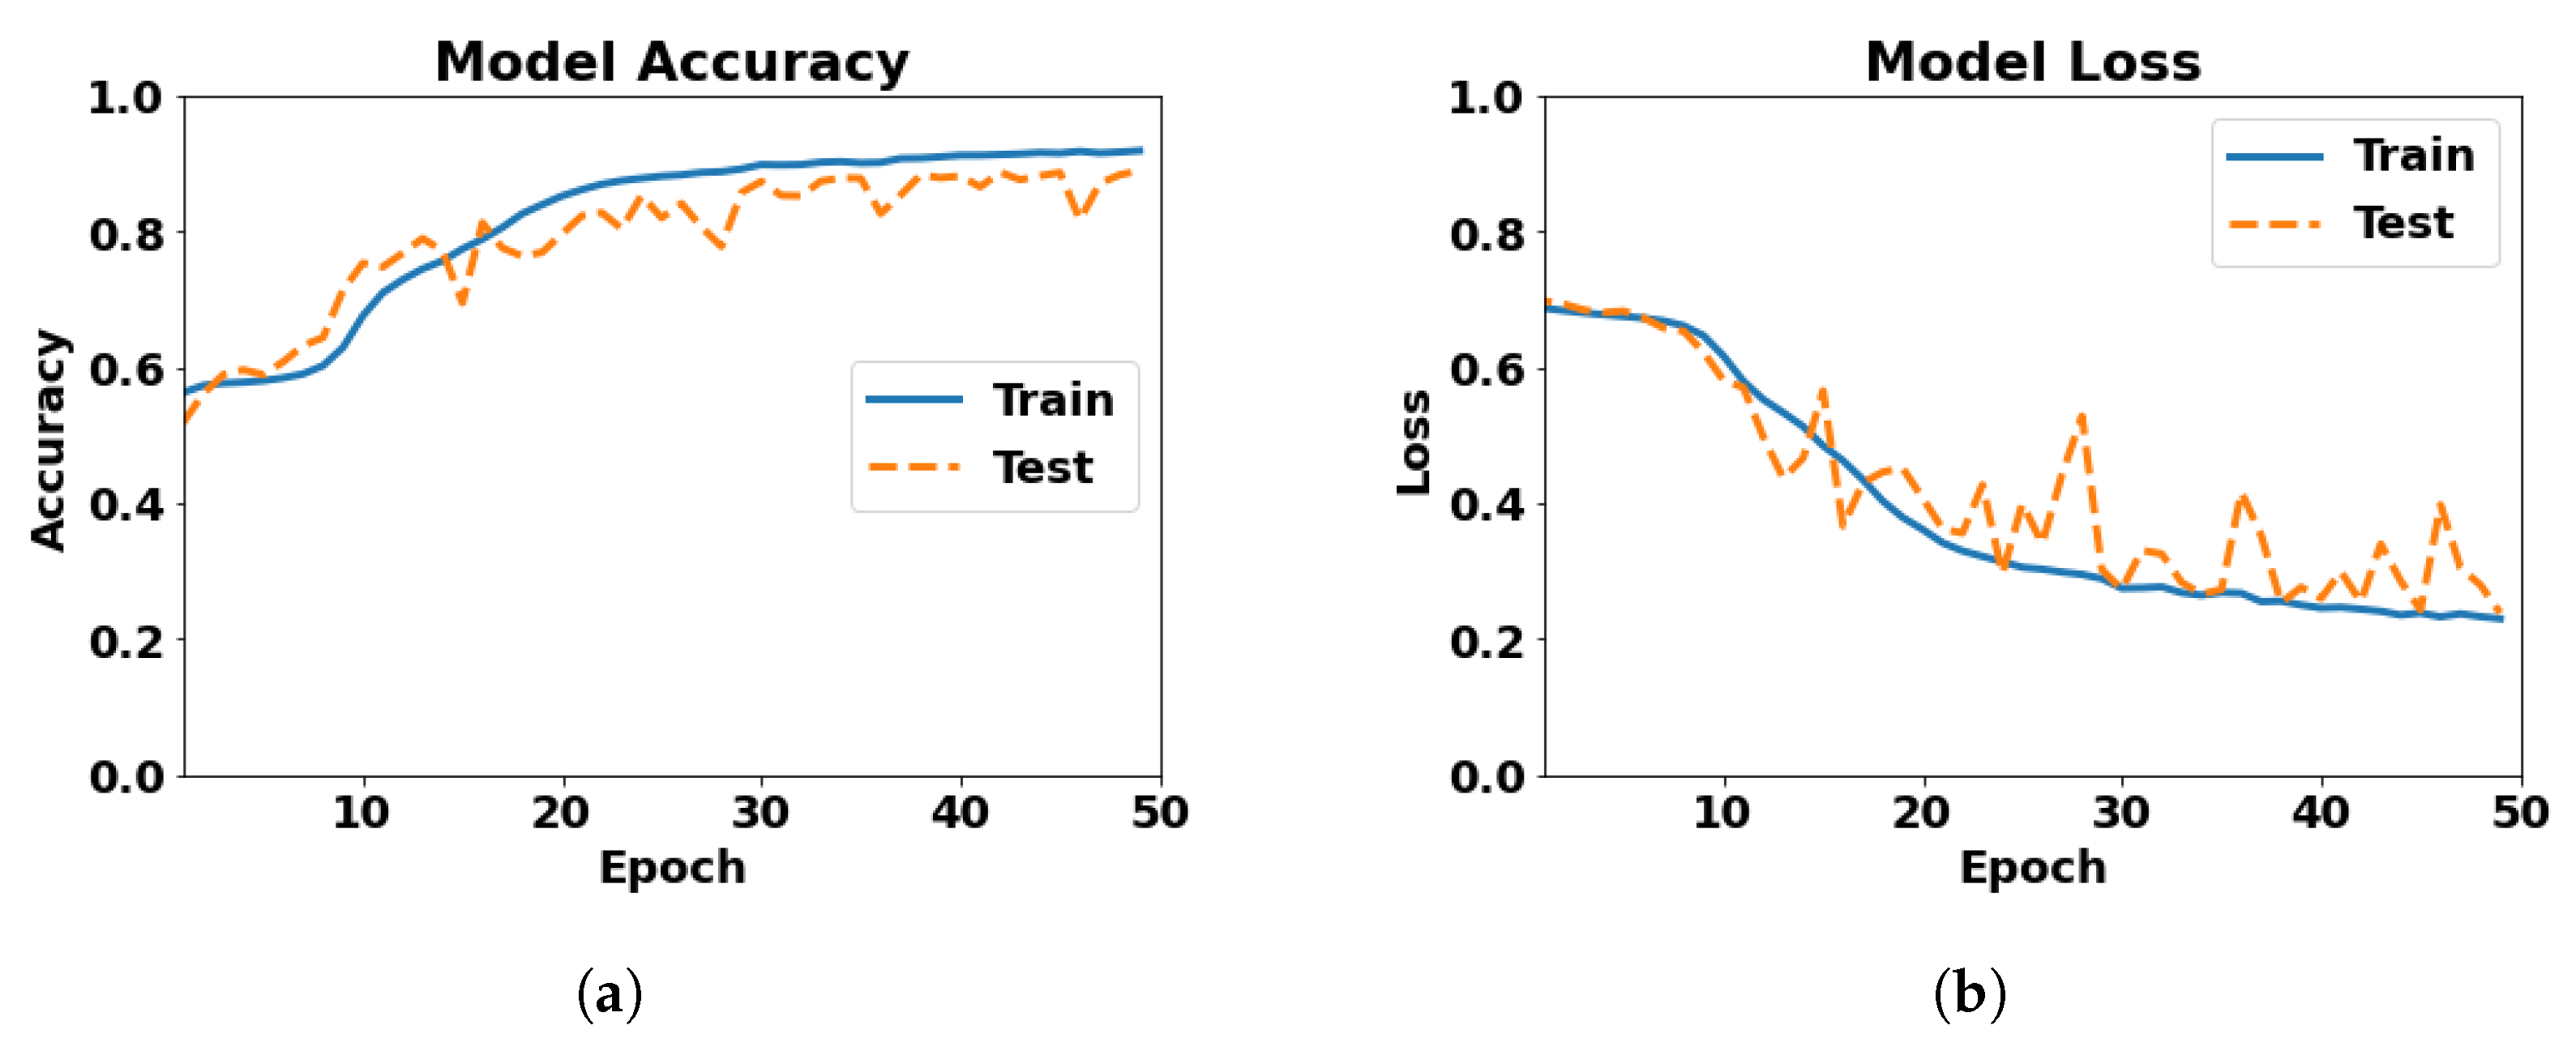
5.1. Character-Level CNN
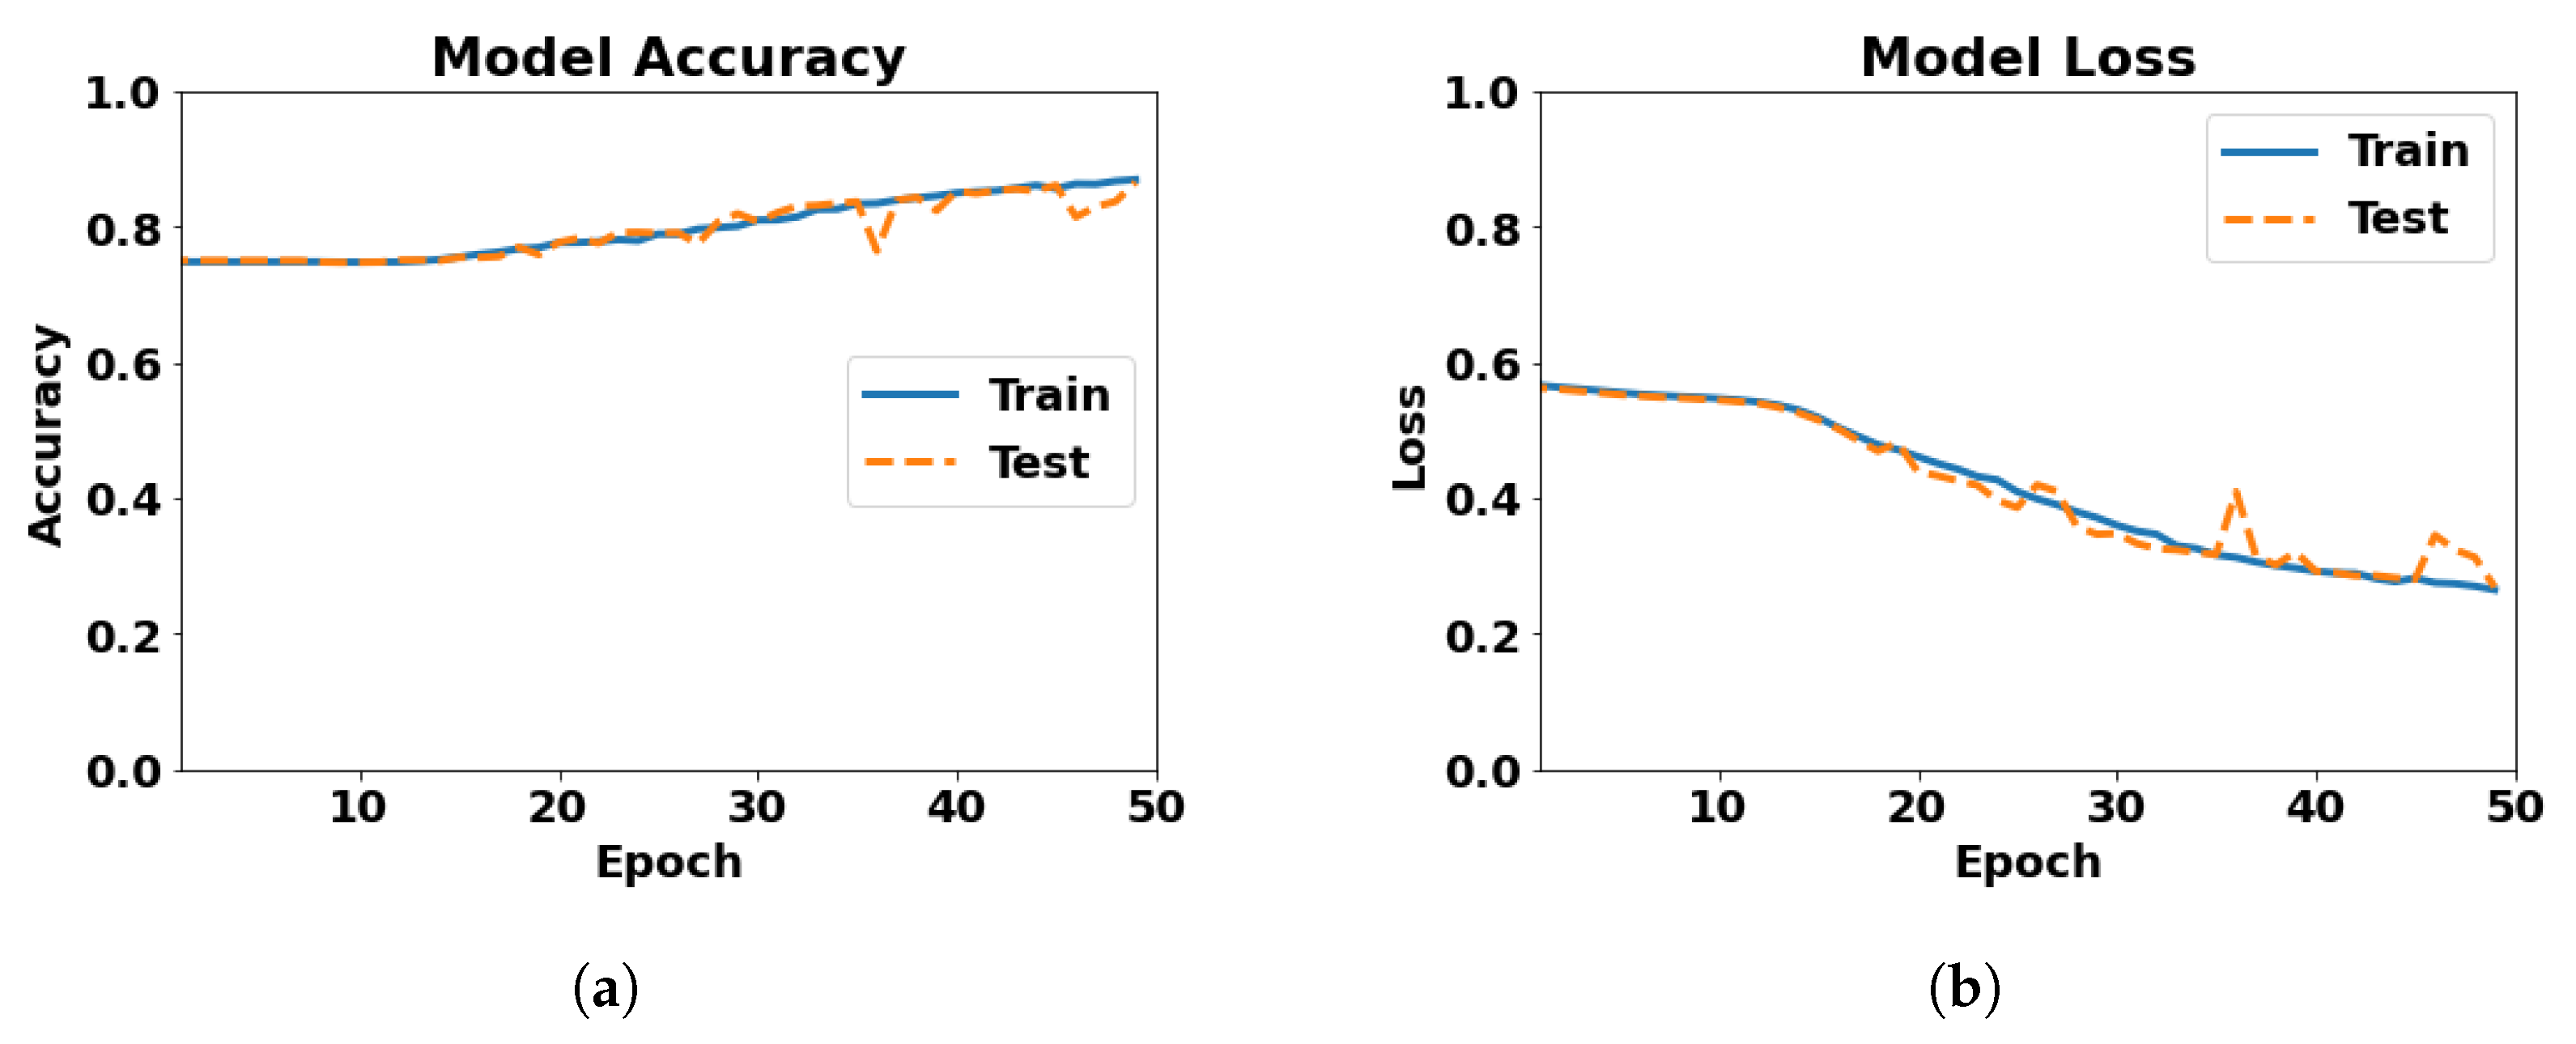
5.2. Character-Level CNN-LSTM
6. Conclusions
Author Contributions
Funding
Institutional Review Board Statement
Informed Consent Statement
Data Availability Statement
Acknowledgments
Conflicts of Interest
Abbreviations
| CNN | Convolutional Neural Network |
| LSTM | Long Short-Term Memory |
| BiLSTM | Bi-Directional LSTM |
| RF | Random Forest |
| SVM | Support Vector Machine |
| LSVM | Linear SVM |
References
- The Equilibrium Decodes the Impact of Social Media Addiction in 2022 and Its Coping Mechanism. The Equilibrium, 8 March 2022.
- Nockleby, J.T. Encyclopedia of the American Constitution. In Hate Speech; Levy, L., Karst, K., Eds.; Macmillan: Detriot, MI, USA, 2000; Volume 3, pp. 1277–1279. [Google Scholar]
- Hatzipanagos, R. Perspective|How Online Hate Turns into Real-Life Violence. Washington Post, 30 November 2018. [Google Scholar]
- Kakkar, S. Supreme Court to Hear on November 22 Plea Seeking Direction to Centre to Take Steps to Deal with Hate Speech. Live Law, 12 November 2021. [Google Scholar]
- Thomasson, E. German Cabinet Agrees to Fine Social Media over Hate Speech. Reuters, 5 April 2017. [Google Scholar]
- McClure, T. New Zealand Moves to Toughen Hate Speech Laws in Wake of Christchurch Attacks. The Guardian, 25 June 2021. [Google Scholar]
- Elouali, A.; Elberrichi, Z.; Elouali, N. Hate Speech Detection on Multilingual Twitter Using Convolutional Neural Networks. Rev. D’Intelligence Artif. 2020, 34, 81–88. [Google Scholar] [CrossRef]
- Santosh, T.Y.S.S.; Aravind, K.V.S. Hate Speech Detection in Hindi-English Code-Mixed Social Media Text. In Proceedings of the ACM India Joint International Conference on Data Science and Management of Data, Kolkata, India, 3–5 January 2019. [Google Scholar]
- Srivastava, A. India: The Land Of Diverse Languages And Scripts. IITGN News, 29 June 2020. [Google Scholar]
- Kwok, I.; Wang, Y. Locate the Hate: Detecting Tweets against Blacks. Proc. Aaai Conf. Artif. Intell. 2013, 27, 1621–1622. [Google Scholar] [CrossRef]
- Park, J.H.; Fung, P. One-step and Two-step Classification for Abusive Language Detection on Twitter. In Proceedings of the First Workshop on Abusive Language Online, Vancouver, BC, Canada, 4 August 2017; pp. 41–45. [Google Scholar] [CrossRef]
- Bohra, A.; Vijay, D.; Singh, V.; Akhtar, S.S.; Shrivastava, M. A Dataset of Hindi-English Code-Mixed Social Media Text for Hate Speech Detection. In Proceedings of the Second Workshop on Computational Modeling of People’s Opinions, Personality, and Emotions in Social Media, New Orleans, LO, USA, 6 June 2018; pp. 36–41. [Google Scholar] [CrossRef]
- Singh, V.; Varshney, A.; Akhtar, S.S.; Vijay, D.; Shrivastava, M. Aggression Detection on Social Media Text Using Deep Neural Networks. In Proceedings of the 2nd Workshop on Abusive Language Online (ALW2), Brussels, Belgium, 31 October 2018; pp. 43–50. [Google Scholar] [CrossRef]
- Alkomah, F.; Ma, X. A Literature Review of Textual Hate Speech Detection Methods and Datasets. Information 2022, 13, 273. [Google Scholar] [CrossRef]
- Waseem, Z. Are You a Racist or Am I Seeing Things? Annotator Influence on Hate Speech Detection on Twitter. In Proceedings of the First Workshop on NLP and Computational Social Science, Austin, TX, USA, 5 November 2016; pp. 138–142. [Google Scholar] [CrossRef]
- Magu, R.; Joshi, K.; Luo, J. Detecting the Hate Code on Social Media. Proc. Int. Aaai Conf. Web Soc. Media 2017, 11, 608–611. [Google Scholar] [CrossRef]
- Gambäck, B.; Sikdar, U.K. Using Convolutional Neural Networks to Classify Hate-Speech. In Proceedings of the First Workshop on Abusive Language Online, Vancouver, BC, Canada, 4 August 2017; pp. 85–90. [Google Scholar] [CrossRef]
- Mehta, H.; Passi, K. Social Media Hate Speech Detection Using Explainable Artificial Intelligence (XAI). Algorithms 2022, 15, 291. [Google Scholar] [CrossRef]
- Agarwal, S.; Sonawane, A.; Chowdary, C.R. Accelerating automatic hate speech detection using parallelized ensemble learning models. Expert Syst. Appl. 2023, 230, 120564. [Google Scholar] [CrossRef]
- Waseem, Z.; Hovy, D. Hateful Symbols or Hateful People? Predictive Features for Hate Speech Detection on Twitter. In Proceedings of the NAACL Student Research Workshop, San Diego, CA, USA, 13–15 June 2016; pp. 88–93. [Google Scholar] [CrossRef]
- Mathur, P.; Sawhney, R.; Ayyar, M.; Shah, R. Did you offend me? Classification of Offensive Tweets in Hinglish Language. In Proceedings of the 2nd Workshop on Abusive Language Online (ALW2), Brussels, Belgium, 31 October–1 November 2018; pp. 138–148. [Google Scholar] [CrossRef]
- Souza, G.; Da Costa-Abreu, M. Automatic offensive language detection from Twitter data using machine learning and feature selection of metadata. In Proceedings of the 2020 International Joint Conference on Neural Networks (IJCNN), Glasgow, UK, 19–24 July 2020; pp. 1–6. [Google Scholar] [CrossRef]
- Davidson, T.; Warmsley, D.; Macy, M.; Weber, I. Automated Hate Speech Detection and the Problem of Offensive Language. Proc. Int. Aaai Conf. Web Soc. Media 2017, 11, 512–515. [Google Scholar] [CrossRef]
- Watanabe, H.; Bouazizi, M.; Ohtsuki, T. Hate Speech on Twitter: A Pragmatic Approach to Collect Hateful and Offensive Expressions and Perform Hate Speech Detection. IEEE Access 2018, 6, 13825–13835. [Google Scholar] [CrossRef]
- Geet d’Sa, A.; Illina, I.; Fohr, D. Classification of Hate Speech Using Deep Neural Networks. Rev. D’Information Sci. Tech. 2020, 25, 1. Available online: https://hal.science/hal-03101938/file/SIIE_chap.pdf (accessed on 5 October 2023).
- Zampieri, M.; Malmasi, S.; Nakov, P.; Rosenthal, S.; Farra, N.; Kumar, R. Predicting the Type and Target of Offensive Posts in Social Media. In Proceedings of the 2019 Conference of the North American Chapter of the Association for Computational Linguistics: Human Language Technologies, Volume 1 (Long and Short Papers), Minneapolis, MN, USA, 2–7 June 2019; pp. 1415–1420. [Google Scholar] [CrossRef]
- Kumari, K.; Singh, J.P.; Dwivedi, Y.K.; Rana, N.P. Multi-modal aggression identification using Convolutional Neural Network and Binary Particle Swarm Optimization. Future Gener. Comput. Syst. 2021, 118, 187–197. [Google Scholar] [CrossRef]
- Kumari, K.; Singh, J.P. Multi-Modal Cyber-Aggression Detection with Feature Optimization by Firefly Algorithm. Multimed. Syst. 2022, 28, 1951–1962. [Google Scholar] [CrossRef]
- Kamble, S.; Joshi, A. Hate Speech Detection from Code-mixed Hindi-English Tweets Using Deep Learning Models. arXiv 2018, arXiv:cs.CL/1811.05145. [Google Scholar]
- Sreelakshmi, K.; Premjith, B.; Soman, K. Detection of Hate Speech Text in Hindi-English Code-mixed Data. Procedia Comput. Sci. 2020, 171, 737–744. [Google Scholar] [CrossRef]
- Shekhar, S.; Garg, H.; Agrawal, R.; Shivani, S.; Sharma, B. Hatred and trolling detection transliteration framework using hierarchical LSTM in code-mixed social media text. Complex Intell. Syst. 2023, 9, 2813–2826. [Google Scholar] [CrossRef]
- Kumar, R.; Reganti, A.N.; Bhatia, A.; Maheshwari, T. Aggression-annotated Corpus of Hindi-English Code-mixed Data. In Proceedings of the Eleventh International Conference on Language Resources and Evaluation (LREC 2018), Miyazaki, Japan, 7–12 May 2018. [Google Scholar]
- Kumari, K.; Singh, J.P.; Dwivedi, Y.K.; Rana, N.P. Bilingual Cyber-Aggression Detection on Social Media Using LSTM Autoencoder. Soft Comput. 2021, 25, 8999–9012. [Google Scholar] [CrossRef]
- Batista, G.E.A.P.A.; Prati, R.C.; Monard, M.C. A Study of the Behavior of Several Methods for Balancing Machine Learning Training Data. SIGKDD Explor. Newsl. 2004, 6, 20–29. [Google Scholar] [CrossRef]
- Branco, P.; Torgo, L.; Ribeiro, R. A Survey of Predictive Modelling under Imbalanced Distributions. arXiv 2015, arXiv:cs.LG/1505.01658. [Google Scholar]
- Fernández, A.; García, S.; Galar, M.; Prati, R.C.; Krawczyk, B.; Herrera, F. Learning from Imbalanced Data Sets; Cambridge International Law Journal; Springer: Berlin/Heidelberg, Germany, 2018. [Google Scholar]
- Zhang, X.; Zhao, J.; LeCun, Y. Character-level Convolutional Networks for Text Classification. In Proceedings of the Advances in Neural Information Processing Systems, Montreal, QC, Canada, 7–12 December 2015; Cortes, C., Lawrence, N., Lee, D., Sugiyama, M., Garnett, R., Eds.; Curran Associates, Inc.: Red Hook, NY, USA, 2015; Volume 28. [Google Scholar]
- Zhang, Z.; Robinson, D.; Tepper, J. Hate Speech Detection Using a Convolution-LSTM Based Deep Neural Network. In Proceedings of the 2018 International World Wide Web Conference, Lyon, France, 23–27 April 2018; p. 10. [Google Scholar]
- Alayba, A.M.; Palade, V.; England, M.; Iqbal, R. A Combined CNN and LSTM Model for Arabic Sentiment Analysis. In Proceedings of the Machine Learning and Knowledge Extraction, Hamburg, Germany, 27–30 August 2018; Holzinger, A., Kieseberg, P., Tjoa, A.M., Weippl, E., Eds.; Springer: Cham, Switzerland, 2018; pp. 179–191. [Google Scholar]


| Study By | Model Used | English | Hindi–English | Multilingual |
|---|---|---|---|---|
| Kwok and Wang [10] | Naïve Bayes | ✓ | ||
| Waseem and Hovy [20] | Logistic regression | ✓ | ||
| Magu et al. [16] | SVM | ✓ | ||
| Davidson et al. [23] | Logistic regression | ✓ | ||
| Watanabe et al. [24] | Decision Tree | ✓ | ||
| Zampieri et al. [26] | SVM, BiLSTM, CNN | ✓ | ||
| De Souza and Da Costa-Abreu [22] | Linear SVM, naïve Bayes | ✓ | ||
| Bohra et al. [12] | SVM, random forest | ✓ | ||
| Kamble and Joshi [29] | SVM, random forest, LSTM, BiLSTM | ✓ | ||
| Singh et al. [13] | Naïve Bayes, decision tree, SVM, multilayer perceptron, LSTM, CNN | ✓ | ||
| Santosh and Aravind [8] | SVM, random forest, LSTM | ✓ | ||
| Kumari et al. [33] | LSTM | ✓ | ||
| Elouali et al. [7] | CNN | ✓ | ✓ | ✓ |
| Our proposed work | CNN, LSTM | ✓ | ✓ | ✓ |
| Language | Class | Number of Tweets |
|---|---|---|
| English | Hate | 20,620 |
| Non-hate | 4163 | |
| Hindi–English | Hate | 4039 |
| Non-hate | 3729 | |
| Total | 32,551 | |
| Exp No. | Model | Test Accuracy | Test Loss | No. of Epochs | Runtime | Best Accuracy | Worst Loss |
|---|---|---|---|---|---|---|---|
| 1 | 3 conv. layers of 100 filters, 2 dense layers of 1024 neurons, dropout 0.5 | 0.8558 | 0.2846 | 50 | 18 min 4 s | 0.8558 at 50th epoch | 0.2846 at 50th epoch |
| 2 | 3 conv. layers of 100 filters, 2 dense layers of 1024 neurons, dropout 0.2 | 0.8422 | 0.3076 | 50 | 21 min 54 s | 0.8527 at 48th epoch | 0.2853 at 48th epoch |
| 3 | 3 conv. layers of 100 filters, 2 dense layers of 1024 neurons, dropout 0.4 | 0.8551 | 0.2970 | 50 | 19 min 23 s | 0.8603 at 49th epoch | 0.2795 at 49th epoch |
| 4 | 3 conv. layers of 256 filters, 2 dense layers of 1024 neurons, dropout 0.2 | 0.8498 | 0.2970 | 50 | 53 min 28 s | 0.8628 at 48th epoch | 0.2780 at 48th epoch |
| 5 | 3 conv. layers of 256 filters, 2 dense layers of 1024 neurons, dropout 0.5 | 0.8568 | 0.2833 | 50 | 64 min 29 s | 0.8593 at 48th epoch | 0.2804 at 48th epoch |
| 6 | 3 conv. layers of 100 filters, 2 dense layers of 512 neurons, dropout 0.2 | 0.8636 | 0.2816 | 50 | 17 min 2 s | 0.8636 at 50th epoch | 0.2816 at 50th epoch |
| 7 | 3 conv. layers of 100 filters, 2 dense layers of 512 neurons, dropout 0.5 | 0.8552 | 0.2967 | 50 | 16 min 30 s | 0.8554 at 49th epoch | 0.2866 at 49th epoch |
| 8 | 3 conv. layers of 256 filters, 2 dense layers of 512 neurons, dropout 0.2 | 0.8536 | 0.2926 | 50 | 47 min 16 s | 0.8627 at 50th epoch | 0.2777 at 50th epoch |
| 9 | 3 conv. layers of 256 filters, 2 dense layers of 512 neurons, dropout 0.5 | 0.8652 | 0.2723 | 50 | 48 min 51 s | 0.8652 at 50th epoch | 0.2723 at 50th epoch |
| Model | Test Accuracy | Test Loss | No. of Epochs | Runtime | Best Accuracy | Worst Loss |
|---|---|---|---|---|---|---|
| 3 conv. layers of 256 filters, 2 dense layers of 512 neurons, dropout 0.5 | 0.8878 | 0.2582 | 50 | 78 min 57 s | 0.8884 at 47th epoch | 0.2661 at 47th epoch |
| Exp No. | Model | Test Accuracy | Test Loss | No. of Epochs | Runtime | Best Accuracy | Worst Loss |
|---|---|---|---|---|---|---|---|
| 1 | 3 conv. layers of 100 filters, 1 LSTM layer of 60 neurons and dropout 0.5 | 0.8520 | 0.2963 | 50 | 24 min 40 s | 0.8584 at 49th epoch | 0.2808 at 49th epoch |
| 2 | 3 conv. layers of 100 filters, 1 LSTM layer of 60 neurons and dropout 0.2 | 0.8369 | 0.3049 | 50 | 26 min 44 s | 0.8608 at 49th epoch | 0.2800 at 49th epoch |
| 3 | 3 conv. layers of 100 filters, 1 LSTM layer of 60 neurons and dropout 0.4 | 0.8562 | 0.2808 | 50 | 20 min 51 s | 0.8593 at 49th epoch | 0.2885 at 49th epoch |
| 4 | 3 conv. layers of 256 filters, 1 LSTM layer of 60 neurons and dropout 0.2 | 0.8644 | 0.2705 | 50 | 54 min 18 s | 0.8644 at 50th epoch | 0.2705 at 50th epoch |
| 5 | 3 conv. layers of 256 filters, 1 LSTM layer of 60 neurons and dropout 0.5 | 0.8582 | 0.2952 | 50 | 60 min 52 s | 0.8582 at 50th epoch | 0.2952 at 50th epoch |
| 6 | 3 conv. layers of 100 filters, 1 LSTM layer of 100 neurons and dropout 0.2 | 0.8493 | 0.3091 | 50 | 26 min 11 s | 0.8500 at 47th epoch | 0.3002 at 47th epoch |
| 7 | 3 conv. layers of 100 filters, 1 LSTM layer of 100 neurons and dropout 0.5 | 0.8616 | 0.2781 | 50 | 25 min 17 s | 0.8616 at 50th epoch | 0.2781 at 50th epoch |
| 8 | 3 conv. layers of 256 filters, 1 LSTM layer of 100 neurons and dropout 0.5 | 0.8587 | 0.2948 | 50 | 60 min 24 s | 0.8587 at 50th epoch | 0.2948 at 50th epoch |
| 9 | 3 conv. layers of 256 filters, 1 LSTM layer of 100 neurons and dropout 0.2 | 0.8657 | 0.2688 | 50 | 60 min 8 s | 0.8657 at 50th epoch | 0.2688 at 50th epoch |
| Model | Test Accuracy | Test Loss | No. of Epochs | Runtime | Best Accuracy | Worst Loss |
|---|---|---|---|---|---|---|
| 3 conv. layers of 256 filters, 1 LSTM layer of 100 neurons and dropout 0.2 | 0.8897 | 0.2385 | 50 | 88 min 15 s | 0.8897 at 50th epoch | 0.2385 at 50th epoch |
| Model No. | Model | No. of Epochs | Runtime | Accuracy | Loss |
|---|---|---|---|---|---|
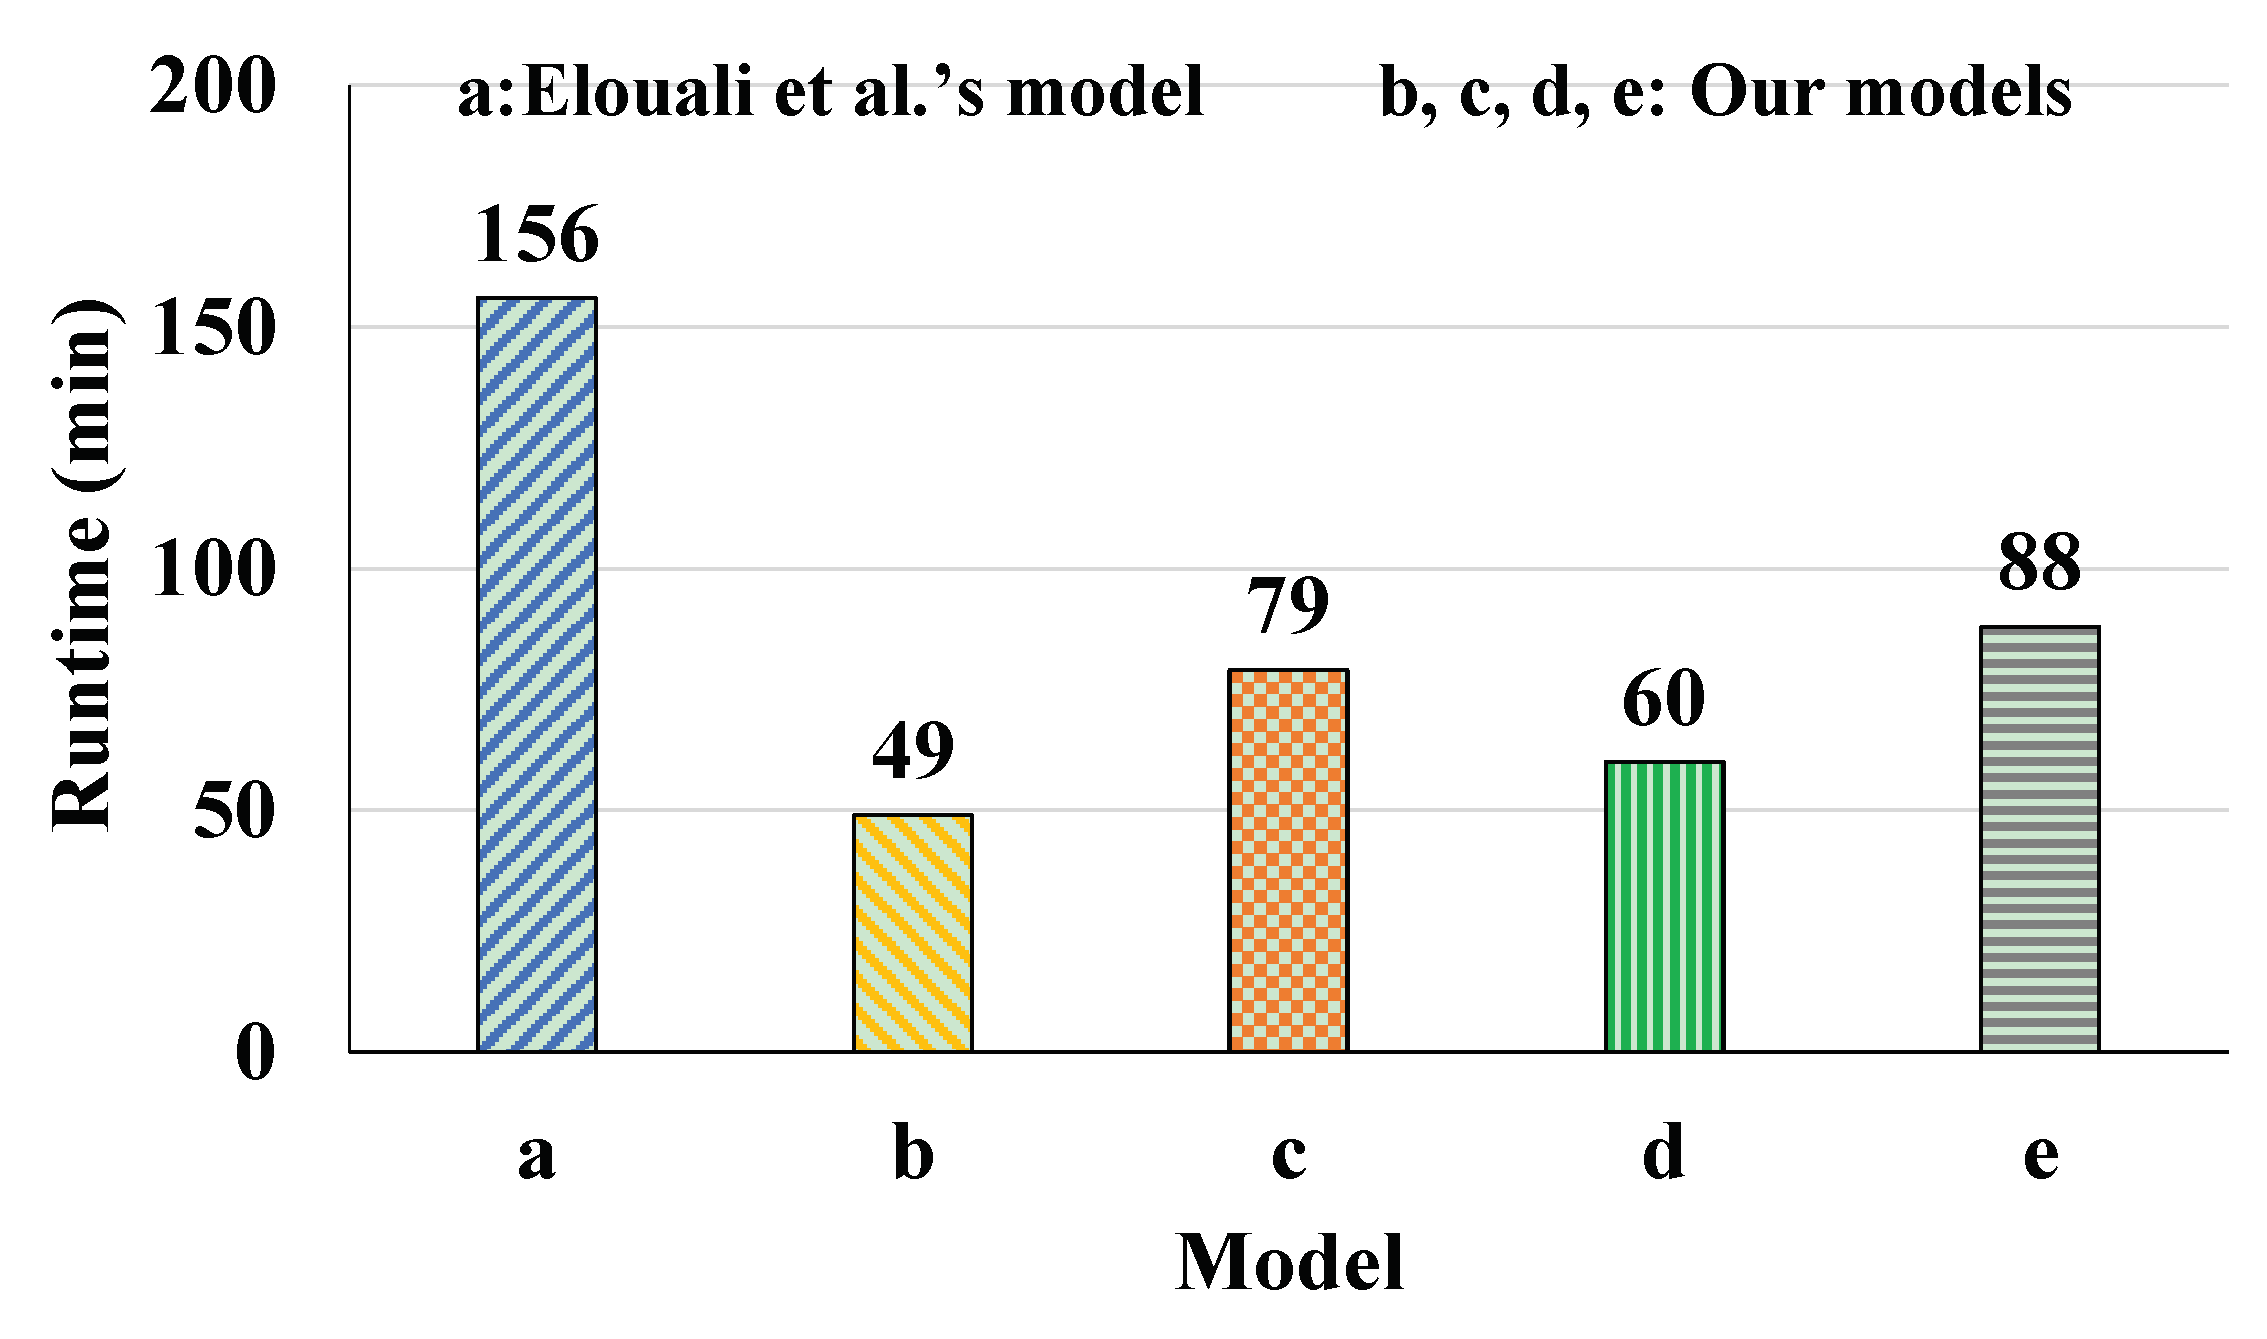
| a | Character-level CNN using imbalanced training dataset (Elouali et al.’s [7] method) | 50 | 156 min 18 s | 0.8661 | 0.2704 |
| b | Character-level CNN using imbalanced training dataset (our work) | 50 | 48 min 51 s | 0.8652 | 0.2723 |
| c | Character-level CNN using over-sampled training dataset (our work) | 50 | 78 min 57 s | 0.8884 | 0.2661 |
| d | Character-level CNN-LSTM using imbalanced training dataset (our work) | 50 | 60 min 8 s | 0.8657 | 0.2688 |
| e | Character-level CNN-LSTM using over-sampled training dataset (our work) | 50 | 88 min 15 s | 0.8897 | 0.2385 |
Disclaimer/Publisher’s Note: The statements, opinions and data contained in all publications are solely those of the individual author(s) and contributor(s) and not of MDPI and/or the editor(s). MDPI and/or the editor(s) disclaim responsibility for any injury to people or property resulting from any ideas, methods, instructions or products referred to in the content. |
© 2023 by the authors. Licensee MDPI, Basel, Switzerland. This article is an open access article distributed under the terms and conditions of the Creative Commons Attribution (CC BY) license (https://creativecommons.org/licenses/by/4.0/).
Share and Cite
Al-Hussaeni, K.; Sameer, M.; Karamitsos, I. The Impact of Data Pre-Processing on Hate Speech Detection in a Mix of English and Hindi–English (Code-Mixed) Tweets. Appl. Sci. 2023, 13, 11104. https://doi.org/10.3390/app131911104
Al-Hussaeni K, Sameer M, Karamitsos I. The Impact of Data Pre-Processing on Hate Speech Detection in a Mix of English and Hindi–English (Code-Mixed) Tweets. Applied Sciences. 2023; 13(19):11104. https://doi.org/10.3390/app131911104
Chicago/Turabian StyleAl-Hussaeni, Khalil, Mohamed Sameer, and Ioannis Karamitsos. 2023. "The Impact of Data Pre-Processing on Hate Speech Detection in a Mix of English and Hindi–English (Code-Mixed) Tweets" Applied Sciences 13, no. 19: 11104. https://doi.org/10.3390/app131911104
APA StyleAl-Hussaeni, K., Sameer, M., & Karamitsos, I. (2023). The Impact of Data Pre-Processing on Hate Speech Detection in a Mix of English and Hindi–English (Code-Mixed) Tweets. Applied Sciences, 13(19), 11104. https://doi.org/10.3390/app131911104