Article

Investigation of Roller Press Surface and Stud Based on FEM Simulation

1
School of Mechanical Engineering, Qilu University of Technology (Shandong Academy of Sciences), Jinan 250300, China
2
Shandong Institute of Mechanical Design and Research, Jinan 250300, China
*
Author to whom correspondence should be addressed.
Appl. Sci. 2023, 13(19), 11032; https://doi.org/10.3390/app131911032
Submission received: 12 September 2023 / Revised: 1 October 2023 / Accepted: 5 October 2023 / Published: 7 October 2023

Abstract

:
As an emerging grinding equipment, roller presses are widely used in Cement industry. The current problem with roller press is that the rolls surface is prone to wear and needs to be replaced regularly. This greatly reduces the service life of the roller press and affects the development of the roller press. Therefore, how to reduce the wear on the surface of the roller press and increase the service life of the roller press is an urgent problem that needs to be solved for the current roller press. Current research mainly focuses on the mechanism research of roller press wear and the optimization of rolls surface structure. In this paper, the extrusion force between the stud-lining and the material is calculated by analyzing the stress of the studded rolls under actual working conditions and the compression and rebound characteristics of material layer. The failure modes of studded rolls are mainly divided into two parts. On the one hand, it is fatigue cracking of the roller shaft and stud-lining. On the other hand, it is cracking at the contact between the stud-lining and the stud, and the fracture of the stud. Because the failure modes of the studded rolls are divided into two parts, the studded rolls are divided into two parts for simulation by using ANSYS 18.0. Firstly, the static analysis is carried out on the roller shaft and the stud-lining, and the distribution cloud diagram of the stress and contact pressure of the roller shaft and the stud-lining is obtained, and the stress concentration area is optimized. After optimization, the contact pressure between the roller shaft and the stud-lining is reduced by about 50%. The maximum equivalent stress of the roller shaft and stud-lining has also been reduced. Secondly, a static analysis was conducted on the stud-lining and studs. Since the stud-lining of the studded rolls are composed of stud holes arranged in a certain order. Therefore, stress concentration is prone to occur around the stud hole. The simulation experiment was carried out by changing the optimization schemes such as the assembly method of the stud and the stud-lining, the distance between the studs, and the length of the stud. To reduce the stress concentration of stud and stud-lining. After optimizing the model of the stud and stud-lining, the maximum equivalent stress of the stud-lining and stud decreased by about 10% and 25% respectively. Through the optimized design of roller shafts, stud-lining and studs. The service life of the studded rolls can be effectively improved and the production cost can be reduced. This can provide a reference for the design of the studded rolls.

1. Introduction

In recent years, the application of High-pressure grinding rolls (HPGR) has become one of the hotspots of technological innovation in many mining enterprises. The application of laminated crushing technology in the crushing industry started late, delaying the application of HPGR in the mining industry. Comminution processes, especially grinding, are highly energy-intensive and energy-inefficient. In the mining industry, comminution processes such as semi-autogenous grinding (SAG) and ball milling can be responsible for up to 60% of overall process plant energy consumption and have energy efficiency as low as 1% [1]. At the end of the 1970s, Schoenert [2] put forward a design concept of high-efficiency and energy-saving crushing equipment while deeply studying the principle of laminated crushing. Application of HPGR in very fine feed sizes represented the first successful use of the technology [3] as result of its introduction in the cement industry. Dundar [4] highlighted that the cement industry was important to consolidate the HPGR technology as an efficient alternative in fine grinding. With the continuous development of HPGR, the HPGR was quickly applied to the production of cement raw materials and metallurgical mines [5,6,7].
The working principle of the roller press, which is composed of a pair of extrusion rolls rotating synchronously in opposite directions. The roller press mainly consists of two rollers and drivers. One roller is the fixed roll and the other roller is the floating roll. The material with a certain particle size enters from the feed opening above the two rollers and is brought into the roller by continuous rotation of the extrusion roll. At this time, it is subject to the direct pressure caused by the contact with the rolls surface, and the pressure caused by the gravity of the material layer. When the two rollers rotate, they will also receive mutual extrusion force from the surrounding materials. Finally, the material becomes a dense cake and is discharged from under the roller press. Figure 1 is a schematic diagram of a studded rolls. The studded rolls are divided into three parts: the roller shaft, the stud-lining, and the stud. The surface of the stud-lining of the studded rolls are composed of several stud holes arranged in a certain pattern.
Roller press have been widely used in the cement industry due to their efficient grinding capabilities [8]. The current problem with roller press is that the rolls surface is prone to wear and needs to be replaced regularly. This greatly reduces the service life of the roller press and affects the development of the roller press. Therefore, how to reduce the wear on the surface of the roller press and increase the service life of the roller press is an urgent problem that needs to be solved for the current roller press. Current research mainly focuses on the mechanism research of roller press wear and the optimization of rolls surface structure. The ways to solve the surface wear of roller presses are mainly divided into the following aspects: On the one hand, it is to study the influence mechanism of materials on the rolls surface. Select the appropriate roller press surface material according to the material. Adjust the processing technology of the roller press according to the characteristics of the material. On the other hand, the surface structure of the roller press is optimized to reduce the wear of the rolls surface. The current studded rolls surface is a new structure that effectively reduces surface wear. However, there is currently little research on the studded rolls surface. The size of the studs, the assembly method of the studs, and the distance between the studs are mostly designed using empirical methods.
Research on the wear mechanism of roller presses mainly focuses on the wear of materials on the surface of roller presses. By studying the wear of the rolls surface, the grinding circuit of the roller press can be optimized. Analyze the impact of rolls surface wear on output and power to predict output and adjust the working gap of the roller press. Sesemann [9] built a laboratory-scale HPGR. To be able to install and inspect the whole rolls surface inside the scanning electron microscope (SEM) a special device has been designed. And through this special device to carry out microscopic analysis of the rolls surface. Then wear mechanism of the rolls surface during the operation of the roller press is analyzed. And analyzed the three conditions of grinding pressure, raw material particle size and raw material moisture on the surface wear of roller press. It can contribute to a better understanding of the complex wear system of HPGR and more accurate wear estimates for different minerals. Van Der Meer summarizes basic principles of the equipment and of various options how to include an HPGR in the grinding circuit for the most efficient use. And case studies [10] demonstrate the application of HPGR’s in different grinding circuit set-ups and for the comminution of different ore types. In order to study the impact of particle crushing on the working efficiency of the roller press, the coupled flow and crushing of particles can be predicted by discrete element method (DEM). And optimize the structural design of the roller press through the crushing model. And prediction of throughput through DEM simulation and the effect of roller press working gap and pressure between particles on the production process [11]. Rodriguez [12,13] through coupled DEM-MBD-PRM simulations of HPGR. Validation and calibration of a pilot-scale roller press and making predictions of HPGR operation under skewing possible. Chengwei developed a DEM-based particle fragmentation model [14] to simulate the dynamics of particles in HPGR. The crushing of cement particles under different conditions was compared to predict the performance of HPGR under various conditions. Zou [15] used DEM to simulate the wear of the roller press to study the impact of rolls surface wear on the output and power of the roller press. The load and wear of the rolls surface material are analyzed by DEM. The pressure distribution between the rolls in HPGR is generally expected to vary significantly in the axial direction due to end effects at the ends of the rolls. Prediction of coupled flow and breakage of particles within HPGR using DEM [16]. Antico [17] established a model of high pressure roller mill by establishing different mathematical methods and utilizing the crushing distribution function. A method for determining functional parameters was proposed, and the theoretical calculation values were compared with the actual materials processed by the roller press to verify the correctness of the model. At the same time, relevant research was conducted on the working gap of the roller press. The dependence of the production efficiency of the roller press on the feed top-size, porosity, moisture and specific pressure was investigated. Several researchers [18] investigate a model system describing the role of the gas flow in the feed powder during the rolling process through the analysis of gas pressure distributions. Alex [19] proposed an off-line observation framework. From the working gap, throughput, and operating variables (specific force and rolls speed), the model calculates the slip, shear stress, and pressure profiles which subsequently allow estimating the power draw and the specific force. Wang [20] presented a novel piston press test (PPT) procedure to predict the HPGR operational gap. A gap-calibrated methodology is proposed based on the PPT sample volume.
As for the rolls surface of the roller press, there are currently three commonly used rolls surface: smooth rolls, composite rolls and studded rolls. The select of the surface of the roller press is an important factor in increasing the service life of the roller press. The smooth rolls to weld the wear-resistant layer on the surface of the rolls surface, and increase the wear-resistant performance of the rolls surface by using different high-performance wear-resistant materials. However, the later maintenance of the smooth rolls is more difficult. The machine needs to be shut down during maintenance, which affects production efficiency. The composite rolls are mainly used to enhance the wear resistance of the rolls surface by using bimetallic and metal-based ceramic materials, but the wear of the composite rolls surface is also fast. At present, the service life of the composite rolls used by the enterprise is longer than that of the smooth rolls, but it is not obvious. The later maintenance of the composite rolls is the same as that of the smooth rolls. All need to be maintained during shutdown, affecting production.
The studded rolls mainly consist of three parts, the roller shaft, the stud-lining and the stud. Lim [21] discovering some benefits of using stud embedded surfaces in HPGR. Rashidi [22] actually processes cement materials by embedding cylindrical studs into the rolls surface. By processing the materials, it was found that studs can effectively protect the rolls surface of studded rolls. At the same time, the geometry of the studs and the arrangement of the studs will affect the service life of the studded rolls. After the studded rolls has been running for more than 10,000 h, no studs have fallen off. Moreover, replacement of studs does not require downtime, which improves production efficiency. The studded rolls are to drill holes on the surface in a certain arrangement on the rolls surface, and install the stud with good wear resistance on the rolls surface. Two main types of the stud-linings are applied in studded rolls: studded and hexagonal [9,23], which show varied characteristics of operation and have different lifetime of service. Cylindrical pins being composed of wear resistant cemented carbides, so-called studs, which are pressed or glued into holes drilled into a base material. Hexagonal tiles made of a wear resistant material get fixed to the rolls surface by the hot isostatic pressing (HIP) technology (HEXADURs). These two types of stud-linings are suitable for different processing occasions and increase the service life of the roller press. Oberheuser [24] studied the wear of rolls surface embedded with cylindrical studs. In the interstices between the studs an autogenous wear protection layer from compacted feed material builds up. This layer of fine material prevents the base material from further wear. Which will play a certain protective role on the rolls surface, thus greatly extending the service life of the rolls surface, and the later maintenance only needs to replace a small number of broken and fallen studs. It is easy to maintain without affecting continuous production. Through designed experiments, some scholars [25] installed fixed perforated metal strips on the roller of the studded rolls as the starting position for measuring the wear height of the studs. The wear patterns of studs on studded rolls were studied. When the HPGR operates without the formation of a protective layer, the wear rate of the rolls surface is more than the stud wear. In this case, stud projection and consequently stud breakage increase. Nagata [26] investigated the effect of the stud diameter on the capacity of a stud-type HPGR using the DEM with a breakage model. Through this method can contribute to the investigation of the effect of roll design in an efficient HPGR grinding. Results show that the working roll gap increased when a smaller stud was used.
Uttarwar [27] utilizes FEM simulation to predict where breakage will occur on the roll according to ASME code standards. Finite element simulation was performed on workbench to predict the fracture position of the roller shaft to determine safe working conditions. It provides theoretical support for the design of the roller shaft and extends the service life of the roller press. And through the FEM of the overall structure of the roller press, the structure of the roller press is optimized. Weihua [28] analyzed the stress of the extrusion roller under actual working conditions. Through ANSYS software, static analysis was performed on the roller shaft and stud-lining, and the contact pressure and stress of the roller shaft and stud-lining were analyzed. And using the direct optimization module in ANSYS Workbench, the roller shaft and stud-lining were optimized. The maximum equivalent stress and maximum deformation are reduced, which provides a reference for the design of the roller press.
At present, studded rolls technology still mainly uses the design concept of smooth rolls. Most of the assembly methods of studded rolls and studs adopt the empirical method. Because the stress on the roller press is relatively complex, there are few theoretical studies. There is less related research on the assembly methods between stud and stud-lining and the variation of circumferential and axial distance between studs. In order to improve the service life of the studded rolls, the structure of the studded rolls is analyzed. The main goal of this work is to simulate and optimize the structural design of studded rolls. Mainly divided into two parts. One part is to analyze the pressure distribution at different nip angles on the surface of the roller press through the compression and rebound characteristics of the material. The other part is to optimize the structure of the studded rolls. The contact pressure and equivalent stress of roller shaft and stud-lining are analyzed. And the influence of the assembly method of the stud and the stud-lining, the distance and length between the studs on the equivalent stress. The equivalent stress and contact pressure are reduced by optimizing the design. To achieve extended the service life of the studded rolls.

2. Mathematical Model of Roller Press

The development of roller press technology originates from the basic research of inter-particle crushing carried out by Schoenert [2]. Schoenert has carried out extensive research on single particle crushing under compression and impact load, and obtained that the maximum efficiency of particle crushing can be achieved through the slow compression load of single particle. Through design experiments, Schoenert observed that the energy efficiency of limited particle bed crushing is lower than that of single particle crushing. However, the grinding efficiency is much higher than that of drum grinder.

2.1. Compression and Rebound Characteristics of Material Layer

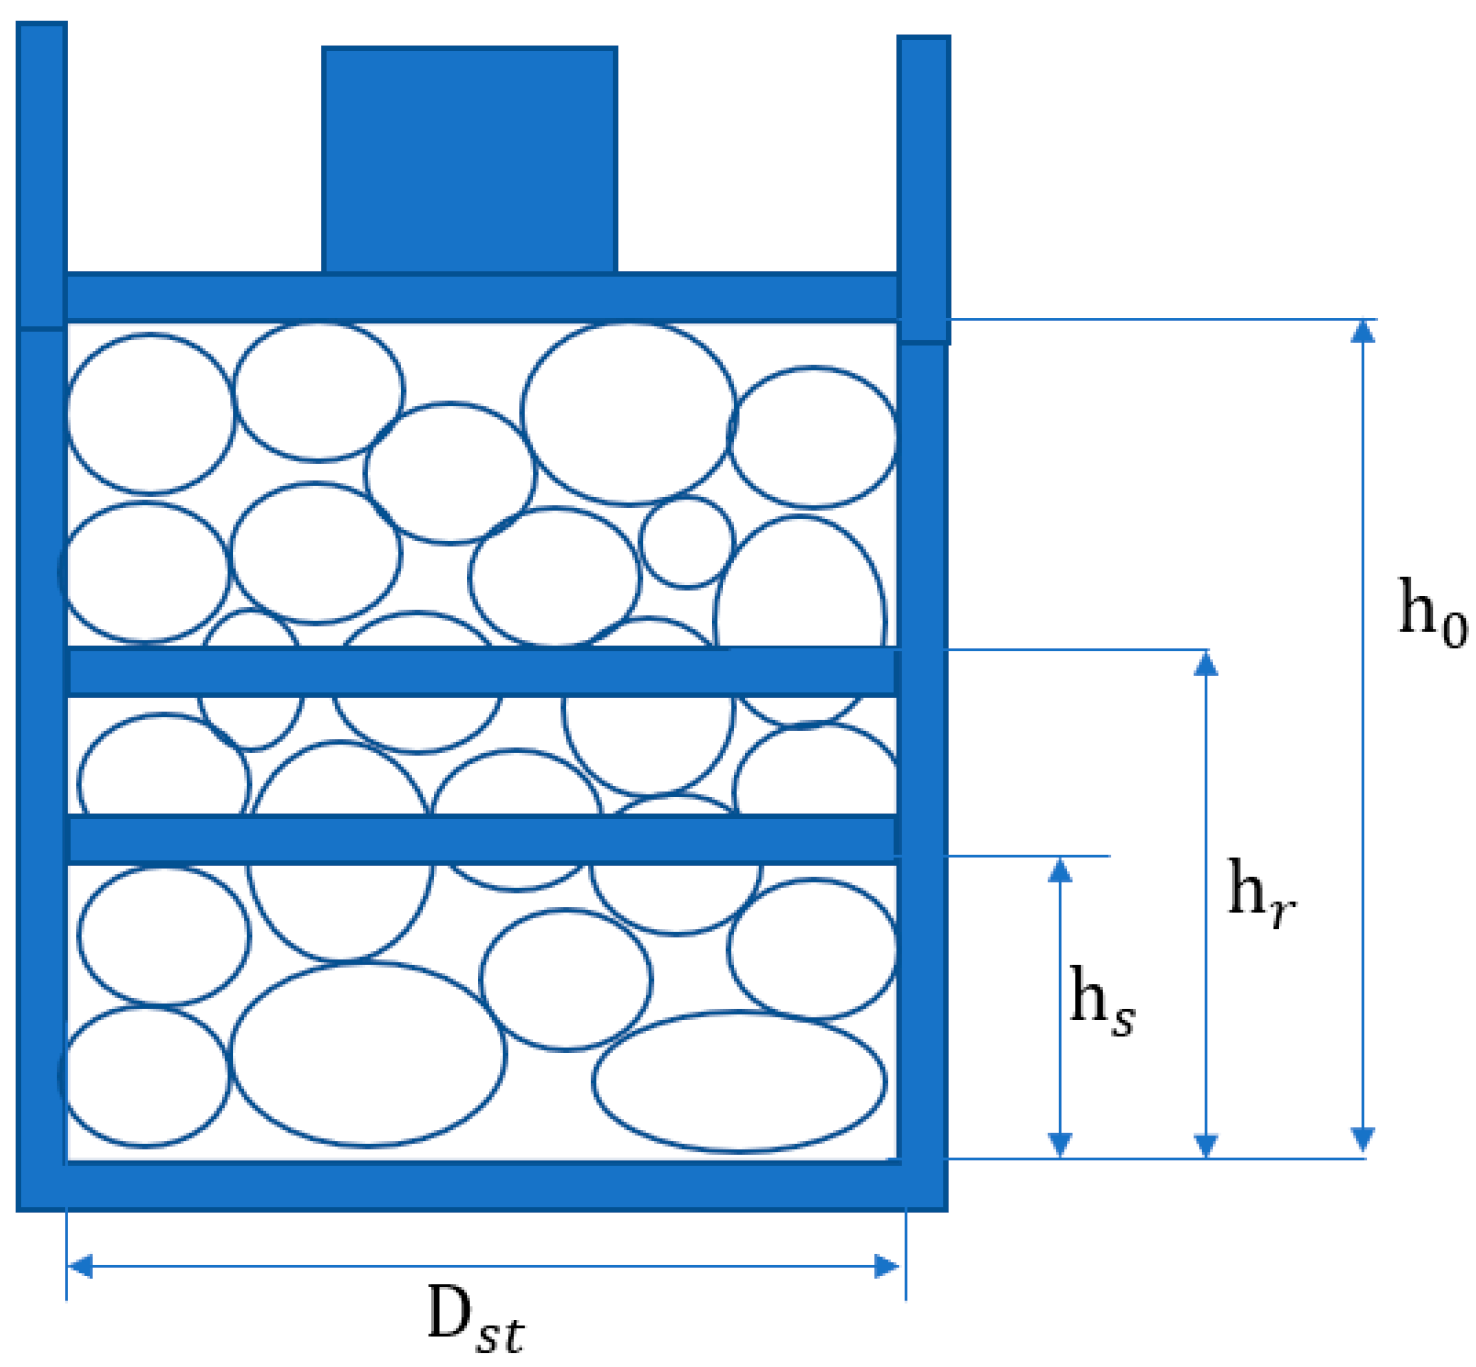
To predict the powder behavior between rolls, Johanson [29] introduced a continuous model. Which introduced the concept of the nip angle that defines two contiguous zones. Before the nip angle, the material granular is transported by relative sliding on the roll, and once the nip angle is achieved, the powder is assumed to be drawn by sticking to the rolls surface and to be densified by deforming under the high roll pressure. The compression and rebound characteristic of the material layer is the basis of studying the dynamics of the roller press. Many factors affect the compression and rebound characteristics of the material layer, such as the type, particle size and water content of the material. The compressibility and rebound characteristics of materials can be described by the relationship between the relative density of materials ( δ ) and the pressure ( p ) acting on them. Figure 2 is the schematic diagram of the device for measuring the material curve. The material sample is filled in a cylindrical container. The inner diameter of the container is D. The sample volume is continuously compressed by applying pressure to the material through the piston. At the same time, the piston moving distance and the pressure exerted by the piston are recorded. The experiment is carried out on the premise that the sample quality remains unchanged. The starting point of curve p - δ represents the loose state of the material. At this time, the relative density is δ 0 , the initial height of the sample is h 0 . It is assumed that the compression speed is very small, so that the effect of the speed on the pressure can be ignored. According to the experimental data of material compression, the formula describing the compression curve can be determined as follows:
  p p = p c ln ( 1 δ 0 1 δ ) 1 / n
where:   p p —The pressure acting on the material in the compression stage;
  • p c —Specific pressure of material;
  • δ 0 —Initial relative density, δ 0 = ρ 0 / ρ ;
  • ρ 0 —Initial density;
  • ρ —Density of any material layer;
  • n—Compression curve factor.
Figure 2. Schematic diagram of material curve measuring device.
Applsci 13 11032 g002
After compression, when the pressure on the material disappears, the compressed material will rebound. According to the experimental data, the rebound process of the material can be described by the following Equation (2).
p e = p c ln 1 δ 0 1 δ α 1 / n · δ δ r δ s δ r k
  • p e —The pressure acting on the material during the rebound stage;
  • δ s —Relative density at the end of the compression stage;
  • δ r —Relative density at the end of the rebound stage, δ r = k e · δ s ;
  • k e —Material rebound rate;
  • k—rebound factor.

2.2. Mathematical Model of Roller Press

Figure 3 shows the working diagram of the roller press. The material is loaded from the gap between the two rollers through the funnel and is in contact with the roller press on the horizontal plane A 1 A 2 . The gap width here is b, and the relative density of the material is δ 0 . At this point, the material starts to be driven by the surface friction of the roller press. The material is accelerated in the vertical direction, when the material reaches plane B 1 B 2 places, gap width is h 0 . Assume that the material speed here is equal to the speed of the rolls surface. The material starts to be compressed by the roller press until it reaches C 1 C 2 circumferential speed at point 2 passes C 1 C 2 plane, where the gap is s, and the relative density δ s reaches the maximum value. Here, the compressed material layer is rolled at C 1 C 2 Circumferential speed at point 2 passes C 1 C 2 plane, and then bounce in the horizontal direction. When the compressed material layer passes through the D 1 D 2 plane, the relative density becomes δ r , and the flakes leave the roller press and become products.
The whole process can be divided into three zones [2] according to the dynamic characteristics of materials in the roller press.
(a) Acceleration zone: A 1 A 2 - B 1 B 2 ; (b) Compression zone: B 1 B 2 - C 1 C 2 ; (c) Rebound zone: C 1 C 2 - D 1 D 2 ; In order to facilitate theoretical analysis, the following assumptions are made:
(1) The relative density of materials in the acceleration zone is constant δ 0 ;
(2) There is no relative sliding between the material and the surface of the roller press in the compression zone, and the material deformation only occurs in the horizontal direction;
(3) The end of the compression zone is at C 1 C 2 . The gap width here is the smallest;
(4) The p- δ characteristic of the material in the middle of the roller gap (Z = 0) is the same as that of the uniaxial compression. The surface pressure of the roller press in the Z direction can be described by the following equation.
p α , λ = p m α · 1 2 · λ m λ = Z L
where:
  • p m α —The surface pressure of the roller press corresponding to the nip angle ( α ) of the roller press;
  • Z—The distance from a point on the surface of the roller press to the middle of the roller press;
  • m—Pressure axial distribution coefficient, m  1.
(1)
Acceleration zone
The mass flow rate in any section from plane A 1 A 2 to plane B 1 B 2 in the acceleration zone is constant. In the acceleration zone, the mass flow rate in any section from the plane to the plane is constant, and the relative density of the material is also constant, set to δ 0 . The pressure on the surface of the roller press is mainly caused by the gravity of the material. compared with the pressure in the other two areas, the force on the roller press in this area is very small and can be ignored.
(2)
Compression area
In the compression zone, the vertical velocity of the material in each layer is equal to the surface velocity of the extrusion roll, and the mass of any horizontal layer should be equal.
δ α = s + D   ( 1 cos α ) = δ 0 · h 0 = δ s · s = c o n s t
In this area, the relative density of material corresponding to the nip angle α is δ α ,
δ α = δ s · s / s + D 1 cos α
Based on hypothesis 4 and material uniaxial compression and rebound equation, the horizontal specific pressure in the middle of the roller press is:
p m α = p c ln ( 1 δ 0 1 δ α ) 1 / n α 0 α 0
The horizontal specific pressure at any point ( α ,   λ ) on the surface of the roller press in the compression zone can be calculated by the following formula:
p α , λ = p c · ln ( 1 δ 0 1 δ α ) 1 / n 1 2 · λ m α 0 α 0
(3)
Rebound area
The mass of any horizontal layer in the rebound area should be equal. The relative density δ corresponding to any central angle α in this region is:
δ α = δ s · s / s + D 1 cos α
The relative density δ r of the material at the end of the rebound is:
δ r = k e · δ s
In the formula, k e is the rebound rate of the material.
According to hypothesis 4 and uniaxial rebound equation, the horizontal specific pressure in the middle region of the roller press is:
p m α = p c ln ( 1 δ 0 1 δ α ) 1 / n · δ α δ r δ s δ r k 0 α r
In the formula, r = cos 1 1 δ s δ r · s D .
The horizontal pressure on the surface of the roller press at any point in the rebound zone is:
p α , λ = p c · ln ( 1 δ 0 1 δ α ) 1 / n · δ α δ r δ s δ r k 1 2 · λ m 0 α r
Among them [28]:
p α , λ p c · ln ( 1 δ 0 1 δ α ) 1 / n 1 2 · λ m   α 0 α 0   p c · ln ( 1 δ 0 1 δ α ) 1 / n · δ α δ r δ s δ r k 1 2 · λ m   0 α r  
Due to the fact that the surface of the studded rolls is alternately arranged with a certain arrangement of studs, under normal working conditions of the roller press, the existence of studs reduces the horizontal pressure exerted by the material on the rolls surface of the roller press, but increases the horizontal pressure borne by the circular surface of the studs. As the upper surface of the studs also bears a part of the pressure, it is difficult to determine the load on the studs. Therefore, it is assumed that the horizontal pressure generated by the compression and rebound characteristics of the material is fully applied to the outer end face of the material in contact with the studs. By calculating the ratio € of the sum of all circular surfaces of the studs to the outer surface of the roller press.
= 1 0  
  • 1 —The sum of the upper surface areas of all studs;
  • 0 —Outer surface area of rolls surface;
After optimizing with Formula (12), we obtained
p 1 α , λ 1 + · p c · ln ( 1 δ 0 1 δ α ) 1 / n 1 2 · λ m   α 0 α 0   1 + · p c · ln ( 1 δ 0 1 δ α ) 1 / n · δ α δ r δ s δ r k 1 2 · λ m   0 α r
According to the model of the roller press, it can be known that the pressure on the surface of the roller press is the greatest where the gap between the two rollers is the smallest. Since the pressure on the surface of the roller press decreases with the change of the absolute value of λ , when λ = 0 , the pressure on the surface of the roller press is the largest. In order to make the surface stress change of the roller press more obvious, λ = 0 is taken here to calculate the horizontal pressure and the optimize horizontal pressure of the roller press under different nip angles. At the same time, according to the ratio of the stud area of the actual studded rolls to the rolls surface area = 0.36 . As shown in Table 1.
During the normal working process of the roller press, the force state on the rolls surface is complex. Due to the existence of the studded rolls, the force on the stud becomes more complicated. In order to simplify the analysis of the force on the rolls surface, the above mathematical model is established. Through the mathematical model established according to the compression and rebound characteristic of the material layer, the material pressure of the roller press at different nip angles is calculated. The pressure provided by the material layer with different nip angles calculated by the above mathematical model is imported into the finite element model and applied to the stud models with different nip angles respectively. And the pressures of different nip angles are respectively applied to the studded rolls with different nip angles. Through finite element analysis and calculate deformation and stress changes on stud and roll faces. And further optimize the design of the studded rolls.

3. FEM Simulation

There are many modeling methods for the roller press [30]. In this paper, the finite element method is used to simulate the roll press. The FEM simulation is a numerical method that discretizes the continuum to solve various mechanical problems. It is also an important branch of computational mechanics. For material processing, the finite element simulation is a powerful tool for design, analysis and optimization [31]. It can analyze the deformation law, temperature field distribution, whole-field stress, strain distribution and the impact of process parameters on product quality. It can optimize the process parameters to the maximum extent before the production of parts, speed up the production cycle and reduce the production cost.

3.1. Contact Analysis of Studded Rolls

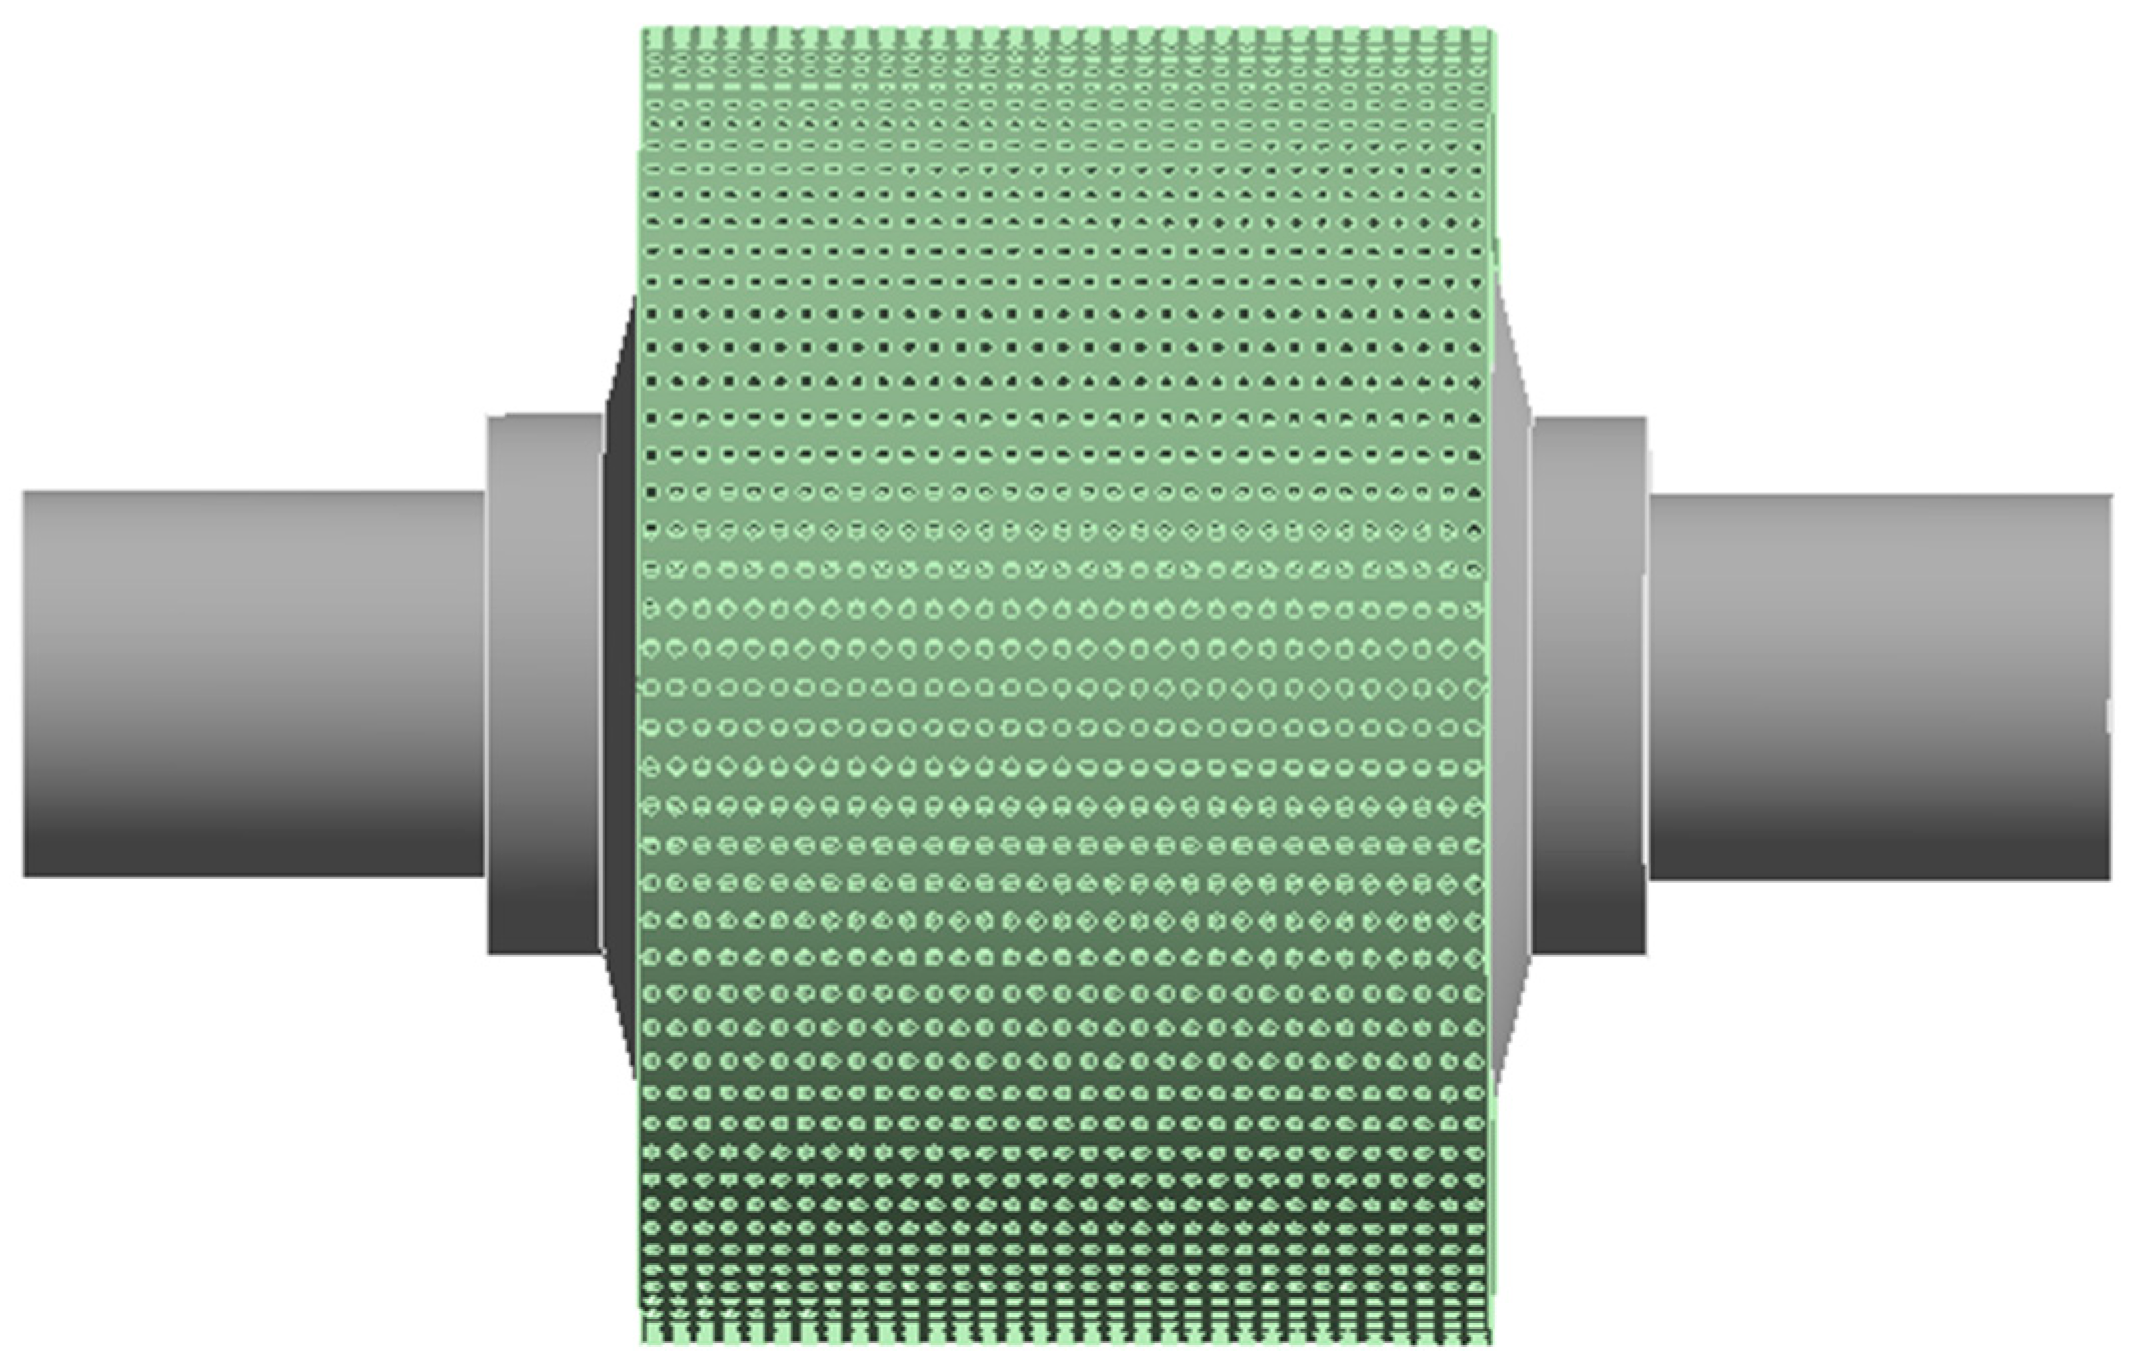
The studded rolls model is mainly simplified into three parts, the roller shaft, the stud-lining and the stud. In order to reduce the calculation time and improve the calculation efficiency, the chamfers and keyways of the roller shaft and the stud-lining are removed. Because there are too many studs in the studded rolls, the studs will affect the calculation process when recalculating. Therefore, the studded rolls are divided into two parts for simulation calculation. First, the simulation calculation is performed on the roller shaft and the stud-lining, as shown in Figure 4 below. Roller shaft and stud-lining simulation models. The other part is the simulation of studs and stud-lining.
Refer to the literature [28] and combine the material properties of the roller shaft and stud-lining on the studded rolls in the work, and set the material parameters of the roller shaft and the stud-lining according to the parameters in Table 2. By analyzing the stress distribution and contact pressure distribution of the roller shaft and the stud-lining, it is possible to predict where the studded rolls are most likely to fail, and provide theoretical data for later optimization. Because it is a simulation of the roller shaft and the stud-lining, the force model of the smooth rolls will be used. In order to make the stress situation more obvious, the pressure at the 0° position is used for simulation calculation.

Static Analysis of Studded Rolls

Through the contact pressure stress cloud diagram of the roller shaft and the stud-lining, it can be found that the contact pressure between the roller shaft and the stud-lining is mainly concentrated on both sides of the stud-lining, that is, the step where the stud-lining and the roller shaft contact. The contact pressure is greatest here. Using the formula below, calculate the maximum contact pressure p m a x between the stud-lining and the roller shaft [28].
p m a x = σ 1 1 ( d / D ) 2 3 + d / D 4
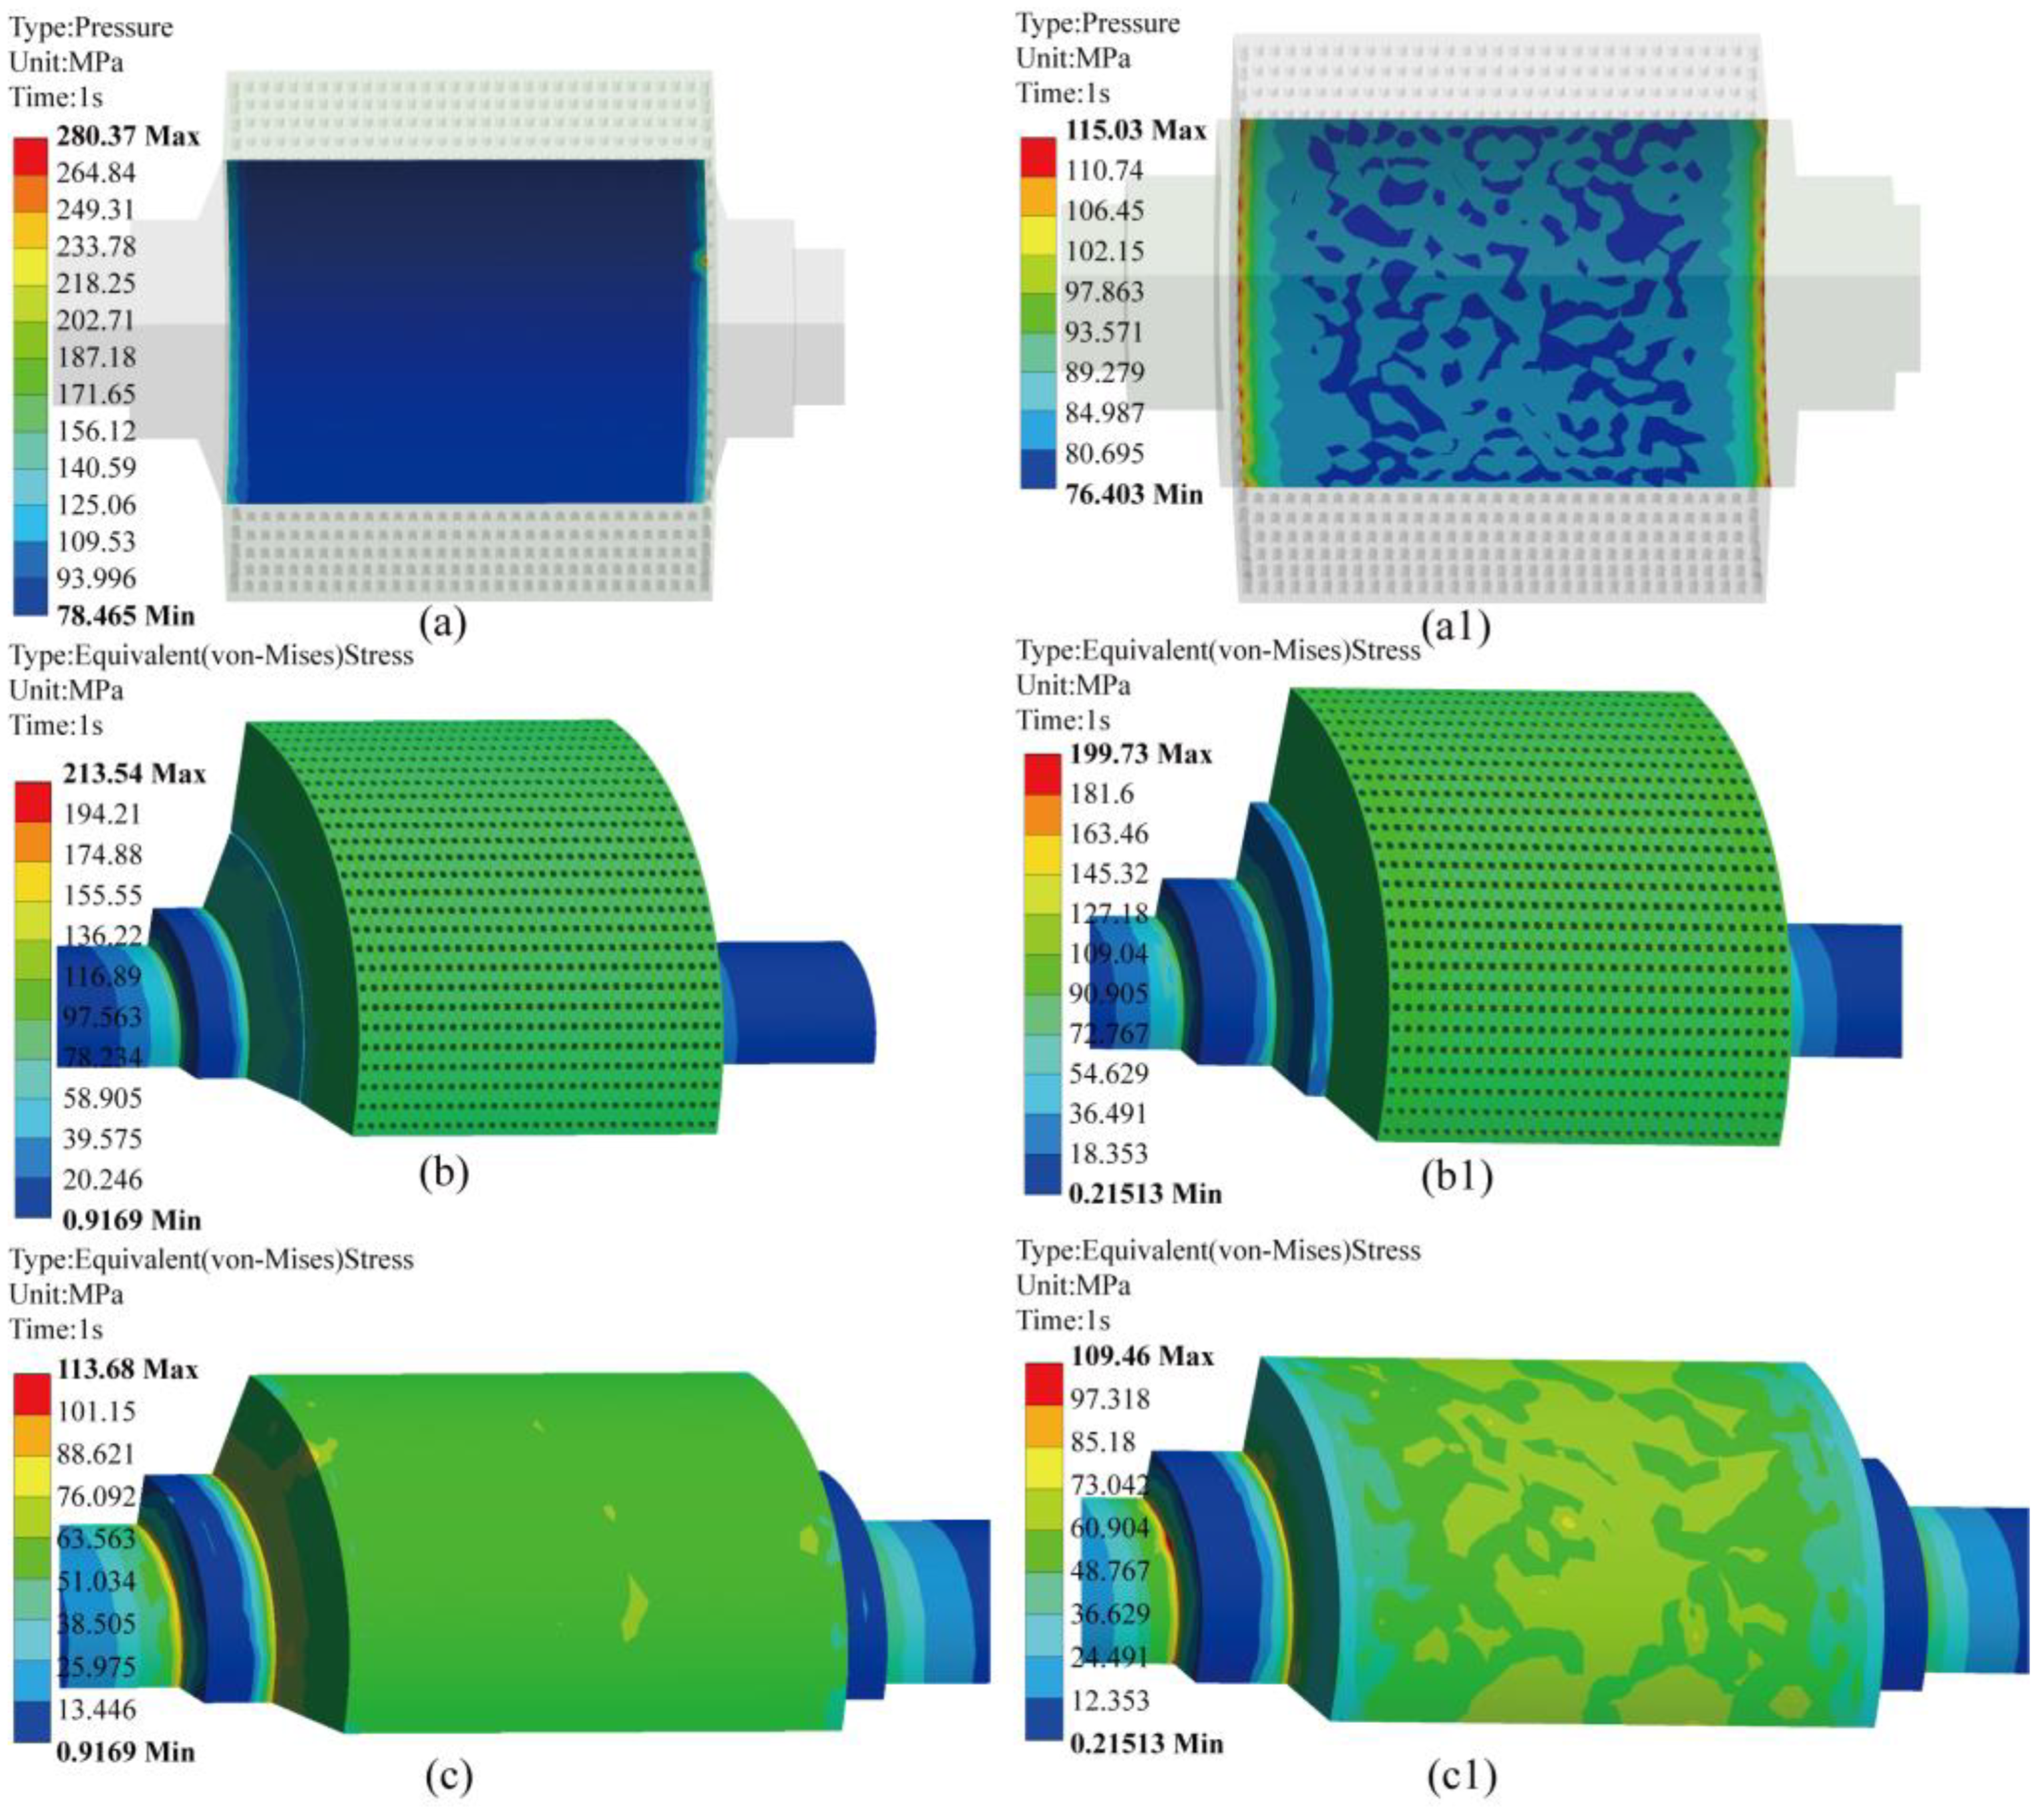
where σ 1 is the yield strength of the stud-lining, σ 1 = 835 MPa, d is the diameter of the roller shaft, and d = 1100 mm; D is the outer diameter of the stud-lining, and D = 1400 mm; p m a x = 173.76 MPa was obtained. According to Figure 5a, the contact pressure between the stud-lining and the roller shaft is 280 MPa, which is more than the calculated maximum contact pressure. Therefore, the finite element model of studded rolls needs to be optimized. Through the contact pressure cloud diagram in Figure 5a, it can be found that the maximum value of the contact pressure appears at the outermost contact point between the roller shaft and the stud-lining. The distribution position of the contact pressure calculated by FEM is consistent with the model results of Weihua [28]. The contact pressure has a smaller value in the middle and a larger value on both sides, with a “saddle” distribution. This shows that the FEM of the roller shaft and stud-lining is consistent with the finite element models of other scholars. Figure 5b is the stress cloud diagram of the stud-lining. Through the cloud diagram, it can be found that the stress is mainly concentrated on the surface of the stud-lining and the contact point between the stud-lining and the roller shaft. Through the stress cloud diagram of the roller shaft in Figure 5c, it can be found that the stress concentration on the roller shaft mainly occurs at the step axis. This is due to stress concentration due to sharp corners at the step axis. Since the stress concentration is the root cause of the fatigue failure of the roller shaft, it seriously affects the service life of the studded rolls. In the future, stress concentrations can be reduced by chamfering the steps or rounding the sharp corners. The main purpose here is to optimize the contact pressure between the roller shaft and the stud-lining.
Since the contact pressure between the roller shaft and the stud-lining is greater than the maximum theoretical contact pressure, the model is optimized, and the optimized cloud diagram is shown in Figure 5a1–c1. Before optimization, the stepped axis at the contact point between the roller shaft and the stud-lining directly reaches the next stepped axis through the curved surface. By establishing models of different roller shafts and stud-lining, simulation calculations were performed to find out. On the roller shaft and stud-lining model, appropriately increasing the length of the stepped shaft at the contact point between the roller shaft and the stud-lining can effectively reduce the contact pressure between the roller shaft and the stud-lining. An optimization scheme of extending the length of the step surface at the contact position between the roller shaft and the stud-lining was proposed. To reduce the contact pressure between the roller shaft and the stud-lining at the outermost part.
The optimization results were as follows: The contact pressure value after optimization was reduced from 280 MPa to 115 MPa, which is a reduction of about 50%. And the maximum equivalent stress of the stud-lining decreased from 214 MPa to 200 MPa, a decrease of 6.5%. The maximum equivalent stress of the optimized roller shaft was reduced from 114 MPa to 109 MPa, which is a reduction of 4.4%. Through the contact pressure cloud diagram, the contact pressure before optimization was mainly concentrated on both sides. After optimization, the contact pressure dropped significantly and the pressure distribution was more uniform. The contact pressure between the optimized roller shaft and the stud-lining is less than the maximum contact pressure calculated theoretically. It is proved that the optimized roller shaft and stud-lining can meet the actual production demand. The stress cloud diagram passing through the stud-lining is shown in Figure 5b. The equivalent stress on the surface of the stud-lining is mainly distributed around the stud holes. Therefore, it shows that the arrangement of the stud holes on the stud-lining has a great influence on the equivalent stress of the stud-lining, which further affects the service life of the studded rolls.

3.2. Contact Analysis of Stud-Lining

As shown of Figure 5b, since the surface of the stud-lining of the studded rolls are composed of stud holes arranged in a certain manner. There will be a phenomenon of stress concentration at the outermost end of the stud hole. Through the analysis of the failure form of the studded rolls, it can be seen that the failure form of the roller press is mainly divided into two parts. One part is the stress concentration at the contact between the roller shaft and the stud-lining, and the stress concentration at the stepped shaft of the roller shaft, resulting in fatigue fracture. The other part is the surface wear and cracks of the stud-lining. And the breakage of the stud. Through simulation optimization of the roller shaft and stud-lining, the strength of the roller shaft and stud-lining can meet the actual requirements. Next, a simulation analysis is conducted on the cooperation between the stud-lining and the stud.
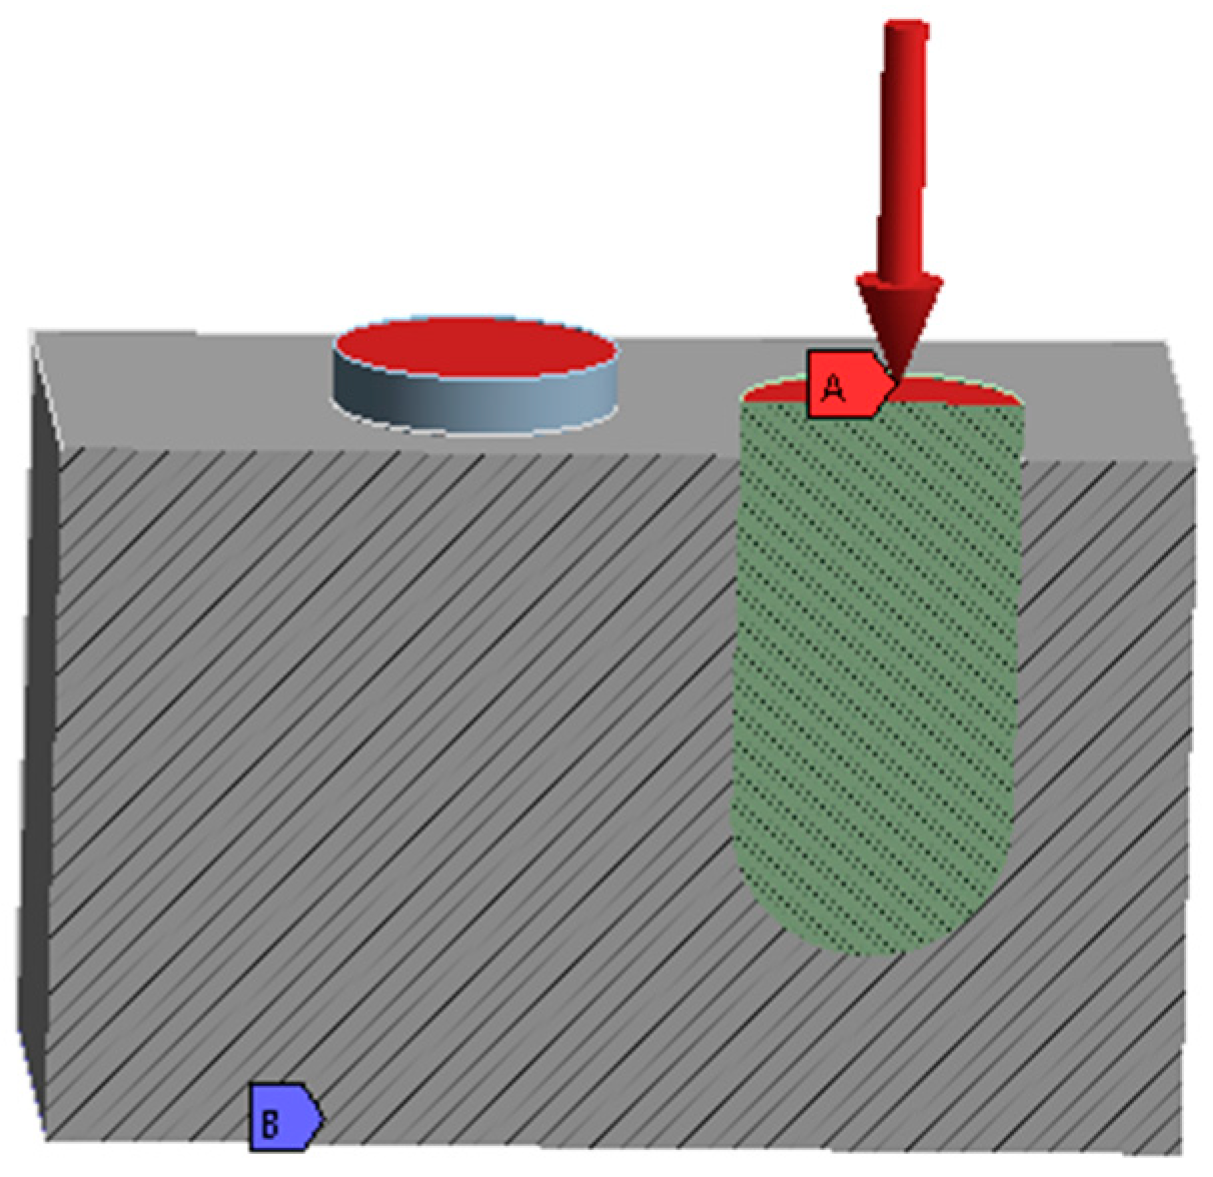
The failure mode of the studded rolls mainly focuses on the cooperation mode between the stud-lining and the stud. For the studded rolls, the wear and crack of the stud-lining surface is mainly affected by the assembly method between stud and stud-lining surface. The wear resistance of the stud-lining surface is enhanced by inlaying studs on the stud-lining. Therefore, the coordination between the studs and the stud holes is the focus of the study. In order to reduce the calculation degree of the simulation, the load simulation of the roller press is simplified to the simulation of the studs and the part of the rolls surface with the stud holes. Calculate the pressure corresponding to the central angle through the established mathematical model, apply the calculated pressure on the upper surface of the stud, and constrain the stud and stud-lining model. As shown in Figure 6, the cross-section diagram of the stud and stud-lining. As shown in red A in Figure 6, apply pressure on the upper surface of the stud. Constrain the model at blue B in Figure 6. Combined with the material properties of studs and stud-lining on studded rolls in work, the material parameters of studs and stud-lining are set according to the parameters in Table 2.
The surface of the stud-lining of the studded rolls are composed of stud holes that are drilled in different ways. A stud is assembled in the stud hole, and the upper surface of the stud is higher than the surface of the stud-lining by a certain height. Shortly after the studded rolls are put into operation, fine material can get stuck between the stud and the stud hole. This layer of fine material prevents the base material of stud-lining from further wear. And this autogenous wear protection will be protecting the stud-lining surface. At this time, the damage of the studs and the stud holes are the main problem of the studded rolls. Therefore, the simplified model is used here to conduct simulation analysis between the stud and the stud hole. Analyze the stress and deformation concentration of studs and stud holes to provide a theoretical basis for stud shape design and stud material selection.
In order to determine the validity of the simulation results, the dimensions of the meshes were verified. Select 2 × 10 4 , 5 × 10 4 , 1 × 10 5 , 2 × 10 5 , 5 × 10 5 , 1 × 10 6 mesh respectively to verify the convergence of the mesh. After the number of meshes reached 5 × 10 4 , the equivalent stress result remains within a certain error range, and the change in equivalent stress was less affected by the mesh. And the average value of the corresponding mesh unit quality changes slightly. In order to consider the impact of the number of meshes on the calculation cost, and to speed up the calculation time. Decide to divide the mesh according to the number of meshes. At this time, the mesh size was 3 mm, and the mesh type adopted a second-order tetrahedron. Most of the mesh quality was above 0.75, and the average mesh average quality is greater than 0.8, indicating that the division effect was relatively better and higher simulation accuracy can be achieved.

3.2.1. Simulation Analysis of Studs and Stud-Lining

(1)
Stress distribution of studded rolls press in working area
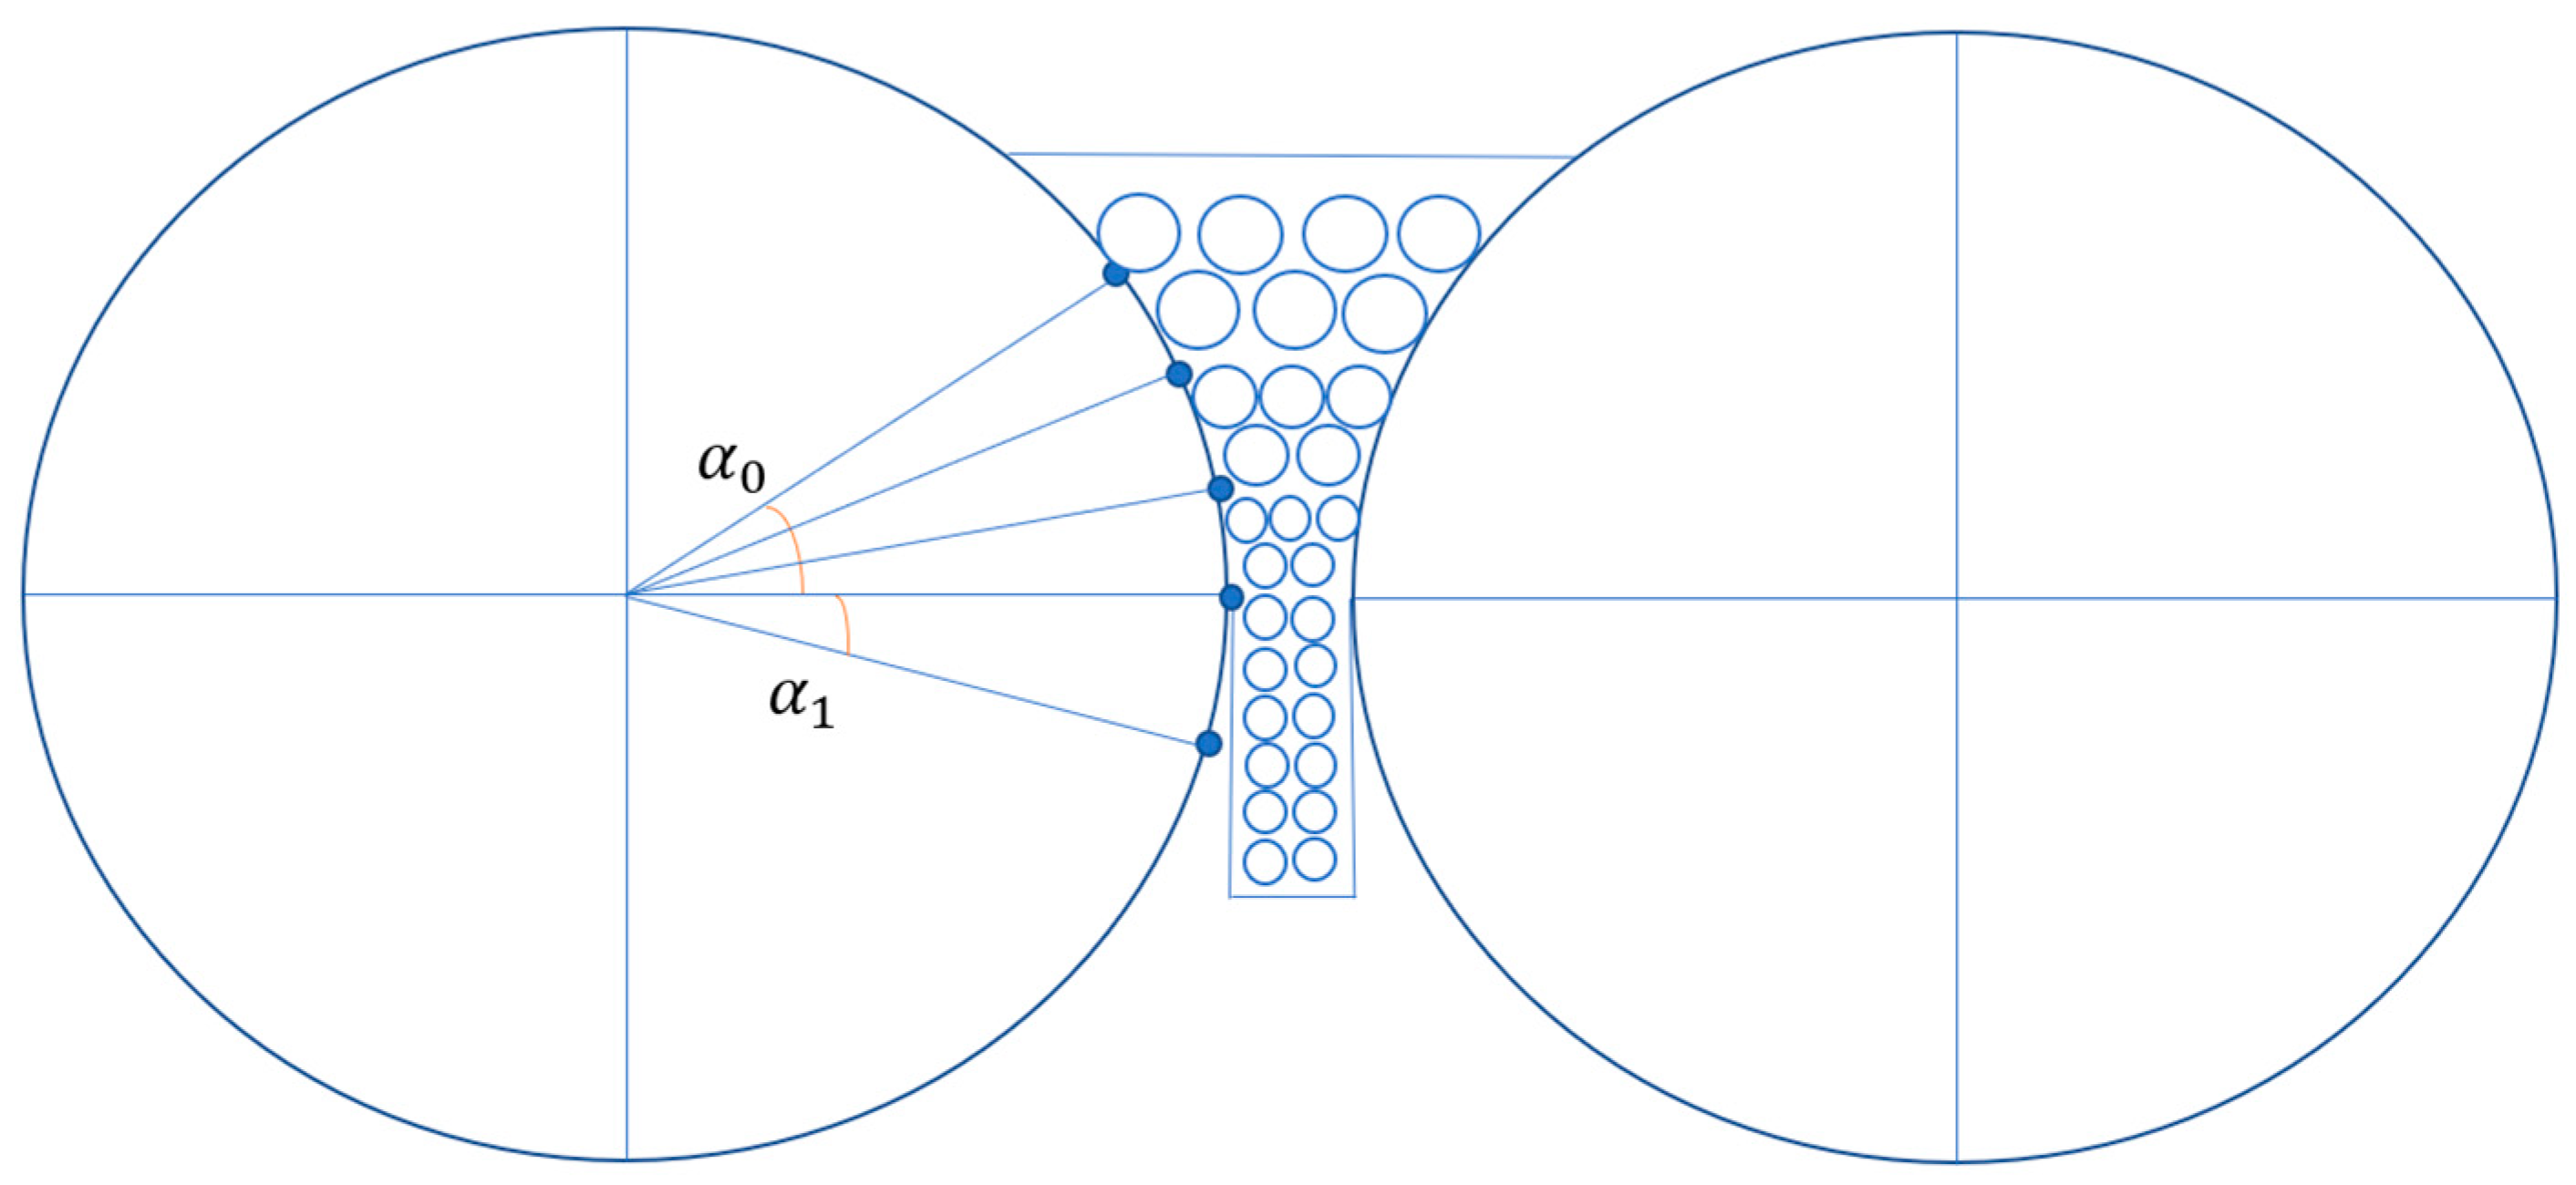
Through the mathematical model established by using the compression and rebound characteristics of the material layer, the pressure on the studs at different positions of the studded rolls are calculated. In the process of working, a material layer will be formed at the contact between the stud and the stud-lining surface to protect the stud-lining surface. It is assumed that the pressure of the material on the stud-lining surface is all acting on the upper surface of the stud. In the selection of the model of the roller press, select the model in which the diameter of the roller is 1400 mm and the gap between the rollers is 10 mm. The material is limestone. According to the principle of material layer crushing, the pressure in the compression zone and rebound zone is much greater than that in the acceleration zone. The pressure angle [32] is selected by understanding the pressure zone and combining with the actual production situation of the roller press. By combining the literature [29] and reducing the computational cost, the nip angle α of the roller press pressure is set −2° to 6°. The horizontal pressure is maximum when the nip angle is 0°, and the two sides are symmetrical. And the peak value decreases with the increase of λ absolute value. Therefore, the values of λ = 0 and nip angle of 6°, 4°, 2°, 0° and −2° are selected. As shown in Figure 7. α 0 is the compression zone and α 1 is the rebound zone. To analyze the stress distribution of stud and rolls surface in the working area of studded rolls.
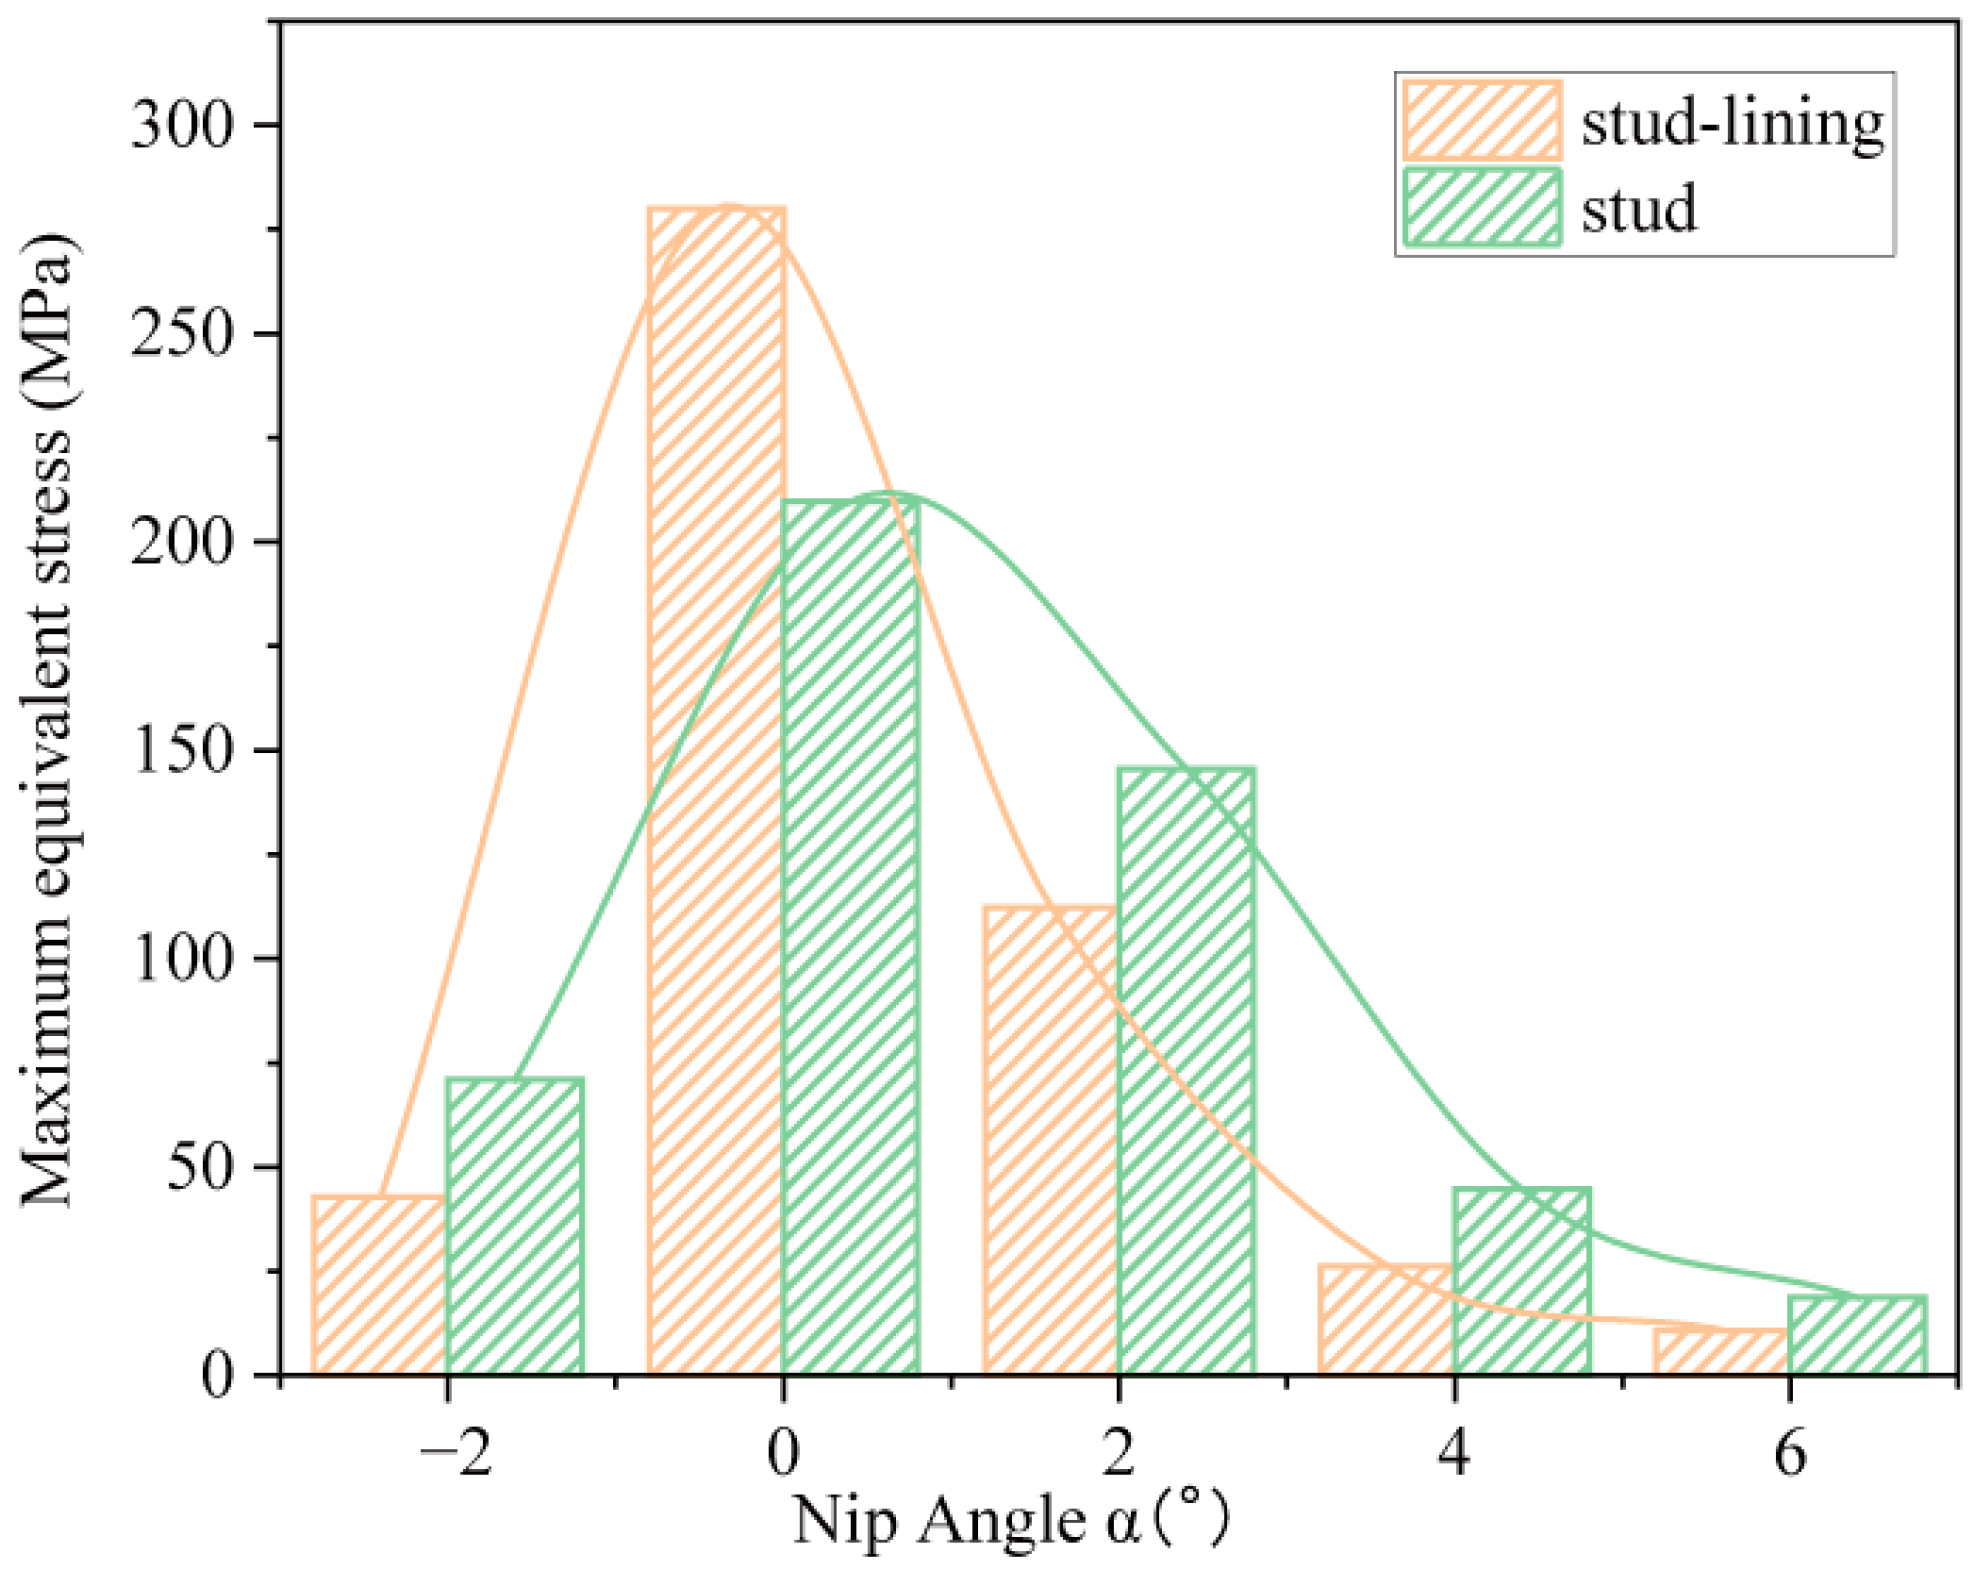
The pressure values of different positions are calculated through the mathematical model of the roller press, and the established stud and stud-lining model is imported into the ANSYS software. Set the stud and stud hole sizes to the same size, and use an assembly method with a gap value of 0. Through the simulation calculation of the stud and stud-lining model, the change of the maximum equivalent stress of the stud-lining surface and stud of the studded rolls are obtained. As shown in Figure 8. The maximum equivalent stress of the stud and stud-lining is maximum at the position where the nip angle is 0°, and the equivalent stress is symmetrically distributed. When the nip angle is 0°, the maximum equivalent stress of the rolls surface is slightly larger than that of the stud. The increase rate of the maximum equivalent stress of the stud-lining surface is faster in the rebound zone. When the nip angle of the compression zone is 2°, the maximum equivalent stress of the stud is slightly larger than that of the rolls surface. When the nip angle is 6°, the maximum equivalent stress of rolls surface and stud gradually tends to 0.
(2)
Stress changes in different assembly method
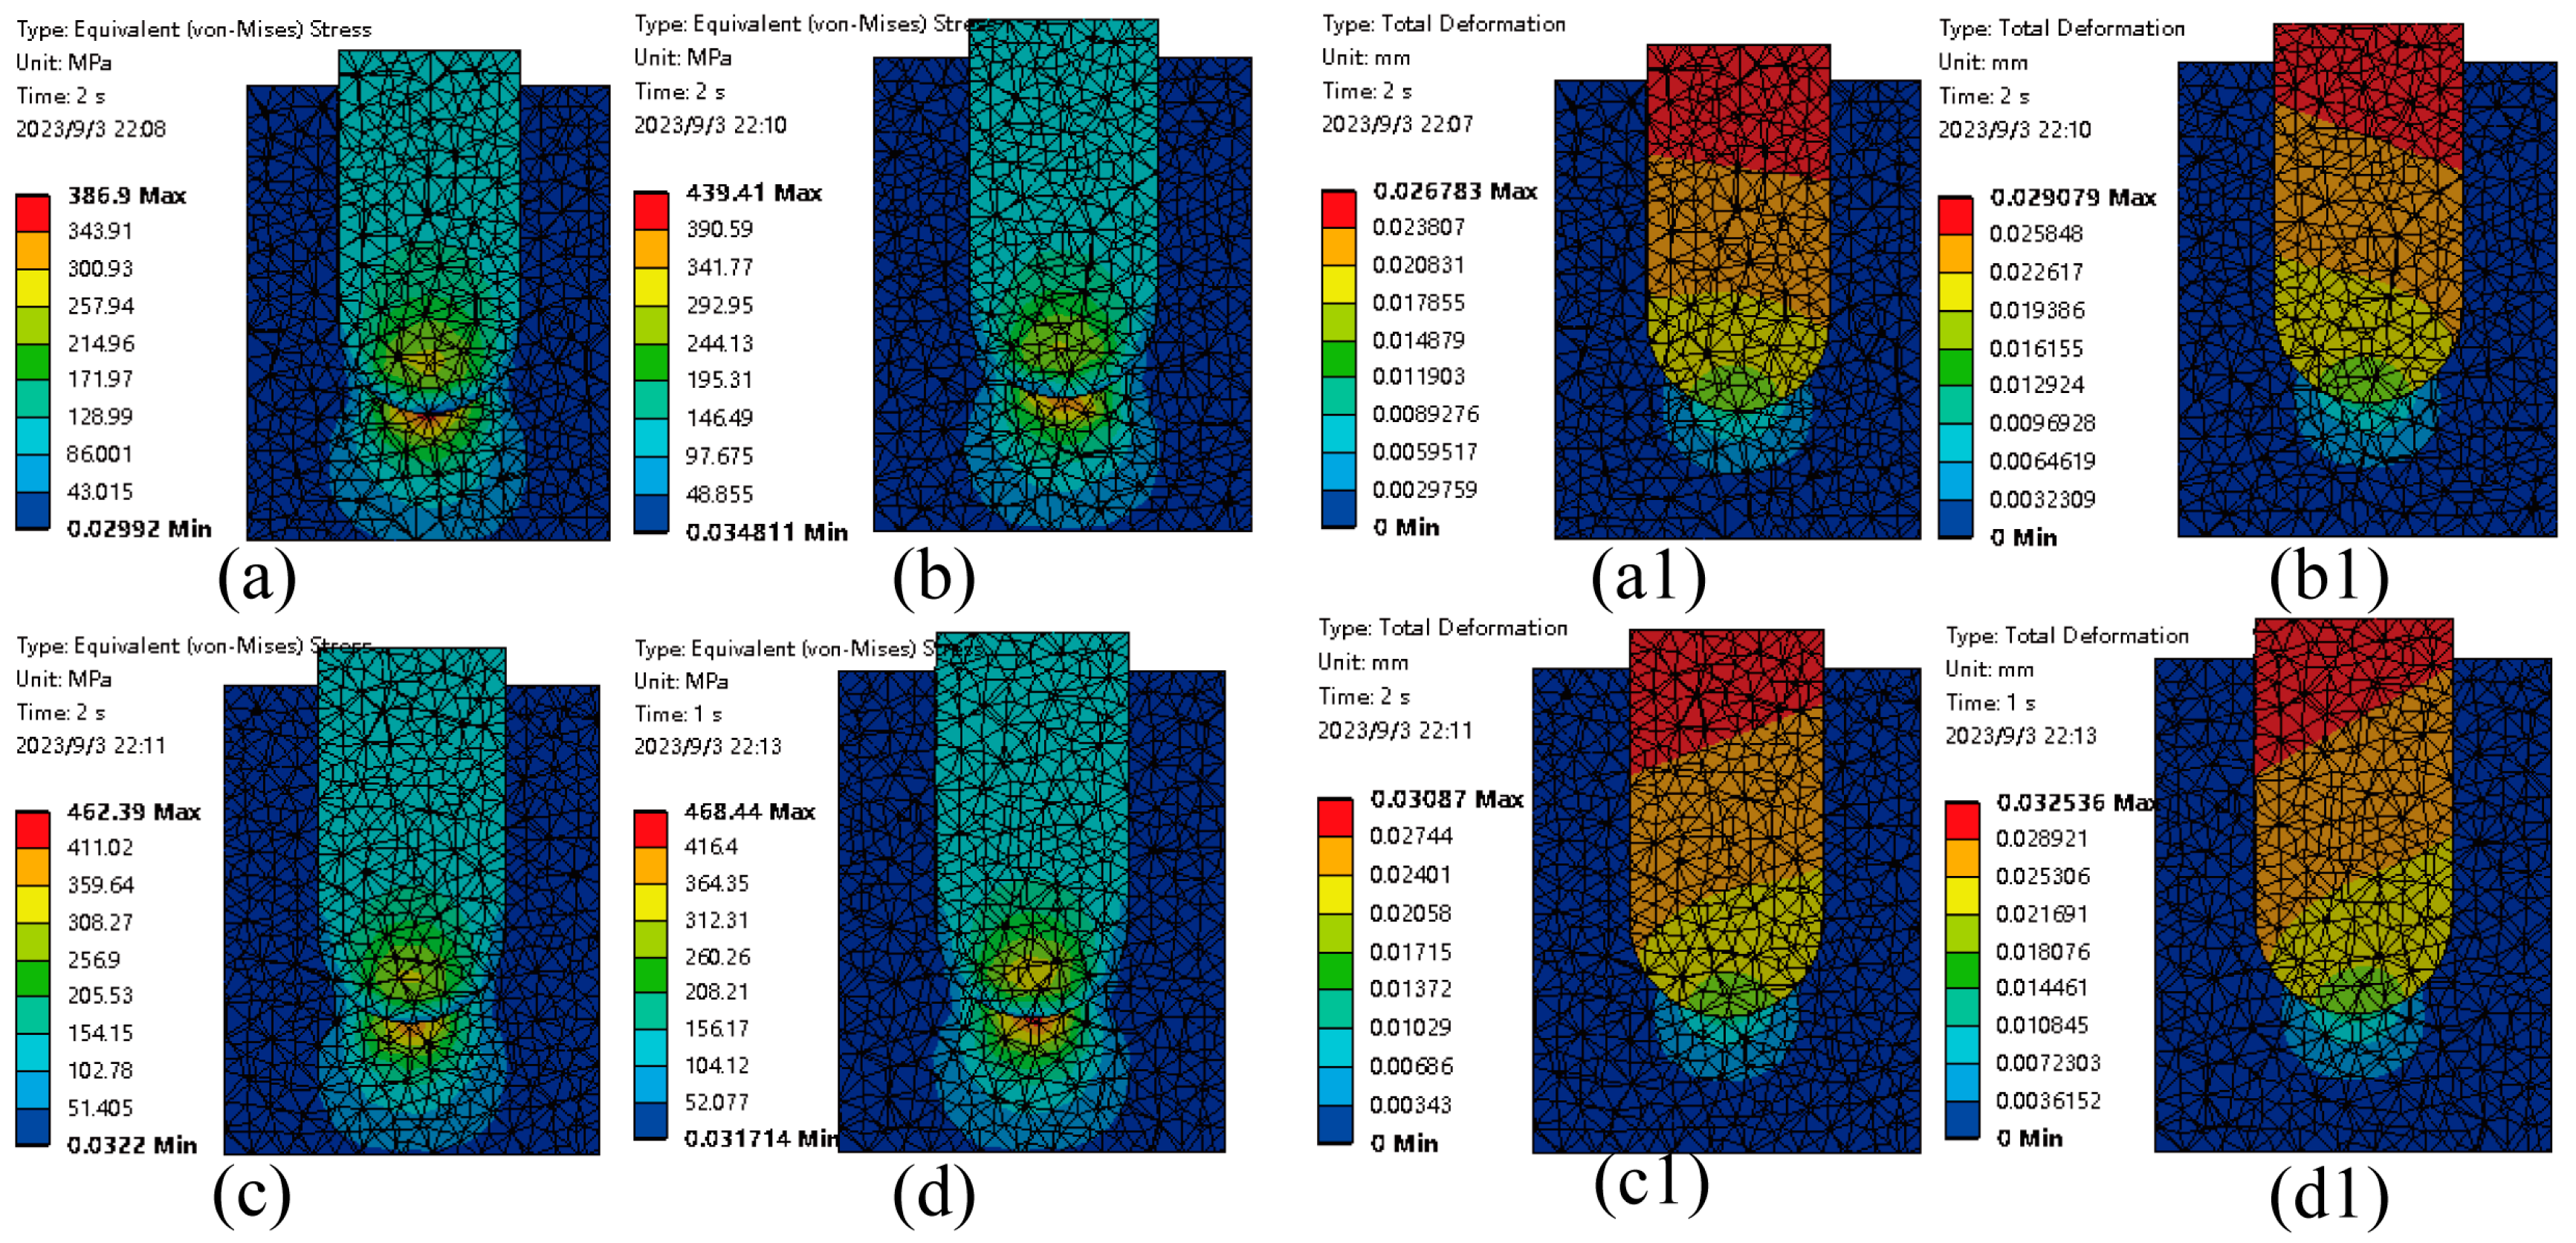
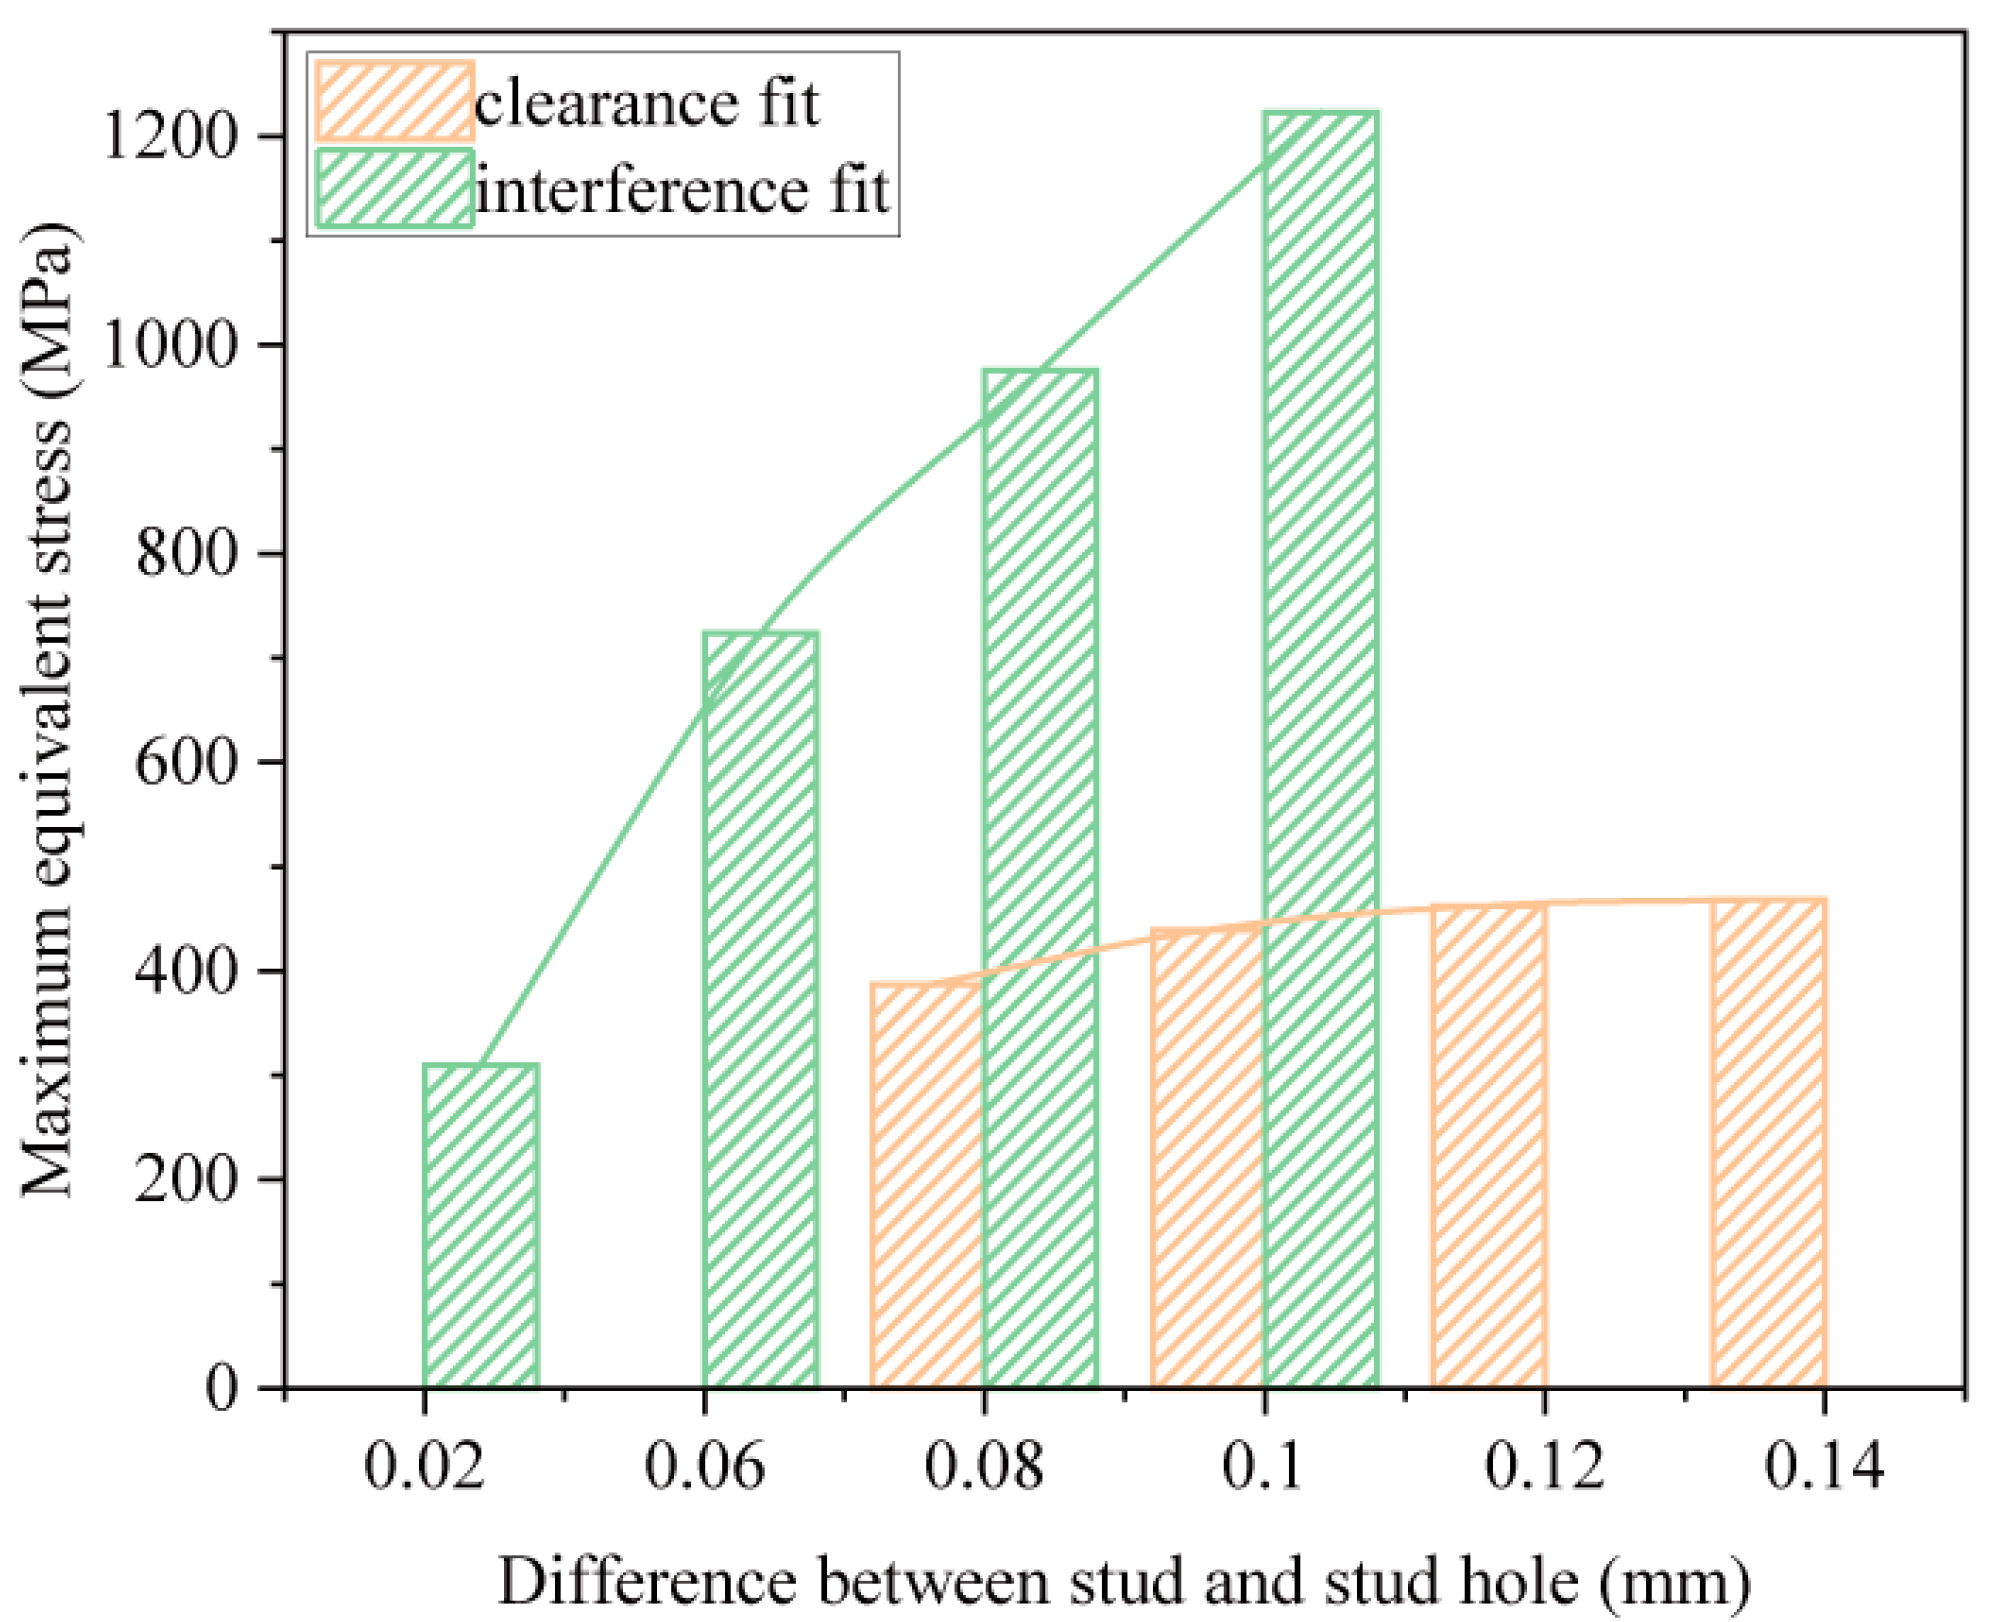
The assembly method between the stud and the stud-lining has interference fit and clearance fit. We know through reading the literature that there are few studies on the assembly method between the stud and the stud-lining at present. This paper analyzes the stress changes of stud and stud-lining under different assembly method by fixing loads and constraints and changing different assembly method in stud and stud-lining. Refer to the stud-lining surface processed by the studded rolls manufacturing company to select the gap value between the stud and the stud-lining. The gap values are selected as 0.08 mm, 0.10 mm, 0.12 mm and 0.14 mm for simulation analysis. Since it is to analyze the impact of the equivalent stress and deformation of the stud under different assembly methods, the same load is used in different stud assembly methods. The pressure of the material changes with the change of the nip angle. In order to study the maximum stress of the stud, the nip angle of the load is selected as 0°, the pressure angle is perpendicular to the stud upper surface, the pressure value is taken as an integer as 120 MPa, and constrain the studded rolls model. The equivalent stress results are shown in Figure 9a–d below.
According to the data statistics, gap value is 0.08 mm and the maximum equivalent stress is 377.06 MPa. The gap value is 0.10 mm and the maximum equivalent stress is 425.31 MPa. The gap value is 0.12 mm and the maximum equivalent stress is 448.69 MPa. The gap value is 0.14 mm and the maximum equivalent stress is 461.09 MPa. Through the above data, it is found that with the increase of gap amount, the maximum equivalent stress presents a trend of gradually increasing muscle, but the increasing range gradually decreases. It can be found from the total deformation cloud diagram of the stud-lining and stud in Figure 9a1–d1 that the total deformation gradually increases as the gap value increases. The variation range of the total deformation value is 0.002 mm. The maximum total deformation occurs at the upper surface of the stud. The deformation on the stud-lining mainly occurs at the spherical bottom of the stud hole.
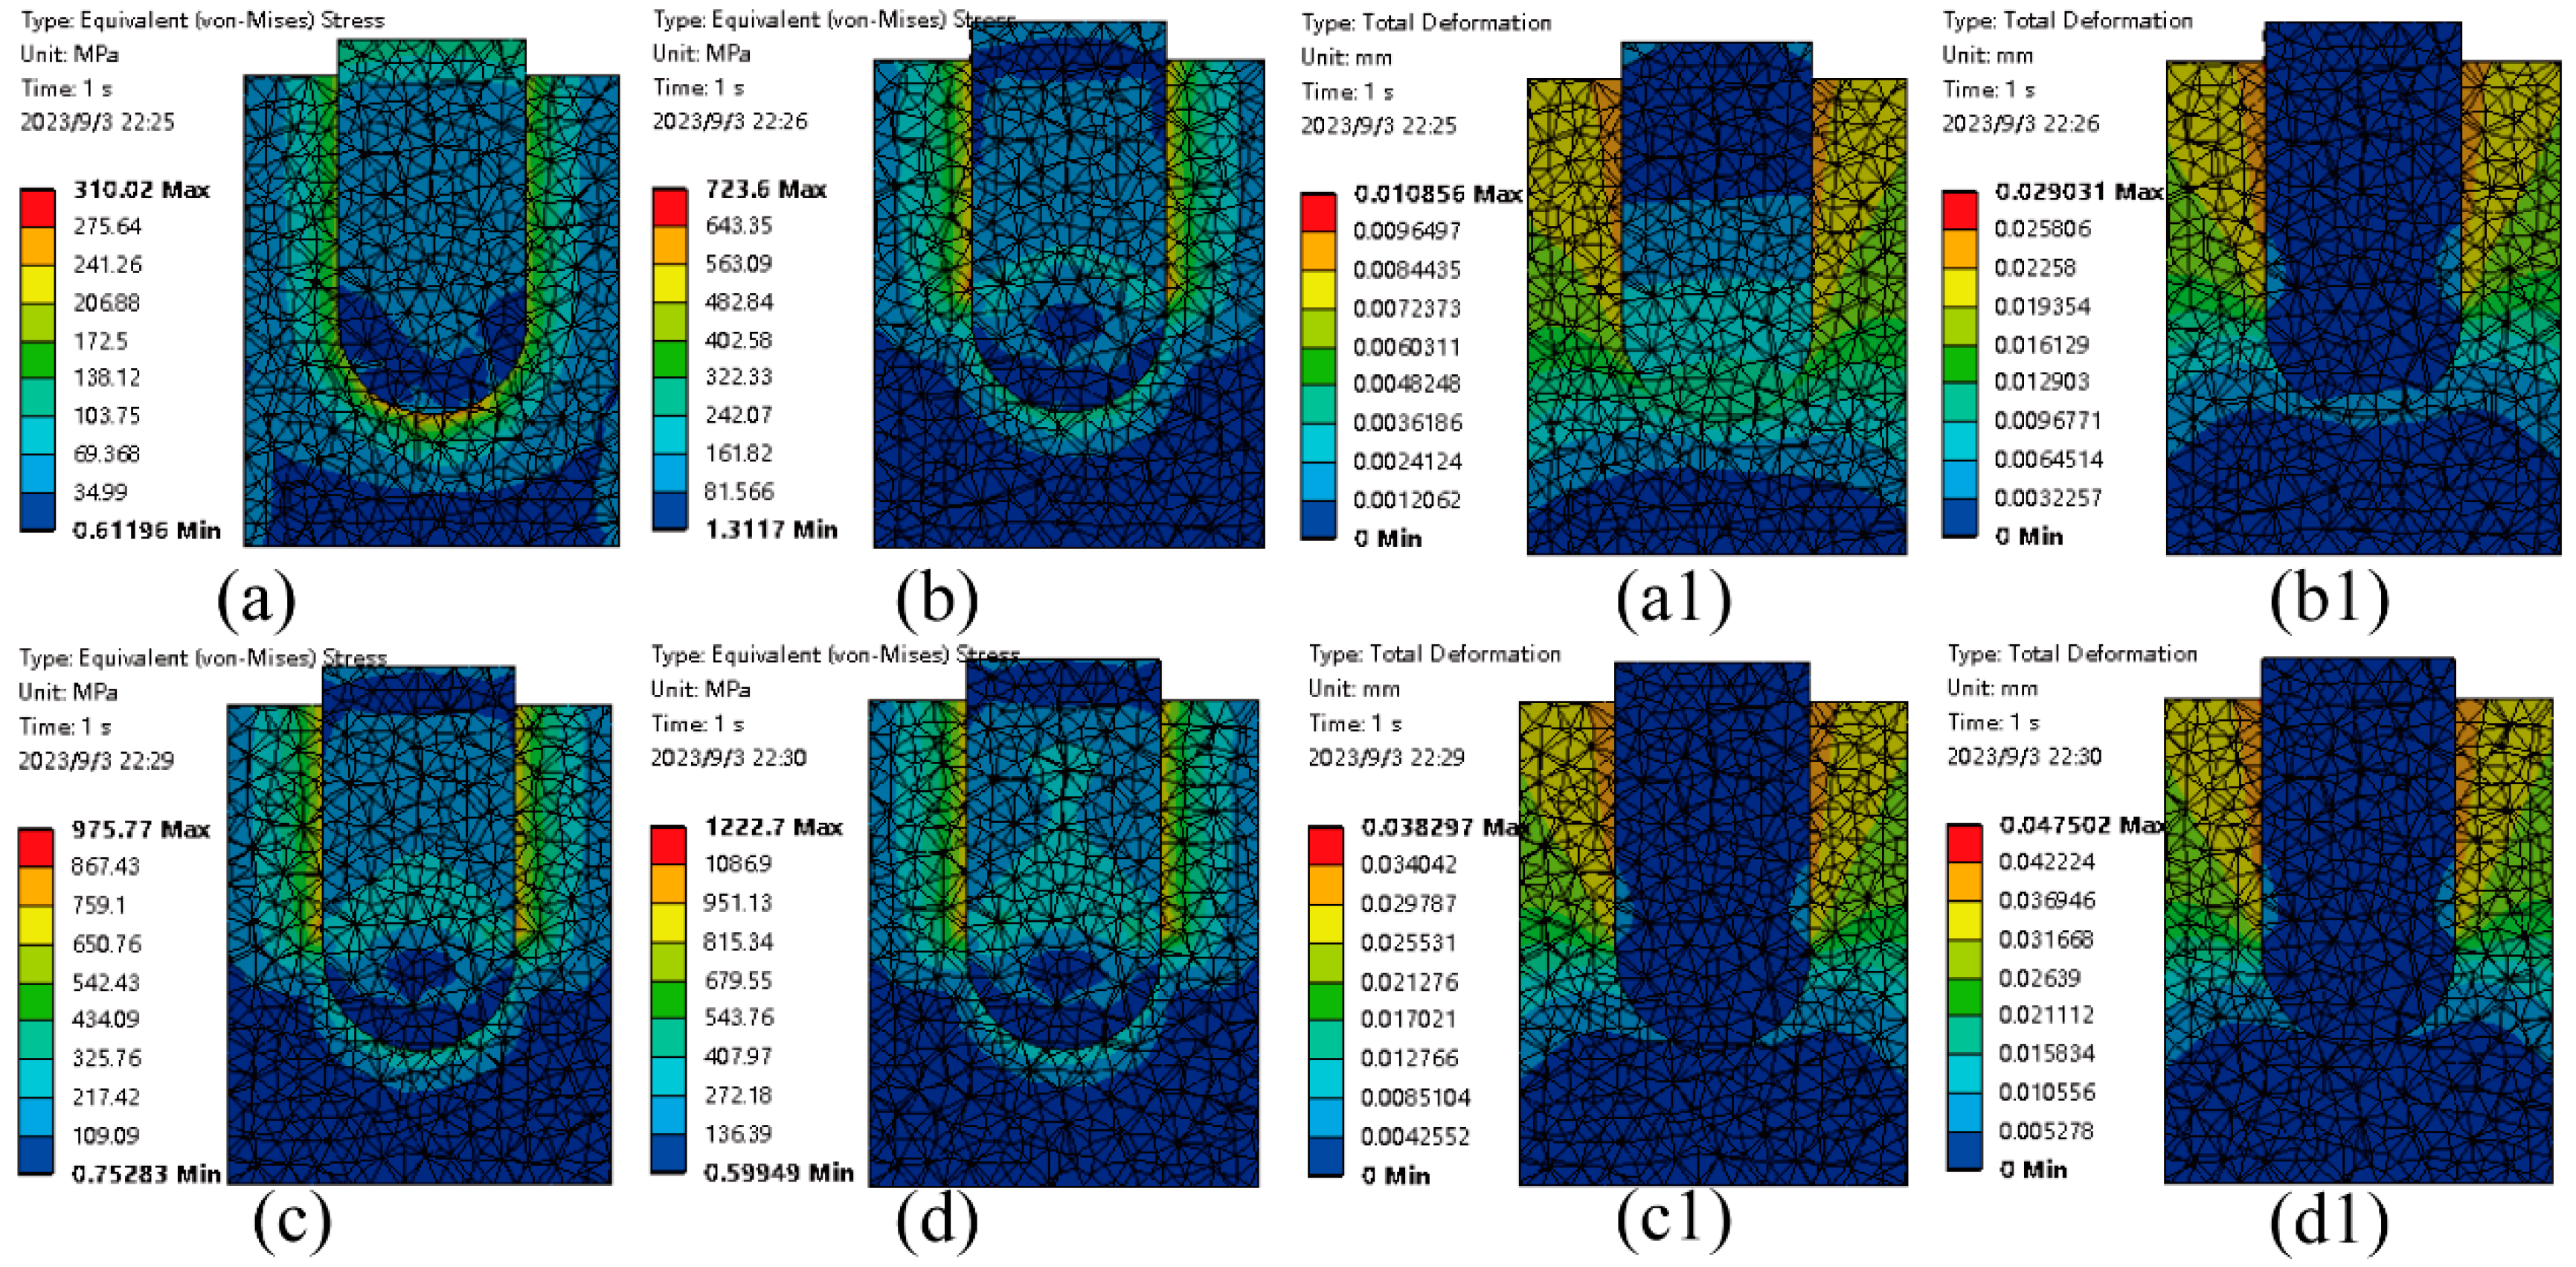
Four sets of interference values of 0.02 mm, 0.06 mm, 0.08 mm, and 0.10 mm are selected in the reference, and the interference fit will be analyzed according to the same loading and constraint methods in clearance fit. According to the data statistics, the interference value is 0.02 mm and the maximum equivalent stress is 304.4 MPa. The interference value is 0.06 mm and the maximum equivalent stress is 724.8 MPa. The interference value is 0.08 mm and the maximum equivalent stress is 981.7 MPa. The interference value is 0.1 mm and the maximum equivalent stress is 1225.1 MPa. As the interference value increases, the maximum equivalent stress of the stud and stud-lining gradually increases. The stress is mainly concentrated in the upper part of the stud hole. As shown in Figure 10a–d. It can be found from Figure 10a1–d1 that the change trend of the total deformation of interference fit is the same as the change trend of stress. The maximum total deformation occurs on the stud-lining. The maximum total deformation occurs on the stud-lining. The deformation on the stud is mainly concentrated on the lateral cylindrical surface of the stud.
The absolute value of the difference between the stud and the stud hole is taken as the X-axis, and the maximum value of the equivalent stress on the model is taken as the Y-axis, as shown in Figure 11. It can be seen from Figure 11 that with the increase of the difference, the maximum equivalent stress on the model gradually increases, and the growth rate of the interference fit is the largest.
It can be found that the change of interference fit is similar to that of clearance fit, showing a gradual growth trend, and the growth range is larger. In the case of the same value, the maximum equivalent stress of the post studded rolls of the interference fit is much larger than that of the clearance fit. Therefore, the gap assembly method is better than the interference assembly method.
(3)
Stress changes in different axial and circumferential distances
Through reading the literature, it is found that the arrangement of the stud on the stud-lining surface has a great influence on the wear of the stud-lining of the stud [11,26]. In order to explore the influence of different arrangements of studs on stress and deformation, a finite element model was established through ANSYS to change the axial and circumferential distances between two studs. Where the axial distance is set to x and the circumferential distance is set to y. The schematic diagram of the model is shown in Figure 12.
The initial position of the two studs is 25.676 mm and 16.625 mm, and the values of x and y are decreased and increased respectively. The changes of the maximum equivalent stress were observed under different axial and circumferential distances. The simulation here still uses the way of fixed load to observe the change of equivalent stress at different distances. The distance between studs is changed by building models with different axial and circumferential distances. Apply the same stresses to the model as in (2), and the same constraints.
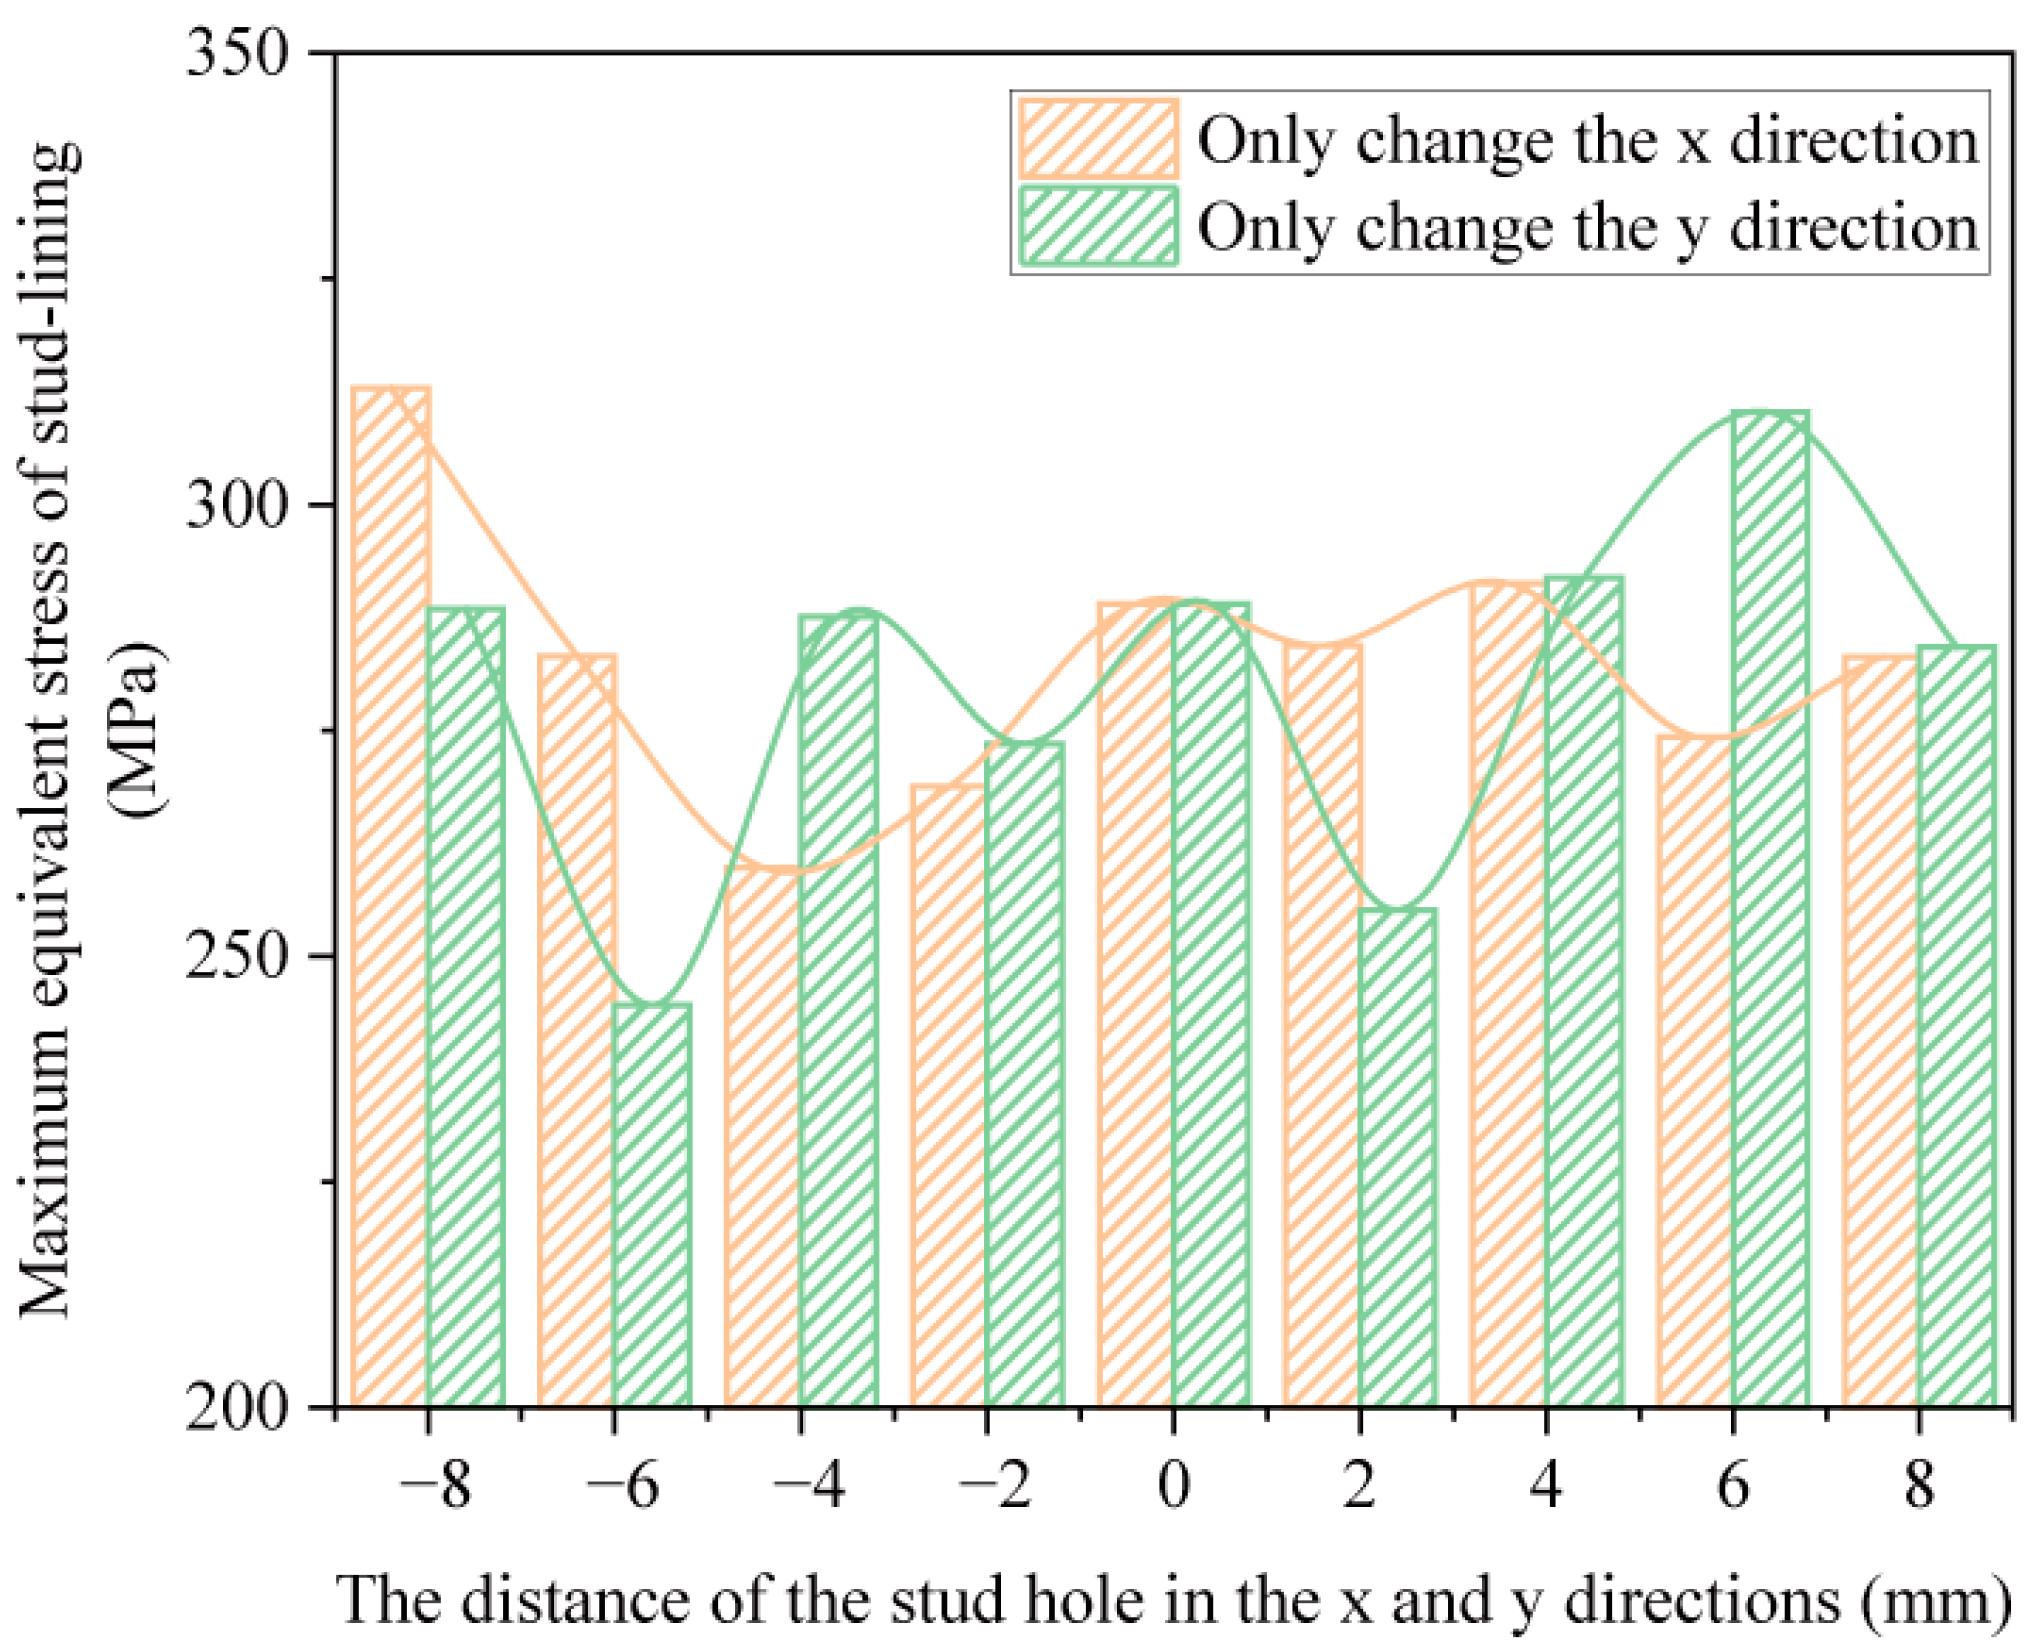
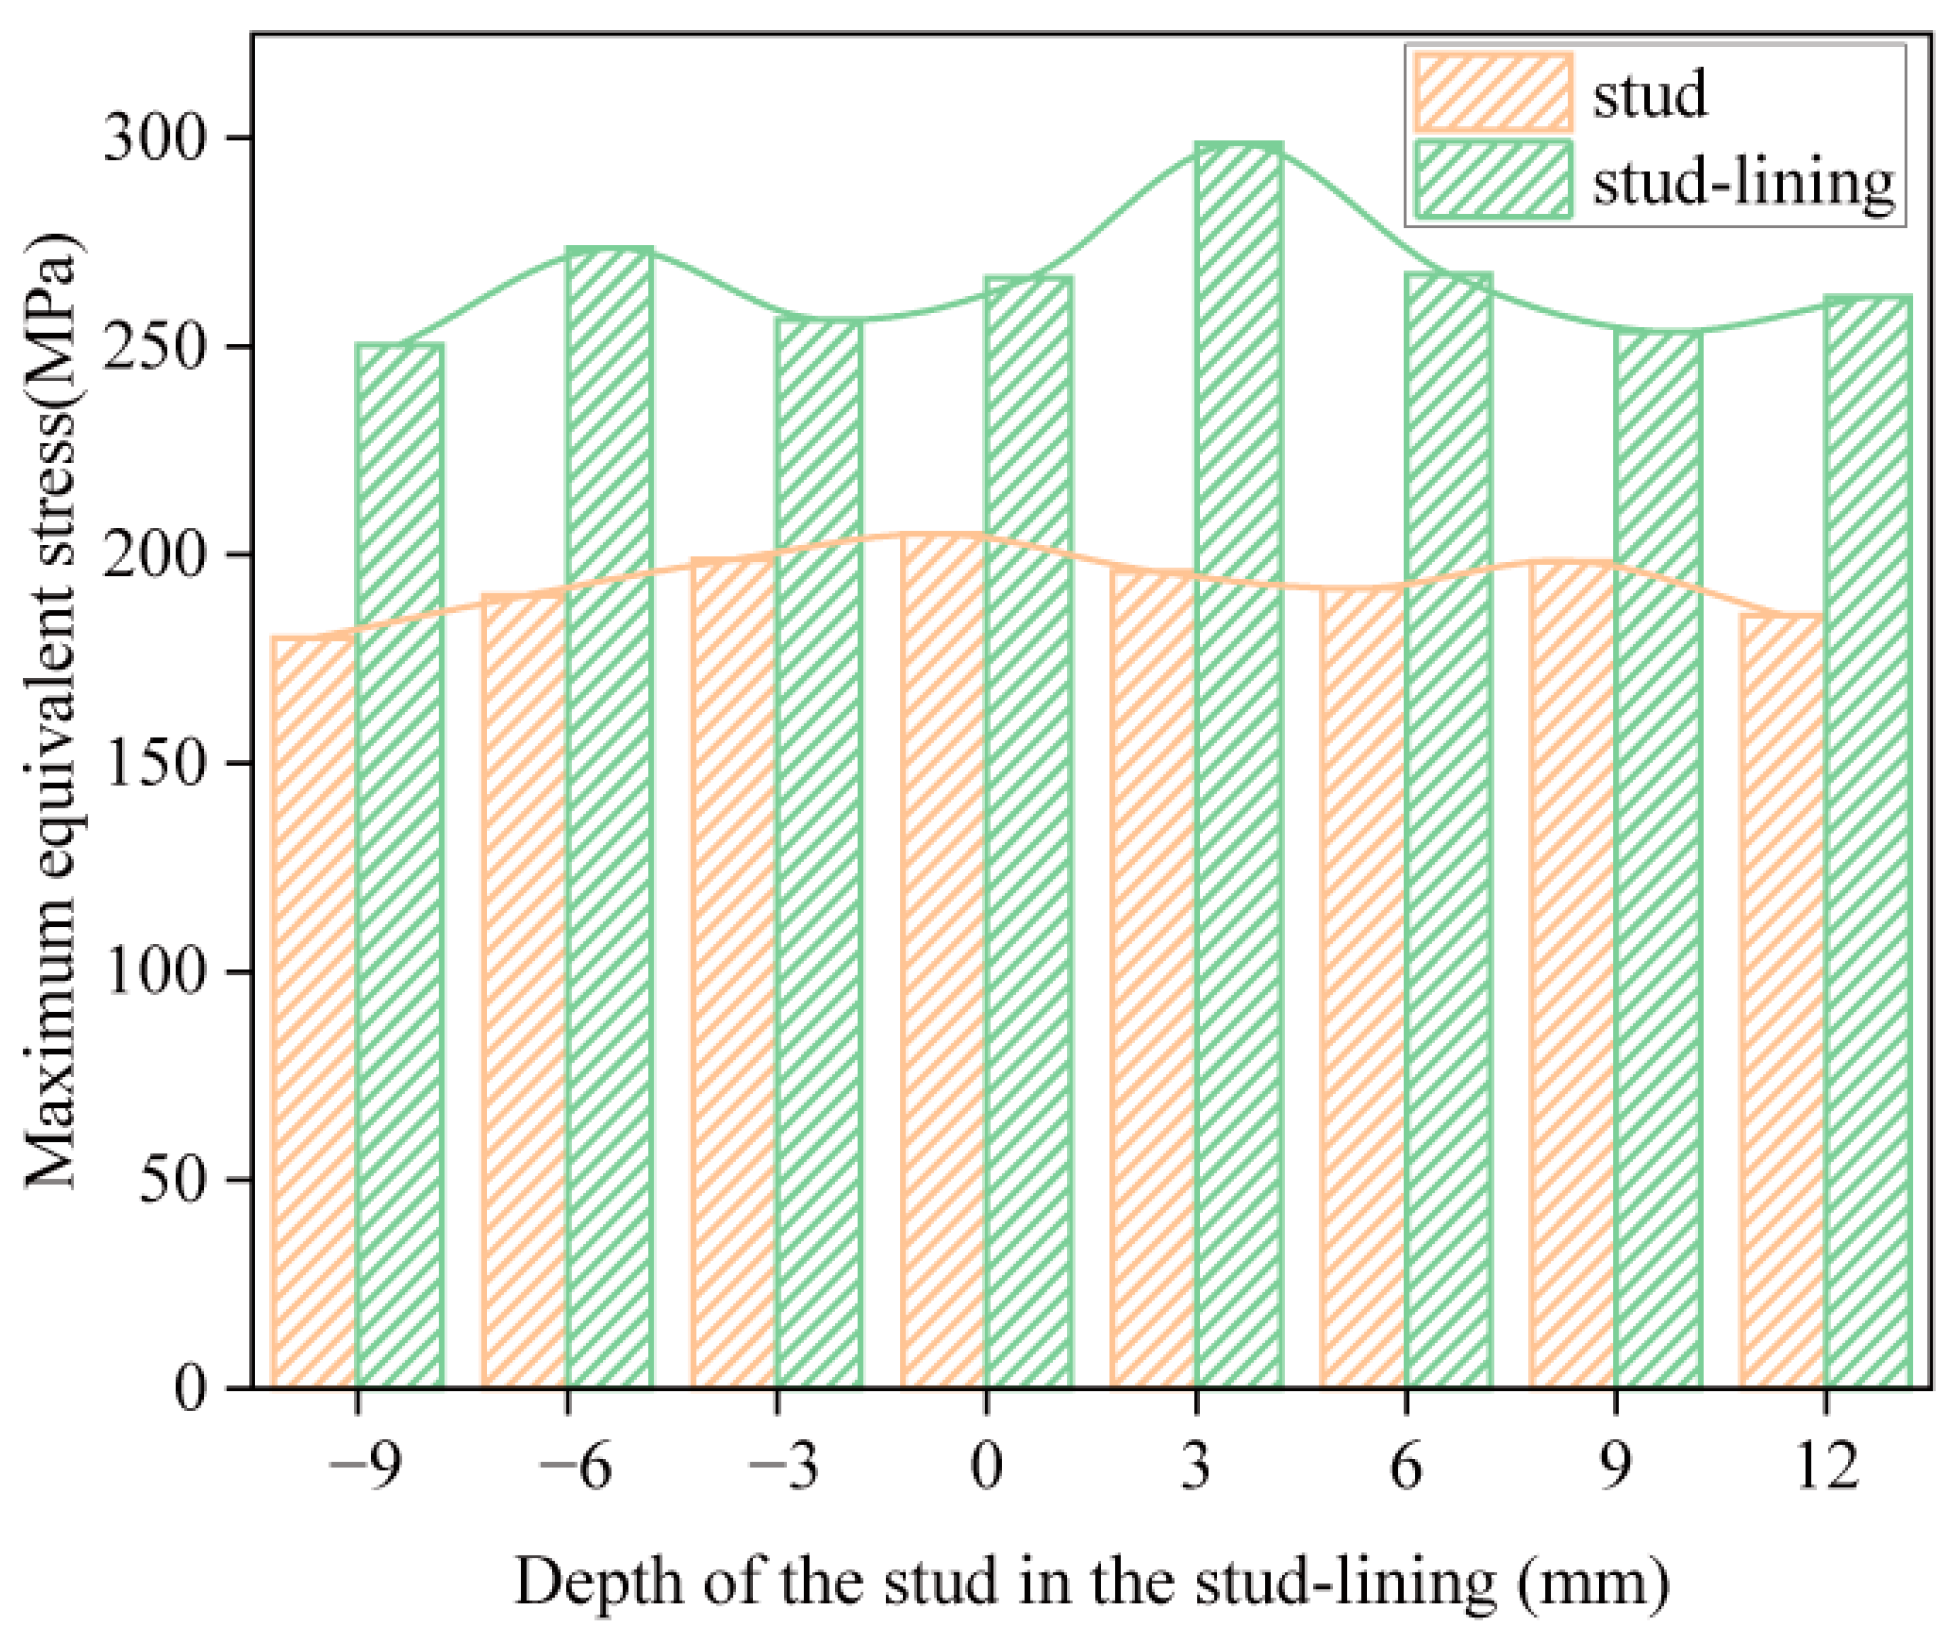
As shown in Figure 13, it is the histogram of the maximum equivalent stress of the stud-lining with different distances in the x and y directions. When the axial distance between the studs is gradually reduced, it is found that the maximum equivalent stress on the stud-lining also gradually decreases. When the axial distance is reduced by 4 mm, the equivalent stress of the stud-lining increase slightly. However, the maximum equivalent stress increases sharply when the axial distance decreases by 8 mm. It can be seen that when the axial distance between the studs is reduced, the maximum equivalent stress of the stud-lining is the smallest when the axial distance is reduced by 6 mm. When increasing the axial distance between studs. The maximum equivalent stress of the stud-lining presents a trend of decreasing first and then increasing and then decreasing. When the axial distance increases by 2 mm, the maximum equivalent stress of the stud-lining is the smallest.
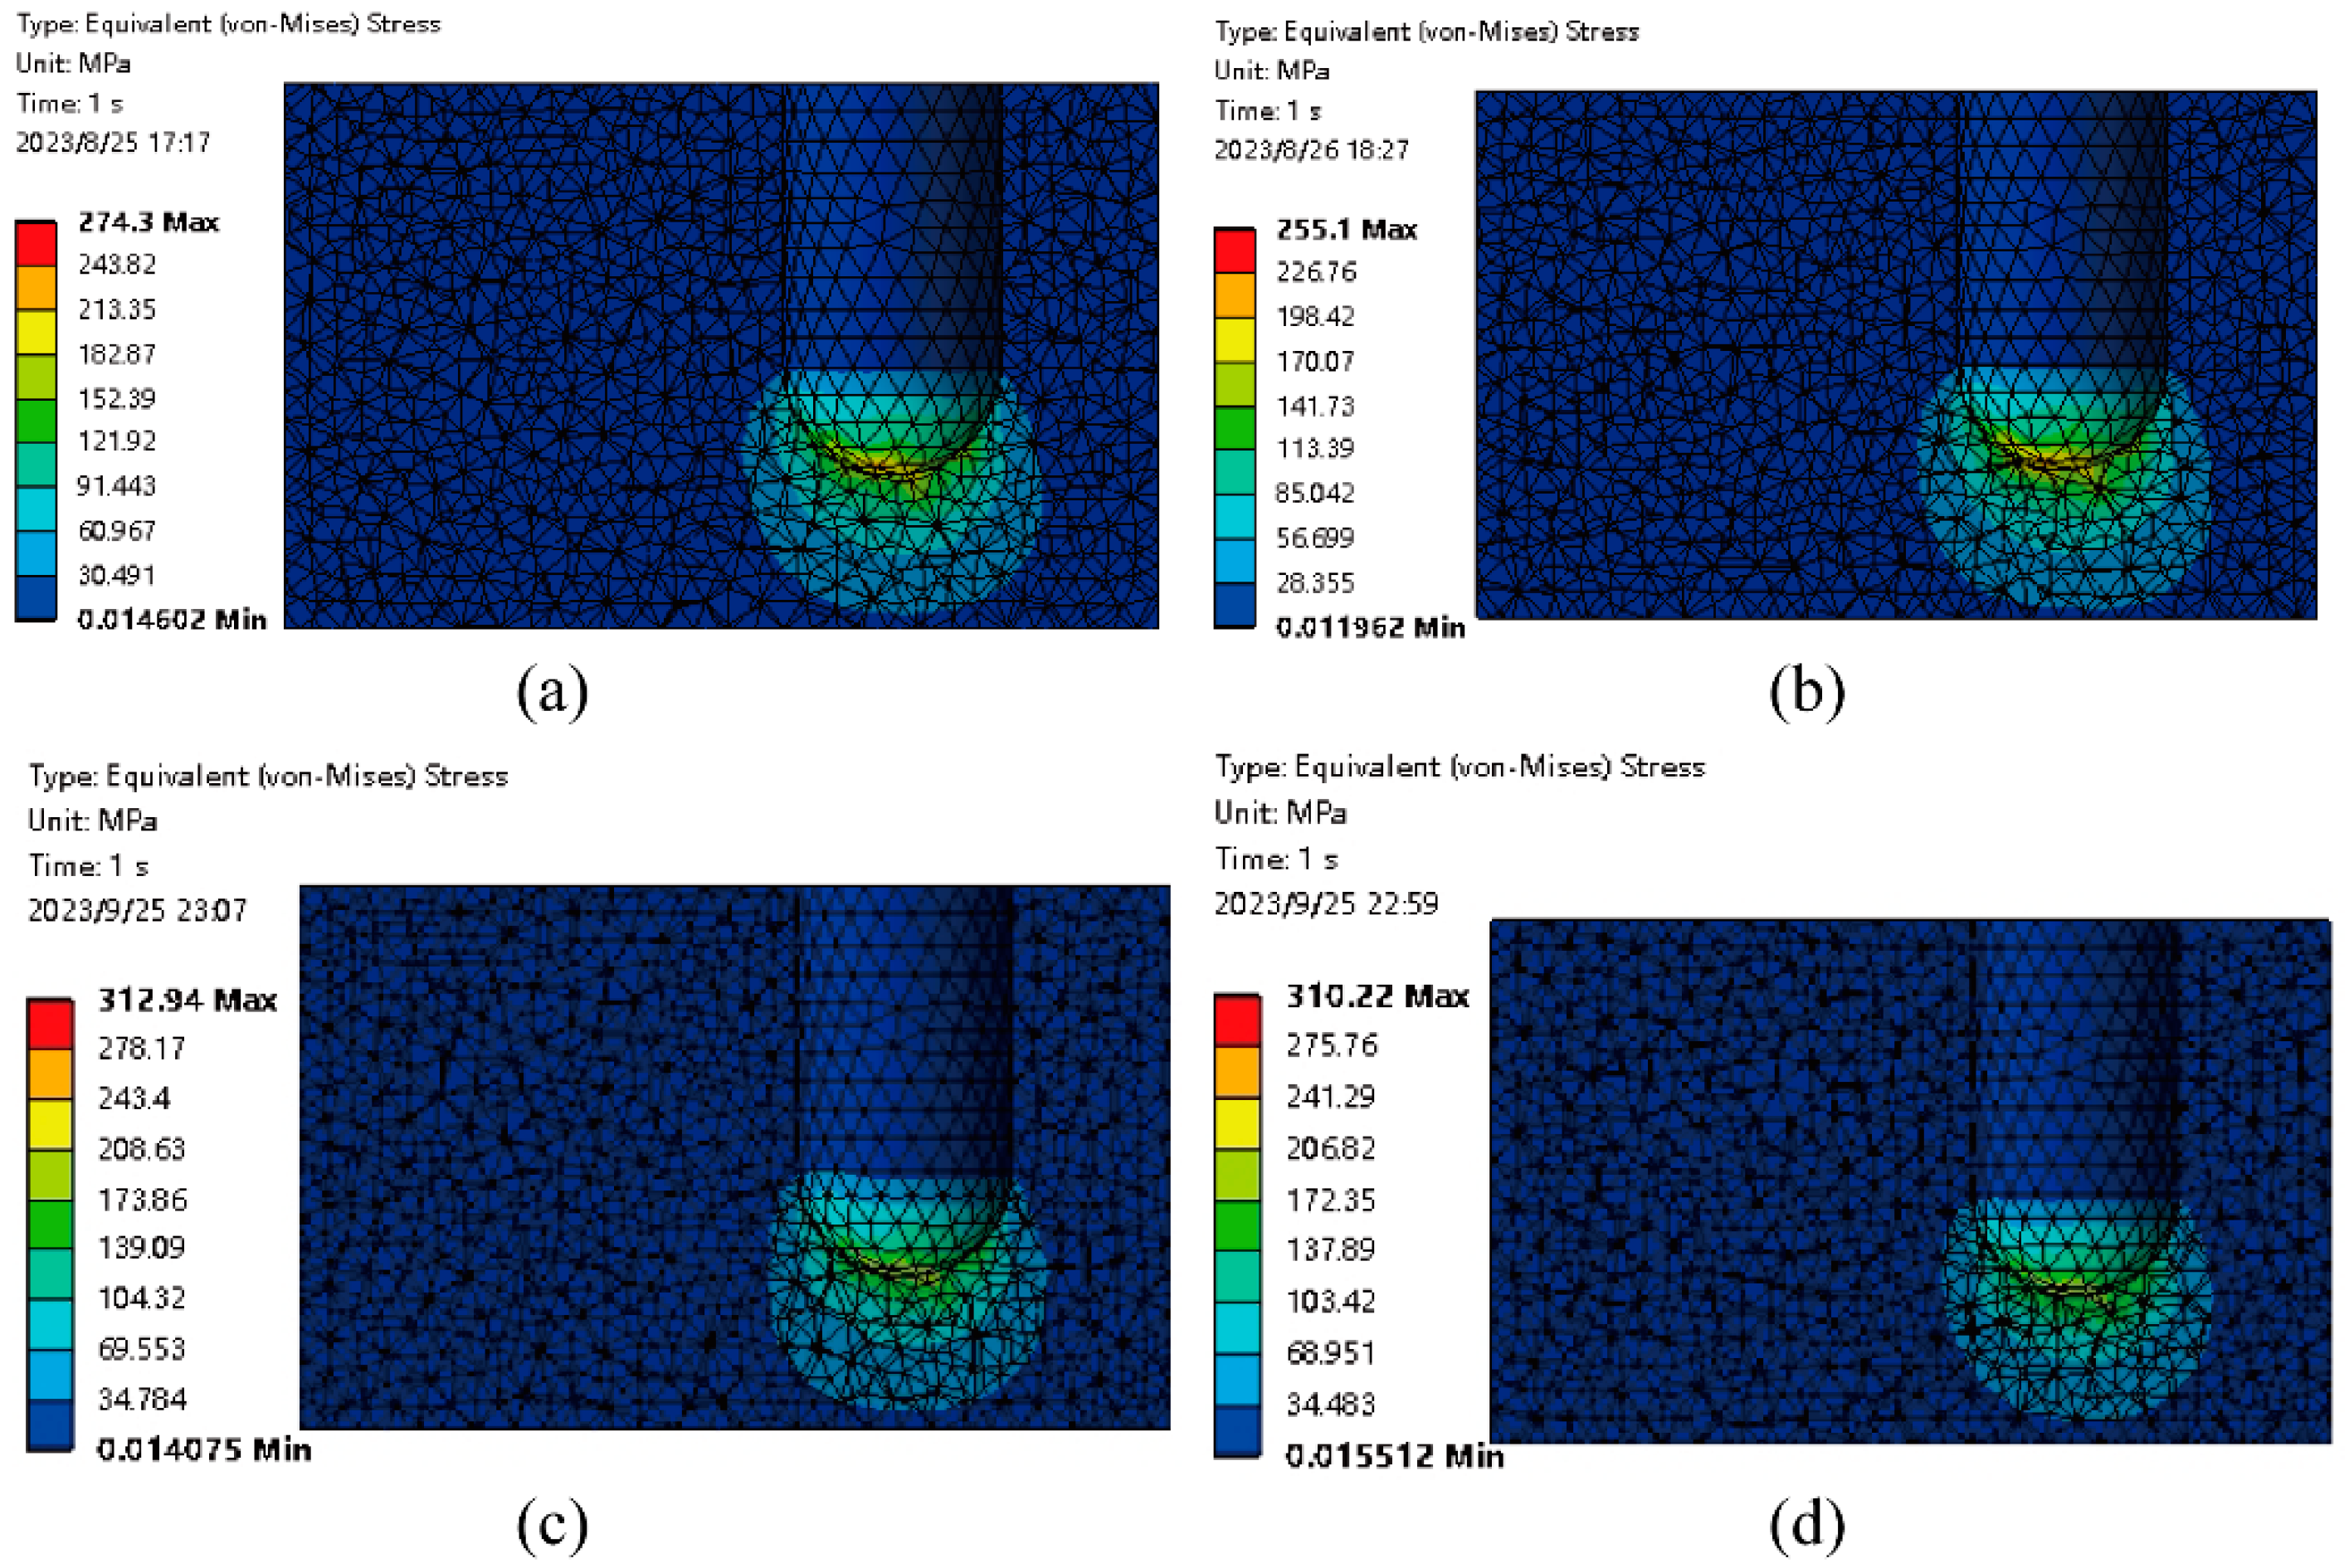
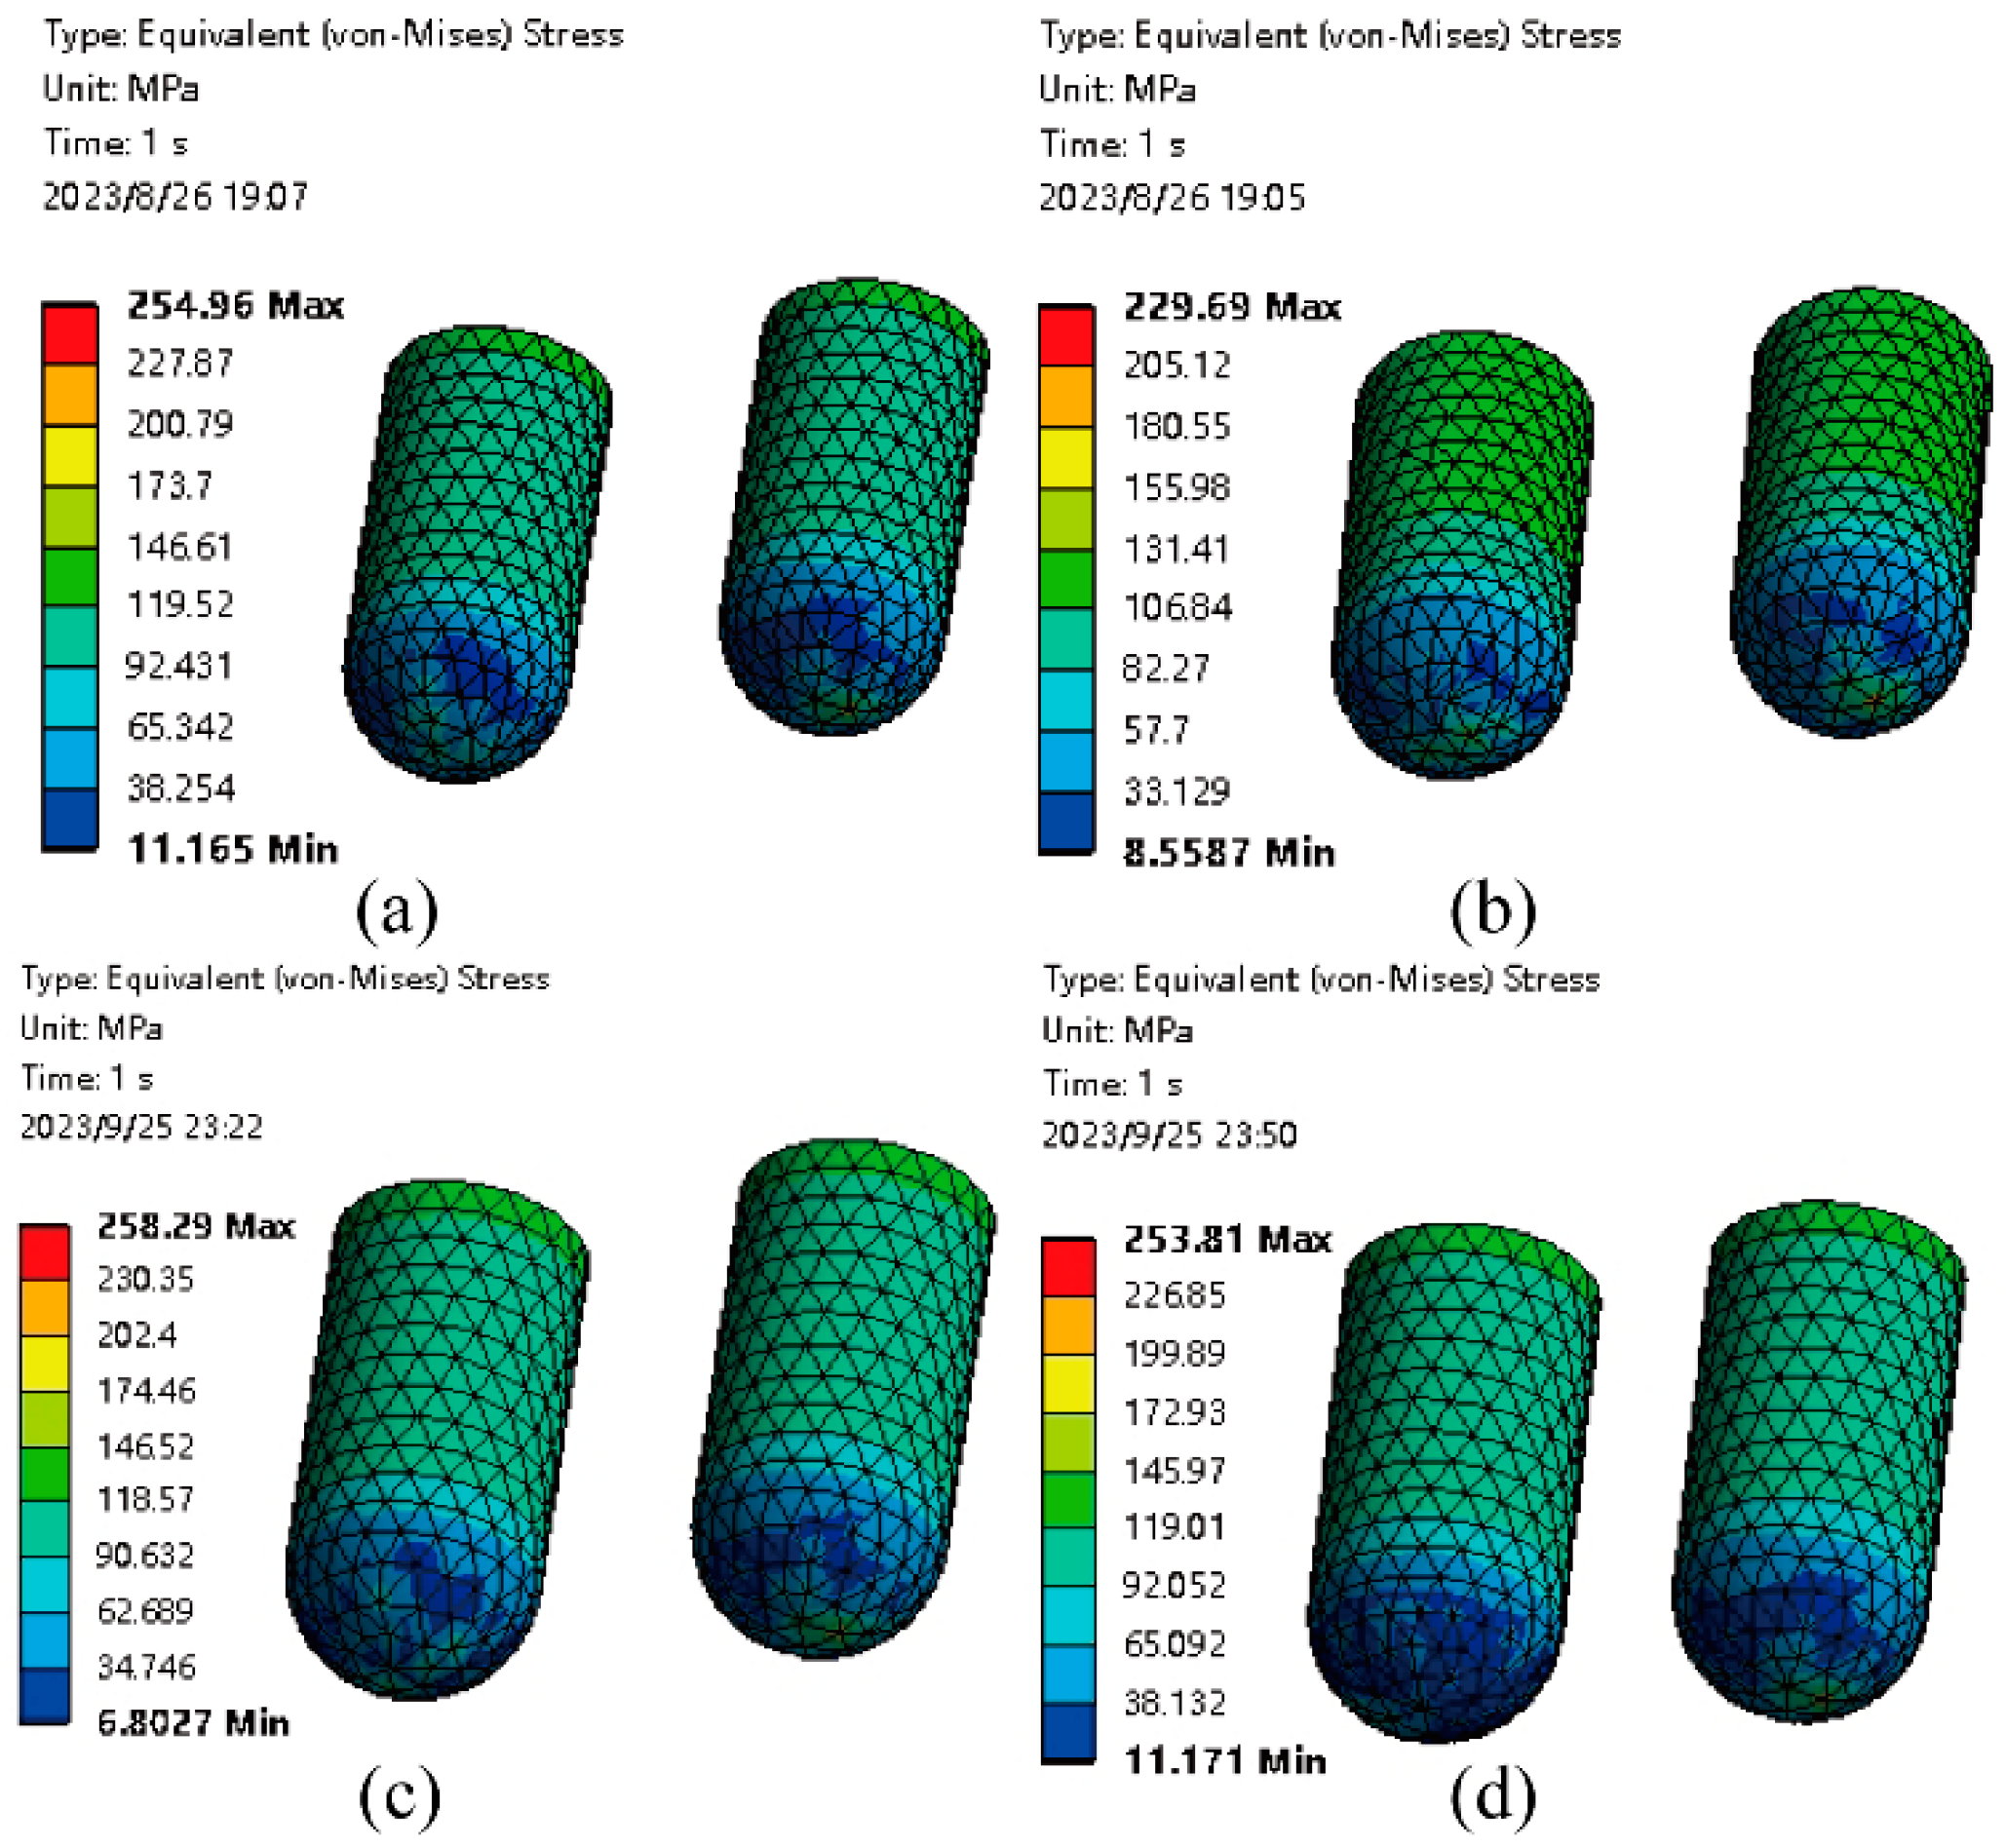
When the circumferential distance between the studs is gradually reduced, it is found that the maximum equivalent stress on the stud-lining first decreases and then increases. When the circumferential distance between studs is reduced by 4 mm, the maximum equivalent stress on the stud-lining is the smallest. When the circumferential distance between studs is gradually increased, the maximum equivalent stress of the stud-lining fluctuates up and down, and the fluctuation range is small. When the x distance increases by 6 mm, the maximum equivalent stress on the stud-lining is the smallest. Figure 14a shows the stress distribution diagram of the stud-lining increase of 6 mm in the x direction. It can be found that the stress gradually increases from top to bottom along the spherical bottom, and the maximum value appears at the apex of the spherical bottom. Figure 14b shows the stress distribution diagram of the stud-lining increased by 2 mm in the y direction, and the stress distribution is the same as Figure 14a. Figure 14c,d is the maximum stress cloud diagram after changing the circumferential and axial distance. By comparing Figure 14a,b and Figure 14c,d, it is found that the stress concentration area in Figure 14a,b is reduced, and the stress value is also significantly reduced. The main stress is concentrated at the spherical stud hole.
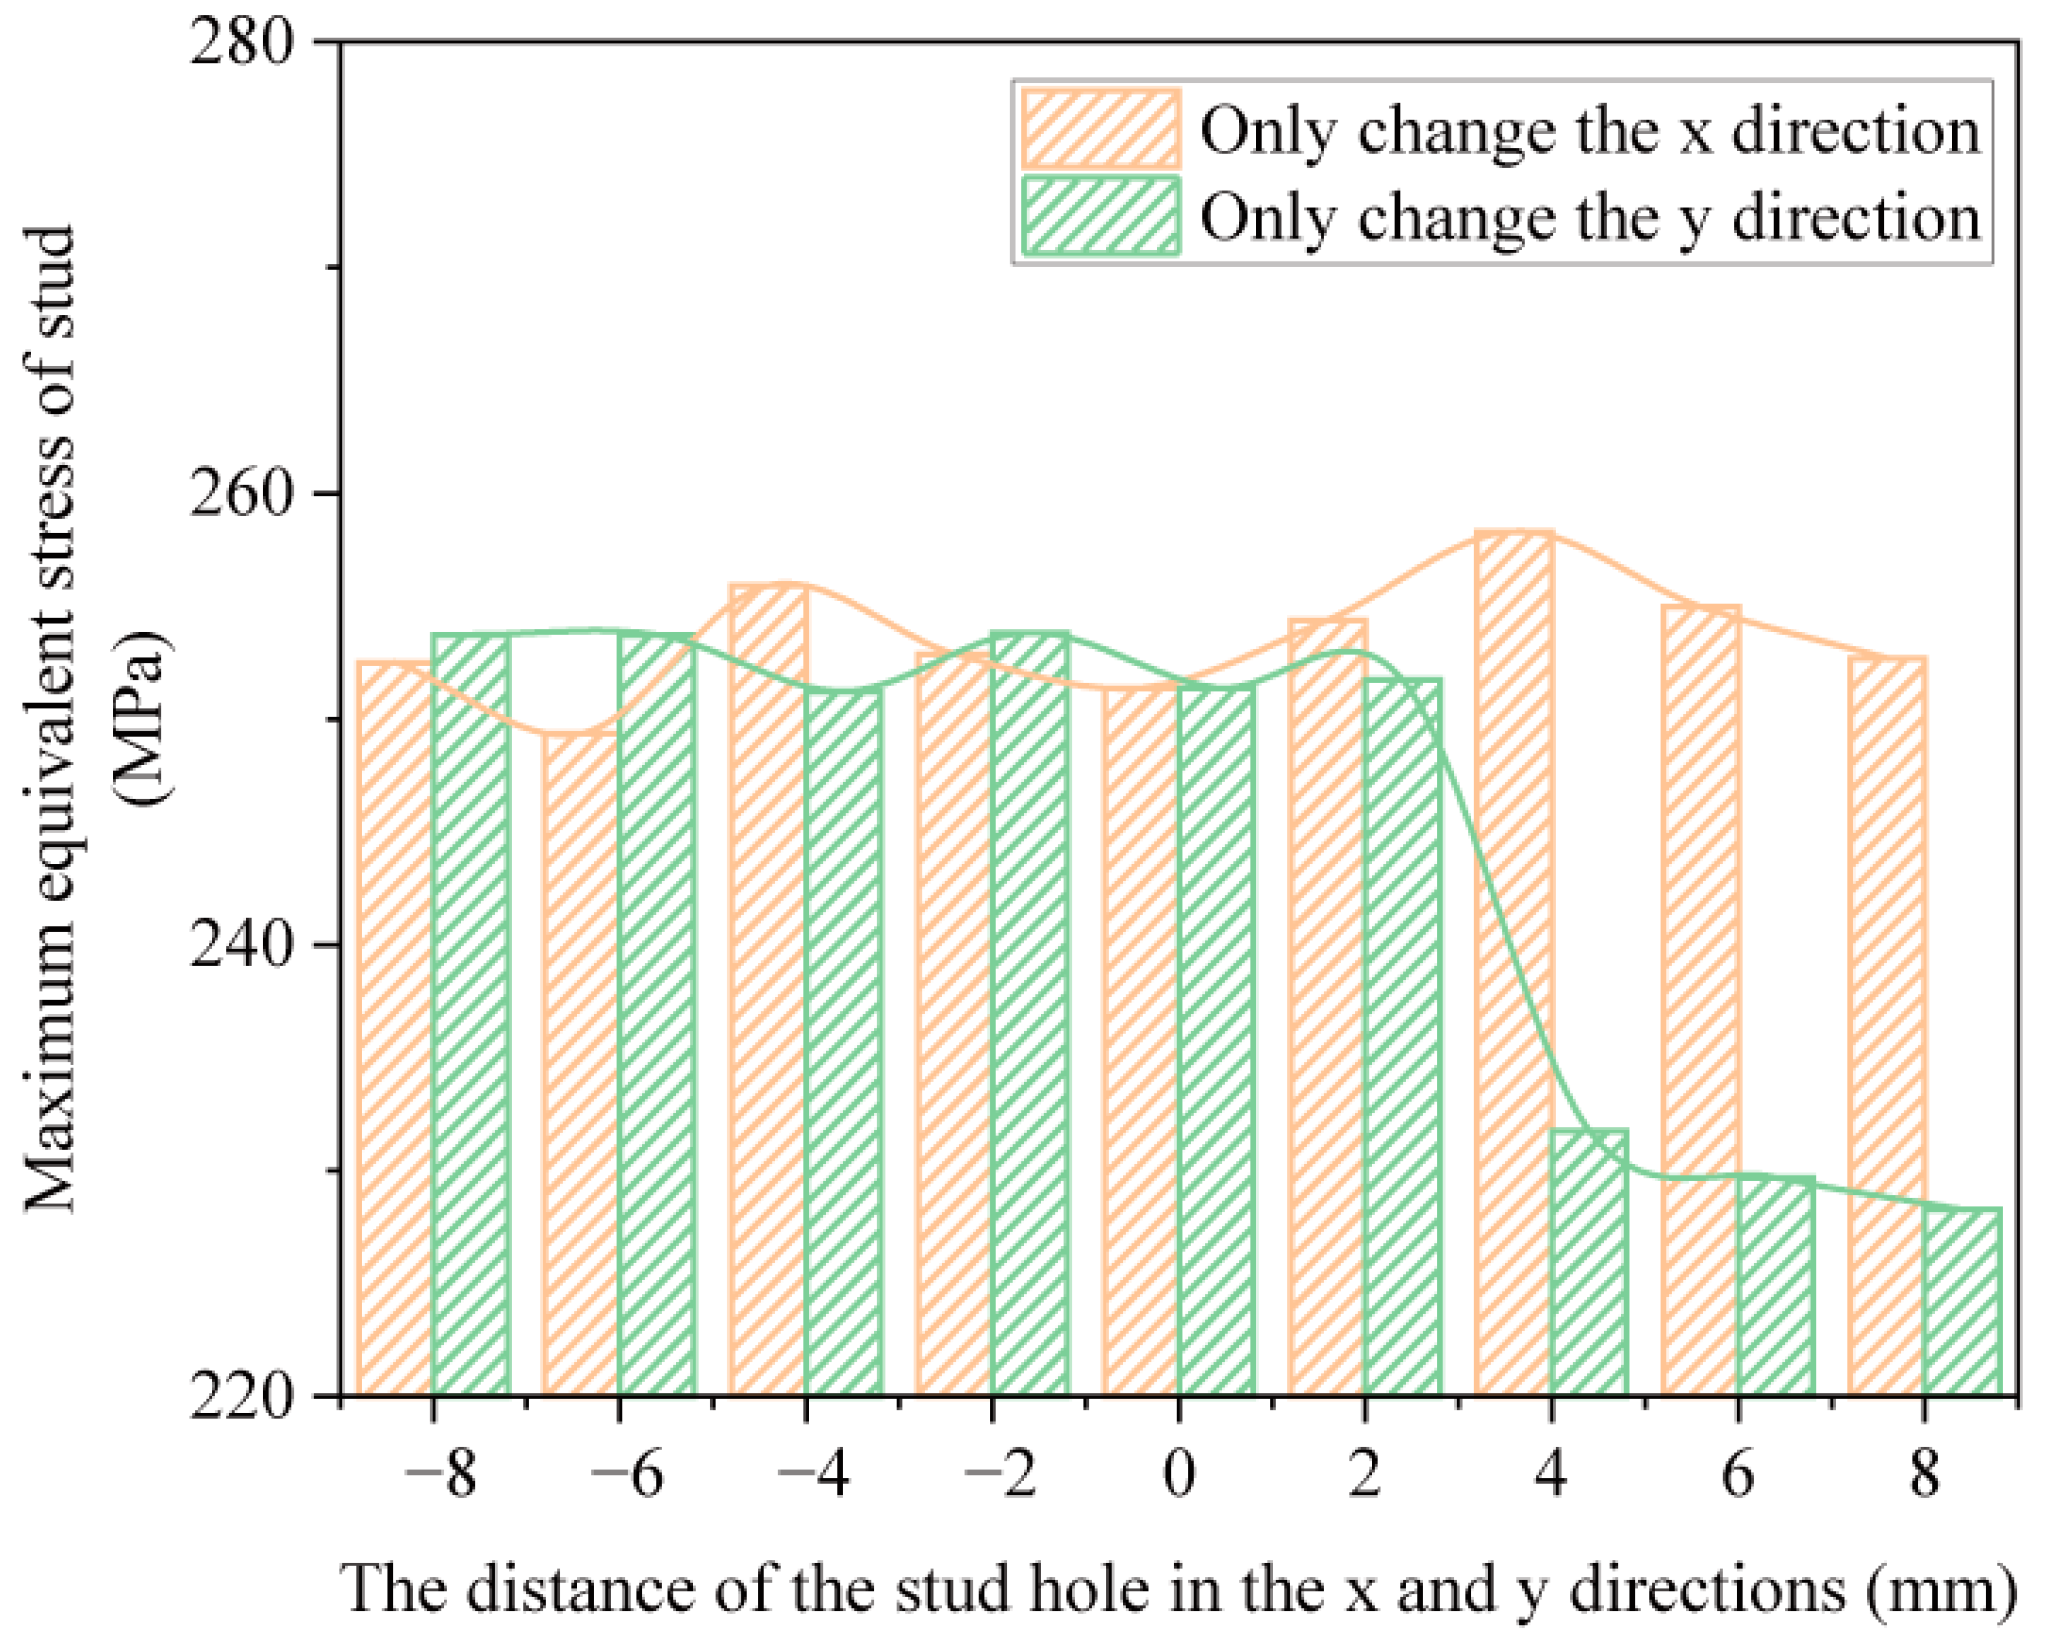
As shown in Figure 15, the histogram of the maximum equivalent stress of the stud in the x and y directions. When the distances in the x and y directions of the studs are respectively reduced, the equivalent stress of the studs no obvious change significantly, and only slightly fluctuates. However, when the distance in the x and y directions is increased, the equivalent stress of the stud changes significantly. Especially when the distance in the y direction is increased by more than 2 mm, the equivalent stress of the stud has dropped significantly, but as the distance in the y direction continues to increase, the equivalent stress of the stud no obvious change significantly.
Figure 16 shows the stress distribution diagram of the stud increased by 6 mm in the x and y directions respectively. At this time, the maximum equivalent stress on the stud is minimum. It can be found that the equivalent stress of the stud is mainly distributed on the lateral circumferential surface, and the stress at the junction of the spherical bottom and the lateral circumferential surface is smaller. The stress maximum occurs at the spherical bottom apex. According to the actual processing of studded rolls, combined with the change of the distance between the studs and the stud-lining in the x and y directions. Through the stress changes at different distances between the stud and the stud-lining, conclusions can be drawn: When the x direction is increased by 6 mm and the y direction is increased by 2–4 mm, the maximum equivalent stress of the stud and stud-lining is optimal. The stress in Figure 16a,c,d is mainly distributed on the lateral cylindrical surface of the stud, and the stress area at the top of the stud is smaller than the lateral cylindrical surface. The stress values of the side cylinder and the upper of the stud in Figure 16b are close to each other, and the stress distribution is relatively uniform. By comparing the maximum stress and the minimum stress of the studs, the stress distribution is basically the same. The maximum stress occurs at the spherical bottom of the stud. The stress is smallest at the connection between the side cylinder surface and the spherical bottom, indicating that the stress of the studs at the spherical bottom is evenly distributed.
(4)
Stress changes in different lengths of stud
Currently, the actual studded rolls produced by the studded rolls manufacturer is installed so that the outer round surface of the stud is 4 mm higher than the stud-lining, which is obtained through experience. In order to analyze the influence of stud length on stress, it is divided into the following two aspects. First, reduce the stud hole depth without changing the stud length. Secondly, increase the depth of the stud hole without changing the height of the stud above the stud-lining surface.
First, reduce the depth of the stud holes. Set the 36 mm stud hole depth to the initial depth, set to x = 0. Then gradually reduce the depth of the stud holes. Select stud hole depth 33 mm, 30 mm, 27 mm. The FEM simulation was conducted using the same load and constraint conditions as (2). Through FEM simulation, it is found that the maximum deformation position of the model occurs at the stud upper surface. The maximum equivalent stress of the stud gradually decreases with the decrease in the depth of the stud hole. The maximum equivalent stress of the stud-lining shows a decreasing trend as the depth of the stud hole decreases. At x = −6 mm, the maximum equivalent stress of the stud-lining increases slightly. As shown in Figure 17. Through the cloud map of the total deformation of the model, it can be found that with the decrease of the stud hole depth, the deformation zone of the model decreases gradually, but the maximum deformation tends to increase. Change the finite element model of the studded rolls to a distance of 4 mm above the stud-lining surface that fixes the upper surface of the stud. By increasing the length of the stud and the depth of the stud hole, observe the changes in model deformation and stress. Select stud hole depth 39 mm, 42 mm, 45 mm, 48 mm. Apply the same pressure as (2). The simulation constraints are the same as above. As show in Figure 17, with the increase in the length of the stud and depth of the stud hole, the maximum equivalent stress of the stud gradually decreases, with a smaller amplitude. When the length of the stud and depth of the stud hole both increase by 3 mm, the maximum equivalent stress of the stud-lining increases sharply, and then gradually decreases. Through the cloud diagram of the total deformation of the model, it can be found that with the increase of the length of the stud and depth of the stud hole, the deformation area of the stud increases gradually. However, the maximum total deformation of the model is slightly reduced.
Through the simulation of different lengths of studs and depth of the stud hole, the following conclusions can be drawn. Under the condition that the length of the stud remains constant, gradually reduce the depth of the stud hole. The maximum equivalent stress of the stud and the stud-lining no obvious change significantly, and the total deformation no obvious change significantly. When the upper surface of the stud is 4 mm higher than the stud-lining surface, the depth of stud hole is increased, and the maximum effective stress of stud and stud-lining also has the same trend. Therefore, when the length of stud is 40 mm and the depth of stud hole is 36 mm, the model of stud and stud is the best.

3.2.2. Initial Optimization Design of Stud-Lining

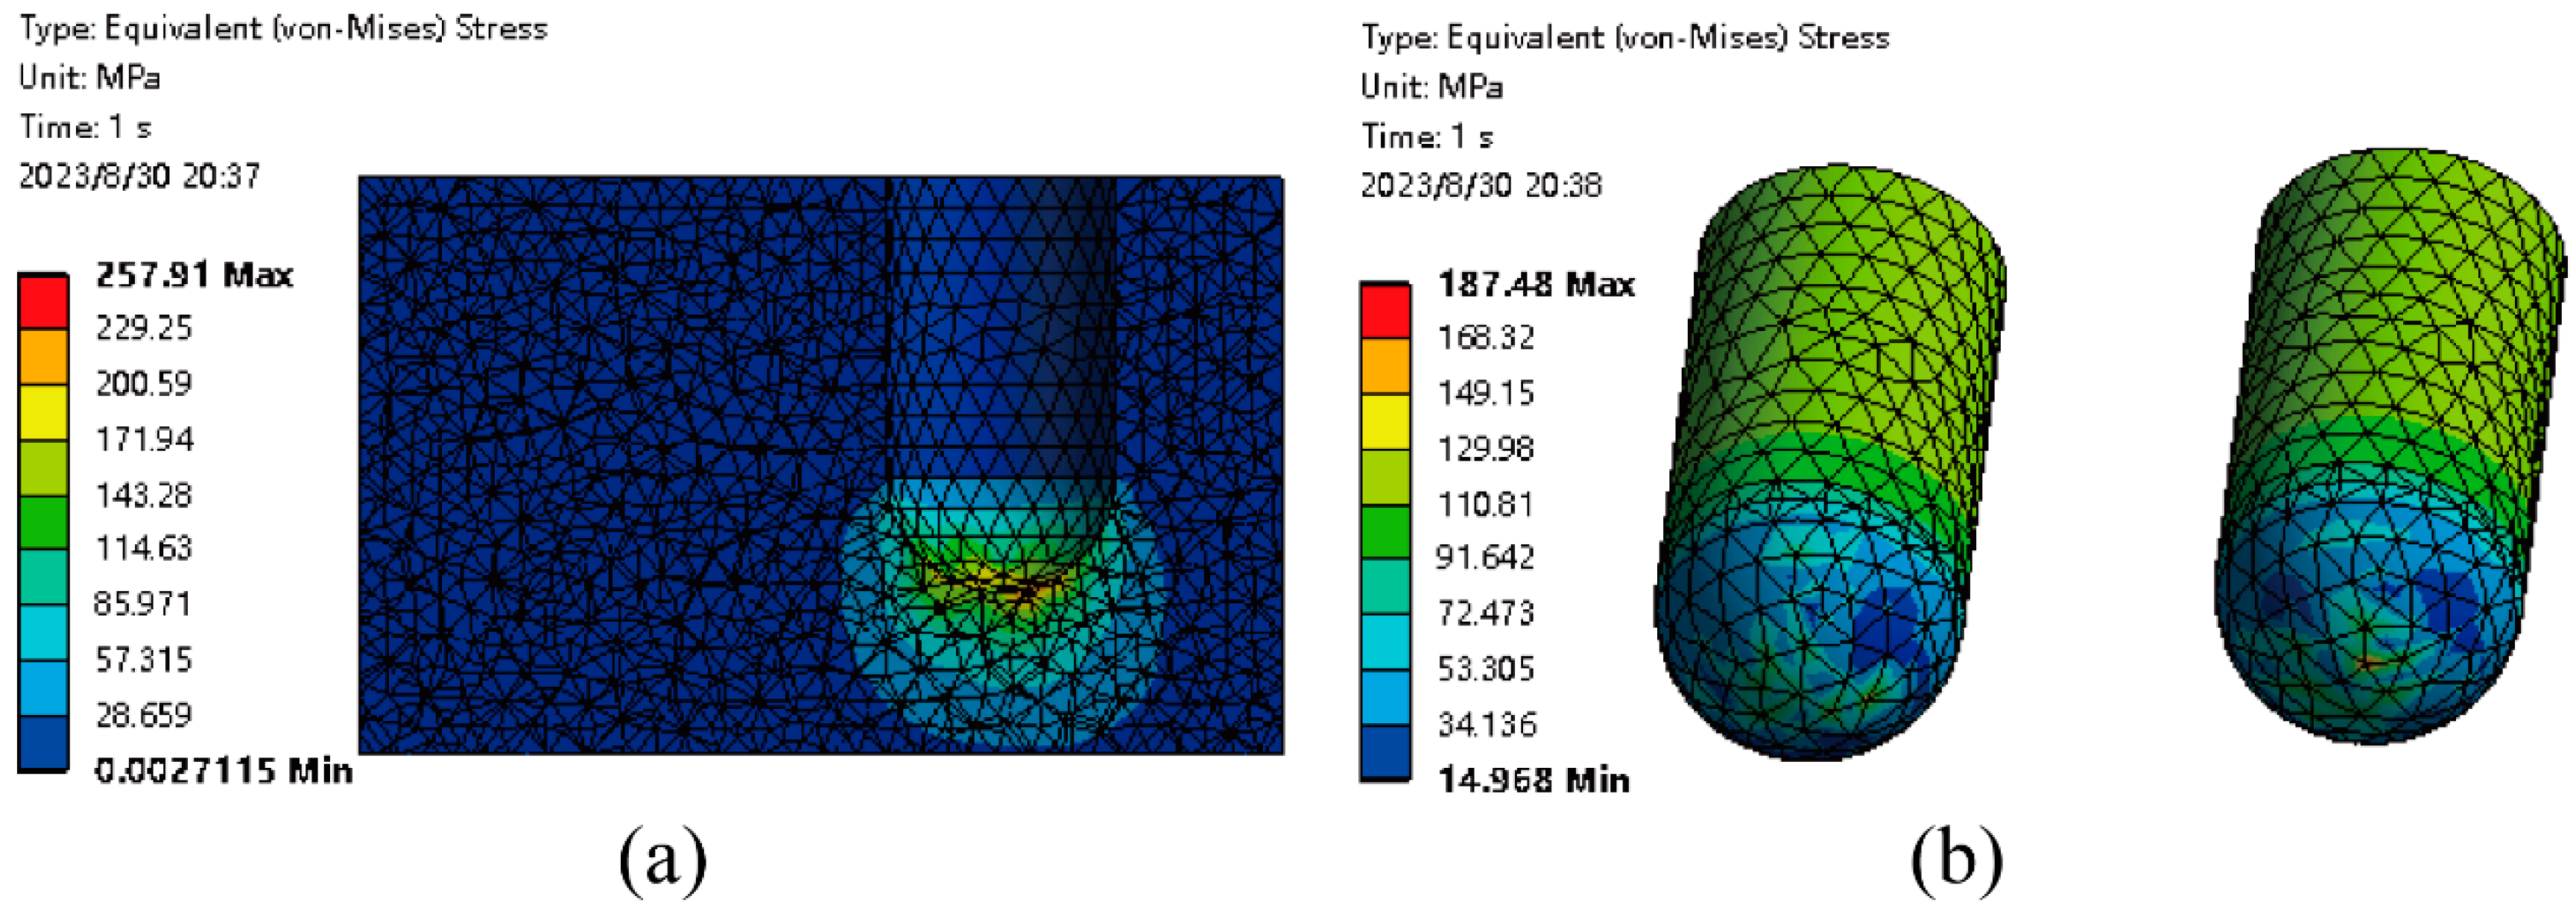
Through the simulation analysis of the assembly method between the studs and the stud-lining, the distance between the studs and the length of the studs. The finite element models of studs and stud-lining were optimized. Select the assembly method of the studs as clearance fit, and the gap value is 0.08 mm. The distance between stud is selected as x = 31.676 mm, y = 18.625 mm. The stud length is selected to be 40 mm. The height of the stud above the stud-lining surface is selected to be 4 mm. As shown in Figure 18. Through the equivalent stress cloud diagram of studs and stud-lining, it can be found that after optimizing the models of studs and stud-lining, the maximum equivalent stress is significantly reduced. The distribution position of stress remains basically unchanged. The maximum equivalent stress of the optimized model is about 30% lower than that of the unoptimized model with a gap value of 0.08 mm.
As shown in Figure 19a, it can be found that the maximum equivalent stress of the stud-lining is reduced by about 11% compared to the model with unoptimized distance between studs x = 25.676 mm and y = 16.625 mm. Figure 19b is the equivalent stress cloud diagram of the stud after optimization. By comparing with the unoptimized distance between studs x = 25.676 mm and y = 16.625 mm, it was found that the maximum equivalent stress dropped by about 25%.
Combined with the changes in the equivalent stress of the studs and stud-lining in Section 3.2.1, the models of the studs and stud-lining were optimized. The optimal assembly method of studs and stud-lining, the optimal distance between studs and the optimal height of studs above the stud-lining were obtained. The maximum stress of both studs and stud-lining has been significantly reduced. Through simulation optimization, the stress on the studs and stud-lining was reduced, providing theoretical data for extending the service life of the studded rolls.

4. Conclusions

In this paper, the surface pressure distribution of the studded rolls is studied, the contact pressure and stress distribution among the studded rolls, the stud and the stud-lining are studied respectively, and the finite element optimization design is carried out. Theoretical data are provided for the optimization of studded rolls.
  • Based on the compression and rebound characteristics of the material layer, the surface pressure of the roller press was calculated. Optimize the pressure calculation method suitable for the studded rolls surface. Through the FEM, the contact pressure and equivalent stress of the roller shaft and the stud-lining are calculated, compared with the theoretical calculation values, and the roller shaft and the stud-lining are further optimized. The contact pressure between the roller shaft and the stud-lining is reduced.
  • The change of equivalent stress between stud and stud-lining in different nip angle of studded rolls are analyzed. It is found that the maximum equivalent stress between stud and stud-lining occurs at the minimum gap between the two rolls and is symmetrically distributed on both sides. The assembling method between the stud and the stud-lining, the distance between the studs, the length of the stud and the height of the stud above the stud-lining are simulated and calculated. The influence of them on the stress of the studs and the stud-lining are analyzed.
  • Optimize the design by combining the assembly method of studs and stud-lining, the distance between studs, and the height of studs above the stud-lining. After optimizing the design, the maximum equivalent stress of the stud and the stud-lining is effectively reduced. It provides a theoretical basis for optimizing the rolls surface of studded rolls.

Author Contributions

Conceptualization, F.W. and J.D.; methodology, F.W. and J.D.; software, F.W. and J.D.; formal analysis, G.S.; investigation, F.W.; writing—original draft preparation, F.W.; writing—review and editing, J.D.; supervision, G.S.; funding acquisition, J.D. All authors have read and agreed to the published version of the manuscript.

Funding

This work was supported by the Natural Science Foundation of China (52275438, 51675289), The Natural Science Foundation of Shandong Province (ZR2020ME160) and the Basic research project of pilot project of integration of science, education and production (Qilu University of Technology (Shandong Academy of Sciences)) (2022PY007).

Institutional Review Board Statement

Not applicable.

Informed Consent Statement

Not applicable.

Data Availability Statement

The data not publicly available due to privacy.

Acknowledgments

We also thank Yinling Li, Haichuan Shi and Jincheng Huang for them help with data and financial support.

Conflicts of Interest

The authors declare no conflict of interest.

References

  1. Abouzeid, A.-Z.M.; Fuerstenau, D.W. Grinding of mineral mixtures in high-pressure grinding rolls. Int. J. Miner. Process. 2009, 93, 59–65. [Google Scholar] [CrossRef]
  2. Rashidi, S.; Rajamani, R.K.; Fuerstenau, D.W. A Review of the Modeling of High Pressure Grinding Rolls. KONA Powder Part. J. 2017, 34, 125–140. [Google Scholar] [CrossRef]
  3. Tavares, L.M. Particle weakening in high-pressure roll grinding. Miner. Eng. 2004, 18, 651–657. [Google Scholar] [CrossRef]
  4. Dundar, H.; Benzer, H.; Aydogan, N. Application of population balance model to HPGR crushing. Miner. Eng. 2013, 50–51, 114–120. [Google Scholar] [CrossRef]
  5. Aydoğan, N.A.; Ergün, L.; Benzer, H. High pressure grinding rolls (HPGR) applications in the cement industry. Miner. Eng. 2006, 19, 130–139. [Google Scholar] [CrossRef]
  6. Ghorbani, Y.; Mainza, A.N.; Petersen, J.; Becker, M.; Franzidis, J.-P.; Kalala, J.T. Investigation of particles with high crack density produced by HPGR and its effect on the redistribution of the particle size fraction in heaps. Miner. Eng. 2013, 43–44, 44–51. [Google Scholar] [CrossRef]
  7. Ruonan, M.; Qinglin, Z.; Miaomiao, W.; Quanming, L.; Mingkai, Z. A Survey and Analysis on Electricity Consumption of Raw Material Mill System in China Cement Industry between 2014 and 2019. Sustainability 2021, 13, 1126. [Google Scholar]
  8. Genç, Ö.; Benzer, A.H. Effect of High Pressure Grinding Rolls (HPGR) pre-grinding and ball mill intermediate diaphragm grate design on grinding capacity of an industrial scale two-compartment cement ball mill classification circuit. Minerals Engineering 2016, 92, 47–56. [Google Scholar] [CrossRef]
  9. Sesemann, Y.; Broeckmann, C.; Höfter, A. A new laboratory test for the estimation of wear in high pressure grinding rolls. Wear 2013, 302, 1088–1097. [Google Scholar] [CrossRef]
  10. Van Der Meer, F.P.; Gruendken, A. Flowsheet considerations for optimal use of high pressure grinding rolls. Miner. Eng. 2010, 23, 663–669. [Google Scholar] [CrossRef]
  11. Barrios, G.K.P.; Tavares, L.M. A preliminary model of high pressure roll grinding using the discrete element method and multi-body dynamics coupling. Int. J. Miner. Process. 2016, 156, 32–42. [Google Scholar] [CrossRef]
  12. Rodriguez, V.A.; Barrios, G.K.P.; Bueno, G.; Tavares, L.M. Coupled DEM-MBD-PRM simulations of high-pressure grinding rolls. Part 1: Calibration and validation in pilot-scale. Miner. Eng. 2022, 177, 107389. [Google Scholar] [CrossRef]
  13. Rodriguez, V.A.; Barrios, G.K.P.; Tavares, L.M. Coupled DEM-MBD-PRM simulations of high-pressure grinding rolls. Part 2: Investigation of roll skewing. Miner. Eng. 2022, 178, 107428. [Google Scholar] [CrossRef]
  14. Chengwei, Z.; Yudong, Z.; Dazhao, G.; Aibing, Y.; Runyu, Y. Experimental and numerical investigation of particle size and particle strength reduction in high pressure grinding rolls. Powder Technol. 2022, 410, 117892. [Google Scholar]
  15. Zou, Y.; Zhang, C.; Gou, D.; Cheng, G.; Yang, R. DEM analysis of wear evolution and its effect on the operation of a lab-scale HPGR mill. Miner. Eng. 2023, 204, 108401. [Google Scholar] [CrossRef]
  16. Cleary, P.W.; Sinnott, M.D. Axial pressure distribution, flow behaviour and breakage within a HPGR investigation using DEM. Miner. Eng. 2021, 163, 106769. [Google Scholar] [CrossRef]
  17. Anticoi, H.; Guasch, E.; Oliva, J.; Alfonso, P.; Bascompta, M.; Sanmiquel, L. High-pressure grinding rolls: Model validation and function parameters dependency on process conditions. J. Mater. Res. Technol. 2019, 8, 5476–5489. [Google Scholar] [CrossRef]
  18. Esnault, V.; Michrafy, A.; Heitzmann, D.; Michrafy, M.; Oulahna, D. Processing fine powders by roll press. Powder Technol. 2015, 270, 484–489. [Google Scholar] [CrossRef]
  19. Alex, T.; Jocelyn, B.; André, D. An off-line state observer of the slip, shear stress, and pressure profiles in the high-pressure grinding rolls crusher working gap. Adv. Powder Technol. 2021, 32, 3484–3498. [Google Scholar]
  20. Pamparana, G.; Klein, B. A methodology to predict the HPGR operational gap by using piston press tests. Miner. Eng. 2021, 166, 106875. [Google Scholar] [CrossRef]
  21. Lim, W.I.L.; Weller, K.R. Some benefits of using studded surfaces in high pressure grinding rolls. Miner. Eng. 1999, 12, 187–203. [Google Scholar] [CrossRef]
  22. Rashidi, S.; Diedenhofen, S.; Simmons, A. Implementation of Studded Roll Bodies for Raw Material HPGR Grinding System. In Proceedings of the 2021 IEEE-IAS/PCA Cement Industry Technical Conference, IAS/PCA 2021, Virtual, 24–28 May 2021. [Google Scholar]
  23. Saramak, D.; Foszcz, D.; Gawenda, T.; Konieczny, A.; Pawlos, W. Influence of type of lining in highpressure grinding rolls on effectiveness of copper ore comminution. Physicochem. Probl. Miner. Process. 2016, 52, 182–192. [Google Scholar] [CrossRef]
  24. Oberheuser, G. Wear protection of surfaces from high pressure grinding rolls: Possibilities and limits. Int. J. Miner. Process. 1996, 44, 561–568. [Google Scholar] [CrossRef]
  25. Kazerani Nejad, R.; Sam, A. The wear pattern in high pressure grinding rolls. Miner. Process. Extr. Metall. 2016, 126, 238–244. [Google Scholar] [CrossRef]
  26. Nagata, Y.; Tsunazawa, Y.; Tsukada, K.; Yaguchi, Y.; Ebisu, Y.; Mitsuhashi, K.; Tokoro, C. Effect of the roll stud diameter on the capacity of a high-pressure grinding roll using the discrete element method. Miner. Eng. 2020, 154, 106412. [Google Scholar] [CrossRef]
  27. Uttarwar, K.; Sonawwanay, P.D.; Bhosale, S. Finite element analysis of high-pressure grinding rolls for crack prediction to determine safe working conditions. Mater. Today Proc. 2022, 56, 2952–2959. [Google Scholar] [CrossRef]
  28. Weihua, W.; Fangxu, P.; Yingli, L.; Bingrui, C.; Yiqi, X.; Yu, W. Optimization Design of Extrusion Roller of RP1814 Roller Press Based on ANSYS Workbench. Appl. Sci. 2021, 11, 9584. [Google Scholar]
  29. Michrafy, A.; Diarra, H.; Dodds, J.A.; Michrafy, M.; Penazzi, L. Analysis of strain stress state in roller compaction process. Powder Technol. 2011, 208, 417–422. [Google Scholar] [CrossRef]
  30. Alex, T.; Jocelyn, B.; André, D. A steady-state model of the high-pressure grinding rolls. IFAC PapersOnLine 2020, 53, 11830–11835. [Google Scholar]
  31. Dec, R.T.; Zavaliangos, A.; Cunningham, J.C. Comparison of various modeling methods for analysis of powder compaction in roller press. Powder Technol. 2003, 130, 265–271. [Google Scholar] [CrossRef]
  32. Yehia, K.A. Estimation of roll press design parameters based on the assessment of a particular nip region. Powder Technol. 2007, 177, 148–153. [Google Scholar] [CrossRef]
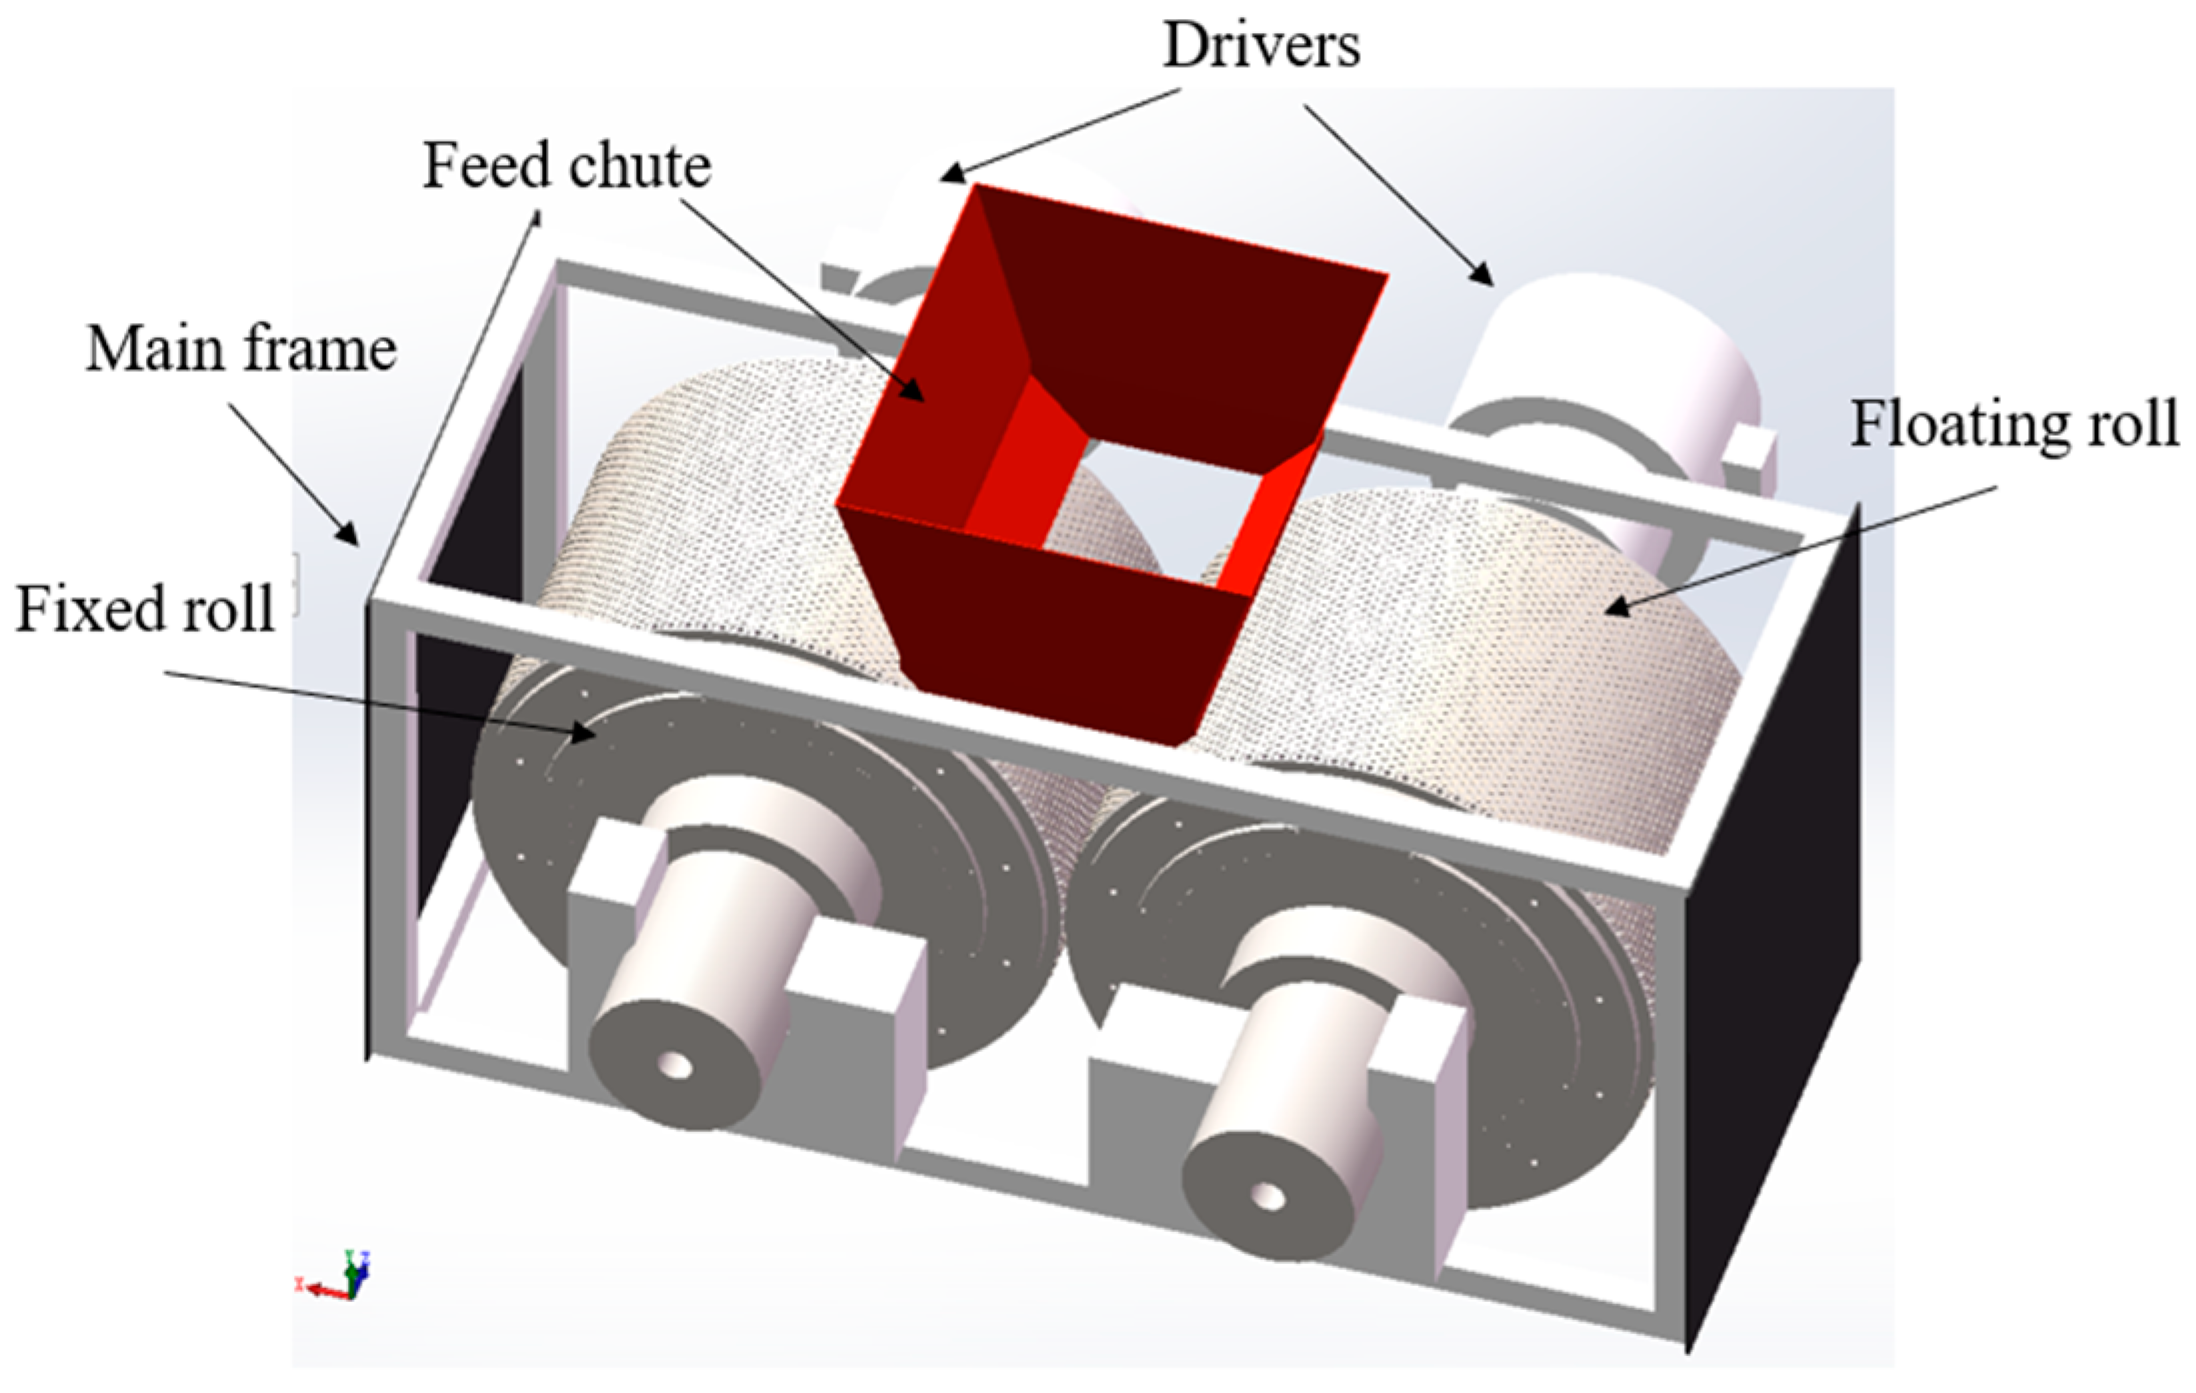
Figure 1. Schematic diagram of studded rolls.
Applsci 13 11032 g001
Figure 3. Working diagram of roller press.
Applsci 13 11032 g003
Figure 4. Finite element model of studded rolls.
Applsci 13 11032 g004
Figure 5. (ac) the cloud image of the initial studded rolls; (a1c1) the cloud image of studded rolls after optimization. (a,a1) Contact pressure; (b,b1) Equivalent stress of stud-lining; (c,c1) Equivalent stress of roller shaft.
Applsci 13 11032 g005
Figure 6. Schematic diagram of the cross section of the stud and the stud-lining.
Applsci 13 11032 g006
Figure 7. Schematic diagram of compression zone and rebound zone of studded rolls.
Applsci 13 11032 g007
Figure 8. Maximum equivalent stress of rolls surface and stud at different nip angle.
Applsci 13 11032 g008
Figure 9. Cloud diagram of (ad) equivalent stress (a1d1) total deformation of stud-lining and stud with different gap values.
Applsci 13 11032 g009
Figure 10. Cloud diagram of (ad) equivalent stress (a1d1) total deformation of stud-lining and stud with different interference.
Applsci 13 11032 g010
Figure 11. The maximum equivalent stress under different assembly.
Applsci 13 11032 g011
Figure 12. Schematic diagram of initial distance of stud in axial and circumferential direction.
Applsci 13 11032 g012
Figure 13. The histogram of the maximum equivalent stress of the stud-lining with different distances in the x and y directions.
Applsci 13 11032 g013
Figure 14. Stress distribution diagram of stud-lining at different axial and circumferential distances: (a) Increase the 6 mm along the x direction; (b) Increase the 2 mm along the y direction; (c) Reduce the 8 mm along the x direction; (d) Increase the 6 mm along the y direction.
Applsci 13 11032 g014
Figure 15. The histogram of the maximum equivalent stress of the stud with different distances in the x and y directions.
Applsci 13 11032 g015
Figure 16. Stress distribution diagram of stud at different axial and circumferential distances: (a) Increase the 6 mm along the x direction; (b) Increase the 6 mm along the y direction; (c) Increase the 4 mm along the x direction; (d) Reduce the 2 mm along the y direction.
Applsci 13 11032 g016
Figure 17. The histogram of the maximum equivalent stress of the stud and stud-lining.
Applsci 13 11032 g017
Figure 18. Stress cloud diagram of stud-lining and stud after optimization.
Applsci 13 11032 g018
Figure 19. Stress cloud diagram of stud-lining and stud after optimization: (a) Stress cloud diagram of stud-lining; (b) Stress cloud diagram of stud.
Applsci 13 11032 g019
Table 1. Horizontal pressure corresponding to different nip angles of the roller press.
λ α p(α, λ)p1(α, λ)
0−23.1773282954.32116648
−145.8227045562.3188781
093.64323785127.354803
167.1581672891.3351075
226.6719221336.2738141
36.7250009769.14600132
41.1604550231.57821883
50.1300278490.17683787
60.0070284570.00955870
Table 2. Material properties of studded rolls.
PartDensity
(kg/m3)
Elastic Modulus
(Pa)
Poisson’s Ratio
μ
Yield Strength
(MPa)
Roller Shaft78502.12 × 10 11 0.280930
Stud-lining78502.10 × 10 11 0.275835
Stud10,0006.05 × 10 11 0.275600
Disclaimer/Publisher’s Note: The statements, opinions and data contained in all publications are solely those of the individual author(s) and contributor(s) and not of MDPI and/or the editor(s). MDPI and/or the editor(s) disclaim responsibility for any injury to people or property resulting from any ideas, methods, instructions or products referred to in the content.