Abstract
To overcome the deficiencies in segmenting hot spots from thermal infrared images, such as difficulty extracting the edge features, low accuracy, and a high missed detection rate, an improved Mask R-CNN photovoltaic hot spot thermal image segmentation algorithm has been proposed in this paper. Firstly, the edge image features of hot spots were extracted based on residual neural networks. Secondly, by combining the feature pyramid structure, an edge-guided feature pyramid structure was designed, and the hot spot edge features were injected into a Mask R-CNN network. Thirdly, an infrared spatial attention module was introduced into the Mask R-CNN network when feature extraction and the infrared features of the detected hot spots were enhanced. Fourthly, the size ratio of the candidate frames was adjusted self-adaptively according to the structural characteristics of the aspect ratio of the hot spots. Finally, the validation experiments were conducted, and the results demonstrated that the hot spot contours of thermal infrared images were enhanced through the algorithm proposed in this paper, and the segmentation accuracy was significantly improved.
1. Introduction
With the deterioration of the environment and the reduction of fossil fuels, solar energy as a renewable energy source has received more and more attention. According to the development of the photovoltaic industry, it is expected that China’s installed PV capacity will be stabilized at 403 GW in 2025 [1].
During the operation of the solar power station, when a cell in the photovoltaic module appears to be obstructed by hidden cracks, bubbles, delamination, dirt, or internal connection failure, the product of the corresponding branch current and voltage increases, becoming the load impedance of the series branch and consuming the electrical energy generated by the normal string to generate heat. This increases the local temperature corresponding to the series branch and forms bright spots in thermal infrared imaging. The phenomenon is called the hot spot effect [2,3].
It can be seen from the generation process that the hot spot effect of photovoltaic panels not only affects the photoelectric conversion efficiency of the power generation system and the service life of PV modules but also causes permanent damage to the battery and even triggers fire and other safety hazards, resulting in serious economic losses [4,5]. Therefore, effective photovoltaic hot spot segmentation to achieve rapid diagnosis and localization of photovoltaic panel faults is of great practical significance for improving the intelligent operation and maintenance level of solar power plants.
However, in the actual process, the impact of damaged surfaces on spontaneous infrared radiation leads to poor quality and high noise in the generated infrared images. On the other hand, the current infrared imaging is mainly based on the surface temperature distribution of the target. The energy of spontaneous radiation is low, and background radiation is easy to produce a large interference with the measurement results, which causes the low resolution of the hot spot image and fuzzy boundaries caused by thermal cross, limiting the improvement of hot spot detection accuracy.
To solve the above problems, scholars around the world have proposed a series of processing algorithms that have been applied to photovoltaic hot spot image segmentation and achieved good results. Tsanakas et al. [6] proposed a fault diagnosis method that used ROI, contour lines, and histograms to analyze the applicability of thermal image processing and edge detection for defective photovoltaic modules, which provided promising detection results for the hotspot formations in specific defective cells in an observed module. Similar to Tsanakas, Moath Alsafasfeh et al. [7] also segment and detect internal defects and hot spots caused by external shading in PV models using morphological transformations and Canny edge detector algorithms. A. K. Vidal de Oliveira et al. [8] proposed an algorithm combining digital image processing with convolutional neural networks to automatically detect and classify photovoltaic faults. Firstly, the images were filtered using a Gaussian filter, the edges were highlighted through Laplacian operators, and then the fault area of the preprocessed image was segmented with a preset threshold. Finally, a dataset for training convolutional neural networks for fault classification was established with the segmented fault images, and validation experiments were conducted. The experimental results showed that the proposed method is very effective in automatic fault detection and classification of hot spots. Jiang Lin et al. [9] proposed a hot spot detection method based on grayscale histogram curve fitting to address the problems of high random noise and non-uniform clutter in thermal images caused by complex environments and emissivity uncertainty, in which the least squares fitting technique was used to fit some points where hot spots can be separated from photovoltaic modules. The separated points were utilized as thresholds to segment the hot spots from the background. Applying the method to detect hot spots in outdoor PV modules, the results show that hotspots can be effectively detected in the obtained images where the noise generated during the image acquisition process is suppressed. To efficiently visualize the heat generated by different sediments on the surface of solar panels, AS Chaudhary et al. [10] proposed a watershed transform image segmentation technique based on marking the heated area of the observed thermal image pseudo-colors. The heated area can be effectively segmented, and the hot spots were presented in a clear view. By extracting features from the visualized heated area, the severity of the heated part affecting the segmented binary image was demonstrated, and the visual effects were enhanced. In order to automatically identify the defects forming hot spots in solar photovoltaic systems, Ngo et al. [11] proposed a machine learning technique, combining K-Means color quantization and DBSCAN processing, to detect and separate the hot spot areas from the observed PV module infrared images under outdoor conditions. Applied to hot spot datasets, it was concluded by the proposed method that the hot spot area is related to the decrease in photovoltaic module efficiency.
From the above-mentioned review, it can be seen that the traditional hot spot segmentation algorithm methods are time-consuming and inefficient, though the detection accuracy can reach a certain extent by image feature extraction with human involvement. In recent years, with the continuous development of deep learning, the neural network algorithms for automatic segmentation of hot spots have been investigated by many more scholars around the world. Wang Xing et al. [12] proposed a novel PV panel condition monitoring and fault diagnosis technique in which a well-trained U-Net neural network and decision tree were combined and the infrared thermal images of the PV panel were intelligently analyzed. The research results show that PV panel faults can be diagnosed with 99.8% accuracy using the proposed method. Roberto Pierdicca et al. [13] developed a deep learning artificial intelligence system based on the Mask R-CNN [14] architecture for detecting faults from photovoltaic thermal images. The Mask R-CNN architecture can be simultaneously used for object detection and instance segmentation and is beneficial for accomplishing intended detection tasks automatically. The developed method was trained and evaluated with a photovoltaic thermal image dataset, and the experimental results demonstrated that photovoltaic power modules can be diagnosed effectively through thermal imaging. To improve the power generation efficiency of PV systems and ensure power stations’ safe and stable operation, Tianyi Sun et al. [15] proposed a novel method for detecting hot spots of PV panels based on improved anchors and prediction heads of the YOLOv5 (AP-YOLOv5) network, by which the mean average precision (mAP) can achieve 87.8%, the average recall rate and the F1 score can reach 89.0% and 88.9%, respectively. Michiel Vlaminck et al. [16] proposed a novel system for improved PV diagnostics using a region-based convolutional neural network (CNN) based on drone-based imagery, in which a true positive rate or recall of more than 90% for a false positive rate of around 2% to 3% was achieved on a dataset containing nearly 9000 solar panels.
Recently, the networks used for image segmentation have been mainly divided into two types. One is the SegNet and U-Net semantic segmentation methods obtained from the evolution of FCN, and the other is the Mask R-CNN instance segmentation algorithm obtained from the improvement of R-CNN. Both SegNet and U-Net are an encoder-decoder network structure whose several down-sampling and up-sampling structural results in the loss of edge information when performing hot spots segmentation. Mask R-CNN is a deep learning framework for segmenting and recognizing multiple targets simultaneously with high accuracy by using labeled images for training. Especially in recent years, different researchers have improved and optimized the Mask R-CNN algorithm according to their needs, and the improved Mask R-CNN has performed well in distribution power lines [17], composite insulator strings [18], medicine [19], construction [20], etc.
After the above analysis, the network Mask R-CNN plays an important role in target segmentation with powerful segmentation and recognition capabilities and low hardware requirements. When applied to PV region segmentation, it can not only separate the hot spot area and generate bounding boxes to contain hot spots but also return to the exact location of the hot spot in the observed thermal image. Although the characteristics of natural images are different from thermal infrared, considering the effectiveness of Mask R-CNN in generic target instance segmentation, this paper proposes an optimized Mask R-CNN model to segment and recognize PV hotspots more accurately. First, an edge-guided pyramid structure was designed to introduce the extracted edge features of hot spots into the network. Furthermore, an infrared spatial attention module was embedded into the network to optimize the extracted infrared features. Next, the anchor box size was self-adapted according to the length-width ratio of the box with the K-means clustering algorithm. Last, the proposed method was validated by the experiments.
2. Basic Framework of Mask R-CNN
The main process of Mask R-CNN can be divided into four steps, and its structure is shown in Figure 1. The first step is to extract feature maps. Mask R-CNN uses Residual Neural Network (ResNet) [21] as the backbone network to perform feature extraction at different scales on the input images after a series of convolution and pooling operations to obtain C1-1 to C1-5 layer features. The Feature Pyramid Network (FPN) is utilized to extract and fuse multi-scale features to obtain C3-2 to C3-6 feature maps of the input image at different levels. In the second step, the Region Proposal Network (RPN) is used to obtain the region proposal, where the effective feature layer sets candidate boxes of different proportions and sizes according to the size of different perceptual fields to obtain candidate regions that may contain targets. A Softmax classifier is used to determine whether the candidate targets belong to the foreground or the background. Afterwards, the candidate regions with a lower probability of hot spots and those with a higher overlap rate are filtered by non-maximum suppression (NMS). In the third step, ROI Align, a more accurate pooling method, is used to transform all the regions corresponding to the boxes generated and filtered by the RPN into fixed-size feature maps that align the candidate boxes. In the fourth step, the feature maps of the candidate regions are used for classification and segmentation. These feature maps are passed through two branches: one branch is used for classification and box regression through a series of fully connected layers, and the other branch is used to produce a mask that is consistent with the size and shape of the hot spot to segment the hot spot image by a segmentation mask-generating network consisting of a Full Convolution Network (FCN).
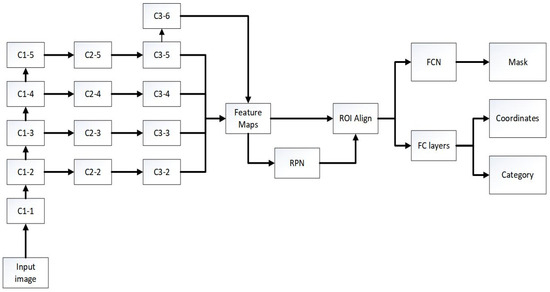
Figure 1.
Mask R-CNN network structure.
Among them, focusing on the feature extraction stage, we use ResNet50 combined with FPN as the backbone network for feature extraction of PV hot spot images. Among them, ResNet50 is a convolutional neural network with a total of 50 convolutions, which can sequentially extract the low-level features (edges, etc.) and high-level features (hot spots, PV panels, etc.) to form five layers of feature maps with different sizes and dimensions. If only the feature map of the last layer of the residual network is used as the output of the feature extraction network, it is easy to ignore relatively small hot spots. Therefore, the FPN network is used to fuse the feature map from the bottom to the top layer so as to fully utilize the features extracted by ResNet50 at each stage. Specifically, each layer from C1-1 to C1-5 is convolved by 1 × 1 to obtain the same number of channels as the previous layer. The upper feature layer obtains feature layers with the same length and width as the feature layer of the next layer by up-sampling. Two feature layers are added together to obtain a fused new feature layer. After fusion, a 3 × 3 convolution is used for processing, with the aim of eliminating the aliasing effect of up-sampling to obtain C3-2 to C3-5 feature layers. The C3-6 feature layer is obtained by maximizing the pooling of the C3-5 feature layer.
Although the traditional Mask R-CNN network has powerful functions and can effectively realize hot spot detection and segmentation, there are still some problems when applied to thermal infrared images. For example, thermal infrared images have problems such as low resolution and unclear hot spot edges, which require more edge features, but it is difficult to enhance the edge features. There is a significant difference in the size of hot spots, which cannot adaptively extract regions of interest, resulting in the loss of the target. This paper focuses on researching these problems.
3. Proposed Algorithm
Mask R-CNN itself has excellent segmentation performance, but it is mainly used to deal with visible light images. However, it is not ideal enough for thermal infrared image processing. In order to improve the accuracy of the network for hot spot segmentation of thermal infrared images, it mainly contains the following three aspects: Firstly, in thermal infrared images, there is the problem of low resolution and unclear target edges, which cannot obtain satisfactory segmentation results. Secondly, during the feature extraction process, the network does not pay special attention to the effective information in the thermal infrared image. Finally, the anchor box is the benchmark used by the algorithm to predict the boundary box. There is a significant difference between the shape of the original algorithm’s training and testing targets and the numerical values of the hot spot data, making it difficult to obtain satisfactory accuracy by directly using the initial anchor box values.
Therefore, based on the Mask R-CNN network, the following improvements are made to address the above three problems in this paper: Firstly, the target edge features are extracted using an edge-aware module, and then the edge-guided feature pyramid structure proposed is used to fuse the extracted edge features with the main features to enhance the boundary representation of the features. Secondly, this paper introduces an infrared spatial attention module into the feature extraction network to optimize the extracted infrared image features and make the segmentation attention focus on the informative pixels in the infrared image. Finally, in the region of interest network, the size of the anchor box is adaptively adjusted by analyzing the aspect ratio of the self-made hot spot datasets via the K-Means algorithm to reduce the probability of missing detection of small targets.
3.1. Edge Feature Enhancement
In order to solve the edge-blurred problem of hot spots in thermal infrared images, which leads to poor performance of hot spot edge segmentation, this paper intends to add edge information as prior information to the network to guide it in better feature extraction. An edge-aware module is introduced to extract edge features related to the target. Afterwards, the edge guidance pyramid structure is proposed to fuse the edge features with the features of each layer guiding the feature extraction network to pay more attention to the edge details of the target and improve the segmentation accuracy. The edge-aware module was proposed by Yujia Sun et al. [22], which integrates low-level features and high-level features, aiming at mining the edge semantic information of the target.
In this paper, the module is combined with the Mask R-CNN algorithm, and its structure is shown in Figure 2, which is manifested as follows: First, the network extracts the features of each stage from C1-1 to C1-5 of the input image through ResNet50. We select the low-level feature C1-2 containing local edge information of the image and the high-level feature C1-5 containing global semantic information as input of the edge-aware module and use two 1 × 1 convolution layers to change the channel number of channels for low-level and high-level features. Moreover, the low-level features and the up-sampled high-level features are integrated through the concatenation operation. Finally, the edge features of the target are obtained by using two 3 × 3 convolution layers, one 1 × 1 convolution layer, and the sigmoid function.

Figure 2.
Edge-aware module.
As we all know, the expressive ability of features at different levels of feature maps is different. Low-level features mainly reflect details such as light and shade, edges, etc., while high-level features mainly reflect a richer overall structure. Therefore, we need to consider the information interaction and exchange of features at different layers to achieve the purpose of detecting targets at different scales. On the other hand, if the edge features are only fused with a certain layer, such as high-level or low-level features, without considering the information interaction between the features of other layers and edge features, it will be difficult for the network to adapt to changes in the size and scale of hot spots. The information interaction between different scale features and the fusion of multi-scale features with edge features are both important, not only taking into account details and the whole, but also improving the adaptability of the network to the scale change of hot spots.
Inspired by the FPN structure in Mask R-CNN and literature [22,23], we propose an edge-guided pyramid structure, which combines edge features with the features of each layer to guide the network in learning the target edge, and its structure is shown in Figure 3. Firstly, feature maps of different scales are extracted by using ResNet50 (as shown in Figures C1-1 to C1-5) and transformed into a unified number of channels by using 1 × 1 convolution (as shown in Figures C2-2 to C2-5). Secondly, the multi-scale features and edge features are multiplied at the element level with additional jump connections to obtain the initial fusion features. Thirdly, we add and fuse the upper-level feature maps obtained by up-sampling with each corresponding element in the lower-level feature maps to form new feature maps. Finally, a 3 × 3 convolution is used to smooth the fused feature maps to eliminate the aliasing effect of up-sampling and obtain more fully fused feature maps (as shown in Figures C3-2 to C3-5). The C3-6 feature layer is obtained by maximizing the pooling of the C3-5 feature layer.
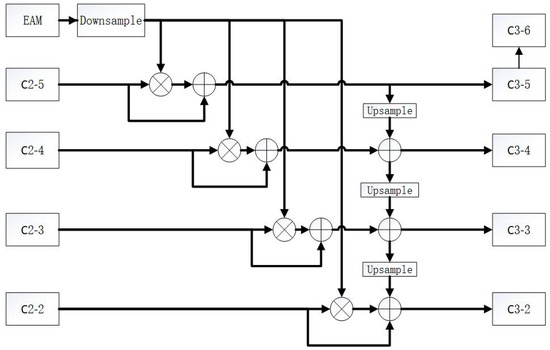
Figure 3.
Edge-guided feature pyramid structure.
3.2. Spatial Attention Module
In recent years, attention enhancement mechanisms have been widely applied to enhance the features of images extracted by feature extraction networks. The original Mask R-CNN segmentation algorithm aimed to segment targets in visible light environments, while for the thermal infrared image inputted in this paper, attention should be focused on the information of pixels in the infrared image. Therefore, this paper introduces an Infrared Spatial Attention Module [24] (ISAM). The infrared spatial attention module was proposed by Yi Shi et al. The introduction of this module can not only optimize the infrared image features extracted by the network but also suppress the noise in the infrared image, resulting in more accurate segmentation results.
The structure of the infrared spatial attention module is shown in Figure 4. Its principle is to first strengthen the input infrared feature vector on the space path, then multiply the enhanced component with the input infrared feature component at the element level, and then attach the enhanced infrared feature component with jump connections, which can be expressed as follows [24]:
where F represents the input infrared feature vector, ⊗ is the multiplication of element levels, M(F) is the infrared spatial attention enhancement vector, and FE is the output enhanced infrared feature vector.
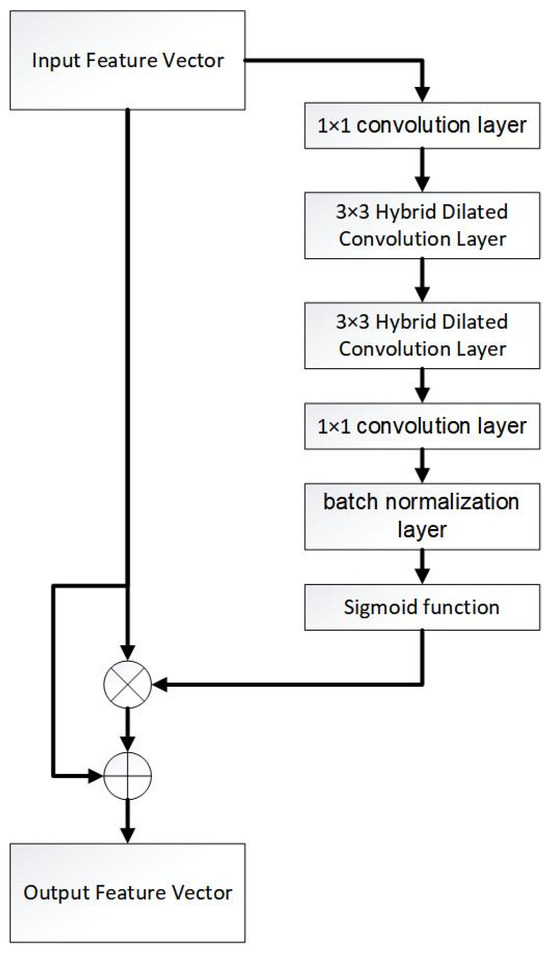
Figure 4.
Infrared spatial attention module.
The right path in the figure is a branch of attention enhancement in the infrared space, consisting of a convolution layer with a 1 × 1 convolution kernel, two hybrid dilated convolution layers, a convolution layer with a 1 × 1 convolution kernel, a batch normalization layer, and the sigmoid function. The calculation of the infrared spatial attention enhancement vector M(F) is shown in Equation (2) [24]:
where BN is a batch standardized operation, f1 is a 1 × 1 convolution operation, and fhd is a 3 × 3 mixed cavity convolution operation.
3.3. Adaptive Adjustment of RPN Size
Anchor box optimization is the benchmark used by the algorithm to predict the boundary box. Selecting the most suitable box size can reduce the difficulty of training. Due to various natural factors such as building shading, leaves, bird droppings, and dust accumulation, the formation of hot spot defects varies greatly in size, resulting in a more diverse aspect ratio. There is a significant difference between the shape of the test object selected during Mask R-CNN training and the initial value of the hot spot data on the solar panel. Therefore, it is difficult to obtain satisfactory accuracy by directly using the initial anchor frame value. The K-means clustering algorithm is used to analyze the self-made infrared datasets and conduct in-depth analysis on the aspect ratio of the target. Based on the sample situation obtained from K-means clustering, the size ratio of the anchor box is adjusted to better fit the Mask R-CNN network for hot spot segmentation.
In the K-means clustering algorithm, the value of K directly affects the clustering results. The RPN part of the Mask R-CNN algorithm generates 5 × 3 candidate boxes for each pixel; the first five represent five regions, and the last three represent the aspect ratio of candidate boxes in the same region. In this paper, k = 3 is chosen to adjust the aspect ratio [25]. After the k value is determined, K-means clustering experiments are carried out on the aspect ratio data of the self-made infrared datasets. From the experimental results, it can be seen that the aspect ratio distribution of the target sample is mainly in three regions, whose center points are [0.74, 1.28, 3.0]. According to the K-means clustering results, the ratio of RPN_ANCHOR is changed to [0.74, 1.28, 3.0] in this paper, so that the generated suggestion box is more suitable for the ratio of datasets during the training of the network.
3.4. Improved Mask R-CNN
To sum up, the overall framework of this paper is shown in Figure 5, with corresponding improvements based on the network of Mask R-CNN. Firstly, thermal infrared images containing hot spots are fed into the feature extraction network to obtain features of different scales. Secondly, we input low-level and high-level features into the edge-aware module to obtain the target edge features. Moreover, through the edge-guided feature pyramid proposed, we fuse the edge features with the multi-scale regional features enhanced by the infrared spatial attention module to make up for the lost target edge information in the backbone network and obtain the enhanced edge features. Thirdly, an adaptive region of interest extraction network is used to reduce missed detection caused by size differences. Finally, a segmented image with categories and masks is obtained through two branches.
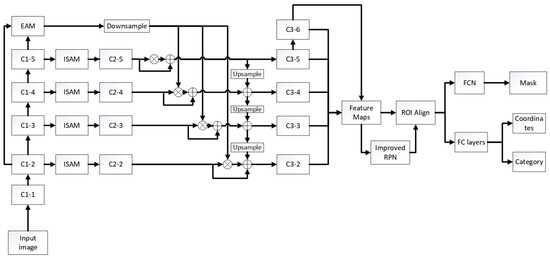
Figure 5.
Improved Mask R-CNN segmentation network.
4. Experiment and Result Analysis
4.1. Data Preparation
The infrared images of photovoltaic hot spots used in this paper are partly from open-source datasets and partly from an experimental collection of mono-crystalline silicon and poly-crystalline silicon photovoltaic modules. An image information collection platform is built using the FLUKE Ti200 infrared thermal image. A total of 221 images are selected, and 180 and 41 are used as training and testing sets, respectively. Each image is labeled by Labelme 5.0.1 labeling software.
The training of the model in this paper is completed on the Win10 operating system, with the processor selected as an AMD Ryzen 7 5800H with Radeon Graphics 3.20 GHz. The model framework is built using the open-source PyTorch deep learning library. During training, the initial learning rate is set to 0.002, the batch size is set to 2, and 100 epochs are trained.
4.2. Evaluation Index
The performance of the model is evaluated by precision, recall, and mean average precision (mAP). The average precision AP is calculated from the PR curve composed of accuracy and recall, and the formula for each metric is as follows [26]:
where TP (true positive) represents the detection of a correct pixel with a hot spot, FP (false positive) represents the detection of a pixel with a hot spot that is actually a pixel with a hot spot background, and FN (false negative) represents the detection of a pixel with a hot spot background that is actually a pixel with a hot spot.
4.3. Ablation Experiments
In order to analyze the impact of each module better and more comprehensively on performance in the segmentation model constructed in this paper and verify the effectiveness of each module structure, ablation experiments are designed and trained. The experimental results are shown in Table 1. Improvement point 1 introduces edge information; improvement point 2 adds an infrared spatial attention module; and improvement point 3 adaptively adjusts the size of the anchor box. The results indicate that the modules and improved methods introduced in this paper can effectively improve the accuracy of the model.

Table 1.
Statistical results of ablation experiments.
The multi-scale feature map between the Mask R-CNN model and the improved model is shown in Figure 6b,c. It can be seen from the figure that, through the edge-aware module and the edge-guided feature pyramid structure, edge information is introduced into the network. The edge contour of the hot spot in the feature map is clearer, and the model captures better information about the hot spot boundary at various scales than the original model. The introduction of infrared spatial attention modules can also suppress irrelevant information such as background, and the contrast between hot spots and background in feature maps is significantly improved, proving the effectiveness of introducing edge information and attention mechanisms.
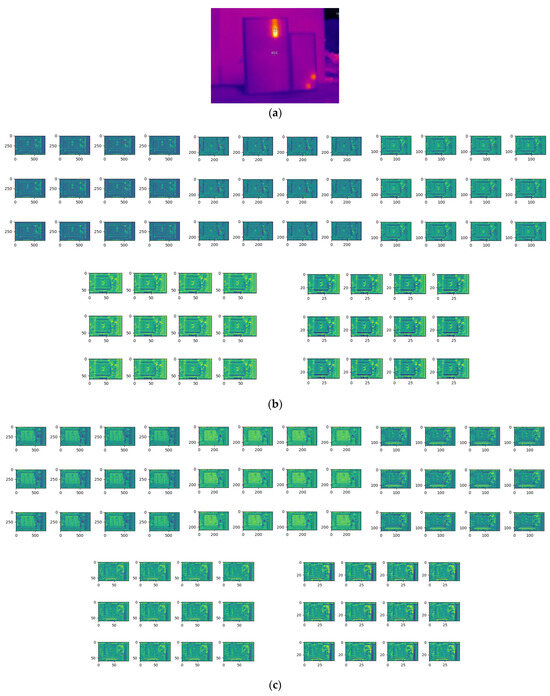
Figure 6.
Results of edge feature extraction: (a) original, (b) Mask R-CNN, and (c) proposed algorithm in this paper.
4.4. Analysis of Segmentation Experiment Results
The network training loss values of the hot spot segmentation model are shown in Figure 7. The blue loss curve in the figure represents the original Mask R-CNN algorithm, and the red curve represents the improved Mask R-CNN algorithm. It can be seen that the improved Mask R-CNN model has a faster convergence speed in the training process, which proves that the network training effect is good, and the improved loss function is lower than the original model, with better robustness.
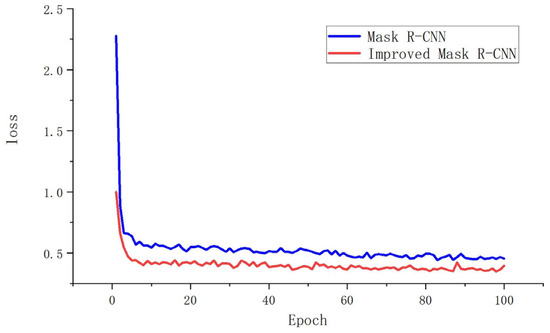
Figure 7.
Loss function convergence curve.
In this paper, P, R, and mAP are used as evaluation indicators to compare performance with the original Mask R-CNN, and comparison results are shown in Table 2, and the trend comparison of mAP@0.5(%) (i.e., AP50) is shown in Figure 8. From Table 2, it can be seen that indicators of the improved Mask R-CNN model proposed by this paper are improved, with precision, recall, and mAP being 13.4%, 7.9%, and 10.81% higher than the original model, respectively. The results indicate that the segmentation algorithm that introduces edge information and adds an infrared attention module can effectively aggregate the edge information of hot spots and improve the accuracy of hot spot segmentation.

Table 2.
Performance comparison results of models.
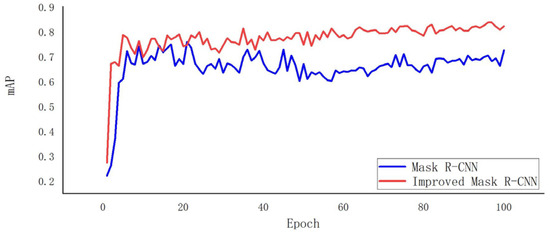
Figure 8.
Comparison of two Mask R-CNN models mAP@0.5(%).
Randomly select images for testing, and the segmentation results are shown in Figure 9. Among them, Figure 9a shows the original infrared image; Figure 9b shows the segmentation results of the Mask R-CNN model; Figure 9c–e shows the segmentation results of improved points 1, 2, and 3; and Figure 9f shows the segmentation results of improved Mask R-CNN. Comparing the various figures, it can be seen that the Mask R-CNN model has a lot of missed segmentation problems when segmenting hot spots. Improvement points 2 and 3 include the addition of an infrared spatial attention module and an adaptive anchor frame, which can effectively solve the problem of partial missed segmentation. However, there are also issues with multi-segmentation detection in some areas, and areas with blurry edges cannot be completely segmented, resulting in insufficient segmentation accuracy. However, improvement point 1, which introduces edge information, can make the segmentation more accurate. Improving the Mask R-CNN model has shown a certain degree of improvement in segmentation performance.
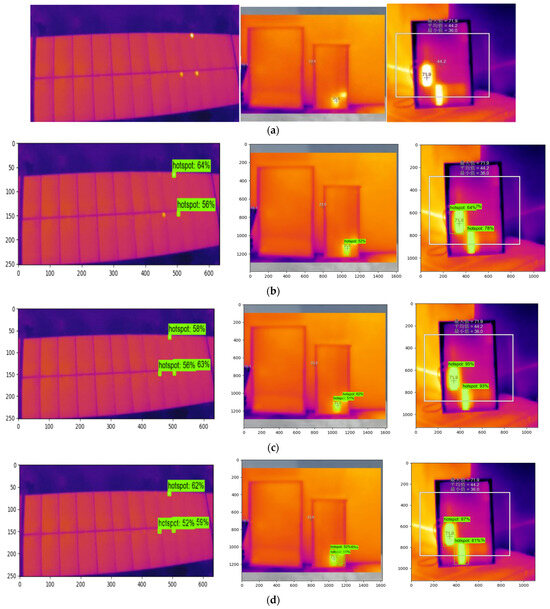
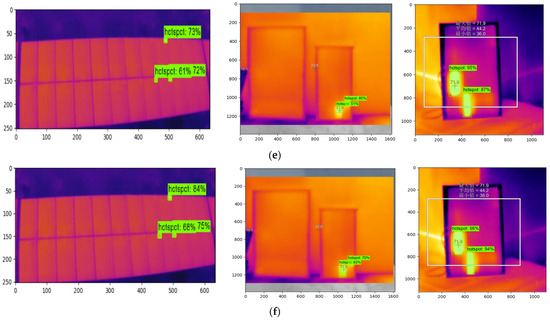
Figure 9.
Comparison of segmentation results: (a) original, (b) Mask R-CNN, (c) improved point 1, (d) improved point 2, (e) improved point 3, and (f) improved Mask R-CNN. Note: The 最大值, 平均值, and 最小值 in the figures respectively represent the maximum temperature, average temperature, and minimum temperature values of the area contained in the white box.
We then randomly select three infrared hot spot images and apply the trained U-Net and improved Mask R-CNN segmentation model to predict and get the mask image; the results are shown in Figure 10. Among them, Figure 10a shows the infrared images; Figure 10b shows the real mask images; Figure 10c shows the mask images predicted by the U-Net network; and Figure 10d shows the mask images predicted by the trained and improved Mask R-CNN. It can be seen that the mask images predicted by the trained U-Net network are not fully completed. Furthermore, some of them are not predicted, while the improved Mask R-CNN network can extract the relevant features in the images that contain hot spots. It can be seen that the improved Mask R-CNN algorithm proposed in this paper is reliable, and the trained network has high accuracy in image segmentation.

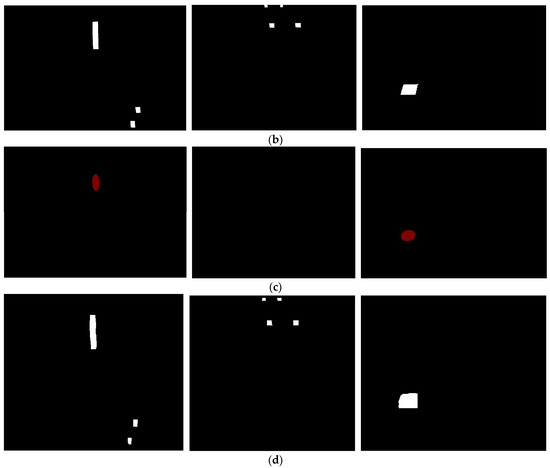
Figure 10.
Comparison of semantic segmentation results: (a) original, (b) real mask, (c) U-Net, and (d) improved Mask R-CNN.
In summary, improvements based on the Mask R-CNN model have been made to thermal infrared images by introducing target edge information, adding an infrared spatial attention module, and adaptively adjusting anchor frame size, which can effectively improve the performance of the model.
5. Conclusions
In a real engineering site, the infrared images of hot spots taken by a thermal imaging system are inevitably influenced by the surrounding environment and the imagery itself; the target edges are usually blurred, and the resolution is reduced accordingly, which may result in some difficulties in hot spot segmentation. To address the issues, an improved automatic hot spot segmentation algorithm based on Mask R-CNN has been proposed in this paper. The edge information of the target is first extracted by an edge-aware module, and then an edge feature pyramid structure is designed to fuse the edge features into those exacted by the main network. In the meantime, an infrared spatial attention module is added to the improved network to help the network focus on enriching infrared information, and the noise can be suppressed during training. The experimental results on the self-made datasets show that the proposed model in this paper has been improved compared to the original one, ensuring the effectiveness of introducing edge information and attention mechanisms.
As it should be, the improved algorithm proposed also has some limitations: (1) Only a serial number of modules was added to the original Mask R-CNN in the paper, and the segmentation accuracy can be improved for a hot spot infrared image from a solar panel. However, the model became slightly complex, and the training speed as well as the segmentation speed were not enhanced. In future work, the structure of the model proposed in the paper will be further explored and optimized. (2) The performance was validated mainly by the laboratory experiments. However, there are many factors in a real engineering site that affect the segmentation result for a hot spot, so the deep learning-based hot spot segmentation algorithm proposed in this paper still needs to be further verified and improved through the evaluation of field data.
Author Contributions
Conceptualization, F.W.; methodology, Z.W., Z.C. and D.Z.; software, Z.W. and X.G.; validation, Z.C. and W.C.; investigation, Z.W. and Z.C.; data curation, Z.W.; writing—original draft preparation, Z.W.; writing—review and editing, Z.W. and F.W. All authors have read and agreed to the published version of the manuscript.
Funding
This research was funded by the Anhui Natural Science Foundation (2008085UD09); the Anhui University Collaborative Innovation Project (GXXT-2021-010); and the Anhui Construction Plan Project (2022-YF016, 2022-YF065, and 2023-YF050): Open Project of Anhui Simulation Design and Modern Manufacture Engineering Technology Research Center (SGCZXZD2101).
Institutional Review Board Statement
Not applicable.
Informed Consent Statement
Not applicable.
Data Availability Statement
Data sharing is not applicable.
Acknowledgments
We would like to acknowledge the support from the Anhui Natural Science Foundation, the Anhui Provincial Department of Education, the Anhui Provincial Department of Housing and Urban Rural Development, and the Anhui Simulation Design and Modern Manufacture Engineering Technology Research Center.
Conflicts of Interest
The authors declare no conflict of interest.
References
- Zimeng, L.; Jiaqian, H.; Shanying, H. Driving force model to evaluate China’s photovoltaic industry: Historical and future trends. J. Clean. Prod. 2021, 311, 127637. [Google Scholar]
- Munoz, M.A.; Alonso-García, M.C.; Vela, N.; Chenlo, F. Early degradation of silicon PV modules and guaranty conditions. Sol. Energy 2011, 85, 2264–2274. [Google Scholar] [CrossRef]
- Xing, T.; Chen, D.; Liu, L.; Zhou, Y.; Zhang, J.; Liu, Y. Research on Hot Spots in System Side Photovoltaic Modules and Causes Analysis. Sol. Energy 2015, 259, 69–72. [Google Scholar]
- Kim, Y.; Shin, M.; Lee, M.J.; Kang, Y. Hot-spot generation model using electrical and thermal equivalent circuits for a copper indium gallium selenide photovoltaic module. Sol. Energy 2021, 216, 377–385. [Google Scholar] [CrossRef]
- Li, S.M.; Xi, W.H. Influence of Hot Spot on Power Generation Performance of Photovoltaic Module. Power Equip. 2013, 27, 61–63. [Google Scholar]
- Tsanakas, J.A.; Chrysostomou, D.; Botsaris, P.N.; Gasteratos, A. Fault diagnosis of photovoltaic modules through image processing and Canny edge detection on field thermographic measurements. Int. J. Sustain. Energy 2015, 34, 351–372. [Google Scholar] [CrossRef]
- Alsafasfeh, M.; Abdel-Qader, I.; Bazuin, B.; Alsafasfeh, Q.; Su, W. Unsupervised Fault Detection and Analysis for Large Photovoltaic Systems Using Drones and Machine Vision. Energies 2018, 11, 2252. [Google Scholar] [CrossRef]
- Vidal de Oliveira, A.K.; Aghaei, M.; Rüther, R. Automatic fault Detection of photovoltaic Arrays by convolutional neural networks during aerial infrared thermography. In Proceedings of the 36th European Photovoltaic Solar Energy Conference and Exhibition, Marseille, France, 9–13 September 2019; pp. 1302–1307. [Google Scholar]
- Lin, J.; Jianhui, S.; Xin, L. Hot Spots Detection of Operating PV Arrays through IR Thermal Image Using Method Based on Curve Fitting of Gray Histogram. MATEC Web Conf. 2016, 61, 06017. [Google Scholar]
- Chaudhary, A.S.; Chaturvedi, D.K. Efficient Thermal Image Segmentation for Heat Visualization in Solar Panels and Batteries using Watershed Transform. Int. J. Image Graph. Signal Process. 2017, 9, 10–17. [Google Scholar] [CrossRef][Green Version]
- Ngo, G.C.; Macabebe, E.Q.B. Image segmentation using K-means color quantization and density-based spatial clustering of applications with noise (DBSCAN) for hotspot detection in photovoltaic modules. In Proceedings of the 2016 IEEE Region 10 Conference (TENCON), Singapore, 22–26 November 2016; pp. 1614–1618. [Google Scholar] [CrossRef]
- Wang, X.; Yang, W.; Qin, B.; Wei, K.; Ma, Y.; Zhang, D. Intelligent monitoring of photovoltaic panels based on infrared detection. Energy Rep. 2022, 8, 5005–5015. [Google Scholar] [CrossRef]
- Pierdicca, R.; Paolanti, M.; Felicetti, A.; Piccinini, F.; Zingaretti, P. Automatic Faults Detection of Photovoltaic Farms: solAIr, a Deep Learning-Based System for Thermal Images. Energies 2020, 13, 6496. [Google Scholar] [CrossRef]
- He, K.; Gkioxari, G.; Dollár, P.; Girshick, R.B. Mask R-CNN. In Proceedings of the IEEE International Conference on Computer Vision, Venice, Italy, 22–29 October 2017; pp. 2961–2969. [Google Scholar]
- Sun, T.; Xing, H.; Cao, S.; Zhang, Y.; Fan, S.; Liu, P. A novel detection method for hot spots of photovoltaic (PV) panels using improved anchors and prediction heads of YOLOv5 network. Energy Rep. 2022, 8, 1219–1229. [Google Scholar] [CrossRef]
- Vlaminck, M.; Heidbuchel, R.; Philips, W.; Luong, H. Region-Based CNN for Anomaly Detection in PV Power Plants Using Aerial Imagery. Sensors 2022, 22, 1244. [Google Scholar] [CrossRef] [PubMed]
- Xie, S.; Li, B.; Zhang, D. Improved Mask-RCNN based semantic segmentation for distribution power lines. J. Nanjing Univ. Posts Telecommun. (Nat. Sci. Ed.) 2021, 41, 41–46. [Google Scholar] [CrossRef]
- Xinyu, H.; Yang, Z.; Liming, W.; Hongwei, M.; Zhonghao, Z.; Lu, W. Infrared Image Segmentation and Temperature Reading of Composite Insulator Strings Based on Mask-RCNN Algorithm. High Volt. Appar. 2021, 57, 87–94. [Google Scholar] [CrossRef]
- Li, S.T.; Zhang, L.; Guo, P.; Pan, H.Y.; Chen, P.Z.; Xie, H.F.; Xie, B.-K.; Chen, J.; Lai, Q.-Q.; Li, Y.-Z.; et al. Prostate cancer of magnetic resonance imaging automatic segmentation and detection of based on 3D-Mask RCNN. J. Radiat. Res. Appl. Sci. 2023, 16, 100636. [Google Scholar] [CrossRef]
- Amo-Boateng, M.; Sey, N.E.N.; Amproche, A.A.; Domfeh, M.K. Instance segmentation scheme for roofs in rural areas based on Mask R-CNN. Egypt. J. Remote Sens. Space Sci. 2022, 25, 569–577. [Google Scholar] [CrossRef]
- He, K.; Zhang, X.; Ren, S.; Sun, J. Deep Residual Learning for Image Recognition. In Proceedings of the IEEE Conference on Computer Vision and Pattern Recognition (CVPR) (2016), Las Vegas, NV, USA, 26 June–1 July 2016; pp. 770–778. [Google Scholar]
- Sun, Y.; Wang, S.; Chen, C.; Xiang, T.Z. Boundary-Guided Camouflaged Object Detection. arXiv 2022, arXiv:2207.00794. [Google Scholar] [CrossRef]
- Chen, S.; Qiu, C.; Yang, W.; Zhang, Z. Combining edge guidance and feature pyramid for medical image segmentation. Biomed. Signal Process. Control 2022, 78, 103960. [Google Scholar] [CrossRef]
- Yi, S.; Li, J.; Jia, Y. Attention Enhancement Mechanism Instance Segmentation of Thermal Imaging Temperature Measurement Region Based on Infrared. J. Electron. Inf. Technol. 2021, 43, 3505–3512. [Google Scholar]
- Ren, K.; Chen, Z.; Gu, G.; Chen, Q. Research on infrared small target segmentation algorithm based on improved mask R-CNN. Optik 2023, 272, 170334. [Google Scholar] [CrossRef]
- Daiyi, H.E.; Wenzao, S.H.I.; Zhibin, L.I.N. Building Extraction from Remote Sensing Image Based on Improved Mask R-CNN. Comput. Syst. Appl. 2020, 29, 156–163. [Google Scholar] [CrossRef]
Disclaimer/Publisher’s Note: The statements, opinions and data contained in all publications are solely those of the individual author(s) and contributor(s) and not of MDPI and/or the editor(s). MDPI and/or the editor(s) disclaim responsibility for any injury to people or property resulting from any ideas, methods, instructions or products referred to in the content. |
© 2023 by the authors. Licensee MDPI, Basel, Switzerland. This article is an open access article distributed under the terms and conditions of the Creative Commons Attribution (CC BY) license (https://creativecommons.org/licenses/by/4.0/).