Abstract
This study aims to explore the differences between the loess and landslide deposits, focusing on aspects such as particle distribution, consolidation characteristics, and the dynamic shear modulus. Through a series of experiments, the research reveals the similarities and differences between these two entities, yielding several key findings. Firstly, the process of landsliding disrupts the original structure of the loess, resulting in a reduction in porosity and a densification of the soil. Additionally, the movement and sorting of particles during the landslides cause variations in particle size distribution across different sections of the landslide deposits. Secondly, the landslide process not only alters the soil’s structure but also changes the particle sizes within the loess. Particle wear and sieving results in the transformation of larger particles into smaller ones, leading to a more uniform particle size distribution. This shift in the structure and particle size directly impacts the consolidation characteristics of landslide deposits, resulting in a substantial reduction in the compression coefficient. Despite undergoing consolidation for decades, the middle and lower sections of the landslide deposits still exhibit under-consolidation. Although the differences in the maximum dynamic shear modulus between the loess and landslide deposits at varying depths are relatively minor, differences in the porosity and consolidation characteristics lead to faster decay rates of the dynamic shear modulus for the latter. The study also highlights a reduction in the water sensitivity of the maximum dynamic shear modulus within the landslide deposits. Based on the experimental results, a predictive model is proposed, utilizing the A and m values to estimate the maximum dynamic shear modulus of both the loess and landslide deposits. In conclusion, this research uncovers the impact of landslide processes on the structure and properties of the loess, providing an insightful understanding into the disparities between these two entities.
1. Introduction
The Loess Plateau in China is located in the middle and upper reaches of the Yellow River. It stretches from the Riyue Mountain, Helan Mountain, and Wusha-oling in the west to the Taihang Mountain Range in the east. It is bordered by the Great Wall to the north and reaches the Qinling Mountains to the south [1]. Due to the tectonic movement and soil erosion, the Loess Plateau features a landscape of undulating hills and crisscrossing gullies. In history, the Loess Plateau has experienced seven earthquakes with a magnitude of 7.5 or above (including a magnitude of 7.5) and 20 earthquakes with magnitudes between 7 and 7.5, resulting in over 1.4 million casualties [2]. It is noteworthy that these strong earthquakes have triggered numerous loess earthquake landslides with diverse forms and widespread distribution. The casualties caused by the loess earthquake landslides account for 1/3 to 2/3 of the total number of casualties [2]. On 16 December 1920, a M 8.5 earthquake occurred in the Ningxia Haiyuan, China, which induced more than 7000 landslides [3]. About 100,000 people were killed by those landslides [4], and the area >200 km2 was covered by a sliding zone and depositions [5,6]. The typically earthquake-induced loess landslides are large-scale, have long run-out, have a low angle sloping source (<20°), and have flat depositions [7,8,9].
In the process of the landslide movement, significant changes occur in the physical and mechanical properties of rock and soil [10,11]. Loess, as a typical homogeneous, non-stratified, and highly porous silty soil, especially the loess formed since the Late Pleistocene of the Quaternary period (Q3 loess), may undergo phenomena such as liquefaction, seismic subsidence, and fragmentation under the influence of strong seismic motion. These phenomena can lead to different mechanisms of landslide formation [12,13,14,15]. Consequently, the changes in the physical properties of the loess and landslide deposits are diverse. In the study of loess landslides induced by the Haiyuan earthquake, some researchers have indicated that under intense ground motion, loess disintegrates into dry loess flow and rapidly travels with the high pore air pressure, resulting in a void ratio of the landslide deposit soil being 1.2~1.3 times that of the undisturbed loess from the source of the landslide [16,17]. Another perspective suggests that the loess with a large void ratio experiences microscopic damage, leading to overall deformation and damage during the seismic motion and sliding. On a macroscopic scale, slopes formed of such loess tend to collapse and subside, with the void ratio serving as one of the indicators to measure this destructive mode [8,18]. Furthermore, the experimental results show that the particle characteristics and pore structure of loess change after liquefaction under the seismic action [19,20,21,22,23,24,25]. These studies indicate that the changes in the physical and mechanical properties of both the original loess and landslide deposits can reflect the mechanisms of the landslide formation and the landslide movement processes [26,27].
During the field investigation of the 1920 Haiyuan M 8.5 earthquake landslide, a large number of loess sheets, loess gravel, and discontinuous structures, such as the fracture surfaces, shear surfaces, and directional arrangements, were observed in the landslide deposits. These phenomena indicate the processes of shearing and sliding during the landslide movement.
In order to explore the changes in the physical, mechanical, and dynamic properties of loess during the earthquake-induced landslide movement and understand the formation mechanism and movement process of the co-seismic landslides in loess, this study selected a typical loess earthquake landslide, the Subao landslide, as an example. Drilling and well explorations were conducted to obtain the profiles of the landslide source and deposit and to collect undisturbed soil samples from the landslide source and deposit. A series of tests were carried out to present the basic physical properties, compressibility coefficient, and dynamic shear modulus at different depths. This research holds significant importance for gaining a thorough understanding of the changes in the physical property of loess during the process of the landslide movement and provides valuable insights for engineering construction in loess regions in China.
2. Test Materials and Methods
2.1. Study Site
The Subao landslide is located approximately 25 km southwest of Xiji city, Ningxia Hui Autonomous Region, China. The shortest distance from the study site to the seismogenic fault Haiyuan fault zone is about 62 km, which is in the level IX area of the 1920 Haiyuan earthquake [7]. An overview of the study site is shown in Figure 1a. The boundary between the landslide accumulation mass and the landslide is clear. The deposit is flat with a gradient of 2°. The middle and upper part of the deposit is farmland, with slight disturbance, and the lower part is a village, with serious disturbance. The front part of the deposit moved along the muddy river to both sides and formed Subao dammed Lake, with the sliding mass of the Hongtuchuan landslide on the opposite side. Figure 1b presents the topography of the landslide area. The landslide has a maximum width of about 360 m and a length of 1320 m. The thicknesses of the deposit were inferred to be approximately 20~45 m in different areas, and the average deposit thickness is 30 m. Respectively, the total volume of the Subao landslide is about 1.2 × 10⁷ m3. The main scarp of the landslide is high and steep, with a height of 80 m and gradient of 50°. We found mudstone exposed under the main scarp. Our observations suggest that the movement type of the landslide is translational sliding based on the Varnes’ classification system [14], and the type is a loess–bedrock Interface slide based on the Li’ classification system [28].
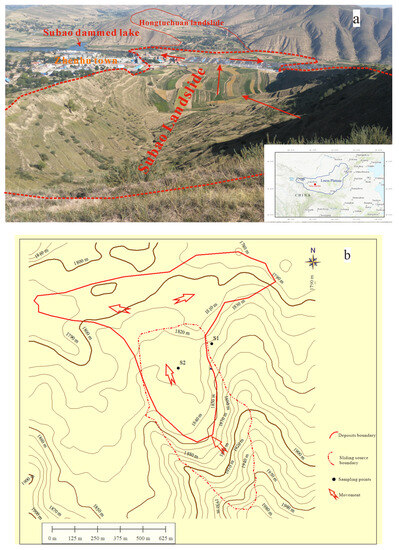
Figure 1.
(a) The Subao loess landslide. (b) Engineering geological map of Subao landslide.
2.2. Sample Preparation and Experimental Equipment
Loess is a kind of soil which is sensitive to pressure, water, and vibration, and is easily disturbed. In order to make loess undisturbed as much as possible, we excavated two exploratory wells on the left side of the sliding source. The location of the exploratory well is shown in Figure 2, with a diameter of 0.8 m. Then, large pieces of the loess samples are cut from the side of the well and brought to the ground to be cut. A cylindrical soil block with dimensions of 160 mm × 300 mm was cut carefully along the vertical direction from the large pieces using the method of manual trimming. The gap between the sample and the cylinder container is filled with the loose soil left after cutting. Immediately, containers containing the loess samples were sealed to prevent water loss. In order to prevent vibration interference during transportation, a sponge is used between the cylinder containers.
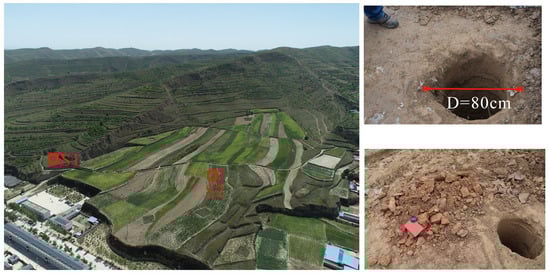
Figure 2.
Sampling locations of undisturbed loess (S1) and landslide deposit soil samples (S2).
The soil profiles of the landslide source and deposition are shown in Figure 3 with the corresponding sample points and shear wave velocity (Vs). The top elevation of S1 is 1871 m with 34 m of the soil. Apart from a thickness of 1.6 m for the top cultivated soil layer, a thickness of uniform loess is about 32 m, which is commonly designated as Q3 loess (Malan loess), based on the formation age and physical properties. The lower part is mudstone, which has low permeability and high strength. The stable groundwater level is 30 m below the ground. We sampled at the depths of 4 m, 6 m, 10 m, 16 m, 20 m, 24 m, and 30 m, respectively, and the number is S04, S06, S10, S16, S20, S24, and S30. The upper part of the S2 is cultivated soil with a thickness of 1.8 m, and the lower part is loess-like soil with a thickness of 35 m. Similarly, the stable groundwater level is 30 m below the ground. The depths of the 2 m, 4 m, 7 m, 10 m, 13 m,18 m, 20 m, 24 m, and 30 m soils were sampled respectively, and the number is D02, D04, D07, D10, D13, D18, D20, D24, and D30. In addition, shear wave velocity tests of two pits were conducted via the signal hole method. The results, as shown in Figure 3, present the shear wave velocity as increasing rapidly from the ground to a depth of 7 m, and the oscillation increases slowly below the depth of 7 m in S1. The average shear wave velocity in the upper 30 m (VS30) is 306 m/s. And, the shear wave velocity increases from the ground to a depth of 14 m, and the oscillation increases slowly below the depth of 14 m in S12. The average shear wave velocity in the upper 30 m (VS30) is 288 m/s.
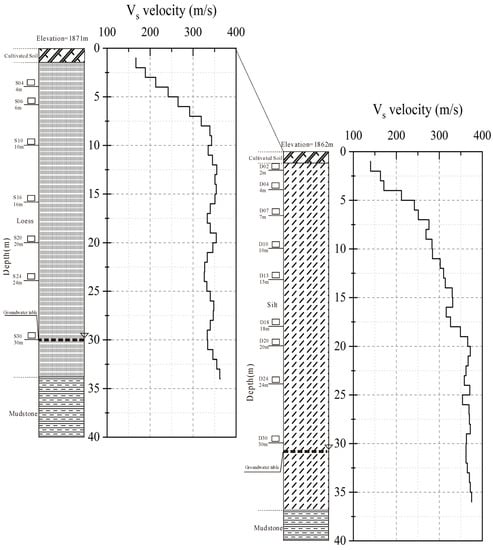
Figure 3.
Soil profile of sampling site (Vs values are measured via down-hole tests).
In this study, a series of laboratory tests were conducted. Table 1 shows the summary of laboratory tests and standards for soil properties. Due to the unique macro pore and the sub-stable microstructure of loess, the disturbance may have a serious impact on the mechanical properties of the soil mass. Therefore, the sample preparation should be conducted carefully in strict accordance with the established sample preparation standards to ensure that high-quality loess samples are obtained. The resonant column test adopts the GDS-RCA resonant column test system [29], where the test sample specifications are 50 mm in diameter and 100 mm in height.

Table 1.
The summary of laboratory tests and standards for soil properties.
3. Results and Discussion
3.1. Physical Property Characterization
The test results provided a specific gravity (Gs) of 2.71 for the undisturbed loess and a Gs value of 2.72 for the landslide deposit. As depicted in Figure 4, both the undisturbed loess and the deposit exhibit a gradual increase in the and with depth. However, at the same depth, the deposit’s and surpass those of the undisturbed loess.
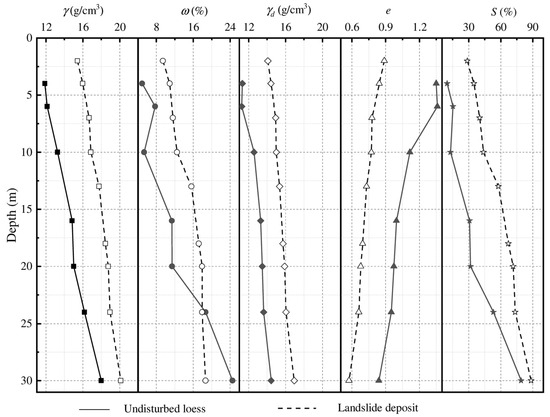
Figure 4.
Density, water content, dry density, initial void ratio, and saturation degree of undisturbed loess and landslide deposit at different depths.
Analyzing the moisture content–depth curve, the undisturbed loess maintains a relatively stable and low moisture content at depths shallower than 10 m. Between 10 and 20 m, it experiences a gradual rise in the moisture content, followed by a rapid surge in moisture below 20 m. The saturation level reaches approximately 80% at a depth of 30 m. In contrast, the deposit at the same depth showcases higher saturation than the undisturbed loess, with its moisture content uniformly increasing as the depth grows. At 30 m deep, the saturation level approaches 90%.
The alterations in the physical properties of these two materials stems from the notable changes in their porosity. The undisturbed loess, known for being a wind-blown soil with large pores, loose structure, and weak cohesion, exhibits a surface porosity ratio of 1.3. With greater depth, this ratio decreases, reaching 0.86 at 30 m deep, while still maintaining its character as a porous and loosely packed soil. Conversely, at the same depth, the deposit’s porosity ratio is significantly lower than that of the undisturbed loess. It reaches a maximum of 0.89 at the surface and declines with depth, reaching only 0.58 at a depth of 30 m.
This suggests that the loose and porous structure of the undisturbed loess becomes disrupted after undergoing the seismic landslide process. After deposition, the landslide deposit experiences reduced porosity, a compacted structure, increased density, and dry density.
The grain size distribution is presented in Figure 5. The results showed that the samples of undisturbed loess in the slope contain 8.1~14.8% of clay (<0.002 mm), 80.0~84.2% of silt (0.002–0.075 mm), and 3.8~7.7% of sand (0.075–0.25 mm). At a depth of 30 m, the soil sample exhibits the highest concentration of sand and the lowest concentration of clay. The samples of deposits contain 12.3~17.3% of clay (<0.002 mm), 77.1~84.5% of silt (0.002–0.075 mm), and 1.6~6.3% of sand (0.075–0.25 mm). Compared to the undisturbed loess, the landslide deposits exhibit an increase in the clay particle content and a decrease in the sand particle content.
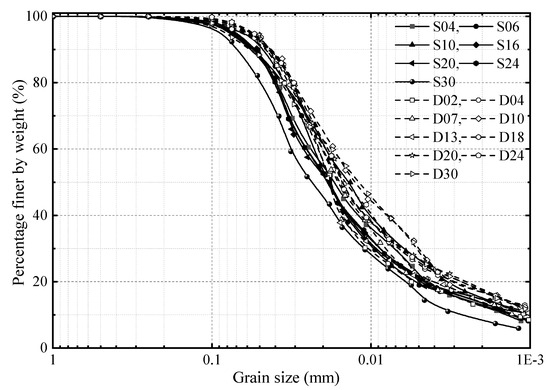
Figure 5.
Grain size distribution curve of undisturbed loess and landslide deposit in different depths.
The particle size distributions of the two sample types, undisturbed loess and landslide deposits, were subjected to statistical analysis by measuring their D60, D50, D30, and D10 values at different depths. The results depicted in Figure 6 indicate that, for the undisturbed loess, the D60 values display a fluctuating pattern with depth, ranging between 19.5 μm and 33.2 μm. The D50, D30, and D10 values exhibit relatively minor variations with depth, except for a more significant shift at a depth of 30 m.
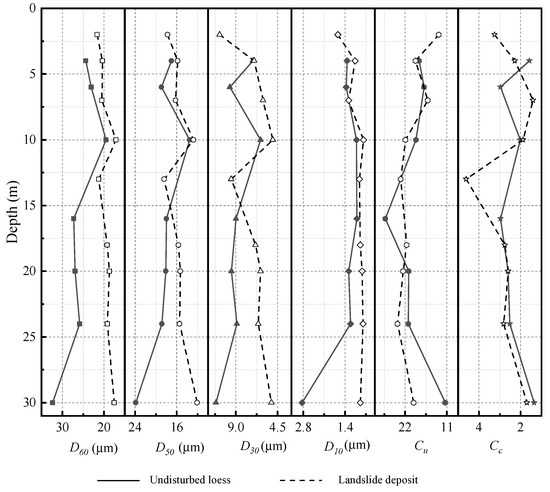
Figure 6.
The different diameter of undisturbed loess and landslide deposit in different depths.
In contrast, the landslide deposits exhibit consistent D60, D50, D30, and D10 values at various depths. When compared to the undisturbed loess, the landslide deposits display relatively uniform D60, D50, D30, and D10 values above a depth of 15 m. However, beyond the 15 m mark, the D60, D50, D30, and D10 values of the landslide deposits decrease, with the reductions being particularly pronounced for D60, D50, and D30.
Simultaneously, both the undisturbed loess and the landslide deposits have relatively high uniformity coefficients (Cu > 4), and their coefficients of curvature (Cc > 1) are also large. This indicates a wider distribution of particle sizes, implying a well-graded nature. In such cases, the soil particles exhibit significant variations in size, encompassing both larger and smaller particles.
In Table 2, the average D60, D50, D30, and D10 values of the landslide deposits are smaller than those of the undisturbed loess by 6.1 μm, 1.3 μm, 1.8 μm, and 0.4 μm, respectively. After experiencing seismic sliding, the larger particles in the soil have reduced. The coefficient of variation indicates that the particle size differences at various depths of the landslide deposits are minimal, suggesting that the particles have become more uniform across different depths due to the soil sliding process.
Table 2.
Mean value and coefficient of variation in grain size distribution of undisturbed loess and landslide deposit.
Soils with a higher proportion of smaller particles typically exhibit higher liquid limits. As shown in Figure 7, according to Gibbs’ classification method based on the liquid limit and the plasticity index, both the undisturbed loess and landslide deposit fall between the A-line and U-line. The undisturbed loess has a lower liquid limit, closer to silty loess, while the landslide deposit has a higher liquid limit, closer to clayey loess. The liquid limit test results are consistent with the particle analysis results.
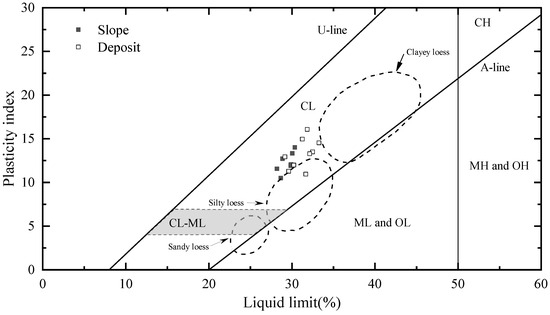
Figure 7.
Trends of plasticity characteristics of undisturbed loess and landslide deposit.
Based on the variations in the pore structure and particle size of the undisturbed loess and landslide deposits, it can be inferred that during the occurrence and movement of a landslide, the loose and porous structure of the undisturbed loess undergoes fragmentation. Larger soil particles experience compression, friction, fragmentation, and abrasion during their movement, resulting in the formation of smaller particles (Figure 8). Additionally, as the landslide progresses, continuous collisions among larger particles cause them to move downward, leading to further fragmentation and abrasion. Simultaneously, smaller particles are more easily transported via the surrounding soil and water flow, tending to settle in the lower sections of the landslide deposit. Consequently, the lower parts of the landslide deposit might contain a higher proportion of smaller particles. This phenomenon can be attributed to the combined effects of the fragmentation and abrasion of larger particles during their movement and the selective transportation and deposition of particles of different sizes during the landslide process.
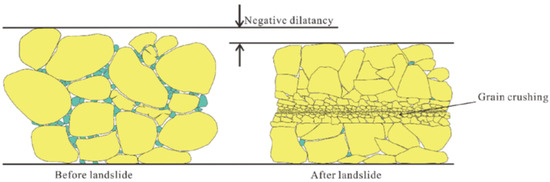
Figure 8.
Diagram of grain crushing during the sliding process [30].
3.2. Consolidation Characterization
The intact loess is a type of soil with strong structural strength and low initial density, and its mechanical properties are closely related to its structural characteristics. Its compression and plasticity characteristics also differ from other types of soils. The present study investigated the undisturbed loess and landslide deposit soil using a standard consolidation test. The soil samples were subjected to consolidation at different pressure levels (12.5, 25, 50, 100, 200, 300, 400, 600, and 800 kPa), and the rebound ratio of each level was recorded after 24 h of unloading. The void ratio of the samples after consolidation is ei,
In the equation, represents the initial void ratio, represents the initial height of the soil sample, and represents the deformation of the sample after achieving consolidation stability under a certain level of pressure.
The experimental data were processed using the da & de’s [31] program and the Casagrande’s [32] method was used to plot the compression curve, from which the compression index, pre-consolidation pressure (Pc), and over-consolidation ratio (OCR) were determined.
is the maximum vertical effective stress that a soil was subjected to in the past, and is the existing vertical effective stress.
The undisturbed loess has a strong structural behavior at a low water content, which is manifested as a state of over-consolidation, i.e., OCR is much greater than 1. As the water content of the soil sample increases, the structural behavior of the loess gradually weakens, and OCR tends to approach 1, which is manifested as a normal consolidation [33]. As shown in Figure 9, the initial pre-consolidation pressure of the undisturbed loess is notably higher than the vertical stress at the depths exceeding 5 m. With the increasing depth and moisture content, the pre-consolidation pressure and vertical stress gradually converge. This trend aligns with the typical understanding of the dynamic consolidation pressure in loess. The compression index ranges from 0.13 to 0.33, indicating a soil of moderate compressibility.
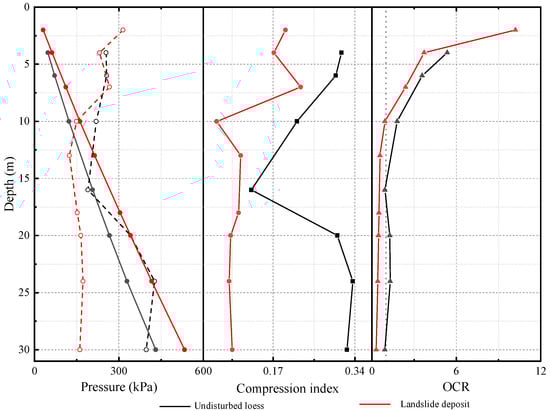
Figure 9.
The compression index and OCR of undisturbed loess and landslide deposit in different depths.
The upper layer (above 5 m) of the landslide deposit still maintains a pronounced structural behavior, whereas the vertical stress of the soil samples at the depths of 10 m and below progressively surpasses the pre-consolidation pressure. Consequently, the consolidation state shifts from over-consolidation at the surface to normal consolidation and eventually to under-consolidation. The compression coefficient of the soil samples at shallow depths ranges from 0.17 to 0.22, indicating moderate compressibility characteristics. Meanwhile, the compression coefficient of the soil samples at greater depths varies from 0.08 to 0.1, signifying low compressibility characteristics.
The intact loess experiences a significant alteration in its compression properties as its structure becomes disrupted during the sliding process and undergoes consolidation after deposition. The upper layer of the intact loess demonstrates characteristics of over-consolidated, under-compacted soil behavior at a low water content, while the deeper layer shows characteristics of normally consolidated, under-compacted soil behavior at a higher water content. The upper part of the landslide deposit exhibits over-consolidated, low-compression characteristics, whereas the lower part shows characteristics of under-consolidation with low compression. This phenomenon can be attributed to the greater compression and shear experienced via the deep-seated slide mass during the movement, leading to more severe soil disruption, the destruction of the loess structure, reduced porosity, and tighter particle arrangement. Furthermore, the landslide deposit has undergone nearly a century of substantial re-consolidation, but its deep layers still exhibit under-consolidated features. Thus, for engineering construction on such deposits, attention should be paid to the compression characteristics of the deep soil layers.
3.3. Dynamic Shear Modulus Characteristics
Loess has long been a focus of researchers due to its strong sensitivity to water and its vulnerability to earthquakes, particularly in terms of its dynamic properties, such as the dynamic shear modulus. However, little research has been conducted on whether the dynamic properties of the deposited soil mass change significantly after experiencing a landslide.
We normalized the results using G/Gmax-γ, and the experimental and fitting results are shown in the Figure 10, where the soil samples of D04, D10, D20, D30 and S04, S10, S20, S30 were subjected to resonant column tests with varying confining pressures of 50, 100, 200, and 300 kPa. The trends in the changes in the loess and landslide deposits under different consolidation pressures were similar, with the attenuation rate slowing down as the confining pressure increased. The attenuation of the intact loess was slower than that of the landslide deposits at the same burial depth. The G/Gmax-γ of the intact loess had a larger variation range than that of the landslide deposits under different confining pressures, indicating the pressure sensitivity of the intact loess, especially at depths of 4 m and 20 m. At a depth of 30 m, the curves for both the undisturbed loess and the landslide deposit are relatively similar.
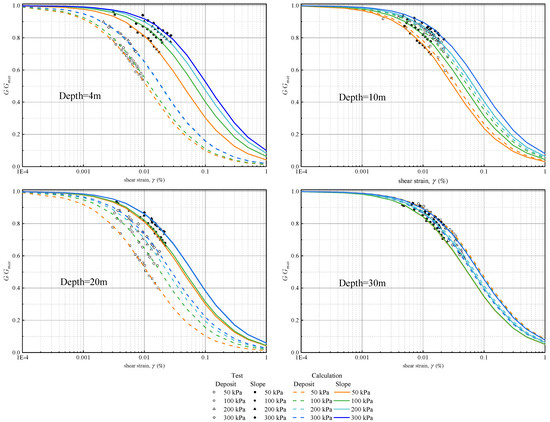
Figure 10.
Dynamic shear modulus ratio and dynamic shear strain curve of undisturbed loess and landslide deposit in different depths.
The test results were processed using Hardin’s model [34,35] to obtain the maximum dynamic shear modulus (Gmax) of the soil samples. As shown in the Figure 11a, both the undisturbed loess and the landslide deposit exhibit an increase in their dynamic shear modulus (Gmax) with rising confining pressures. Nevertheless, across various depths, the Gmax of the intact loess and the landslide deposit does not exhibit significant differences in most cases. There is an exception in the S10 depth group, where the Gmax is notably higher than the other depth groups. Within the soil samples taken from different depths of both the loess and landslide deposits, the rate of change in the dynamic shear modulus with the increasing confining pressure varies. Notably, for the intact loess with pronounced structural characteristics, the rate of change is slower in the upper layers compared to the deeper layers when subjected to the increasing confining pressures.
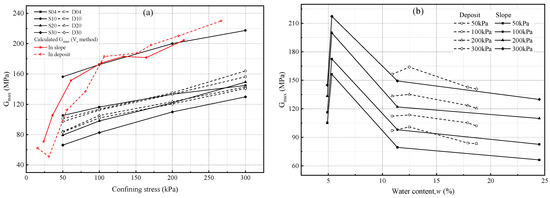
Figure 11.
(a) Mean effective confining pressure with the maximum dynamic shear modulus (Gmax) of undisturbed loess and landslide deposit, and (b) water content w (%) with the maximum dynamic shear modulus (Gmax) of undisturbed loess and landslide deposit.
Furthermore, the Gmax acquired via the shear wave velocity method surpasses the values obtained from conventional laboratory tests. This suggests that the shear wave velocity method is more sensitive and capable of providing a more accurate measurement of the maximum dynamic shear modulus of the soil.
The moisture content is one of the key control factors for the maximum dynamic shear modulus of loess. Song’s [36] experimental results showed that the maximum dynamic shear modulus of loess increased in three stages as the moisture content increased. When the moisture content of the loess is below its plastic limit, the dynamic shear modulus (Gmax) decreases with the increasing moisture content. When the moisture content of the loess approaches its plastic limit, Gmax undergoes a sharp decrease, reaching its maximum attenuation rate. As the moisture content of the loess further increases and exceeds its plastic limit, the attenuation trend of Gmax slows down and gradually stabilizes, even approaching saturation. Under low confining pressures, the initial dynamic shear modulus Gmax of the intact loess exhibits relatively weak sensitivity to the water content, but as the confining pressure increases, the water sensitivity of the loess becomes more pronounced.
In this study, as shown in Figure 11b, when the moisture content of the intact loess is below its plastic limit, Gmax initially increases and then rapidly decreases as the moisture content increases. With further increases in the moisture content, the rate of the Gmax attenuation slows down, and Gmax gradually stabilizes as it approaches saturation. This trend remains consistent under different confining pressures. However, the landslide deposit is less sensitive to the changes in the moisture content, and the attenuation trend of Gmax is relatively gradual. Regardless of the confining pressure, the Gmax of the landslide deposit is greater than that of the intact loess at the same moisture content. The results indicate that the sensitivity of the landslide deposit to the moisture content is weaker compared to the intact loess. This difference in sensitivity could be attributed to the variations in the material composition, particle arrangement, and structural characteristics of the deposit.
The Gmax of the soil is a crucial parameter for assessing the deformation and failure characteristics of the soil under dynamic loading. It holds significant importance in various fields including engineering design, seismic disaster prediction, underground structure design, and foundation engineering. It is closely related to factors such as soil porosity, confining pressure, and the OCR. A power empirical equation was developed by Hardin and Black [37] and Hardin [38], which considers the influence of pressure, the void ratio, and the over-consolidation ratio on Gmax:
where is the effective mean normal stress (kPa), is the atmospheric pressure (kPa), k is the function of the plasticity index, and , when = 0, 20, 40, 60, 80 and ≥100, k = 0.0, 0.18, 0.31, 0.41, 0.48 and 0.5. Considering the fact that the over-consolidation characteristics of the undisturbed loess are irrelevant to the stress history, and no additional OCR issue is required, therefore, the OCR values of the undisturbed loess are all 1. In addition, the soil at 4 m of the landslide deposit also exhibits the over-consolidation characteristics which are still related to its structural properties, and thus, the OCR value is also 1.
The fitting results for the undisturbed loess and landslide deposit are obtained, as shown in Table 3. The differences in the A and m values of the undisturbed loess with depth reflect the longitudinal variability of the soil properties. The A and m values of the landslide deposit exhibit relatively uniform changes, continuously increasing with depth and water content. In comparison to the undisturbed loess, the A and m values of the landslide deposit have undergone significant variations longitudinally, characterized by a noticeable increase in the A value. Notably, the m value is smaller than that of the shallow-depth, low-water content, undisturbed loess and larger than that of the deep-depth, high-water content, undisturbed loess.
Table 3.
Fitting parameters of Hardin and Black equation for undisturbed loess and landslide deposit.
The correlation coefficient of the fitting results indicates that the predicted parameters are reasonable, and these parameters can provide references for the maximum dynamic shear modulus of the soils at different depths in this region.
4. Conclusions
This series of tests aimed to conduct an in-depth investigation into the changes in the physical, mechanical, and dynamic properties of loess during the landslides triggered by earthquakes. The goal was to enhance our understanding of the formation mechanisms and movement processes of loess landslides. The following are the summarized conclusions of the study:
- The landslide process disrupts the original structure of the loess, resulting in a reduction in soil porosity and increased density. This process also leads to abrasion and the sieving of loess particles, transforming larger particles into smaller ones, thereby forming a more uniform particle size distribution. Within the landslide deposits, the movement and segregation of particles result in variations in the particle size distribution at different depths.
- Structural disruption and changes in the particle size significantly impact the consolidation characteristics of landslide deposits, leading to a substantial reduction in their compression coefficients. The study also revealed that despite nearly a century of consolidation, the soil in the middle and lower parts of the landslide deposits still exhibits under-consolidated behavior.
- Although the differences in the maximum dynamic shear modulus between the undisturbed loess and landslide deposits are relatively small, due to the variations in porosity, consolidation characteristics, and other factors, their dynamic shear modulus decay rates are faster in the landslide deposits than in the undisturbed loess. This underscores the importance of considering their physical property differences when assessing the deformation and failure characteristics of these soils under dynamic loading. Additionally, the fitting parameters (A and m) were derived from the experimental results to predict the maximum dynamic shear modulus of both the loess and landslide deposits in the region.
These conclusions have significant implications for engineering construction and landslide risk assessment in loess regions. They provide valuable insights into the differences in physical properties between the landslide deposits and loess and can be used to improve the engineering design and construction practices. Furthermore, the application of fitting parameters is expected to assist engineers in more accurately assessing the dynamic response of loess under the dynamic loading conditions.
Author Contributions
Methodology, D.P.; investigation, D.P., C.C., X.L. and Y.D.; data curation, D.P.; writing—original draft preparation, D.P.; writing—review and editing, D.P. and W.Q.; funding acquisition, J.B. All authors have read and agreed to the published version of the manuscript.
Funding
This research was funded by the National Natural Science Foundation of China (No. U1939209), and the Scientific Research Fund of Institute of Engineering Mechanics, China Earthquake Administration (Grant NO. 2020EEEVL0201).
Institutional Review Board Statement
Not applicable.
Informed Consent Statement
Not applicable.
Data Availability Statement
All data, models, or codes that support the findings of this study are available from the corresponding author upon reasonable request.
Conflicts of Interest
The authors declare no conflict of interest.
References
- Zhu, X.; Li, Y.; Peng, X.; Zhang, S. Soils of the loess region in China. Geoderma 1983, 29, 237–255. [Google Scholar]
- Wang, L.; Pu, X.; Chen, J. Distribution Characteristics and Disaster Risk of Earthquake Induced Landslides in the Loess Plateau. City Disaster Reduct. 2019, 126, 33–40. [Google Scholar]
- Xu, Y.; Allen, M.B.; Zhang, W.; Li, W.; He, H. Landslide characteristics in the Loess Plateau, northern China. Geomorphology 2020, 359, 107150. [Google Scholar] [CrossRef]
- Close, U.; McCormick, E. Where the mountains walked. Natl. Geogr. Mag. 1922, 41, 445–464. [Google Scholar]
- Xu, Y.; Liu-Zeng, J.; Allen, M.B.; Zhang, W.; Du, P. Landslides of the 1920 Haiyuan earthquake, northern China. Landslides 2021, 18, 935–953. [Google Scholar] [CrossRef]
- Zhuang, J.; Peng, J.; Xu, C.; Li, Z.; Densmore, A.; Milledge, D.; Iqbal, J.; Cui, Y. Distribution and characteristics of loess landslides triggered by the 1920 Haiyuan Earthquake, Northwest of China. Geomorphology 2018, 314, 1–12. [Google Scholar] [CrossRef]
- Lanzhou Institute of Seismology; SSB; Seismic Crew of Ningxia Hui Autonomous Region. AD 1920 Haiyuan Great Earthquake; Seismological Press: Beijing, China, 1980. [Google Scholar]
- Zhang, Z.; Wang, L. Geological disasters in loess areas during the 1920 Haiyuan Earthquake, China. GeoJournal 1995, 36, 269–274. [Google Scholar] [CrossRef]
- Chang, C.; Bo, J.; Qi, W.; Qiao, F.; Peng, D. Distribution of large-and medium-scale loess landslides induced by the Haiyuan Earthquake in 1920 based on field investigation and interpretation of satellite images. Open Geosci. 2022, 14, 995–1019. [Google Scholar] [CrossRef]
- Shanmugam, G.; Wang, Y. The landslide problem. J. Palaeogeogr. 2015, 4, 109–166. [Google Scholar] [CrossRef]
- Cheng, C.H.; Hsiao, S.C.; Huang, Y.S.; Hung, C.Y.; Pai, C.W.; Chen, C.P.; Menyailo, O.V. Landslide-induced changes of soil physicochemical properties in Xitou, Central Taiwan. Geoderma 2016, 265, 187–195. [Google Scholar] [CrossRef]
- Puri, V.K. Liquefaction Behavior and Dynamic Properties of Loessial (Silty) Soils; University of Missouri: Rolla, MO, USA, 1984. [Google Scholar]
- Ishihara, K.; Okusa, S.; Oyagi, N.; Ischuk, A. Liquefaction induced flow slide in the collapsible loess deposit in Soviet Tajik. Soils Found. 1990, 30, 73–89. [Google Scholar] [CrossRef]
- He, G.; Zhu, H. Study on loess seismic settlement. J. Geotech. Eng. 1990, 6, 99–103. [Google Scholar]
- Wang, J.; Gu, T.; Zhang, M.; Xu, Y.; Kong, J. Experimental study of loess disintegration characteristics. Earth Surf. Process. Landf. 2019, 44, 1317–1329. [Google Scholar] [CrossRef]
- Varnes, D.J. Slope movement types and processes. Spec. Rep. 1978, 176, 11–33. [Google Scholar]
- Wang, J.; Zhang, Z. Mechanism study of earthquake-induced high-speed loess landslides. J. Geotech. Eng. 1999, 6, 670–674. [Google Scholar]
- Zhang, Z.; Duan, R. Discussion on seismic subsidence of loess sites in the northwest of China during earthquakes. In Proceedings of the International Symposium on Engineering Geology 1986, Problems of Seismic Areas, Bari, Italy, 13–19 April 1986; Istituto: Florence, Italy, 1986; Volume 2, pp. 65–76. [Google Scholar]
- Seed, H.B.; Martin, G.R. The seismic coefficient in earth dam design. J. Soil Mech. Found. Div. 1966, 92, 25–58. [Google Scholar] [CrossRef]
- Zhang, D.; Takeuchi, A.; Sassa, K. The Motion Characteristics of Loess Landslides Induced by the Haiyuan Earthquake in the Ningxua Province, China. Landslides 1995, 32, 12–17_1. [Google Scholar] [CrossRef][Green Version]
- Zhang, D.; Wang, G. Study of the 1920 Haiyuan earthquake-induced landslides in loess (China). Eng. Geol. 2007, 94, 76–88. [Google Scholar] [CrossRef]
- Wang, G.; Zhang, D.; Furuya, G.; Yang, J. Pore-pressure generation and fluidization in a loess landslide triggered by the 1920 Haiyuan earthquake, China: A case study. Eng. Geol. 2014, 174, 36–45. [Google Scholar] [CrossRef]
- Wang, L. Loess Dynamics; Seismological Press: Beijing, China, 2003. [Google Scholar]
- Carey, J.M.; McSaveney, M.J.; Petley, D.N. Dynamic liquefaction of shear zones in intact loess during simulated earthquake loading. Landslides 2017, 14, 789–804. [Google Scholar] [CrossRef]
- Pei, X.; Zhang, X.; Guo, B.; Wang, G.; Zhang, F. Experimental case study of seismically induced loess liquefaction and landslide. Eng. Geol. 2017, 223, 23–30. [Google Scholar] [CrossRef]
- Zhang, L.M.; Xu, Y.; Huang, R.Q.; Chang, D.S. Particle flow and segregation in a giant landslide event triggered by the 2008 Wenchuan earthquake, Sichuan, China. Nat. Hazards Earth Syst. Sci. 2011, 11, 1153–1162. [Google Scholar] [CrossRef]
- Getahun, E.; Qi, S.W.; Guo, S.F.; Zou, Y.; Liang, N. Characteristics of grain size distribution and the shear strength analysis of Chenjiaba long runout coseismic landslide. J. Mt. Sci. 2019, 16, 2110–2125. [Google Scholar] [CrossRef]
- Li, Y.; Mo, P. A unified landslide classification system for loess slopes: A critical review. Geomorphology 2019, 340, 67–83. [Google Scholar] [CrossRef]
- Huang, X.; Cai, X.; Bo, J. Experimental study of the influence of gradation on the dynamic properties of centerline tailings sand. Soil Dyn. Earthq. Eng. 2021, 151, 106993. [Google Scholar] [CrossRef]
- Zhu, L.; Cui, S.; Pei, X.; Zhang, X.; Wang, H.; He, S.; Luo, L. Investigation of the characteristics and long-runout movement mechanisms of the Luanshibao landslide on the eastern margin of the Qinghai-Tibet Plateau. Soil Dyn. Earthq. Eng. 2022, 153, 107094. [Google Scholar] [CrossRef]
- da Silva, A.R.; de Lima, R.P. Soil physics: An R package to determine soil preconsolidation pressure. Comput. Geosci. 2015, 84, 54–60. [Google Scholar] [CrossRef]
- Casagrande, A. Research on the Atterberg limits of soils. Public Roads 1932, 13, 121–136. [Google Scholar]
- Wang, Q.; Kong, Y.; Zhang, X. Mechanical Effect of Pre-consolidation Pressure of Structural Behavior Soil. J. Southwest Jiaotong Univ. 2016, 5, 987–994. [Google Scholar]
- Hardin, B.O.; Drnevich, V.P. Shear modulus and damping in soils: Design equations and curves. J. Soil Mech. Found. Div. 1972, 98, 667–692. [Google Scholar] [CrossRef]
- Darendeli, M.B. Development of a New Family of Normalized Modulus Reduction and Material Damping Curves; The University of Texas: Austin, TX, USA, 2001. [Google Scholar]
- Song, B.; Tsinaris, A.; Anastasiadis, A.; Pitilakis, K.; Chen, W. Small-strain stiffness and damping of Lanzhou loess. Soil Dyn. Earthq. Eng. 2017, 95, 96–105. [Google Scholar] [CrossRef]
- Hardin, B.O.; Black, W.L. Vibration modulus of normally consolidated clay. J. Soil Mech. Found. Div. 1968, 94, 353–369. [Google Scholar] [CrossRef]
- Hardin, B.O. The nature of stress-strain behavior for soils. In Earthquake Engineering and Soil Dynamics—Proceedings of the ASCE Geotechnical Engineering Division Specialty Conference, Pasadena, CA, USA, 19–21 June 1978; American Society of Civil Engineers: Reston, VA, USA, 1978; Volume I, Sponsored by Geotechnical Engineering Division of ASCE in cooperation with: (No. Proceeding). [Google Scholar]


Disclaimer/Publisher’s Note: The statements, opinions and data contained in all publications are solely those of the individual author(s) and contributor(s) and not of MDPI and/or the editor(s). MDPI and/or the editor(s) disclaim responsibility for any injury to people or property resulting from any ideas, methods, instructions or products referred to in the content. |
© 2023 by the authors. Licensee MDPI, Basel, Switzerland. This article is an open access article distributed under the terms and conditions of the Creative Commons Attribution (CC BY) license (https://creativecommons.org/licenses/by/4.0/).