Article

Process Quality Control Method for Three-Cylinder Engine Balance Shaft System Oriented to Manufacturing Supply Chain

1
College of Mechanical and Electrical Engineering, Wuhan University of Technology, Wuhan 430070, China
2
College of Automotive and Electromechanical Engineering, Xinyang Vocational and Technical College, Xinyang 464000, China
3
State Key Laboratory of Mechanical Transmission, Chongqing University, Chongqing 400044, China
*
Author to whom correspondence should be addressed.
Appl. Sci. 2023, 13(19), 10788; https://doi.org/10.3390/app131910788
Submission received: 1 August 2023 / Revised: 23 September 2023 / Accepted: 25 September 2023 / Published: 28 September 2023

Abstract

:
Automobile manufacturers often outsource key components and parts to suppliers, hence ensuring that process quality has been a hot topic in current research. The quality control demands at different stages of the manufacturing supply chain cycle have been ignored in traditional process quality control methods. To solve this issue, this paper takes the three-cylinder engine balance shaft system as the research object, and builds a process quality control model for the three-cylinder engine balance shaft system oriented to the manufacturing supply chain. The metagraph theory is introduced, and parts suppliers in the manufacturing supply chain, product process quality attributes, supply chain revenue function, and other key elements are defined. By constructing the revenue function of the three-cylinder engine balance shaft system process quality control model, the feasibility of the proposed method is verified by taking the process quality control of one certain three-cylinder engine balance shaft system as a verification example. The results show that, with other conditions unchanged, the application of this method can increase the overall profit of the manufacturing supply chain by 100% at the stage of preparation before product machining, and more than 8% at the stage of product performance evaluation. The proposed method of process quality control based on the metagraph theory provides a theoretical basis for building an information sharing platform of product process quality, and effectively reduces the machining cost for product improvement and upgrading in the manufacturing supply chain.

1. Introduction

Due to a scarcity of skilled workers and technical resources, components and parts manufacturers often outsource some of their products to suppliers for machining [1]. Research shows that more than 80% of vehicle failures result from the process quality of automobile components and parts [2], which is why the manufacturing process quality of components and parts has been a hot topic in current research.
Research on process quality control mainly focuses on total quality management [3], statistical process control [4], multistage manufacturing process quality control [5], supply chain quality management [6], etc. Total quality management adopts quality strategies to meet customer needs, and emphasizes that all departments of the enterprise shall ensure process quality to promote quality development and improvement, but it does not consider the coordination among various suppliers. Statistical process control focuses on product quality characteristics and applies sample statistical methods to achieve monitoring of the production process quality, but it is not suitable for small batch production stages with few data samples. Multistage manufacturing process quality control applies state-space to represent the analysis of the error transmission process of multiple processing units, operating equipment, etc., which is based on the stream of variation. However, it does not consider the production capabilities of various suppliers at each stage. Supply chain quality management focuses on the relationship between upstream suppliers and downstream customers, with the goal of selecting appropriate suppliers and ensuring product quality. In the face of the existing problems in traditional process quality control, Shi Jianjun [7] proposed a process quality improvement method, emphasizing monitoring, diagnosis, and control in the production process. Foivos Psarommatis et al. [8,9,10] analyzed the literature review of zero-defect manufacturing and obtained that the four strategies for zero-defect manufacturing were detection, repair, prediction, and prevention. They also proposed a hybrid decision support system based on the zero-defect manufacturing strategies of detection and repair, to help manufacturers move closer to zero-defect manufacturing. The above methods applied data-driven technologies to ensure product quality level and minimize low-quality costs, but they ignored the quality control demands at different stages in the manufacturing supply chain cycle. Therefore, the focus of this study is to propose a quality control method for the entire manufacturing supply chain process based on the demands at different stages of the manufacturing supply chain cycle.
The automobile manufacturing supply chain is a hierarchical network comprising automobile manufacturers and auto parts suppliers, with the assurance of auto parts process quality as the core [11]. The process quality control oriented to the manufacturing supply chain includes three stages: quality assessment for the auto parts suppliers, quality management during production, and quality inspection and assurance [12]. Product quality is jointly completed by multiple auto parts suppliers, who play different roles in quality management at different stages of the manufacturing supply chain [13]; product process quality is an important criterion for the selection and monitoring of auto parts suppliers [14]. However, since the real-time sharing of information for process quality among parts suppliers has not been realized, problems relating to process quality may not be discovered in the first place. How to select appropriate auto parts suppliers, and enhance the coordination and exchange of process quality information among them in the entire process of manufacturing supply chain, is an issue that needs to be solved urgently.
Selecting right parts suppliers is conducive to reducing product procurement costs. Some scholars considered the impact of product quality, transportation costs, delivery time, production capacity, service management, technology, and other factors to construct an evaluation index system for parts suppliers [15,16]. They applied multicriteria decision-making (MCDM), fuzzy TOPSIS approach, NSGA-II, etc., to develop a supplier decision-making system, and took the overall performance and profit of the manufacturing supply chain as constraints to help decision-makers choose the right suppliers quickly and effectively [17,18]. To ensure the overall profit of auto parts suppliers, Yang H and Peng J [19] took into account the production capacity of suppliers, and formulated a coordination method for the two-tier manufacturer–supplier supply chain to optimize product price and order quantity. Yang Zongkang [20] used the Stackelberg game model to build and explain the optimal centralized and decentralized operational decisions of node enterprises within the supply chain, and analyzed the influence of core enterprises on the profit and quality levels of node enterprises. The above analysis mainly constructed a parts supplier selection model from the perspective of product procurement costs and supplier order allocation, without delving into aspects of process quality and machining costs of auto parts suppliers.
After determining the auto parts suppliers, process variation monitoring and quality stability analysis during the manufacturing process are important means to ensure product quality. Magnanini M C et al. [21] proposed a downstream compensation control model, considering the measurement of each machining stage and the disturbance variables in the entire process. Kou Z [22] proposed an association rule mining method based on the chaotic gravity search algorithm, which could be used to discover the hidden relationship between the manufacturing system capability and product characteristics, thereby reducing the development time and cost of new product design and manufacturing. Gao Z [23] et al. proposed a method combining a genetic backpropagation (BP) neural network algorithm and gray correlation analysis to effectively control the quality and identify key procedures of the product manufacturing process. Sheng Hu et al. [24] proposed a data-driven process quality fluctuation monitoring method based on the similarity of data cloud models, which enabled technique fluctuation monitoring and analysis of quality stability during product machining. However, the process quality of auto parts is jointly completed by the members in the manufacturing supply chain (suppliers and manufacturers). The above research did not consider the coordination and management of product process quality between auto manufacturers and suppliers, and among suppliers.
Xu Xiaojing et al. [24] pointed out that auto parts manufacturing supply chain management urgently required core enterprises to change their mindset into cooperative thinking, openness, and sharing, so as to promote cooperation and exchange among auto parts suppliers. Some scholars considered process quality control, and tried to analyze the parallel design method of manufacturing process quality and supplier management. Janjić Goran et al. [25] considered the impact of parts outsourcing policies and proposed an OEM-led quality management model for incoming parts in the automobile industry, though the coordination model for the supplier’s specific production process had not yet been provided. Rosyidi C N et al. [26] developed a parallel design model of supplier selection and component allocation, considering multiple constraints such as the production capacity of suppliers, assembly quality, techniques, and technical capability, and with the purpose of minimizing procurement cost and fuzzy quality loss. By adopting the asymmetric tolerances Taguchi capability index as a data-driven supplier selection tool, Chin-Hsin Wang [27] established a comprehensive supplier selection model based on process quality. Attri R. and Grover S. [28] adopted the graph theoretic approach (GTA) to build a decision quality model for evaluating different stages of the product lifecycle, thus addressing the problem of quantifying the complexity of the automobile manufacturing supply chain. However, the above research has not yet truly constructed a correlation model between the network structure of auto parts suppliers and product process quality attributes.
In order to solve the above issues, this paper comprehensively considers supplier selection, product process quality control, supplier coordination, and other factors. Based on metagraph theory, a fusion method for product process quality control theory and process quality management theory of automobile manufacturing supply chain is proposed, and a process quality control model is constructed. Taking the machining of a three-cylinder engine balance shaft system as an example, the cost–benefit model of product process quality control in the two-level manufacturing supply chain is established, considering factors of machining quality, testing quality, assembly quality, and other factors to verify the feasibility and effectiveness of the method proposed in this paper.
The rest of the paper includes the following contents: Section 2 describes in detail the process quality control demand for the three-cylinder engine balance shaft system oriented to the manufacturing supply chain, and the supplier network structure is established. In Section 3, the process quality control model is built. Section 4 focuses on verification through the example, analysis, and discussion.

2. Process Quality Control Demand and Construction of Control Network

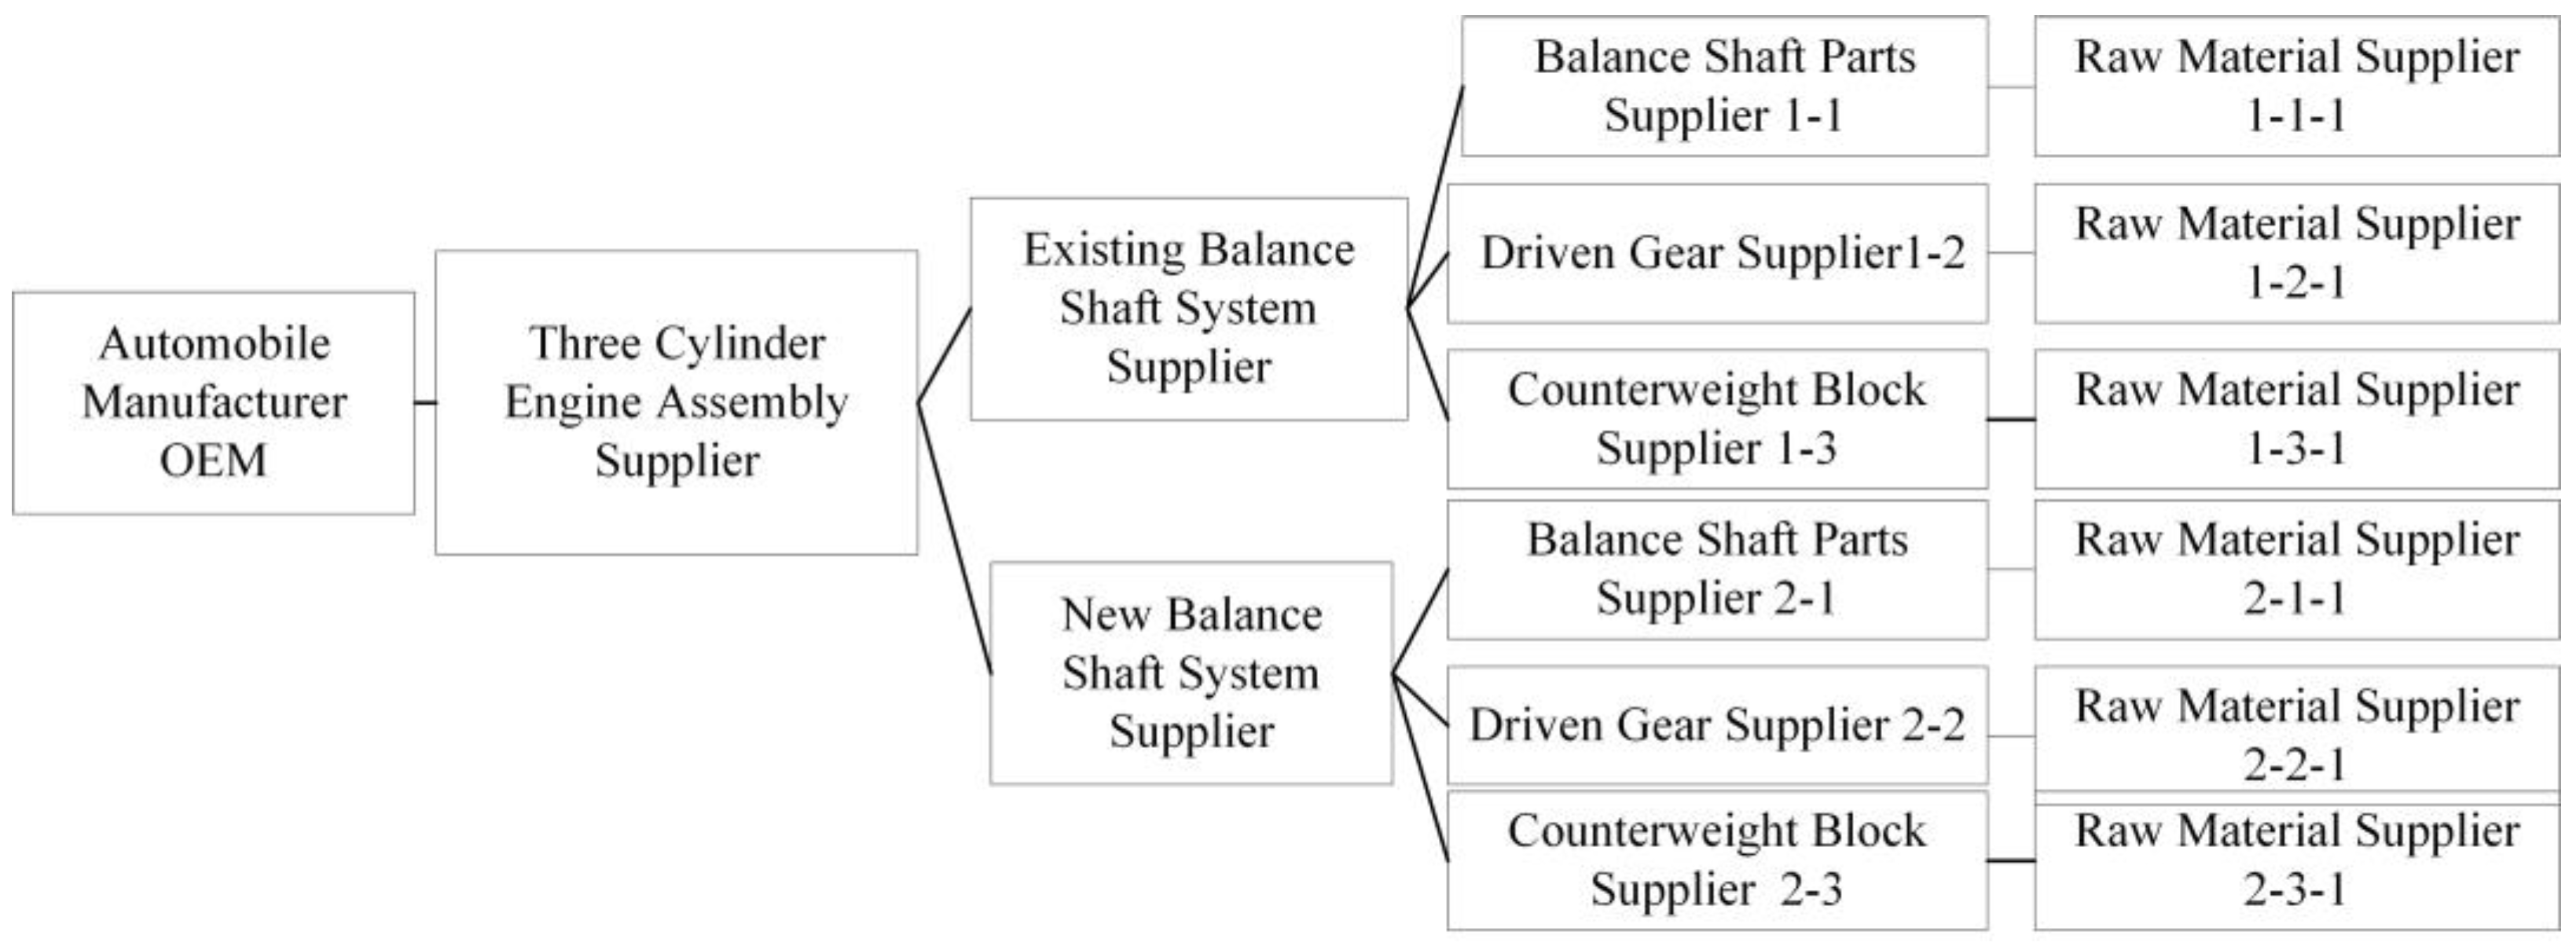
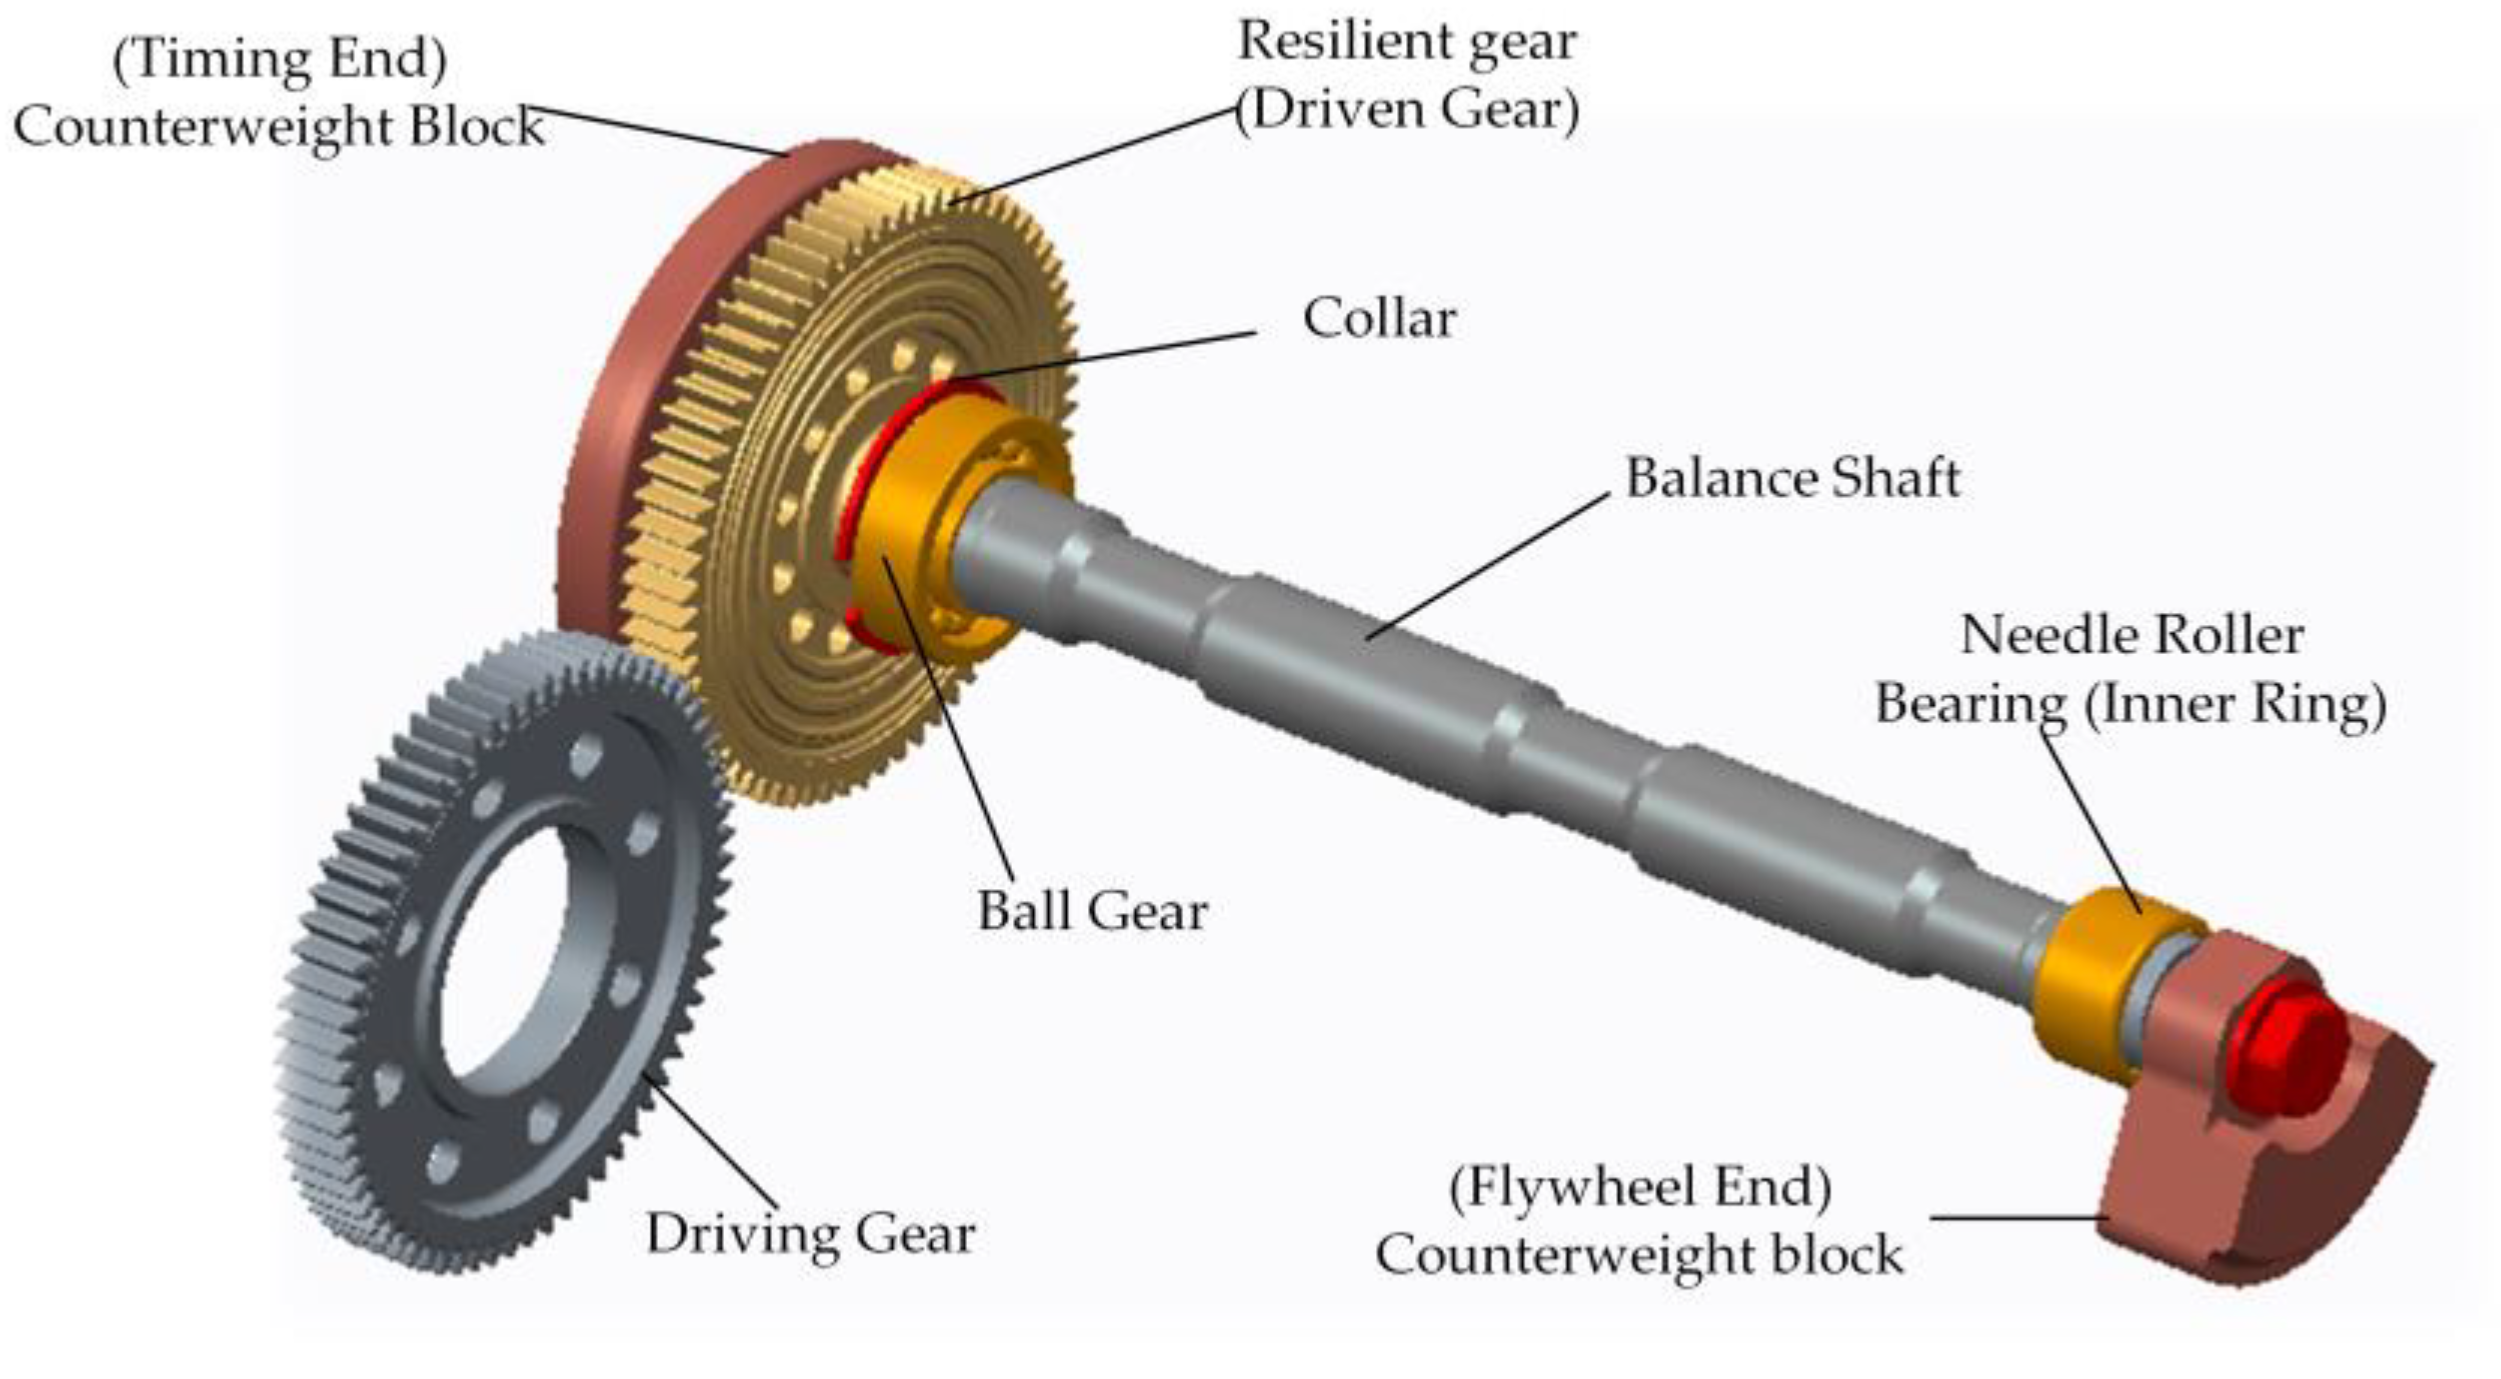
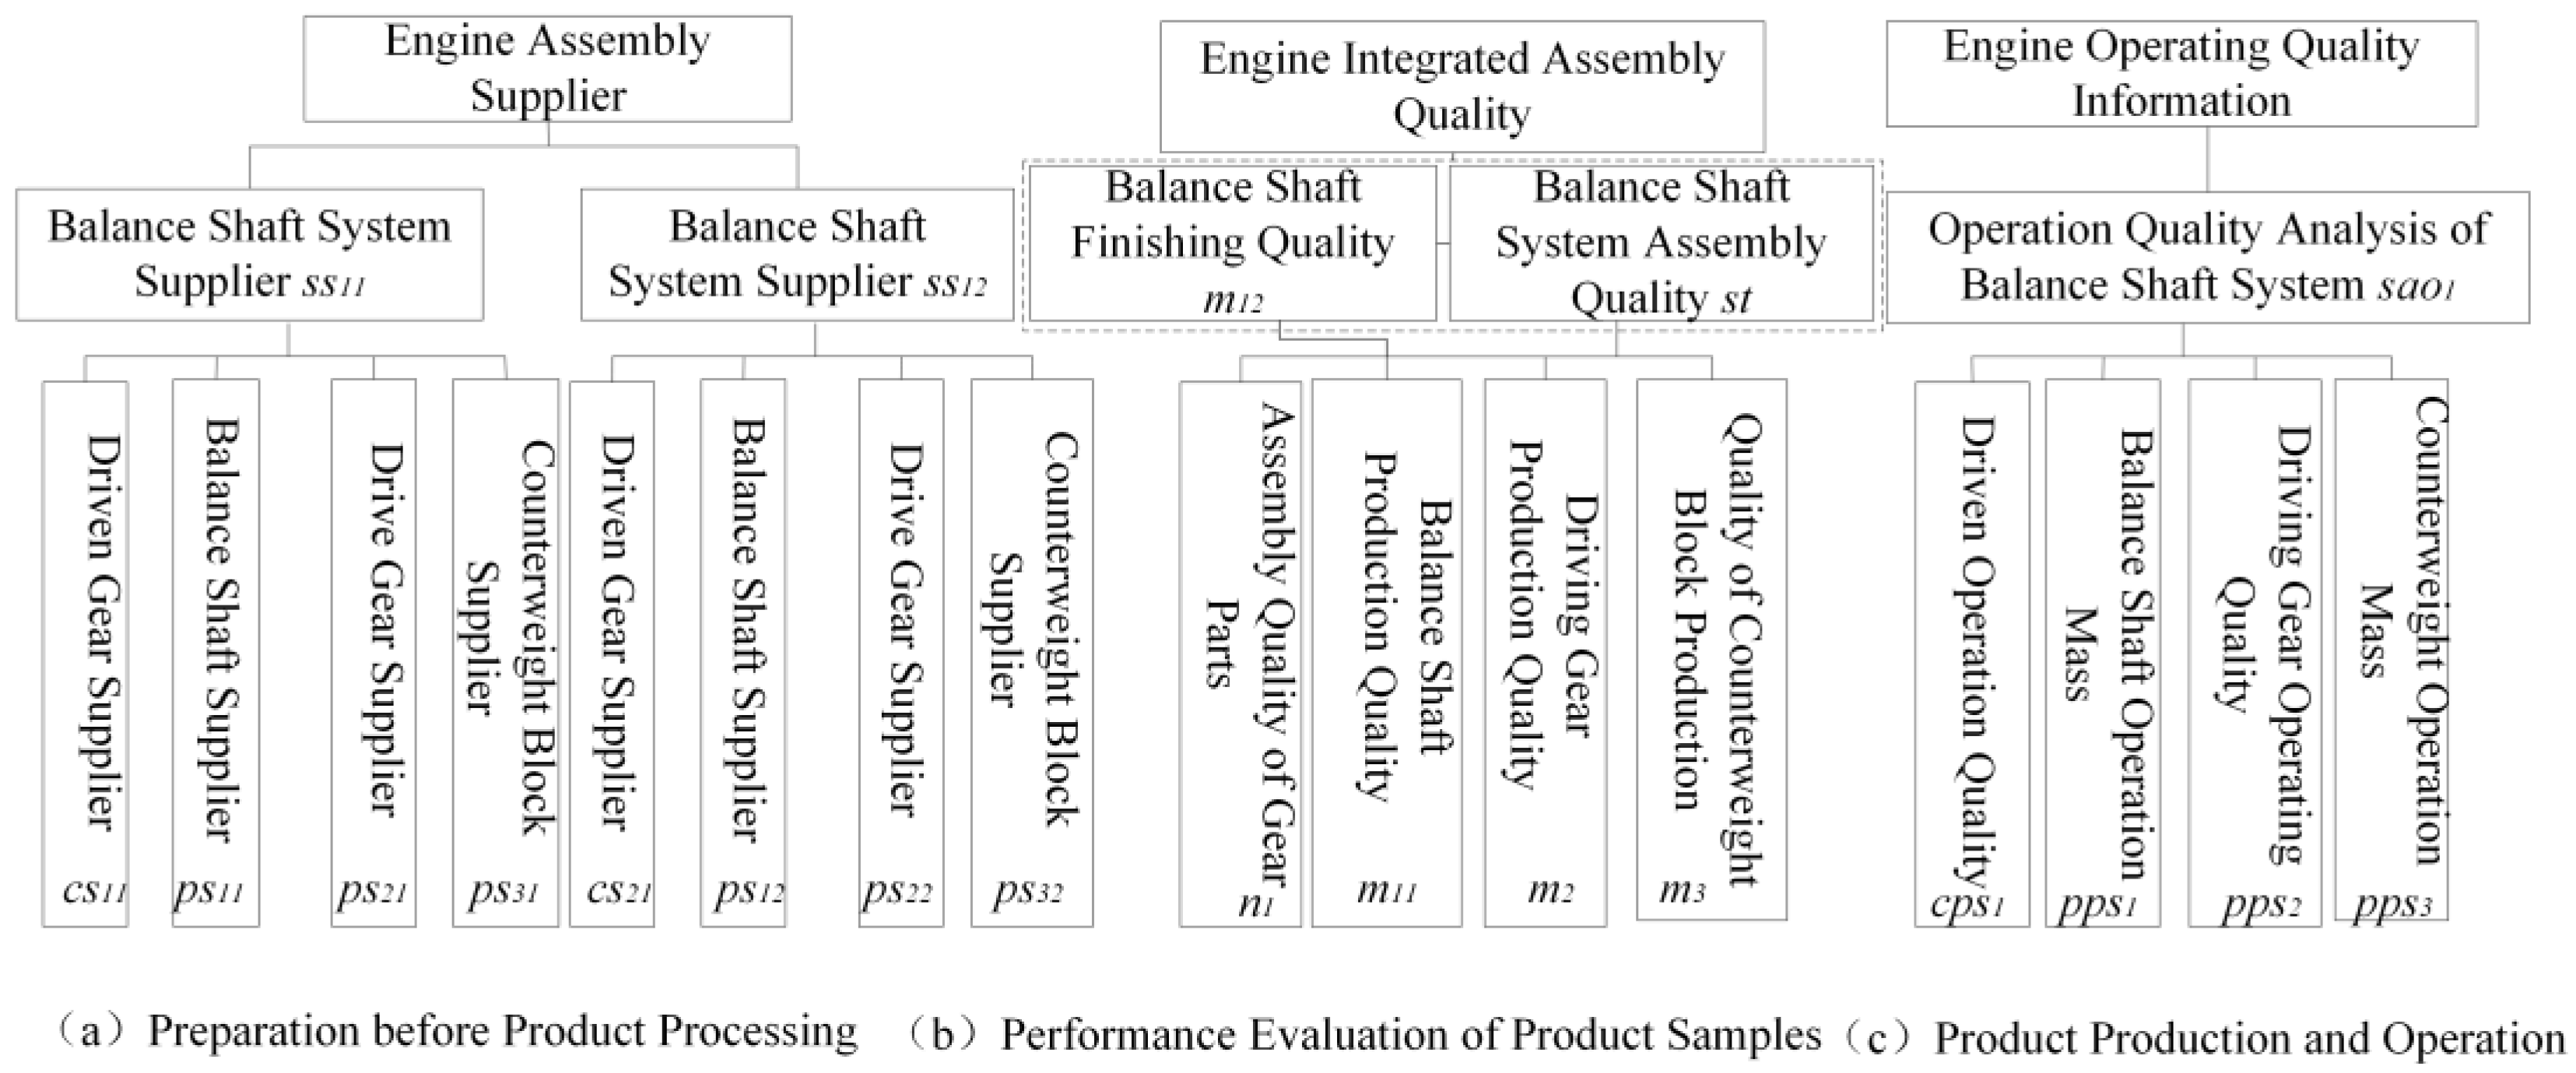
2.1. Composition of Three-Cylinder Engine Balance Shaft System and Demand Analysis of Product Process Quality Control Oriented to Manufacturing Supply Chain

A certain typical three-cylinder engine balance shaft system has been taken as an example, the structure of which is shown in Figure 1, composed of a driving gear, a driven gear, a balance shaft, two counterweight blocks, a bearing, a collar, etc.
According to the basic definition of automobile manufacturing supply chain and its cycle in [11], as well as the structure of the three-cylinder engine balance shaft system, the processing tasks of the three-cylinder engine parts suppliers are obtained, as shown in Table 1.
According to the machining tasks of parts suppliers at each stage in Table 1, Figure 2 provides the implementation process of process quality control for the three-cylinder engine balance shaft system oriented to the manufacturing supply chain.
In Figure 2, different implementation entities are involved in each stage. At the stage of preparation before product processing, the assembly suppliers for the three-cylinder engine release the product processing tasks for the balance shaft system, and select the right suppliers for the balance shaft system. In this process, the supplier selection model is constructed, considering the quality level of suppliers for the balance shaft, the counterweight block, and the drive gear. At the stage of sample product performance evaluation, small assembly suppliers of the balance shaft system collaborate with various parts suppliers to ensure the process quality of the balance shaft system. At the stage of production and operation, small assembly suppliers of the balance shaft system need to construct the operation quality control model based on the operation data, and release warning information and maintenance plans accordingly. In the face of the process quality control demand in the three stages, a product process quality control network structure needs to be constructed, thus building a process quality control model for the three-cylinder engine balance shaft system oriented to the manufacturing supply chain.

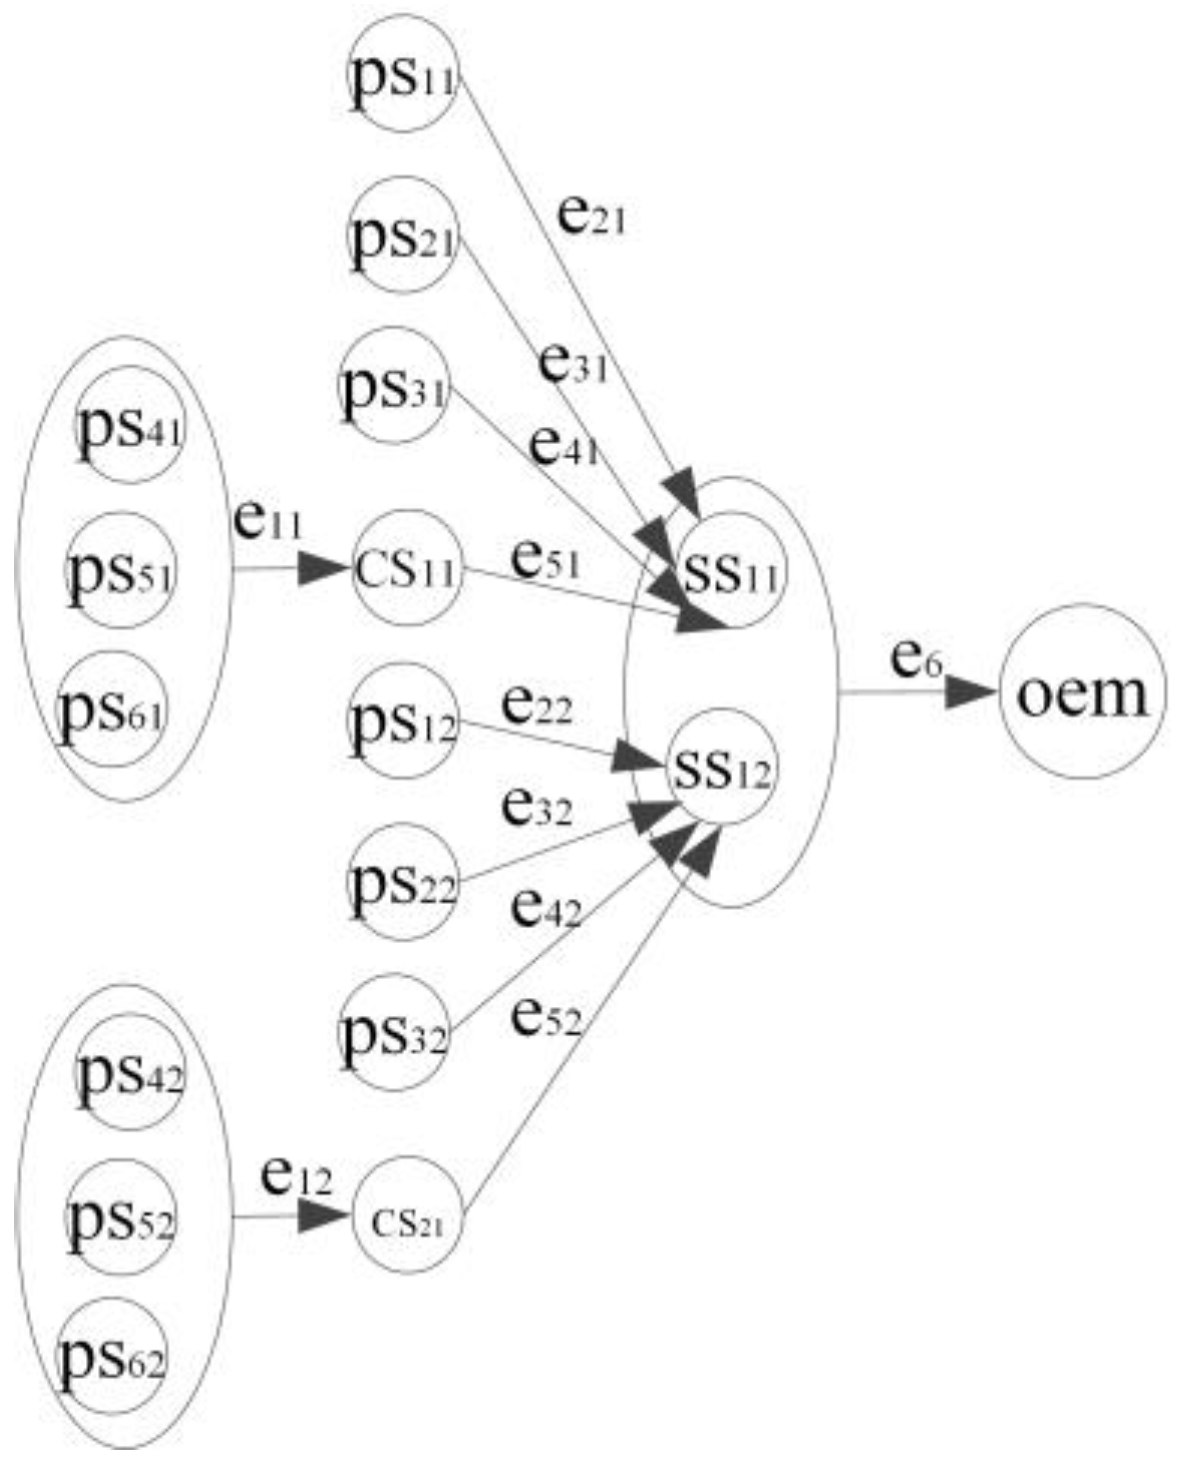
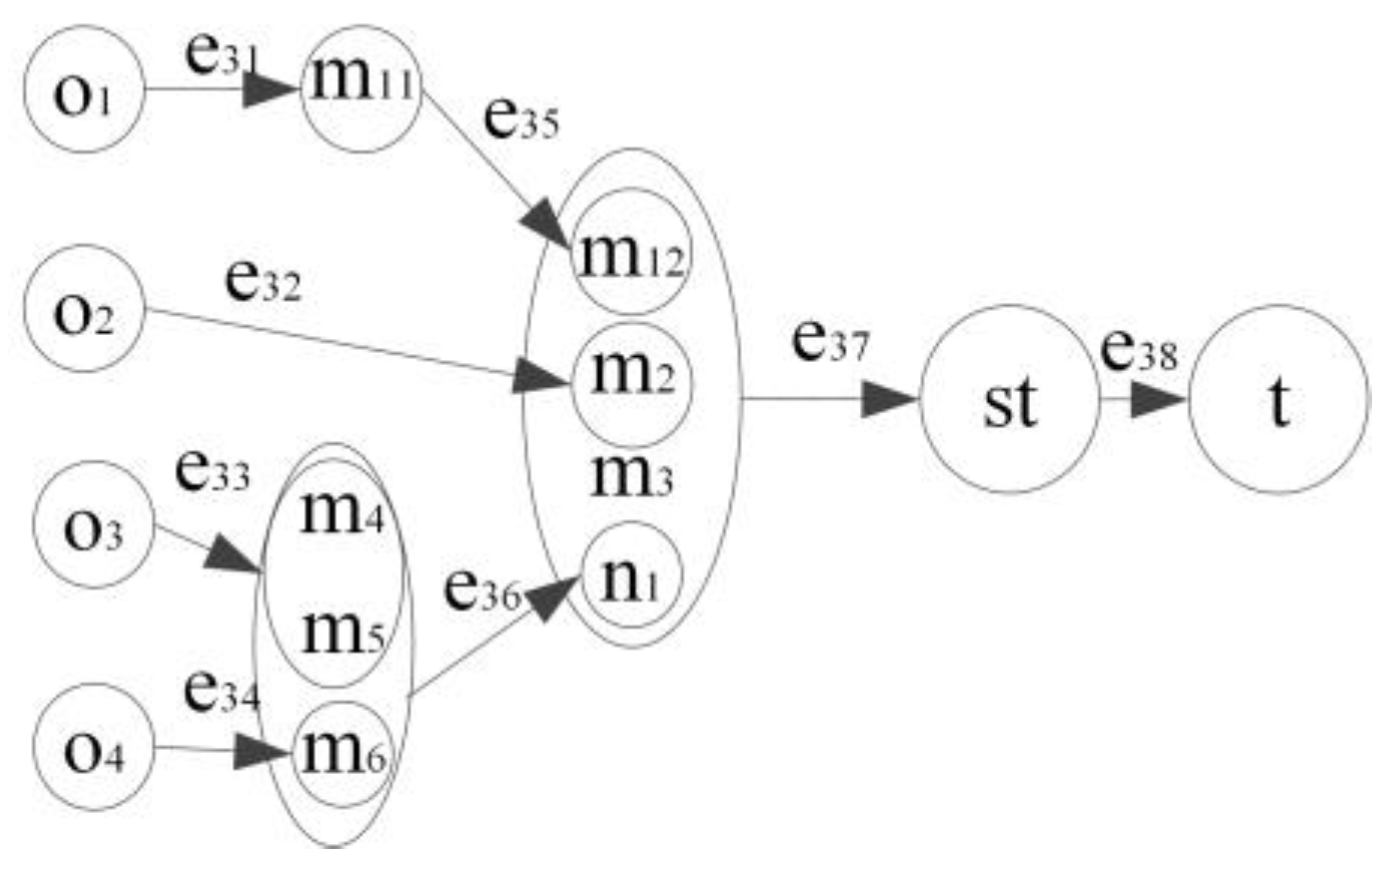
2.2. Construction of Process quality Network for the Three-Cylinder Engine Balance Shaft System Oriented to the Manufacturing Supply Chain

(1) Network structure of parts suppliers for the three-cylinder engine balance shaft system
Parts suppliers for the three-cylinder engine balance shaft system include the automobile manufacturer, the three-cylinder engine assembly supplier, the supplier for the balance shaft system, suppliers for parts such as balance shaft, gear, and counterweight block, suppliers for raw materials, etc. In this paper, the three-cylinder engine assembly supplier seeks new balance shaft system suppliers for upgrades and improvements of the balance shaft system based on the current balance shaft system supplier. Each balance shaft system supplier has its own parts suppliers. After the parts suppliers for the balance shaft and counterweight block deliver the corresponding parts to the balance shaft system supplier, the balance shaft system supplier will finish and deliver them to the assembly supplier for assembly. The network structure of parts suppliers for the system is shown in Figure 3.
(2) Network Structure of Process Quality Attributes for the Three-Cylinder Engine Balance Shaft System Oriented to the Manufacturing Supply Chain
The manufacturing process of the parts for the three-cylinder engine balance shaft system mainly includes raw material processing, product processing, product assembly, product operation prediction, etc. According to the changes of product processing methods and product quality attributes, the basic structure of the process quality attributes for the system can be obtained, which is shown in Figure 4.
In Figure 4, {A, B, C, D, E, F, …} represent the quality attributes or states of auto parts at any stage (in any enterprise) in the manufacturing supply chain, and {X1, X2, X3, X4, …} represent the manufacturing methods or processing methods adopted for the transformation of a product quality attribute into another quality attribute. Figure 4a indicates that quality attribute A is obtained from state B through X1. Figure 4b indicates that quality attribute D is obtained from quality attribute A through processing method X2 and heat treatment method X3. Product quality attribute C is obtained from quality attribute A through heat treatment method X3. Figure 4c shows that product quality attribute F is obtained from quality attribute D and E through assembly method X4. Figure 4d indicates the influence of quality attribute on parts D and E during the operation stage due to vibration, wear, and other factors, and F1, D1, and E1 represent the states of auto parts during the operation stage.
(3) Data Structure of Process Quality for the Three-Cylinder Engine Balance Shaft System Oriented to the Manufacturing Supply Chain
According to the life cycle of the manufacturing supply chain and the formation process of a product quality attribute, the three-cylinder engine balance shaft system is analyzed. The suppliers at each stage are integrated into the process, and every node enterprise possesses an input of one product quality attribute and an output of another quality attribute. Together with the combination mode of parts suppliers of the three-cylinder engine balance shaft system in Figure 3, the data structure of the product during processing for the system can be obtained, which is shown in Figure 5.

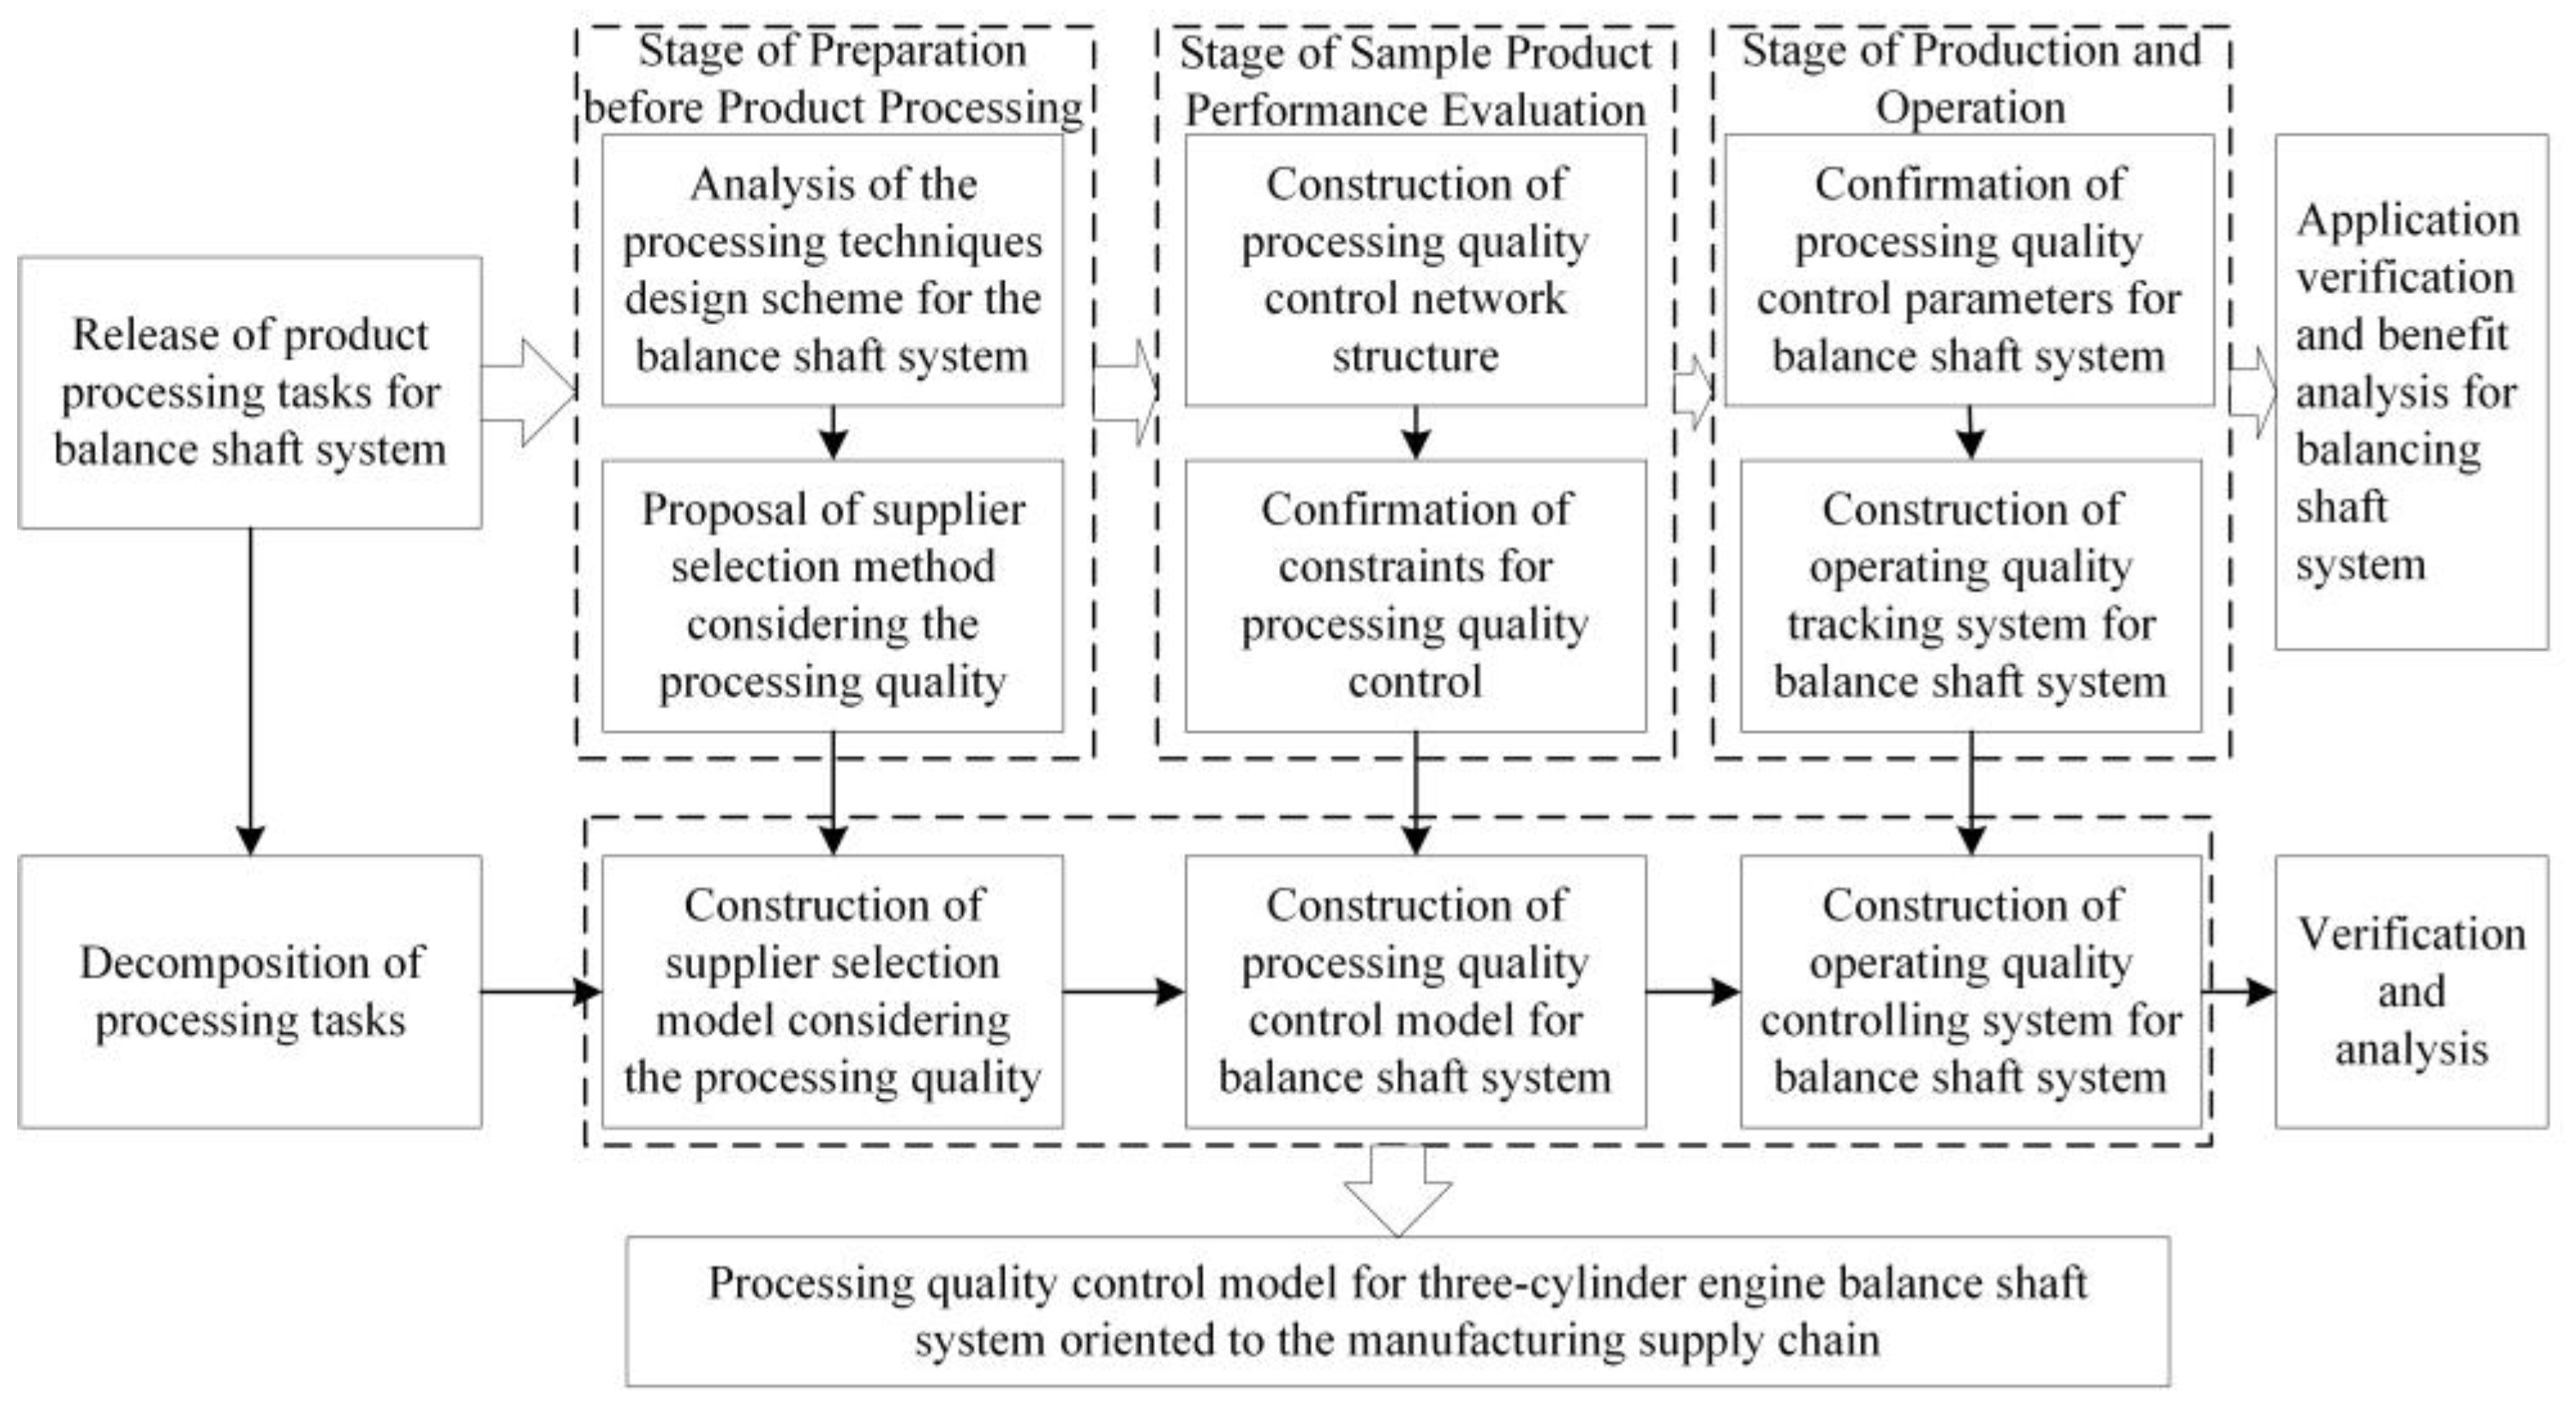
3. Construction of Product Process Quality Control Model for the Three-Cylinder Engine Balance Shaft System Oriented to the Manufacturing Supply Chain

Based on the basic theories of supply chain time, cost, and matching ability of metagraph, the elements such as the balance shaft system structure, process quality implementation entity, processing methods, process quality attributes, and constraint functions are precisely defined. The model of process quality control for the three-cylinder engine balance shaft system oriented to the manufacturing supply chain is established. The tasks in Table 1 at each stage work as the starting point of the control model, and the quality attributes completed by node enterprises at each stage are represented by the generated elements in the metagraph. The arcs are used to represent the transformation process (blank handling, processing, assembly, and usage) of the product quality attribute. The set of entry points of the arcs represents the node parts suppliers that provide the previous quality attribute, and the set of exit points of the arcs represents the parts suppliers that obtain the next quality attribute.

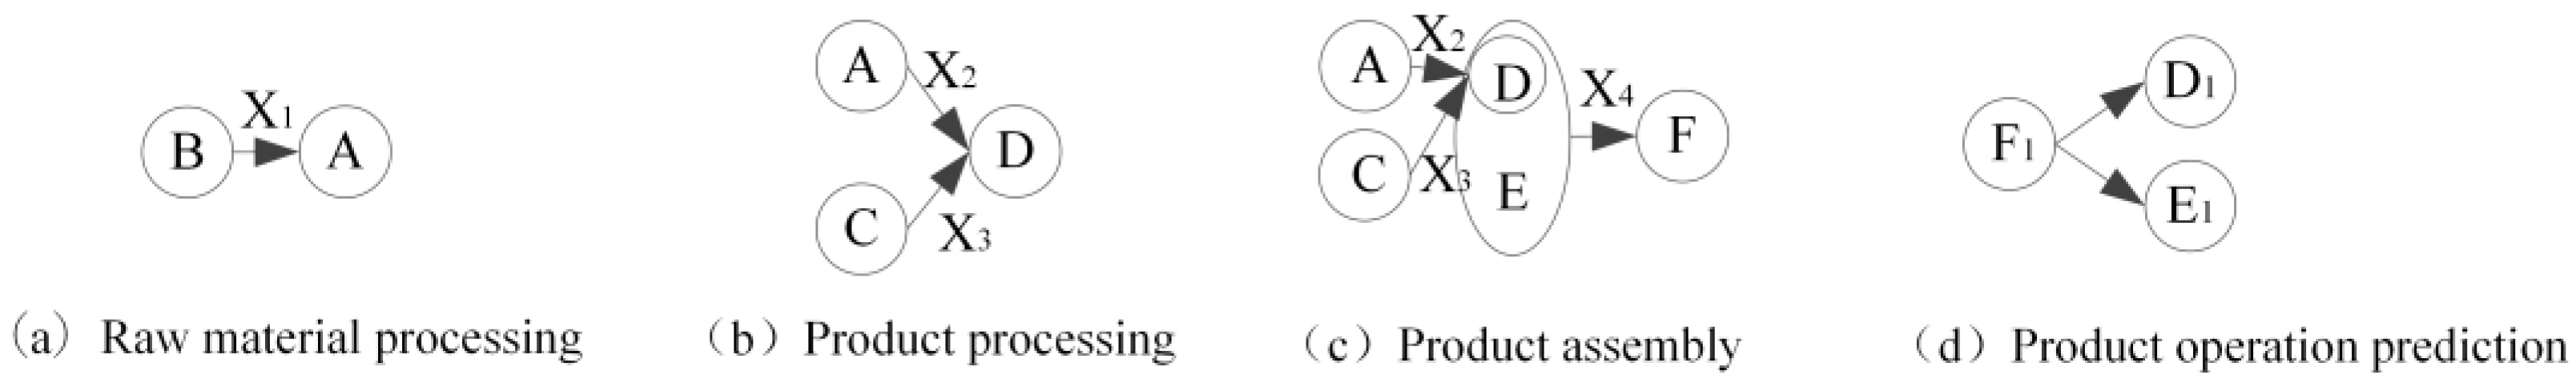
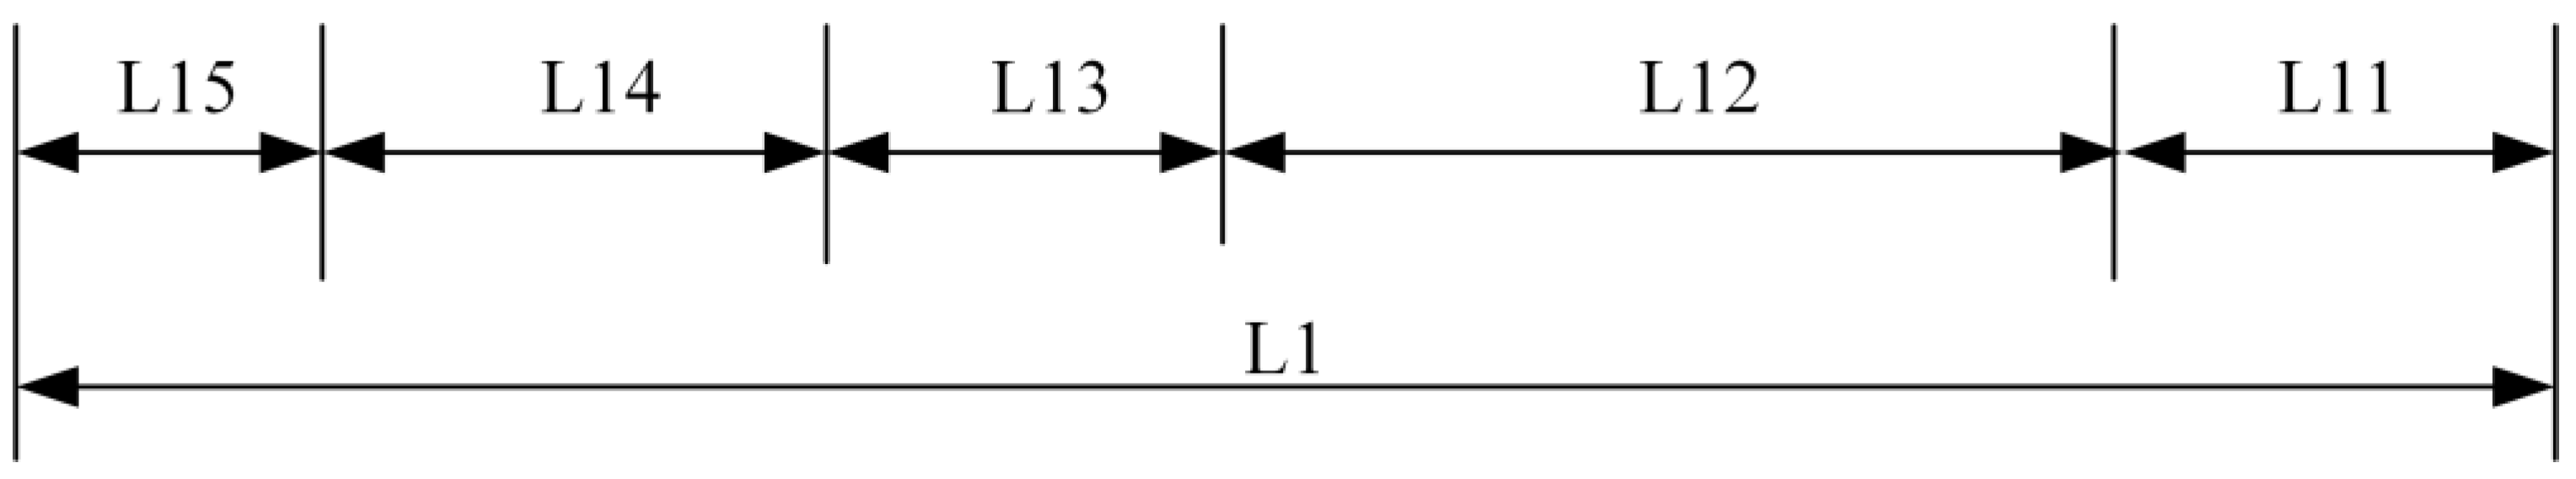
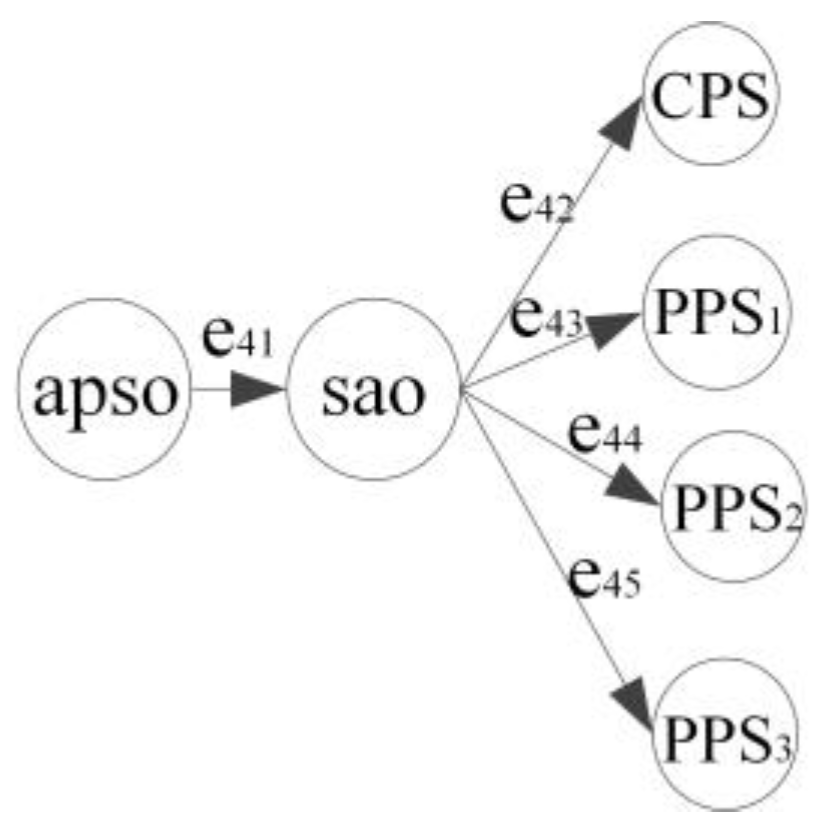
3.1. Expression Method of Key Elements in Product Process Quality Control Network for the Three-Cylinder Engine Balance Shaft System Oriented to the Manufacturing Supply Chain

(1) Expression method of key elements in the parts suppliers network for the three-cylinder engine balance shaft system
According to the parts suppliers network structure of the three-cylinder engine balance shaft system in Figure 3, the automobile manufacturers can be represented by OEM = {oemi|i = 1, 2, …, N}; the engine assembly suppliers are represented by SIP = {sipi|i = 1, 2, …, N}; the small assembly suppliers of the balance shaft system are represented by SS = {ssi|i = 1, 2, …, N}; the suppliers of the driven gear are represented by {csi|i = 1, 2, …, N}; the suppliers of parts such as the balance shaft and the driving gear are represented by PS = {psi|i = 1, 2, …, N}; and the raw material suppliers are represented by RMS = {rmsi|i = 1, 2, …, N}. Accordingly, the assembly supplier of the three-cylinder engine system, the supplier of the balance shaft system, and the parts supplier of the driven gear can be expressed as sip1, ss1, and cs1, respectively. Suppliers of the balance shaft, driving gear, counterweight block, driven gear outer ring, driven gear inner ring, and driven gear rubber ring can be represented by ps1, ps2, ps3, ps4, ps5, and ps6, respectively.
(2) Expression method of key elements in the process quality attributes network for the three-cylinder engine balance shaft system
The following assumptions are made. The number of components included in the component assembly is N, N = {N1, N2, …, Nn}, and the corresponding quality attributes can be represented by Nq = {n1, n2, …, nn}. The number of parts included in each component is M, M = {M1, M2, …, Mn}, and the corresponding quality attributes are represented by Mq = {m1, m2, …, mn}. The part is obtained through blank treatment from raw material O, and the corresponding quality attribute of raw material is O = {O1, O2, …, On}. Accordingly, the quality attributes of the driven gear (component), the balance shaft, driving gear, counterweight, driven gear outer ring, driven gear hub, and rubber ring can be represented by n1, m1, m2, m3, m4, m5, and m6. respectively. The quality attributes of the raw materials for the balance shaft, driving gear, counterweight block, driven gear outer ring, driven gear hub, and rubber ring can be represented by o1, o2, o3, o4, o5, and o6, respectively. Each component or part is completed by different suppliers with different machining and molding methods. The machining approach or molding method adopted by the part supplier can be expressed as E = {eik| i = 1, 2, …, N; k = 1, 2, …, K} (eik represents the method adopted for the i-th component or part), and the completed machining quality attribute can be expressed as Miq = {mij| i = 1, 2, …, N; j = 1, 2, …, N} (mij represents the i-th component or part supplier). For example, since the balance shaft part is initially machined and molded by the balance shaft part supplier, and then finished by the balance shaft system supplier, the quality attribute of the balance shaft part obtained from the balance shaft part supplier is m11, and the quality attribute obtained from the system supplier is m12.
(3) Expression method of key elements in the process quality data network for the three-cylinder engine balance shaft system
According to the parts supplier data network structure of the three-cylinder engine balance shaft system described in Figure 5, A = {ai| i = 1, 2, …, N} can be used to represent the constraints on the transformation of one quality attribute into another, and the machining accuracy requirements of each stage of the parts can be expressed as Mn,a = {mn,ai|n = 1, 2, …, N; i = 1, 2, …, N}. m4,a4, m5,a5, and m11,a11 can be used to represent the matching relationship between the inner diameter of the outer ring and the outer diameter of the rubber ring, the matching relationship between the inner diameter of the rubber ring and the outer diameter of the gear hub, and the accuracy requirement between the initial machining accuracy and the finishing accuracy of the balance shaft.
The definition of product operation information is the basis for the automobile manufacturer to put forward repair/maintenance warnings in real time, which can avoid a large number of product recalls in time, and improve the automobile brand’s effectiveness. The operating performances of the three-cylinder engine assembly, the balance shaft system small assembly, the components, and the parts can be represented by APSO, SAO, CPS, and PPS, respectively; therefore, the limit values of the repair/maintenance quality attributes of the above can be expressed as APSO = {apsoi| i = 1, 2, …, N}, SAO = {saoi| i = 1, 2, …, N}, CPS = {cpsi| i = 1, 2, …, N}, and PPS = {ppsi| i = 1, 2, …, N}.

3.2. Process Quality Control Model for the Three-Cylinder Engine Balance Shaft System Oriented to the Manufacturing Supply Chain

Based on the expression method of basic elements in Section 3.1, metagraphs for the stage of preparation before product processing, the stage of sample product performance evaluation, and the stage of production and operation are made. The maximum meta paths of the three stages are calculated, with the goals being the maximum manufacturing capacity of the node enterprise, the optimal production quality level of the node enterprise, and the optimal operating performance status. Supported by the above, the product process quality control model for the three stages is obtained, and the process quality control contract design model is constructed to verify the feasibility of the proposed method.

3.2.1. Quality Control Model of the Three Cylinder Engine Balancing Shaft System Based on the Manufacturing Supply Chain Cycle

(1) Stage of preparation before product processing
At the stage of preparation before product processing, the automobile manufacturer, the balance shaft system supplier, the driven gear supplier, and parts suppliers of the balance shaft, driving gear, counterweight block, driven gear outer ring, driven gear hub, driven gear rubber ring, etc., are taken as the node elements in the metagraph. In addition, the processing schemes provided by parts suppliers to component suppliers, component suppliers to the system supplier, and the system supplier to the automobile manufacturer are taken as arcs in the paths. Based on the above, the metagraph for the stage of preparation before product processing is obtained, which is shown in Figure 6.
Assuming that the manufacturing cost range of the three-cylinder engine balance shaft system provided by the automobile manufacturer is certain, the weight of the capacity on arc e1i(i = 1, 2, 3, 4, 5) in the path is recorded as EMC(e1i), and the weight of the capacity on arc e2i(i = 1, 2, 3, 4, 5) is recorded as EMC(e2i). The manufacturing capacities of the node enterprises are represented by EMC(e1i) and EMC(e2i). The sum of the manufacturing capacities on all arcs is the overall manufacturing capacity of the balance shaft system at this stage, and the optimal combination of suppliers for the automobile manufacturer is the case of the maximum sum of manufacturing capacities. Therefore, the product process quality control model for the three-cylinder engine balance shaft system at the stage of preparation before product processing is:
M S C M P 1 = i = 1 5 ( E M C ( e 1 i ) + E M C ( e 6 ) ) M S C M P 2 = i = 1 5 ( E M C ( e 2 i ) + E M C ( e 6 ) ) M A X ( M S C M P 1 , M S C M P 2 )
(2) Stage of sample product performance evaluation
At the stage of sample product performance evaluation, the transfer of the product process quality is analyzed to obtain the optimal manufacturing precision combination. This will provide a theoretical basis for the process quality control of the balance shaft system. Therefore, we take the quality attribute generated by each node enterprise as the node element in the metagraph, and the manufacturing method or constraint for the transformation of one quality attribute into another quality attribute as the arc of the path. The metagraph obtained for this stage is shown in Figure 7.
At this stage, assuming that the scheme of processing techniques for the balance shaft system has been determined, the arc in the path is represented by e3i = <Vl3i,wl3i>, where Vl3i(i = 1, 2, …8) is the assembly of product manufacturing accuracy and wl3i is the manufacturing accuracy of one single node, and the weight of the capacity on arc e3i can be recorded as SCPC(e3i). The weight of the capacity on the manufacturing accuracy wli of each single node is recorded as NPC(e3i); the overall manufacturing accuracy of the supply chain and the manufacturing accuracy of a single node are represented by SCPC(e3i) and NPC(e3i), respectively. Here, SCPC(e3i) is not the linear superposition of NPC(e3i), because the manufacturing accuracy of the previous node directly affects the manufacturing accuracy and cost of the next node, and the influencing coefficient λ = {λi| i = 1, 2, …, 7} is different. Meanwhile, the manufacturing cost of each node is represented by M(c) = {mci| i = 1, 2, …, 7}. Considering the constraint of the manufacturing cost, the sum of the manufacturing accuracy on all arcs is the overall manufacturing capability of the three-cylinder engine balance shaft system at this stage, and the optimal combination of manufacturing accuracy of the node represents the maximum overall manufacturing accuracy. Therefore, the product process quality control model for the three-cylinder engine balance shaft system at the stage of sample product performance evaluation can be expressed as:
S C P C = i = 2 7 ( N P C ( e 31 ) + φ i N P C ( e 3 i ) + N P C ( e 38 ) ) M ( c ) = i = 1 7 m c i M A X ( S C P C ) , M I N ( M ( c ) )
Note: since arc e38 represents the assembling process of the balance shaft system to the engine assembly, we assume that the assembling method and level are certain, thus the value of NPC(e38) is fixed.
(3) Stage of production and operation
The stage of production and operation is the period after the three-cylinder engine balance shaft system comes onto the market. At this stage, the control relationship between the automobile manufacturer and suppliers over the operation state of the system, and the tracking and analysis of the operation state information are the theoretical basis for formulating an optimal maintenance scheme or implementing the emergency plan for recall events. Therefore, the operation performance states obtained by the automobile manufacturer (or the engine assembly supplier), by the node enterprises of the balance shaft system suppliers, and by the parts suppliers for the balance shaft, the gear, etc., are taken as the node element in the metagraph. The constrained relationship of operation performance states among parts, components, systems, and assemblies are taken as the arcs in the path. The metagraph for the stage of production and operation is shown in Figure 8.
At the stage of production and operation, it is assumed that the operation performance information of the three-cylinder engine balance shaft system can be tracked and collected in real time. The arcs of the paths are represented by e4i = <Vl4i,wl4i>, in which Vl4i(i = 1, 2, …, 5) is the overall operation performance of the balance shaft system. The weight of the capacity on e4i is recorded as SAO(e4i), and the weight of the capacity on the manufacturing accuracy wli of each single node is recorded as PPS(e4i). When the performance of one part in the manufacturing supply chain cannot meet the requirements, an alarm message will be generated. Therefore, the minimum operation performance of all arcs is the overall operating performance of the entire supply chain. The process quality control model of the three-cylinder engine balance shaft system at the stage of production and operation can be expressed as:
A P M S C O P = M I N ( S A O ( e 41 ) , P P S ( e 42 ) , P P S ( e 43 ) , P P S ( e 44 ) , P P S ( e 45 ) )

3.2.2. Benefit and Cost Analysis of Process Quality Control Model of the Three-Cylinder Engine Balance Shaft System for Manufacturing Supply Chain

(1) Stage of preparation before product processing
According to the basic definition in 4.1, the demand function for three-cylinder engine assembly suppliers is:
D ( p , θ , d ) = a 0 0 0 0 p 0 0 0 0 θ 0 0 0 0 d 1 b r t
In the equation, a is the engine assembly supplier’s demand order capacity for this product, θ is the production quality level of the product provided by the balance shaft system small assembly supplier, p is the sales price of the balance shaft system, and d is the testing level of the engine assembly supplier. b, r, and t are, respectively, the sensitivity of the three-cylinder engine assembly supplier demand to production quality, price, and the testing level. Assume cs(θ) = kθ2 and cm(d) = λd2, where k is the impact coefficient of the cost invested by the balance shaft system supplier for production quality, λ is the impact coefficient of the cost invested by the engine assembly supplier for testing, cs(θ) is the machining cost invested by the balance shaft system supplier to ensure the production quality level, and cm(d) is the testing cost invested by the three-cylinder engine assembly supplier. The overall profit maximization of the manufacturing supply chain is used as the indicator to determine the quality level and propose appropriate prices to the balance shaft system small assembly suppliers.
At the stage of preparation before product processing, the product process quality contract coordination model for the three-cylinder engine assembly supplier, balance shaft system small assembly supplier, and manufacturing supply chain can be shown in Formula (5).
max p , θ , d T ( p , θ , d ) = ( p c ) × a 0 0 0 0 p 0 0 0 0 θ 0 0 0 0 d 1 r b t c s ( θ ) c m ( d )         S ( θ ) = ( w c ) × a 0 0 0 0 p 0 0 0 0 θ 0 0 0 0 d 1 r b t c s ( θ ) > 0 s t .        M ( p , d ) = ( p w ) × a 0 0 0 0 p 0 0 0 0 θ 0 0 0 0 d 1 r b t c m ( d ) > 0 p > w > c
In Formula (5), w is the expected wholesale price proposed by the engine assembly supplier to the balance shaft system supplier, and c is the machining cost of the balance shaft system supplier’s products. ΠM(p, d), ΠS(θ), and ΠT(p, θ, d), respectively, represent the revenue functions of the three-cylinder engine assembly supplier, the small assembly supplier of the balance shaft system, and the manufacturing supply chain.
(2) Stage of sample product performance evaluation
At this stage, the three-cylinder engine balance shaft assembly supplier and the small assembly supplier have established a clear cooperative relationship. How to better ensure the design quality of the balance shaft system is the main task at this stage. Therefore, different from [15], this paper proposes to take the balance shaft system supplier as the main entity for process quality control to construct the demand function of the three-cylinder engine assembly supplier, as shown in Formula (6).
D ( p , θ , e ) = a 0 0 0 0 p 0 0 0 0 θ 0 0 0 0 e 1 b r β
In the above formula, e represents the assembly quality guaranteed by the balance shaft system supplier through parts selection. Assuming that the assembly cost invested by the balance shaft system supplier is Cm(e), and other parameters are consistent with the settings in the previous stage, the contract coordination model of process quality for the three-cylinder engine assembly supplier, the balance shaft system small assembly supplier, and the manufacturing supply chain at this stage are shown in Formula (7).
max p , θ , e T ( p , θ , e ) = ( p c ) × a 0 0 0 0 p 0 0 0 0 θ 0 0 0 0 e 1 b r β c s ( θ ) c m ( e )         S ( θ ) = ( w c ) × a 0 0 0 0 p 0 0 0 0 θ 0 0 0 0 e 1 b r β c s ( θ ) > 0 s t .        M ( p , e ) = ( p w ) × a 0 0 0 0 p 0 0 0 0 θ 0 0 0 0 e 1 b r β c m ( e ) > 0 p > w > c
(3) Stage of production and operation
At this stage, the main task is product quality management, followed by mass production. The three-cylinder engine assembly supplier considers the factor of sales quality. The authors of [15,29] have constructed the two-level supply chain contract function of the suppliers and distributors, which will not be analyzed in depth in this paper.

4. Case Application and Benefit–Cost Analysis

A certain type of three-cylinder engine manufacturer released a task of improving and upgrading the balance shaft system. It was required to reduce the cost, and at the same time ensure the key performance indicators of the balance shaft system, which are shown in Table 2.

4.1. Application and Benefit–Cost Analysis of the Stage of Preparation before Product Processing

In the practical case, two suppliers of the balance shaft system—SS1 and SS2—offered intention of cooperation. The biggest difference between the two proposals is the design of the driven gear. The key performance parameters of the driven gears provided by the existing supplier and the other two suppliers are shown in Table 3.
Based on the content in Section 3, EMC(eli)(i = 1, 2, 3, 4, 5), EMC(e2i)(i = 1, 2, 3, 4, 5), and EMC(e3i)(i = 1, 2, 3, 4, 5) represent the manufacturing capacity of the existing supplier, supplier SS1, and supplier SS2 based on mass, static unbalance, rotational inertia, processing cost, and damping rate. The comprehensive manufacturing capacity of the existing supplier, supplier SS1, and supplier SS2 can be represented by MSCMP1, MSCMP2, and MSCMP3. Based on model (1), the process quality control model for the three-cylinder engine balance shaft system at the stage of preparation before product processing can be expressed as:
M S C M P 1 = i = 1 5 ( E M C ( e 1 i ) ) M S C M P 2 = i = 1 5 ( E M C ( e 2 i ) ) M S C M P 3 = i = 1 5 ( E M C ( e 3 i ) ) M A X ( M S C M P 1 , M S C M P 2 , M S C M P 3 )
With SPSSAU 21.0 and the analytic hierarchy process (AHP), the weights and eigenvectors in the criteria hierarchy are calculated, and the final score of each supplier is obtained. The following results are obtained through calculation: MSCMP1 = 0.3226, MSCMP2 = 0.2146, MSCMP3 = 0.3956, thus MAX(MSCMP1, MSCMP2, MSCMP3) = 0.3956. The results indicate that supplier SS2 is the optimal supplier among the three. The product provided by supplier SS2 satisfies all the requirements in terms of performance indicators, and its cost is 27% lower than that of the existing supplier.
Although the cost of supplier SS1 is 27% lower than that of the existing supplier, the damping rate of its product is only 55% of that of the existing supplier, leading to the lowest score.
Based on the mathematical model of Formula (5) in Section 3.2.2, it is assumed that the demand order capacity for this product from the engine assembly supplier is a = 300, the processing cost of the balance shaft system suppliers is c = 180, and the sensitivities of the engine assembly suppliers demand to production quality, price, and testing level are b = 2, r = 2, and λ = 2, respectively. The impact coefficient of cost invested by mid-end enterprises for production quality is k = 3.
The maximum profit of the engine assembly supplier, the balance shaft system supplier, and the manufacturing supply chain are all greater when the process quality level of the balance shaft system small assembly supplier and the testing quality level of the engine assembly supplier are considered. The results remain the same whether under the centralized decision-making mode or the decentralized mode. Among the above, the maximum profit of the manufacturing supply chain could be increased by over 50%. Table 4 gives the specific values of the maximum profit of the engine assembly supplier, the balance shaft system small assembly supplier, and the manufacturing supply chain calculated with the method proposed in this paper and with the existing research methods.

4.2. Application and Benefit–Cost Analysis of the Stage of Sample Product Performance Evaluation

Through the above analysis, SS2 is the optimal supplier for the balance shaft system. The task of SS2 is to cooperate with downstream suppliers to process and assemble products according to the proposed parts production techniques, and then deliver the balance shaft system to the engine assembly supplier for final assembly.
The assembly process of the balance shaft system is: ① press-fit the bearing on the cylinder block; ② insert the balance shaft units (including counterweight block B) into the cylinder block; ③ set in the elastic gear; and ④ set in counterweight block A. During the assembly, it is required to ensure the dimensions and tolerances of the bearing, counterweights blocks (A and B), and the center of the elastic gear to the center of the balance shaft. L1, the dimension of counterweight block B to the center of the balance shaft, is taken as an example to verify the feasibility of the process quality control model at this stage. The composition loop of the dimension chain for the balance shaft system assembly is shown in Figure 9.
In Figure 9, L11 = 11 ± 0.1, L12 = 56.4 ± 0.2, L13 = 19.2, L14 = 52 ± 0.2, and L1 = L11 + L12 + L13 + L14 + L15 = 138 0.5 + 0.5 + L 15 . Counterweight block B and the balance shaft are obtained through rough processing by parts suppliers, and then fine finished by the balance shaft system supplier. During the assembly, the dimension and tolerance of counterweight block B to the center of the coordinate system shall be ensured, which is L1 in Figure 9. The keys for the control accuracy of L1 are the dimensional accuracies of counterweight block B and the end face of the balance shaft, which require two processes: turning and grinding. Combined with the analysis in Section 3, the manufacturing precision assemblies of the balance shaft and counterweight block B are represented by Vl31 and Vl32, respectively. The manufacturing accuracies of turning them are wl31 and wl32, and the manufacturing accuracies of grinding the balance shaft system supplier are represented by wl33 and wl34. By adopting the cost function and quality loss function of turning and grinding presented in [30], the process quality control model at this stage is constructed:
S C P C ( e 31 ) = N P C ( e 31 ) + N P C ( e 32 ) S C P C ( e 32 ) = + N P C ( e 33 ) + N P C ( e 34 ) M ( c m ) = C m ( w l 31 ) + C m ( w l 32 ) + C m ( w l 33 ) + C m ( w l 34 ) M ( c l ) = C l ( w l 31 ) + C l ( w l 32 ) + C l ( w l 33 ) + C l ( w l 34 ) M A X ( S C P C ) , M I N ( M ( c m ) , M I N ( M ( c l ) )
where SCPC(e31) ≤ 0.03, SCPC(e32) ≤ 0.06, 0.02 ≤ NPC(e31) ≤ 0.08, 0.005 ≤ NPC(e32) ≤ 0.02, 0.02 ≤ NPC(e33) ≤ 0.07, 0.005 ≤ NPC(e34) ≤ 0.02, Cm(wl31) = 0.96 + 70.94exp(−23.84wl31), Cm(wl32) = 0.96 + 70.94exp(−23.84wl32), Cm(wl33) = 43.71 + 165.28exp(−271.07wl33), Cm(wl34) = 43.71 + 165.28exp(−271.07wl34), Cl(wl31) = (32/0.052) w l 31 2 , Cl(wl32) = (55/0.052) w l 32 2 , Cl(wl33) = (35/0.052) w l 33 2 , and Cl(wl34) = (35/0.052) w l 34 2 .
The NSGI-II algorithm has been applied for optimizing the calculation, and after multiple runs, the results are almost the same. The quality loss after optimization is M(Cl) = CNY 33.861, and the processing cost is M(Cm) = CNY 64.248; meanwhile, the manufacturing accuracies of single node enterprises are wl31 = 0.027829, wl32 = 0.032264, wl33 = 0.013456, and wl34 = 0.014989.
Based on Table 3, the total manufacturing cost for the counterweight blocks and balance shaft provided by the existing supplier is CNY 93. After optimization, the cost decreases by 30%, which meets the requirement of reducing the cost while ensuring the balance performance.
Based on the mathematical model of Formula (7) in Section 3.2.2, the impact of the balance shaft system sales price on the maximum profits of three-cylinder engine assembly suppliers, balance shaft system suppliers, and the manufacturing supply chain are obtained. Table 5 shows the decision-making results under various conditions, for example, when the engine assembly supplier assembles directly without testing the quality, and when the assembly quality is considered.
It can be seen from Table 5 that when the three-cylinder engine assembly supplier directly installs the balance shaft system without considering the process quality, the maximum profits of the engine assembly supplier, the balance shaft system small assembly supplier, and the manufacturing supply chain are CNY 2500, CNY 3700, and CNY 5300, respectively. When the impact of the process quality is considered, the maximum profits of the engine assembly supplier, the balance shaft system small assembly supplier, and the manufacturing supply chain are all 1–2 times higher. When the three-cylinder engine assembly supplier considers the impact of assembly quality and maximizes the profit of the manufacturing supply chain, the maximum profits of the balance shaft small assembly supplier and the manufacturing supply chain are both higher than when the three-cylinder engine assembly supplier dominates. Moreover, in this situation, the overall maximum profit of the manufacturing supply chain can be increased by around 7%, with the wholesale price of the three-cylinder engine balance shaft system remaining unchanged. The above shows that it is more conducive to the management of process quality in the manufacturing supply chain to consider the impact of the assembly quality of the balance shaft system.
The analysis indicates that the process quality control model for the three-cylinder engine balance shaft system proposed in this paper is feasible. At the stage of preparation before product processing, when the impact of both process quality and testing quality of the balance shaft system are considered, and other conditions remain unchanged, the maximum profit of the manufacturing supply chain is twice that, without considering the testing quality. At the stage of product performance evaluation, the profit of the manufacturing supply chain is higher when the process quality is considered, and the result remains unchanged, whether the three-cylinder engine assembly dominates or the maximum profit of the manufacturing supply chain dominates. Meanwhile, it is more conducive to the implementation of product selection strategies if the process quality information can be shared, thus improving the overall performance of the balance shaft system. This conclusion is consistent with [24], which further verifies that when the balance shaft system supplier works as the main body for process quality control, the overall performance of the system can be better guaranteed. Moreover, the conclusion improves the process quality control method in [11], with the process quality control body as the core.

5. Conclusions

The method proposed in this paper improves the theoretical basis for selecting auto parts suppliers from the aspect of product process quality control. The authors of [14] only proposed that quality was the key indicator for evaluating suppliers, but the method in this paper provides an in-depth analysis of key performance indicators. The network structure of the auto parts suppliers and the corresponding quality attributes output has been constructed, which provides a basis for theoretical analysis of information sharing at the stage of preparation before product processing in the automobile manufacturing supply chain.
The method proposed in this paper improves the contract coordination control model for process quality control from the aspect of supply chain quality management. A cost–benefit function for two-level manufacturing supply chain product process quality has been proposed. The analysis indicates that at the stage of supplier selection, when the impact of product process quality level is considered, the maximum profit of the supply chain can be increased by about 100% compared to the method in [24,28]. At the stage of product process quality control, the overall maximum profit of the supply chain can be increased by more than 8% when the impact of the assembly quality is considered.
Although the metagraph theory introduced in this paper can well solve the integration of product process quality control and the contract design model of the manufacturing supply chain, the current research only constructs a two-level manufacturing supply chain contract coordination model for the three-cylinder engine assembly supplier and the balance shaft system supplier. The contract coordination control method of all node enterprises in the manufacturing supply chain has not been studied. From the aspect of the product process quality control, the actual operation data of the three-cylinder engine balance shaft system shall be included to build an information sharing platform for product process quality from all node enterprises. Meanwhile, in-depth research into a process quality control model at the production and operation stage should be carried out through bench tests and operation data tracking of the three-cylinder engine balance shaft system, thus improving the process quality control theory of the auto parts manufacturing supply chain. At the same time, this paper provides the data technology analysis basis for the research of zero-defect manufacturing and the sustainable development of a manufacturing supply chain, but the actual operation data is lacking in the data sample, which is also content to be further studied.

Author Contributions

Methodology, P.W. and G.L.; software, P.W. and X.L.; validation, P.W. and X.L.; writing—original draft preparation, P.W. and G.L.; writing—review and editing, P.W., G.L. and X.L. All authors have read and agreed to the published version of the manuscript.

Funding

This research received no external funding.

Institutional Review Board Statement

Not applicable.

Informed Consent Statement

Not applicable.

Data Availability Statement

Not applicable.

Acknowledgments

I would like to thank Gangyan Li and Xueping Li for their help and support, and thank Baobao Hanwei for his help and verification of the paper revision.

Conflicts of Interest

The authors declare no conflict of interest.

References

  1. Alkahtani, M. Mathematical Modelling of Inventory and Process Outsourcing for Optimization of Supply Chain Management. Mathematics 2022, 10, 1142. [Google Scholar] [CrossRef]
  2. Esmaeili-Najafabadi, E.; Nezhad, M.; Pourmohammadi, H.; Honarvar, M.; Vahdatzad, M.A. A joint supplier selection and order allocation model with disruption risks in centralized supply chain. Comput. Ind. Eng. 2018, 127, 734–748. [Google Scholar] [CrossRef]
  3. Albloushi, B.; Alharmoodi, A.; Jabeen, F.; Mehmood, K.; Farouk, S. Total quality management practices and corporate sustainable development in manufacturing companies: The mediating role of green innovation. Manag. Res. Rev. 2023, 46, 20–45. [Google Scholar] [CrossRef]
  4. Bottani, E.; Montanari, R.; Volpi, A.; Tebaldi, L. Statistical process control of assembly lines in manufacturing. J. Ind. Inf. Integr. 2023, 32, 100435. [Google Scholar] [CrossRef]
  5. Lee, D.H.; Yang, J.K.; Kim, S.H.; Kim, K.J. Optimizing mean and variance of multiresponse in a multistage manufacturing process using operational data. Qual. Eng. 2020, 32, 627–642. [Google Scholar] [CrossRef]
  6. Peng, X.; Prybutok, V.; Xie, H. Integration of supply chain management and quality management within a quality focused organizational framework. Int. J. Prod. Res. 2020, 58, 448–466. [Google Scholar] [CrossRef]
  7. Shi, J. In-Process Quality Improvement: Concepts, Methodologies, and Applications. IISE Trans. 2022, 55, 2–21. [Google Scholar] [CrossRef]
  8. Psarommatis, F.; May, G.; Dreyfus, P.A.; Kiritsis, D. Zero defect manufacturing: State-of-the-art review, shortcomings and future directions in research. Int. J. Prod. Res. 2020, 58, 1–17. [Google Scholar] [CrossRef]
  9. Psarommatis, F.; Sousa, J.; Mendonça, J.P.; Kiritsis, D. Zero-defect manufacturing the approach for higher manufacturing sustainability in the era of industry 4.0: A position paper. Int. J. Prod. Res. 2022, 60, 73–91. [Google Scholar] [CrossRef]
  10. Psarommatis, F.; Kiritsis, D. A hybrid Decision Support System for automating decision making in the event of defects in the era of Zero Defect Manufacturing. J. Ind. Inf. Integr. 2021, 26, 100263. [Google Scholar] [CrossRef]
  11. Wang, P.; Li, G.; Li, Y. Product process quality demand analysis for medium auto parts enterprise in supply chain. Integr. Ferroelectr. 2021, 218, 97–107. [Google Scholar] [CrossRef]
  12. Shen, B.; Chen, C. Quality management in outsourced global fashion supply chains: An exploratory case study. Prod. Plan. Control 2020, 31, 757–769. [Google Scholar] [CrossRef]
  13. Chino, M.; Khojasteh, Y.; Furuhata, T.; Kainuma, Y. Empirical analysis of supply chain risk management in the Japanese automotive industry. J. Jpn. Ind. Manag. Assoc. 2017, 67, 285–294. [Google Scholar] [CrossRef]
  14. Onari, M.A.; Rezaee, M.J. A fuzzy cognitive map based on Nash bargaining game for supplier selection problem: A case study on auto parts industry. Oper. Res. 2020, 22, 2133–2171. [Google Scholar] [CrossRef]
  15. Gündüz, Ç.; Gündüz, G.Ş. Supplier selection under fuzzy environment. Tekst. Konfeksiyon 2019, 29, 344–352. [Google Scholar] [CrossRef]
  16. Kabadayi, N.; Dehghanimohammadabadi, M. Multi-objective supplier selection process: A simulation–optimization framework integrated with MCDM. Ann. Oper. Res. 2022, 319, 1607–1629. [Google Scholar] [CrossRef]
  17. Yousefi, S.; Rezaee, M.J.; Solimanpur, M. Supplier selection and order allocation using two-stage hybrid supply chain model and game-based order price. Oper. Res. 2021, 21, 553–588. [Google Scholar] [CrossRef]
  18. Yang, H.; Peng, J. Coordinating a supply chain with demand information updating. J. Ind. Manag. Optim. 2022, 20, 18. [Google Scholar] [CrossRef]
  19. Yang, Z.; Mei, Q.; Wang, Q.; Liu, S.; Zhang, J. Research on Contract Coordination in the Manufacturing Supply Chain Given China’s Work Safety Constraints. Complexity 2021, 2021, 1779098. [Google Scholar] [CrossRef]
  20. Magnanini, M.C.; Eger, F.; Reiff, C.; Colledani, M.; Verl, A. A control model for downstream compensation strategy in multi-stage manufacturing systems of complex parts. IFAC-Pap. Line 2019, 52, 1473–1478. [Google Scholar] [CrossRef]
  21. Kou, Z. Association rule mining using chaotic gravitational search algorithm for discovering relations between manufacturing system capabilities and product features. Concurr. Eng. 2019, 27, 213–232. [Google Scholar] [CrossRef]
  22. Gao, Z.; Xu, F.; Zhou, C.; Zhang, H. Critical Procedure Identification Method Considering the Key Quality Characteristics of the Product Manufacturing Process. Processes 2022, 10, 1343. [Google Scholar] [CrossRef]
  23. Hu, S.; Song, S.; Liu, W. A Framework of Cloud Model Similarity-Based Quality Control Method in Data-Driven Production Process. Math. Probl. Eng. 2020, 2020, 7153841. [Google Scholar] [CrossRef]
  24. Xu, X.; Tatge, L.; Xu, X.; Liu, Y. Blockchain applications in the supply chain management in German automotive industry. Prod. Plan. Control 2022, 1–15. [Google Scholar] [CrossRef]
  25. Janjić, G.; Tanasić, Z.; Tomić Stojković, R. Development of a Quality Management Model in the Automotive Industry with a Focus on the Quality of Incoming Products (Part I). Trans. Famena 2022, 46, 115–126. [Google Scholar] [CrossRef]
  26. Rosyidi, C.N.; Murtisari, R.; Jauhari, W.A. A concurrent optimization model for supplier selection with fuzzy quality loss. J. Ind. Eng. Manag. 2017, 10, 98–110. [Google Scholar] [CrossRef]
  27. Wang, C.H.; Ali, M.H.; Chen, K.S.; Negash, Y.T.; Tseng, M.L.; Tan, R.R. Data driven supplier selection as a circular economy enabler: A Taguchi capability index for manufactured products with asymmetric tolerances. Adv. Eng. Inform. 2021, 47, 101249. [Google Scholar] [CrossRef]
  28. Attri, R.; Grover, S. Structural modelling and analysis of production system life cycle: A graph theoretic approach. Int. J. Oper. Res. 2019, 34, 467–506. [Google Scholar] [CrossRef]
  29. Wang, C.N.; Tsou, M.C.; Wang, C.H.; Nguyen, V.T.; Phuong, P.N.T. Improving Supply Chain Performance Through Supplier Selection and Order Allocation Problem. Comput. Mater. Contin. 2022, 1, 15. [Google Scholar] [CrossRef]
  30. Shuo, L.I.; Meng, J.; Pan, E.S. Optimal Tolerance Allocation Plan for the Combination of the Assembly and Manufacturing. Ind. Eng. Manag. 2017, 22, 6. [Google Scholar] [CrossRef]
Figure 1. Composition of a certain typical three-cylinder engine balance shaft system.
Applsci 13 10788 g001
Figure 2. Implementation of process quality control for the three-cylinder engine balance shaft system oriented to the manufacturing supply chain.
Applsci 13 10788 g002
Figure 3. Structure of parts suppliers of the three-cylinder engine balance shaft system.
Applsci 13 10788 g003
Figure 4. Structure of the process quality attributes for the three-cylinder engine balance shaft system.
Applsci 13 10788 g004
Figure 5. Data structure of product during processing for the three-cylinder engine balance shaft system.
Applsci 13 10788 g005
Figure 6. Metagraph for the stage of preparation before product processing.
Applsci 13 10788 g006
Figure 7. Metagraph for the stage of sample product performance evaluation.
Applsci 13 10788 g007
Figure 8. Metagraph for the stage of production and operation.
Applsci 13 10788 g008
Figure 9. Counterweight block B assembles dimension chain.
Applsci 13 10788 g009
Table 1. Product processing tasks of parts suppliers at each stage of the manufacturing supply chain for the three-cylinder engine balance shaft system.
StageNode EnterprisesProduct Processing TasksObjectives
Preparation before Product ProcessingAssembly Suppliers for Three-Cylinder Engine To propose control requirements for balance shaft system process quality and assessment standards for supplier quality To confirm suppliers for balance shaft system and parts
Suppliers for Balance Shaft System To decompose requirements for balance shaft system process quality, design assurance system for balance shaft system process quality, and analyze requirements for product testing
Parts SuppliersTo propose the design plan for processing techniques of the balance shaft, the counterweight block, and the driven gear, and improve implementation plan for parts processing
Sample Product Performance EvaluationAssembly Suppliers for Three-Cylinder Engine To propose inspection standards for balance shaft system process quality and propose requirements for sample improvement To optimize the tolerance allocation plan according to the product improvement plan
Suppliers for Balance Shaft System To propose the implementation plan for balance shaft system process quality improvement/optimization, and parts process quality control and prediction
Parts SuppliersTo adjust the implementation plan for parts process quality improvement, and ensure the process quality performance of parts
Production and OperationAssembly Suppliers for Three-Cylinder Engine To track the balance shaft system operation quality To guarantee the quality of product operation
Suppliers for Balance Shaft System To predict and control the quality risk during balance shaft system operation
Parts SuppliersTo further maintain/improve the qualityof balance shaft system operation
Table 2. Requirements for key performance indicators of the three-cylinder engine balance shaft system.
PartsPerformance IndicatorsProcessing CostDamping Effect
MassStatic UnbalanceRotational Inertia
Balance Shaft558 gmxa = ±5 g·cm
mya = 475 ± 12 g·cm
1939 g∙cm248Connector
Drive Gear290 g±0.1 g/cm4450–5000g∙cm2112Power Transmission
Driven Gear449 g±0.15 g·cm4450–5000g∙cm2120Power Transmission
Counterweight A327 gmyg = ±5 g·cm
mzg = 475 ± 12 g·cm
3483 g∙cm257Balancing Torque
Counterweight B273 gmxa = ±5 g·cm
mya = 475 ± 12 g·cm
1630 g∙cm245Balancing Torque
Table 3. Key performance parameters of the driven gear provided by suppliers of the three-cylinder engine balance shaft system.
SupplierPerformance ParametersProcessing CostDamping Rate
MassStatic UnbalanceRotational Inertia
Current Supplier449 g±0.15 g·cm4.45–5 kg∙cm2120100%
Supplier SS1449 g ± 5%±0.15 g·cm4.45–5 ± 10% kg∙cm28055%
Supplier SS2449 g ± 3%±0.15 g·cm4.45–5 ± 5% kg∙cm28895%
Table 4. Decision results of manufacturing supply chain contract coordination in the preparation stage before product processing.
Key ParameterDecentralized Decision-Making/
without Considering Inspection
Centralized Decision-Making/
without Considering Inspection
Decentralized Decision-Making/
Considering Inspection
Centralized Decision-Making/
Considering Inspection
Existing Research Methods [16,17]Method Proposed in this Paper
Maximum Profit for Engine Assembly Supplier (RMB)2500150042104863
Maximum Profit for Balance Shaft System Small Assembly Supplier (RMB)3700360061044268
Maximum Profit for Manufacturing Supply Chain (RMB)5300480010,3159130
Table 5. Decision results of manufacturing supply chain contract coordination and control at product sample performance evaluation stage.
Key ParameterDirect Assembly by Engine Assembly SupplierEngine Supplier DominanceManufacturing Supply Chain Profit Maximization Dominance
Without Considering Process Quality LevelWith Process Quality Level
Inspection Quality -4058
Wholesale Price (CNY)260258258
Maximum Profit for Engine Assembly Suppliers (CNY)250069904783
Maximum Profit for Balance Shaft System Small Assembly Supplier (CNY)370056168431
Maximum Profit for Manufacturing Supply Chain (CNY)530087109308
Disclaimer/Publisher’s Note: The statements, opinions and data contained in all publications are solely those of the individual author(s) and contributor(s) and not of MDPI and/or the editor(s). MDPI and/or the editor(s) disclaim responsibility for any injury to people or property resulting from any ideas, methods, instructions or products referred to in the content.

