1. Introduction
Turnouts play a vital role in railway infrastructure by allowing track changes while the train is in motion. They introduce operational flexibility to an otherwise rigid railway system. Turnouts facilitate the efficient use of infrastructure for planned operations and also allow short-term adjustments in case of interruptions. Consequently, mixed traffic networks typically include a certain number of turnouts, even if they may not be absolutely necessary at all times but are operationally desired. In Austria, the railway network incorporates 13,285 turnouts across a length of 9759 track kilometres, resulting in an average of 1.36 turnouts per kilometre (0.9 for the main network) [
1]. The cumulative network of EU27 countries estimates a ratio of 1 turnout per track kilometre, which amounts to approximately 300,000 turnouts within these networks [
2].
Due to their technical complexity, operational significance and emphasis on safety, turnouts are expensive assets in the railway system. Network-wide evaluations of life cycle costs (LCCs) in Austria reveal a sevenfold difference between the LCCs of one meter of turnout and an equivalent length of an open track [
3]. This factor increases to 13 when only considering maintenance costs. In the UK, Cornish reported that the maintenance and renewal costs of turnouts in 2011/2012 amounted to GBP 200 million for maintenance and GBP 189 million for renewal [
4]. These figures represent 24% of the total track maintenance budget, despite turnouts accounting for only 5% of the network’s total mileage [
4].
Regardless of the great importance and costs of turnouts, quality assessments are not as sophisticated as for an open track. Reasons for this are on the one hand the complexity of turnouts [
5] and on the other hand the possibility of intensive manual inspection [
6]. Since turnouts represent infrastructure that is limited in its longitudinal extent, manual inspection is easier to handle compared to an open track. However, as higher infrastructure demands are expected in the coming decades due to increased usage [
7], and a shortage of track workers are foreseen [
8], improvements in data-based quality assessment of turnouts are essential. As for the open track, this assessment starts with track geometry.
Track geometry holds great importance as a quality parameter for railway tracks and turnouts [
9]. Regulations require the rehabilitation of track geometry when it falls below a certain threshold [
10]. This restoration process involves automated techniques such as levelling, lining and tamping, which are relatively cost-effective. However, due to a need for multiple tamping operations over the lifespan of a turnout, absolute costs of tamping constitute a significant portion of the maintenance budget [
11]. Poor track geometry not only causes significant correction costs but also indicates suboptimal system behaviour [
12]. Deterioration of track geometry depends on the quality/condition of turnout components, interactions between these components and the loading introduced [
13]. Through interactions, these parameters are dependent on each other. Negative properties of one of the parameters have a negative effect on the others. Future evaluation methods not only have to indicate turnout sections with poor track geometry behaviour but must additionally search for root causes of poor behaviour [
14]. For achieving this aim, every essential component of a turnout must be considered. The most essential components are subsoil, the ballast bed, sleepers and different metal parts. Only by eliminating the cause will symptoms of poor behaviour be eliminated sustainably.
Two typical causes of poor track behaviour are problems in subsoil and the ballast bed. A good subsoil is a basic prerequisite for an effective railway system and is therefore also essential for turnouts. Problems with subsoil, for example due to incorrect drainage, lead to disturbed load transfer, resulting in an increased need for maintenance and a reduction in service life. There are various ways to quantify the quality of the subsoil, for example by means of ground penetration radar data [
15]. For the open track, methods have been developed in recent years that are based on measurement car data [
16]. A transfer of this method to turnouts is conceivable but still requires further consideration. The ballast bed provides a stable bedding for the sleepers on the one hand and sufficient elasticity for necessary vertical sleeper movements on the other hand. However, this is only possible if the ballast grain meets requirements. Worn ballast typically consists of an excessively high fine-grain content leading among others to a loss of elasticity and thus to consequential problems within the system [
17]. In case of severe abrasion, the ballast must be replaced or cleaned [
17]. Evaluation methods for the ballast condition of the open track [
16], and for turnouts [
18], are available in Austria.
A systematic problem of worn ballast are increased forces for sleepers and rail fastening systems. Sleepers, together with the rail fastening system, need to secure the rail position and to distribute loads towards the ballast bed [
19]. A poor sleeper condition means that these tasks can no longer be fulfilled. A distinction must be made between concrete sleepers and wooden sleepers. While service life of turnouts with concrete sleepers is mainly limited by the condition of the ballast, for turnouts with wooden sleepers the sleeper itself is likely to be the critical element. It is possible to replace single wooden sleepers or to restore the fastening function, but these measures are expensive. Evaluation tools based on track gauge measurement exist for the sleeper condition of the open track [
20]. A transfer to turnouts is not trivial for various reasons and is currently the subject of our research.
While condition monitoring of metal parts is important for the open track, it is essential for turnouts due to the special features of turnouts—intricately shaped, partly moving metal parts. Crossings and switch devices are important elements because they are safety-critical and highly abrasive [
21]. Due to their geometry, frogs in their widespread rigid design are causers of dynamic loads. Insulated rail joints and welding joints also contribute significantly to vehicle excitation. These dynamic forces lead to increased wear of other components and should therefore be replaced before significant damage occurs at the system level [
22,
23,
24,
25].
In recent years, we developed various tools for the component description. The aim of this work is to test developed tools on real turnouts within the ÖBB network. Three questions are to be answered. (1) Can we use these tools to compare quality behaviour of turnouts? (2) If quality behaviour of a turnout is poor, is it possible to define causes for this behaviour? (3) Can we provide recommendation measures to sustainably improve the quality behaviour of a specific turnout?
2. Methodology
The data used for evaluation are regularly measured and stored data of an ÖBB measuring car. Data are available from 2005—partly even earlier—and are expected to be available in future. Within the measuring car, several measuring channels are available. For the evaluations of this paper, we use the longitudinal level and horizontal level (3–25 m), the rail surface signal and a filtered version of axle-box accelerations. Details about level measurements [
26], rail surface signal [
27] and axle-box acceleration measurements [
28] can be found in the chronicled publications. Since the quality description of turnouts uses data from a measuring car designed for an open track, repositioning of data is essential for all further analyses. The positioning process, although important and elaborate, is not part of this publication; details can be taken from recent publications [
27,
29].
To answer the research questions from the introduction, 160 turnouts with different boundary conditions were analysed. For the scope of this paper, we focus on five directly adjacent turnouts that have similar boundary conditions. In this way, factors known to influence the quality behaviour of turnouts are eliminated, and the quality behaviour of the turnouts can be directly compared with each other.
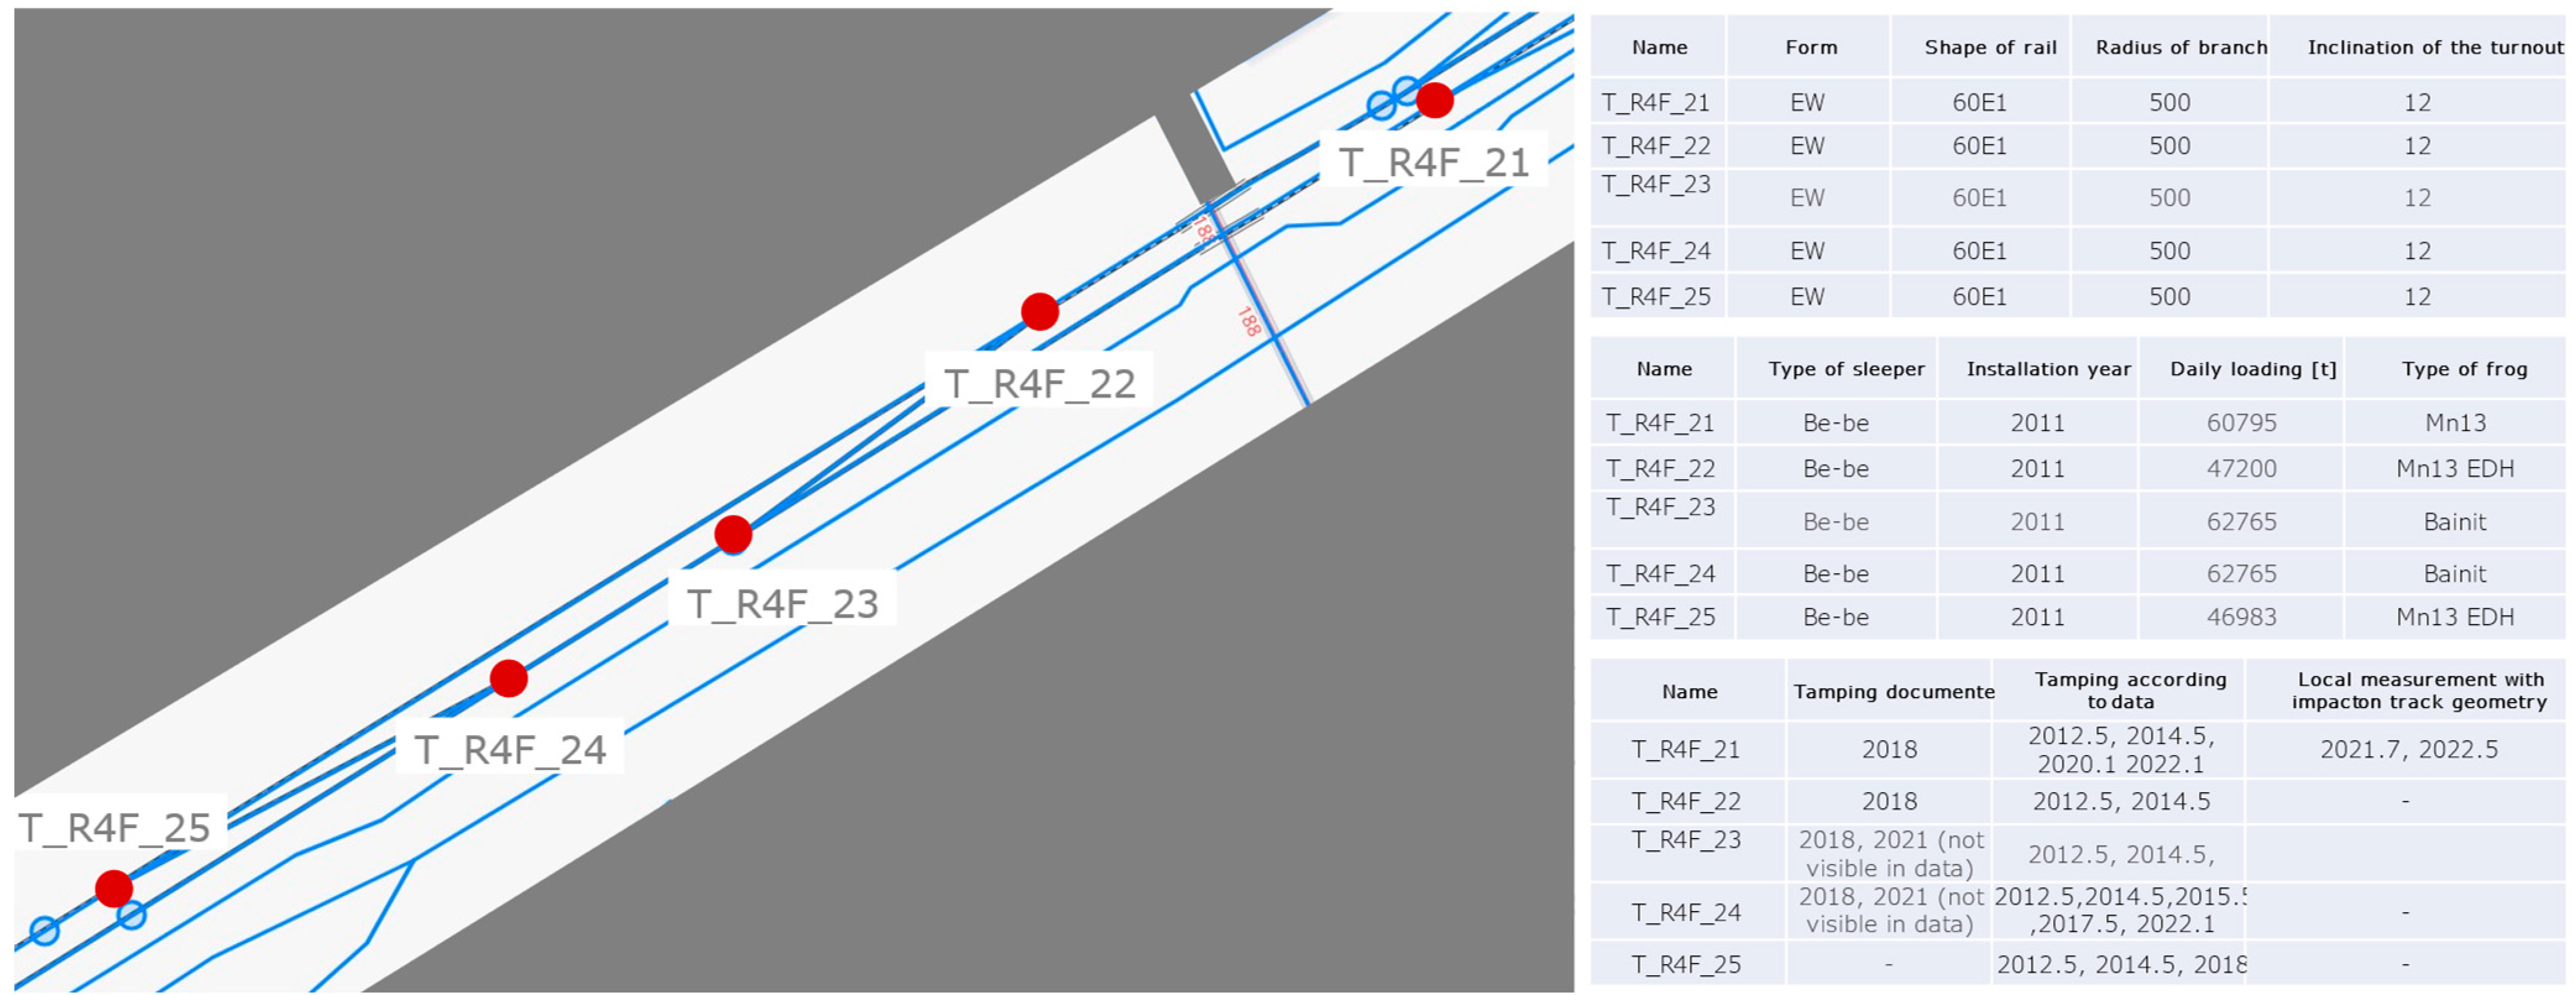
Figure 1 shows the installation plan and details of the turnouts analysed.
All included turnouts are simple turnouts with standard rail shape 60E1, a branch radius of 500 m and an angle of 1:12. Sleepers are made of concrete, supported with elastic under sleeper pads. The installation year of the turnouts is 2011. Daily loading differs slightly between the tracks but remains in a comparable range of 17–23 million gross tonnes (MGT) per year. Different frog types are installed, as visible in
Figure 1. In order to keep the scope of the paper manageable, evaluations of the frogs are not included; another paper is planned which will deal with this topic. In addition to specifications of components, information on tamping measures carried out is available, although our experience shows that not every tamping action is correctly documented in the existing database. Here, we work with a combination of registered measures and measures that are recognisable from signal characteristics. While indicators of problems in the subsoil are not available yet, for this work we assume a good condition for the analysed turnouts. All turnouts were renewed in 2011, and ÖBB includes subsoil rehabilitation, if necessary, in its standard process. The main driving direction differs for the examined turnouts. For T_R4F_21, T_R4F_22 and T_R4F_23, the main driving direction is facing, and for T_R4F_24 and T_R4F25 it is trailing. While the influence of the main driving direction is clearly important for the evaluation of frogs, it is neglected for the evaluations here, as the evaluation of metal parts itself is not the focus of this paper.
2.1. Data-Based Turnout Assessment
For a comparison of quality behaviour, we use different quality indices, each referring to one of the aspects mentioned within the introduction. Details on most of the indices have already been published; this paper will give a brief summary of index calculation and mainly deal with practical application of these indices. Where there are extensions to already published indices, these will be explained in detail.
2.1.1. Track Geometry Evaluation
The evaluation of track geometry is important in two ways: (1) Planning of tamping measures, one of the most relevant measures for railway tracks, is largely triggered by poor track geometry. (2) In many cases, poor track geometry indicates an underlying systematic problem. In this case, further indices can be used to specify the root cause of the problem.
For the evaluation of track geometry, we use row data of the longitudinal level, the cumulative track geometry index in the vertical and horizontal directions, for describing the average track geometry of a turnout and utilisation rates for evaluating isolated failures of track geometry. These indicators are used because, when considered together, they can provide a complete picture of the quality behaviour of a turnout’s track geometry. Details on the calculation of utilisation rates and the cumulative track geometry index in vertical direction can be found in [
30]. The utilisation rates are calculated by setting the most severe failure of the track geometry within a turnout in relation to the limit values of track geometry, which results in the utilisation of the limit value. Since our research is closely related to ÖBB data, we use limit values from the national regulation. While the utilisation rates are related to safety issues, the cumulative track geometry index provides an indication of the average track geometry within a turnout. For the calculation, the root mean square values of the longitudinal level within a turnout are cumulated and scaled with the length of the turnout. The last point of the scaled cumulated data represents the cumulated track geometry index. The described method is comparable to the calculation of the standard deviation of the longitudinal level but allows the computation length to be reduced to 3 m, which is essential for a detailed evaluation of turnouts. We have extended these indices from a purely vertical dimension to an additional horizontal dimension, but details of calculation remain the same.
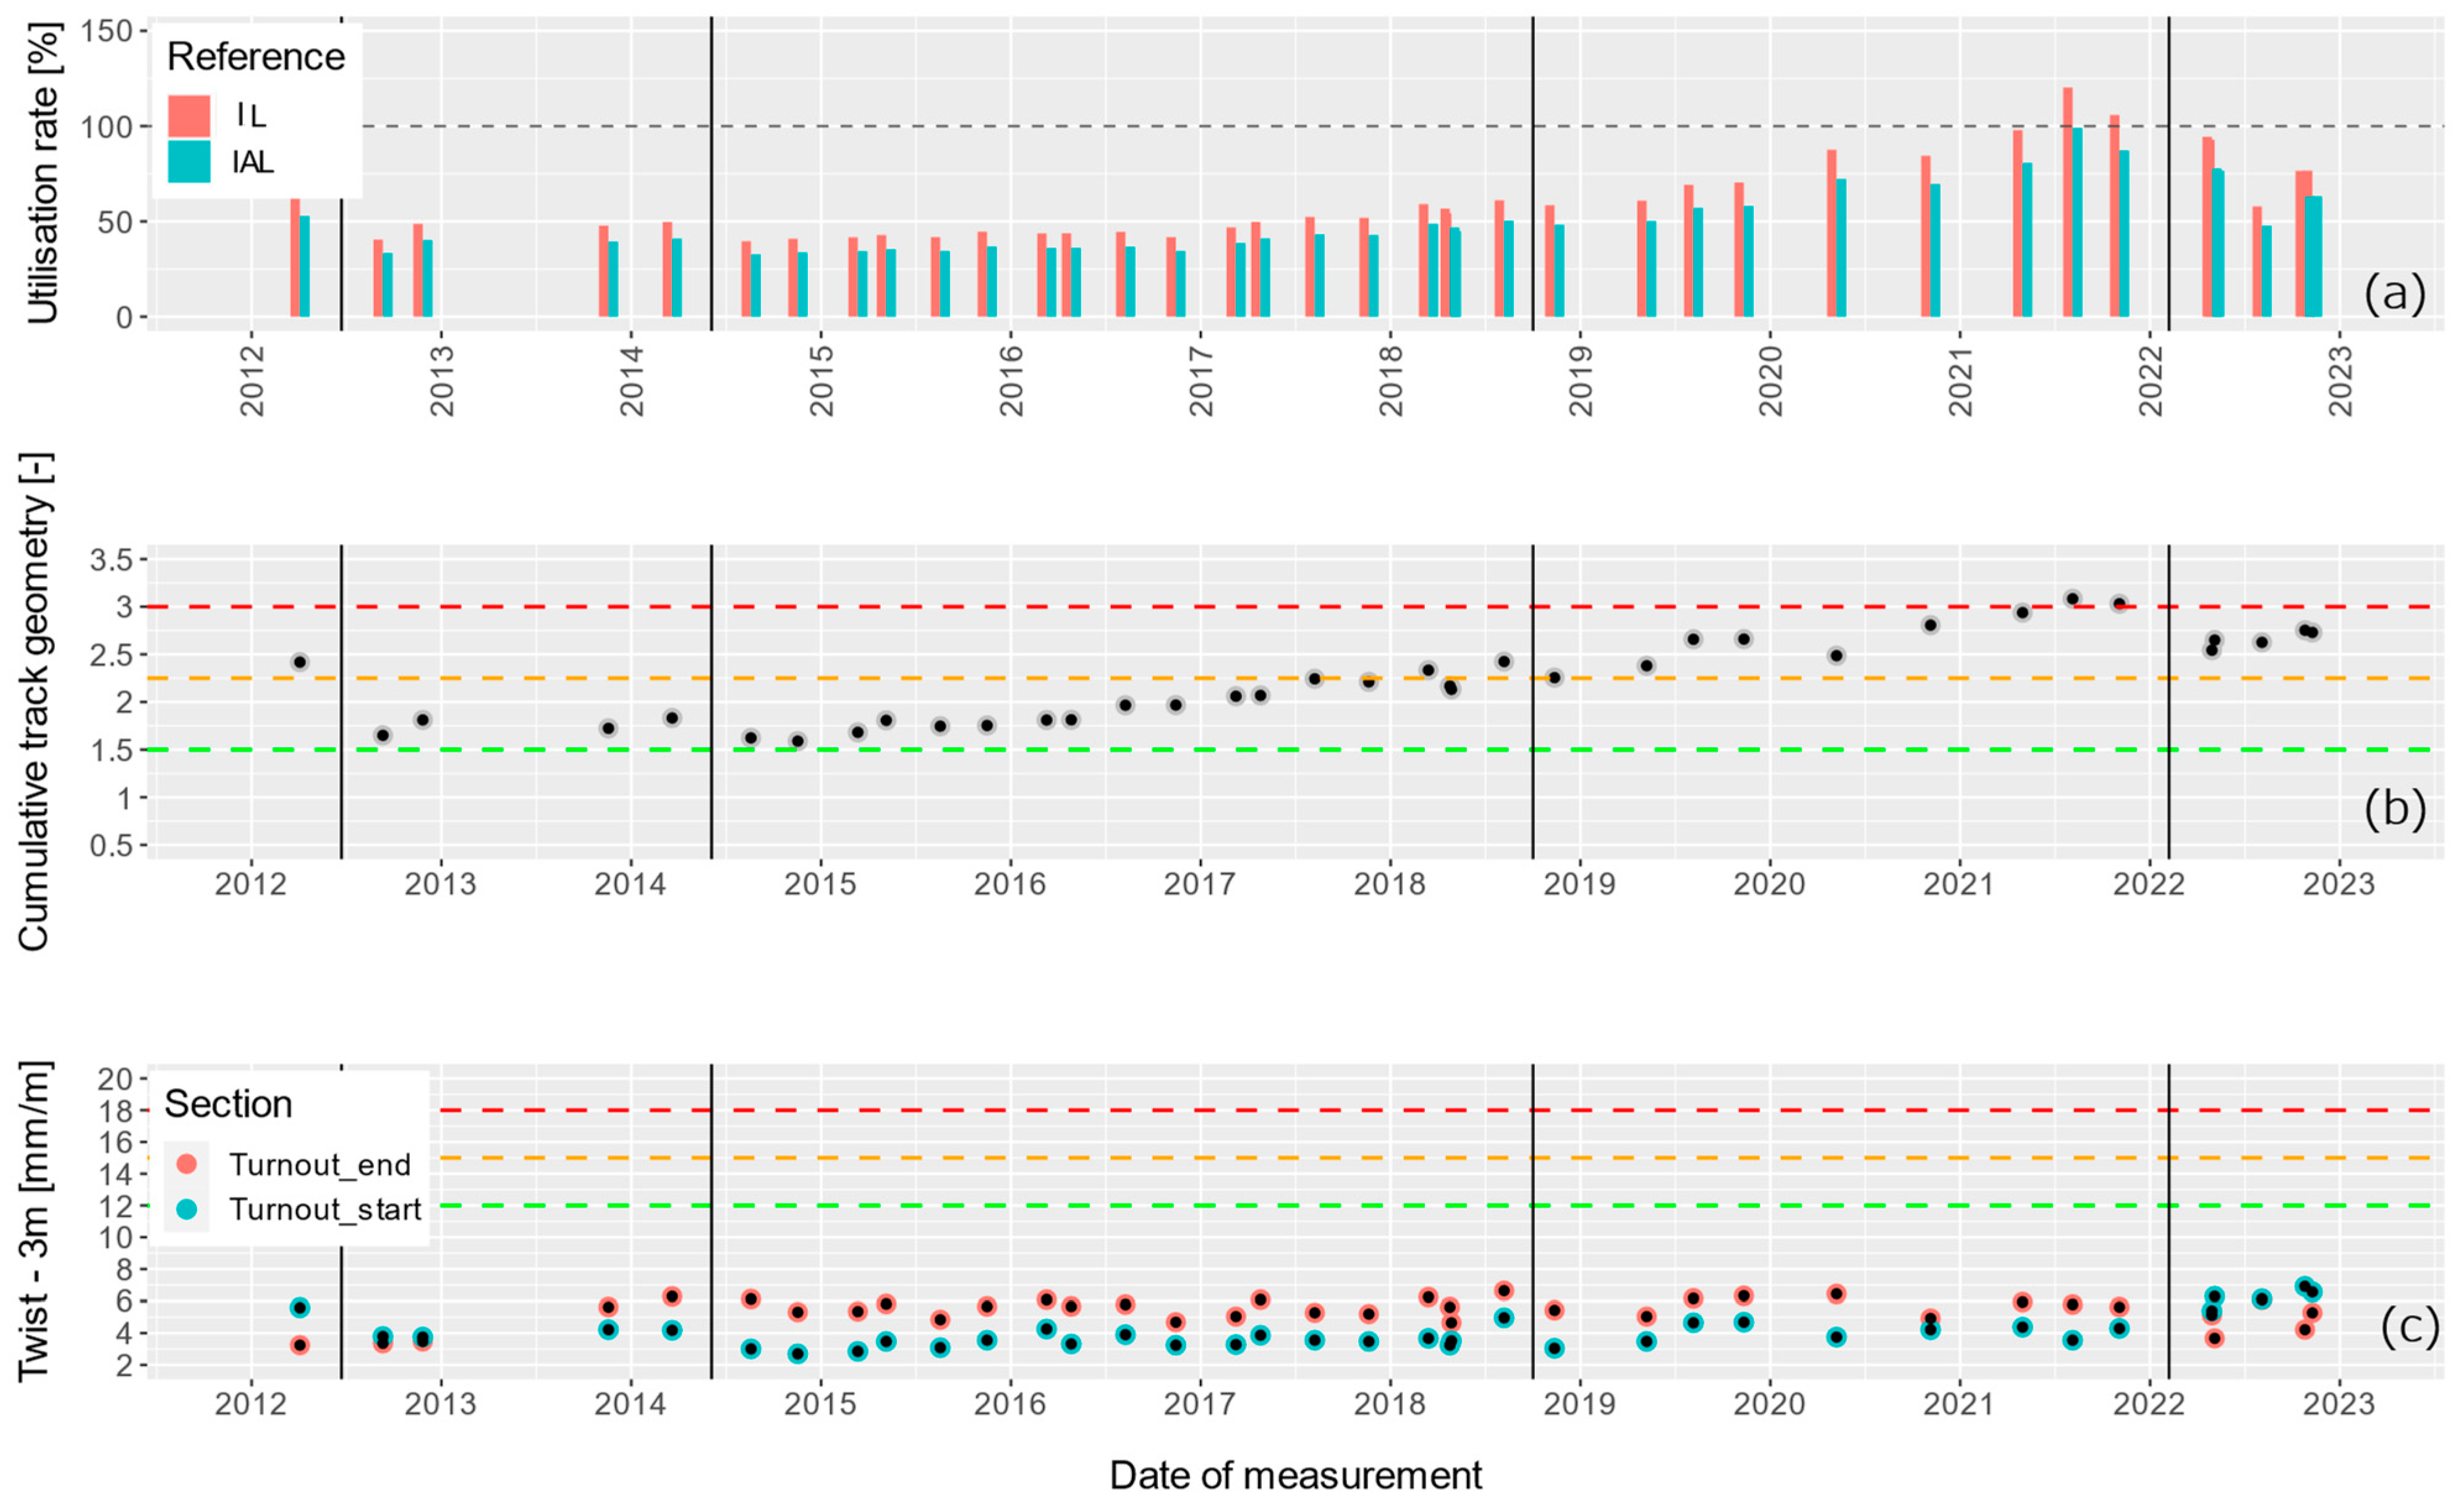
Figure 2b shows the development of the cumulative track geometry index over time for T_R4F_21.
As the turnout was renewed in 2011, the x-axis of the plot starts there. The index (grey dots) increases over time, reflecting deterioration of track geometry due to wear and tear. The coloured horizontal lines reflect quality ranges from excellent (green) to poor (red). These limits are an average over the turnouts analysed so far and are neither finalised nor directly linked to intervention recommendations. Nevertheless, solid approximations can be made with this classification. Vertical lines reflect tamping interventions carried out in the past. Some of these tamping measures have been documented in a database of ÖBB, while others have been detected by signal features using an algorithm developed for this purpose. Details on the detection algorithm can be taken from [
31].
In addition to the average quality of track geometry, the evaluation of isolated defects is important for maintenance planning, as a single isolated defect may require tamping, even if the rest of the turnout is in good condition. When the immediate action limit (IAL) is reached, railway operation must be stopped until a measure is carried out. In order not to reach this state, an action is usually set when the intervention limit (IL) is reached. For this reason, we calculate utilisation rates for the most severe isolated defect in relation to the IAL and the IL. In
Figure 2a, these values are visible over the service life. As expected, the trend shows that isolated defects, similar to the average track geometry, grow over time and are restored by tamping. In 2021.6, even a utilisation of 100% (grey dashed line) is reached for this turnout, which means that the IAL has been exceeded there. Subsequently, an immediate measure has ensured continued safe operation.
An important aspect of track geometry is the twist, as it is relevant to safety. The area between the last long sleeper and the first short sleeper is susceptible to twist errors because (1) the stiffness changes abruptly, and (2) the load distribution there is asymmetrical. An interview with an expert from ÖBB also revealed that practical decisions on necessary tamping measures are often made due to a twist error at exactly this spot. For these reasons, information about twist on a 3 m basis, measured from the track measuring car, is presented. A distinction is made between faults in the rear area of the turnout and in the front area of the turnout. The front area is usually not as critical as the rear part, but twist damage is also possible there.
Figure 2c shows the development of twist over time for T_R4F_21. For this turnout, the standardised limit values are not reached over the monitored timespan; however, later evaluations will show that twist is an issue for some of the analysed turnouts.
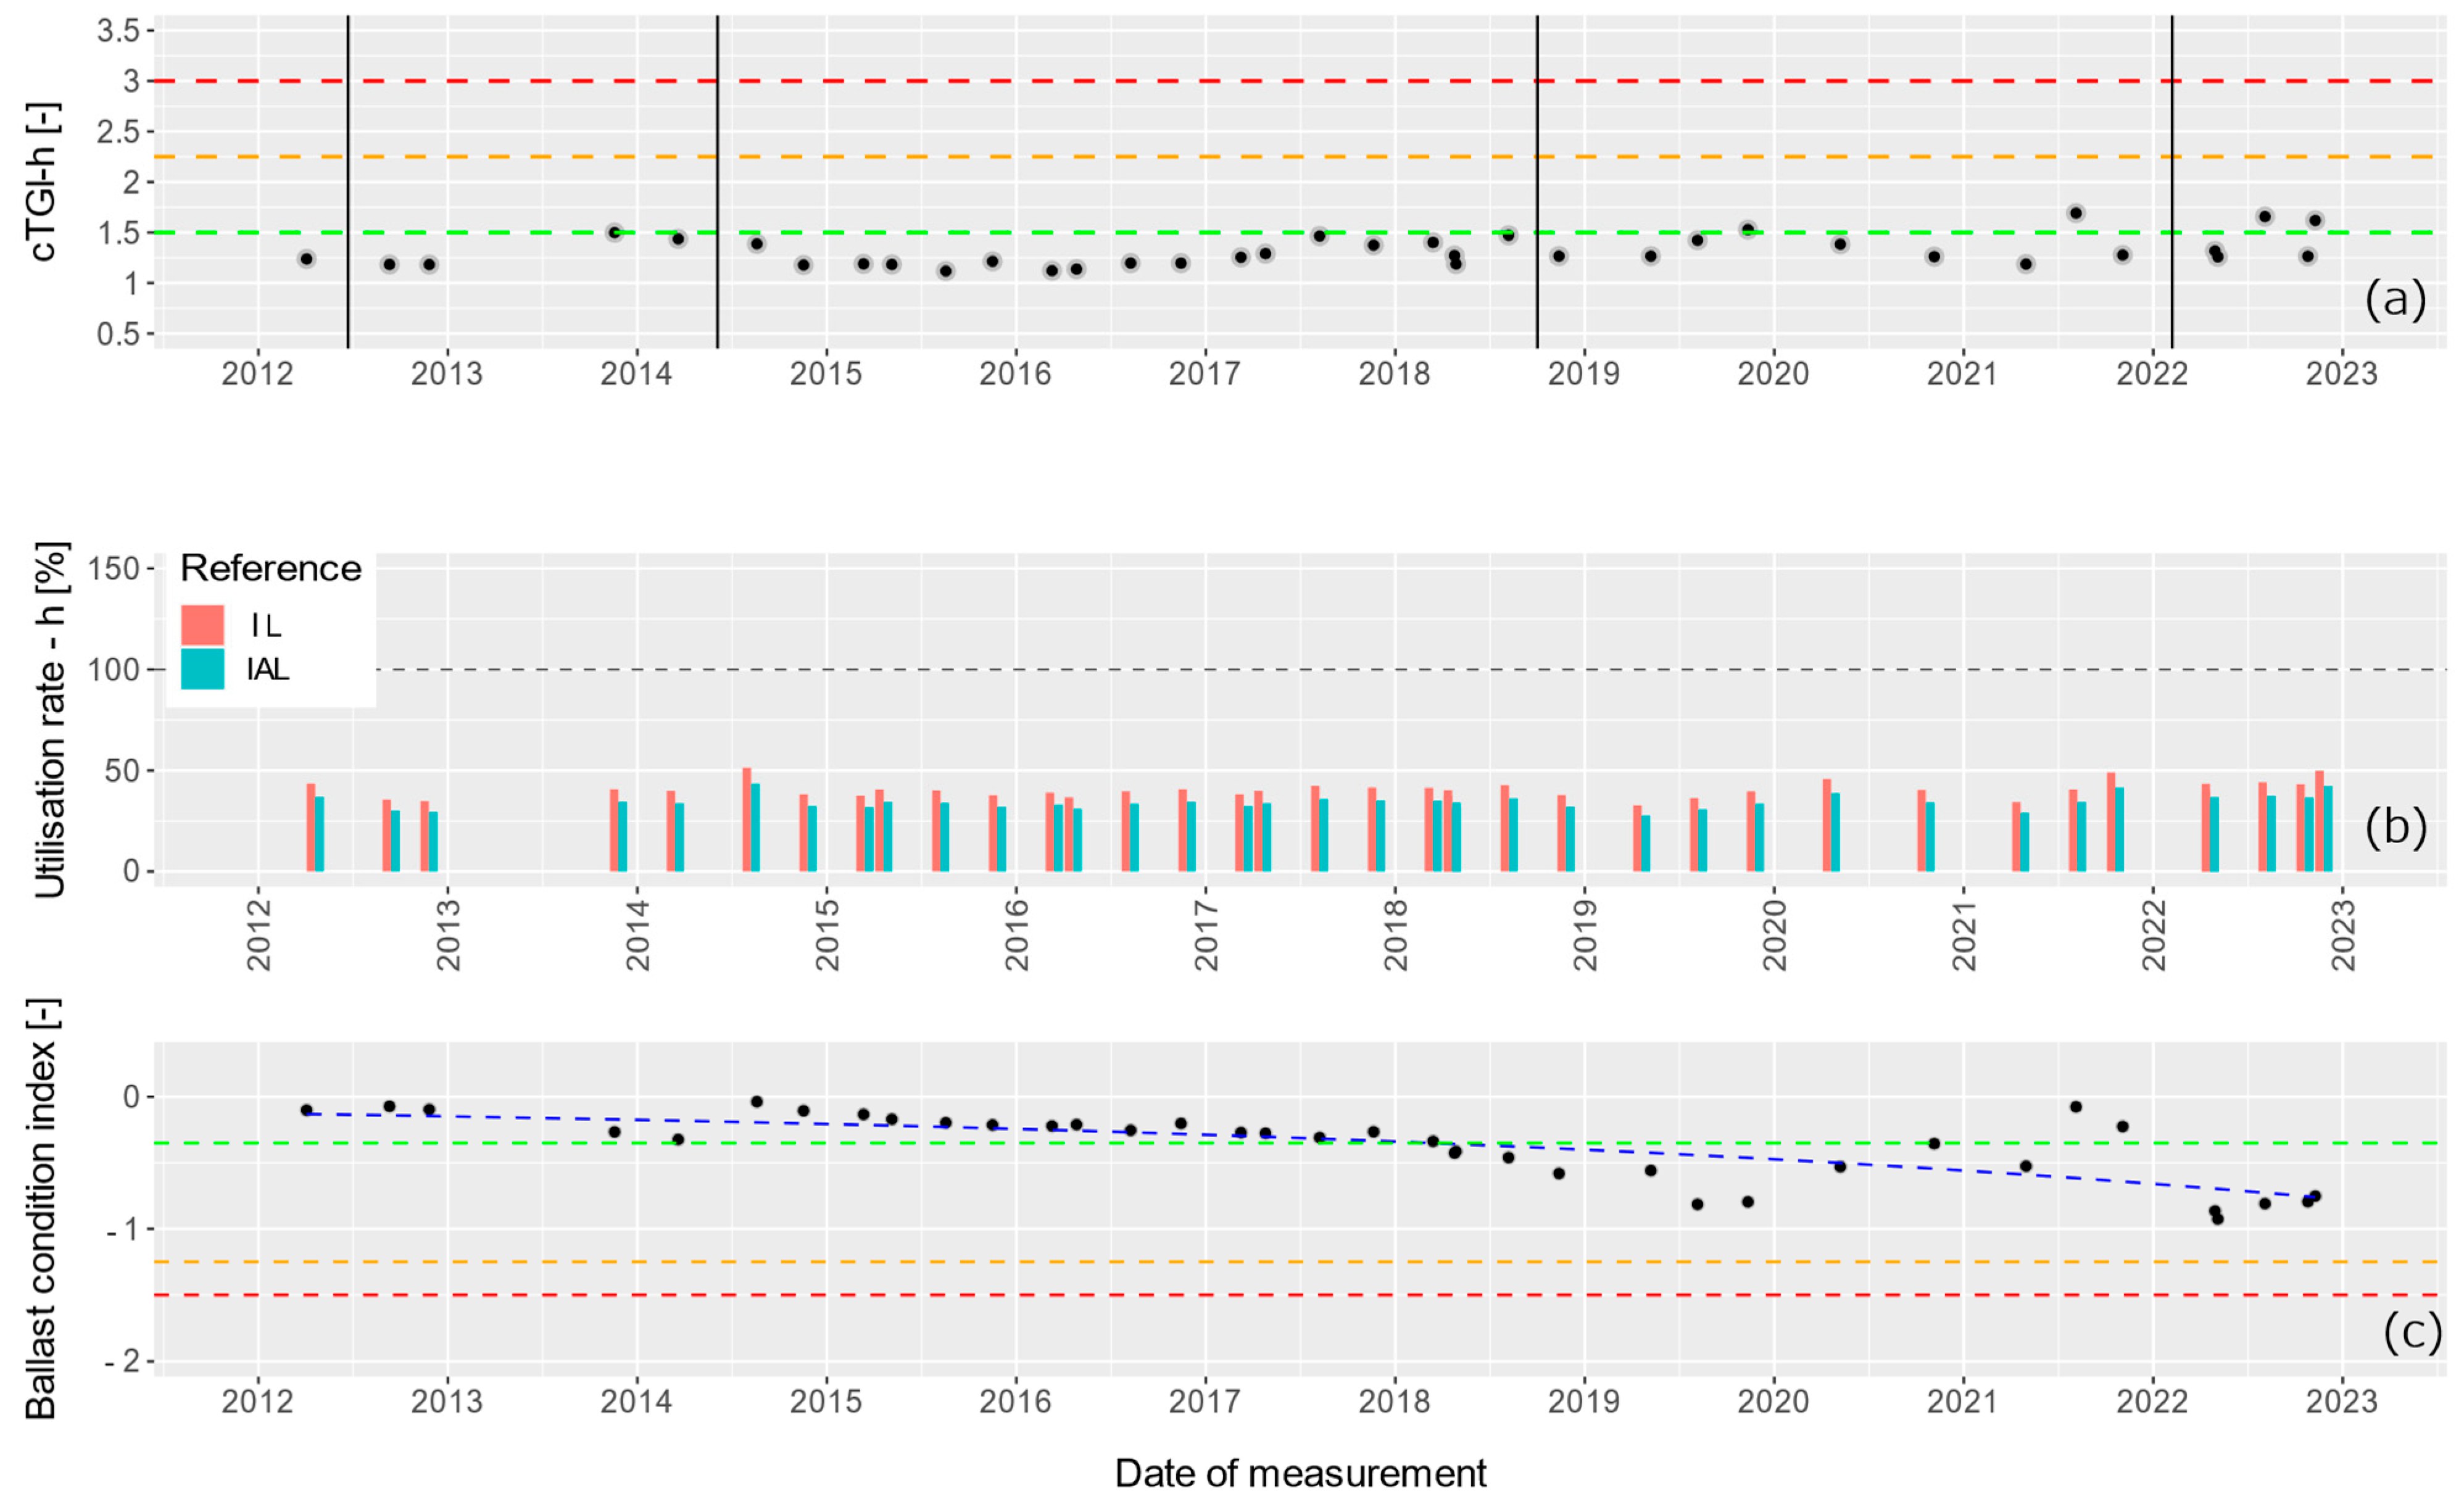
As raised earlier, we have extended the calculation of the cumulative track geometry index and utilisation rates to the horizontal direction. These indices can be seen in
Figure 3a,b, again exemplary for turnout T_R4F_21.
Two inferences can be made from the example. (1) The utilisation rarely reaches 50% over the entire measurement period so that limits are apparently not easily reached. The horizontal level therefore does not seem to be a critical parameter for the turnout under evaluation. (2) No clear deterioration of the horizontal level can be observed. Furthermore, tamping processes, which are clearly visible within the longitudinal level, do not seem to have any effect on the average horizontal level. However, as the quality of the horizontal level is good over the entire observation period, this is not a problem. Track geometry in the horizontal direction is also not a problem for the other turnouts analysed. For this reason, we will not include the horizontal quality parameters in the comparison. However, it is to be expected that these parameters be relevant for some other, presumably older, turnouts.
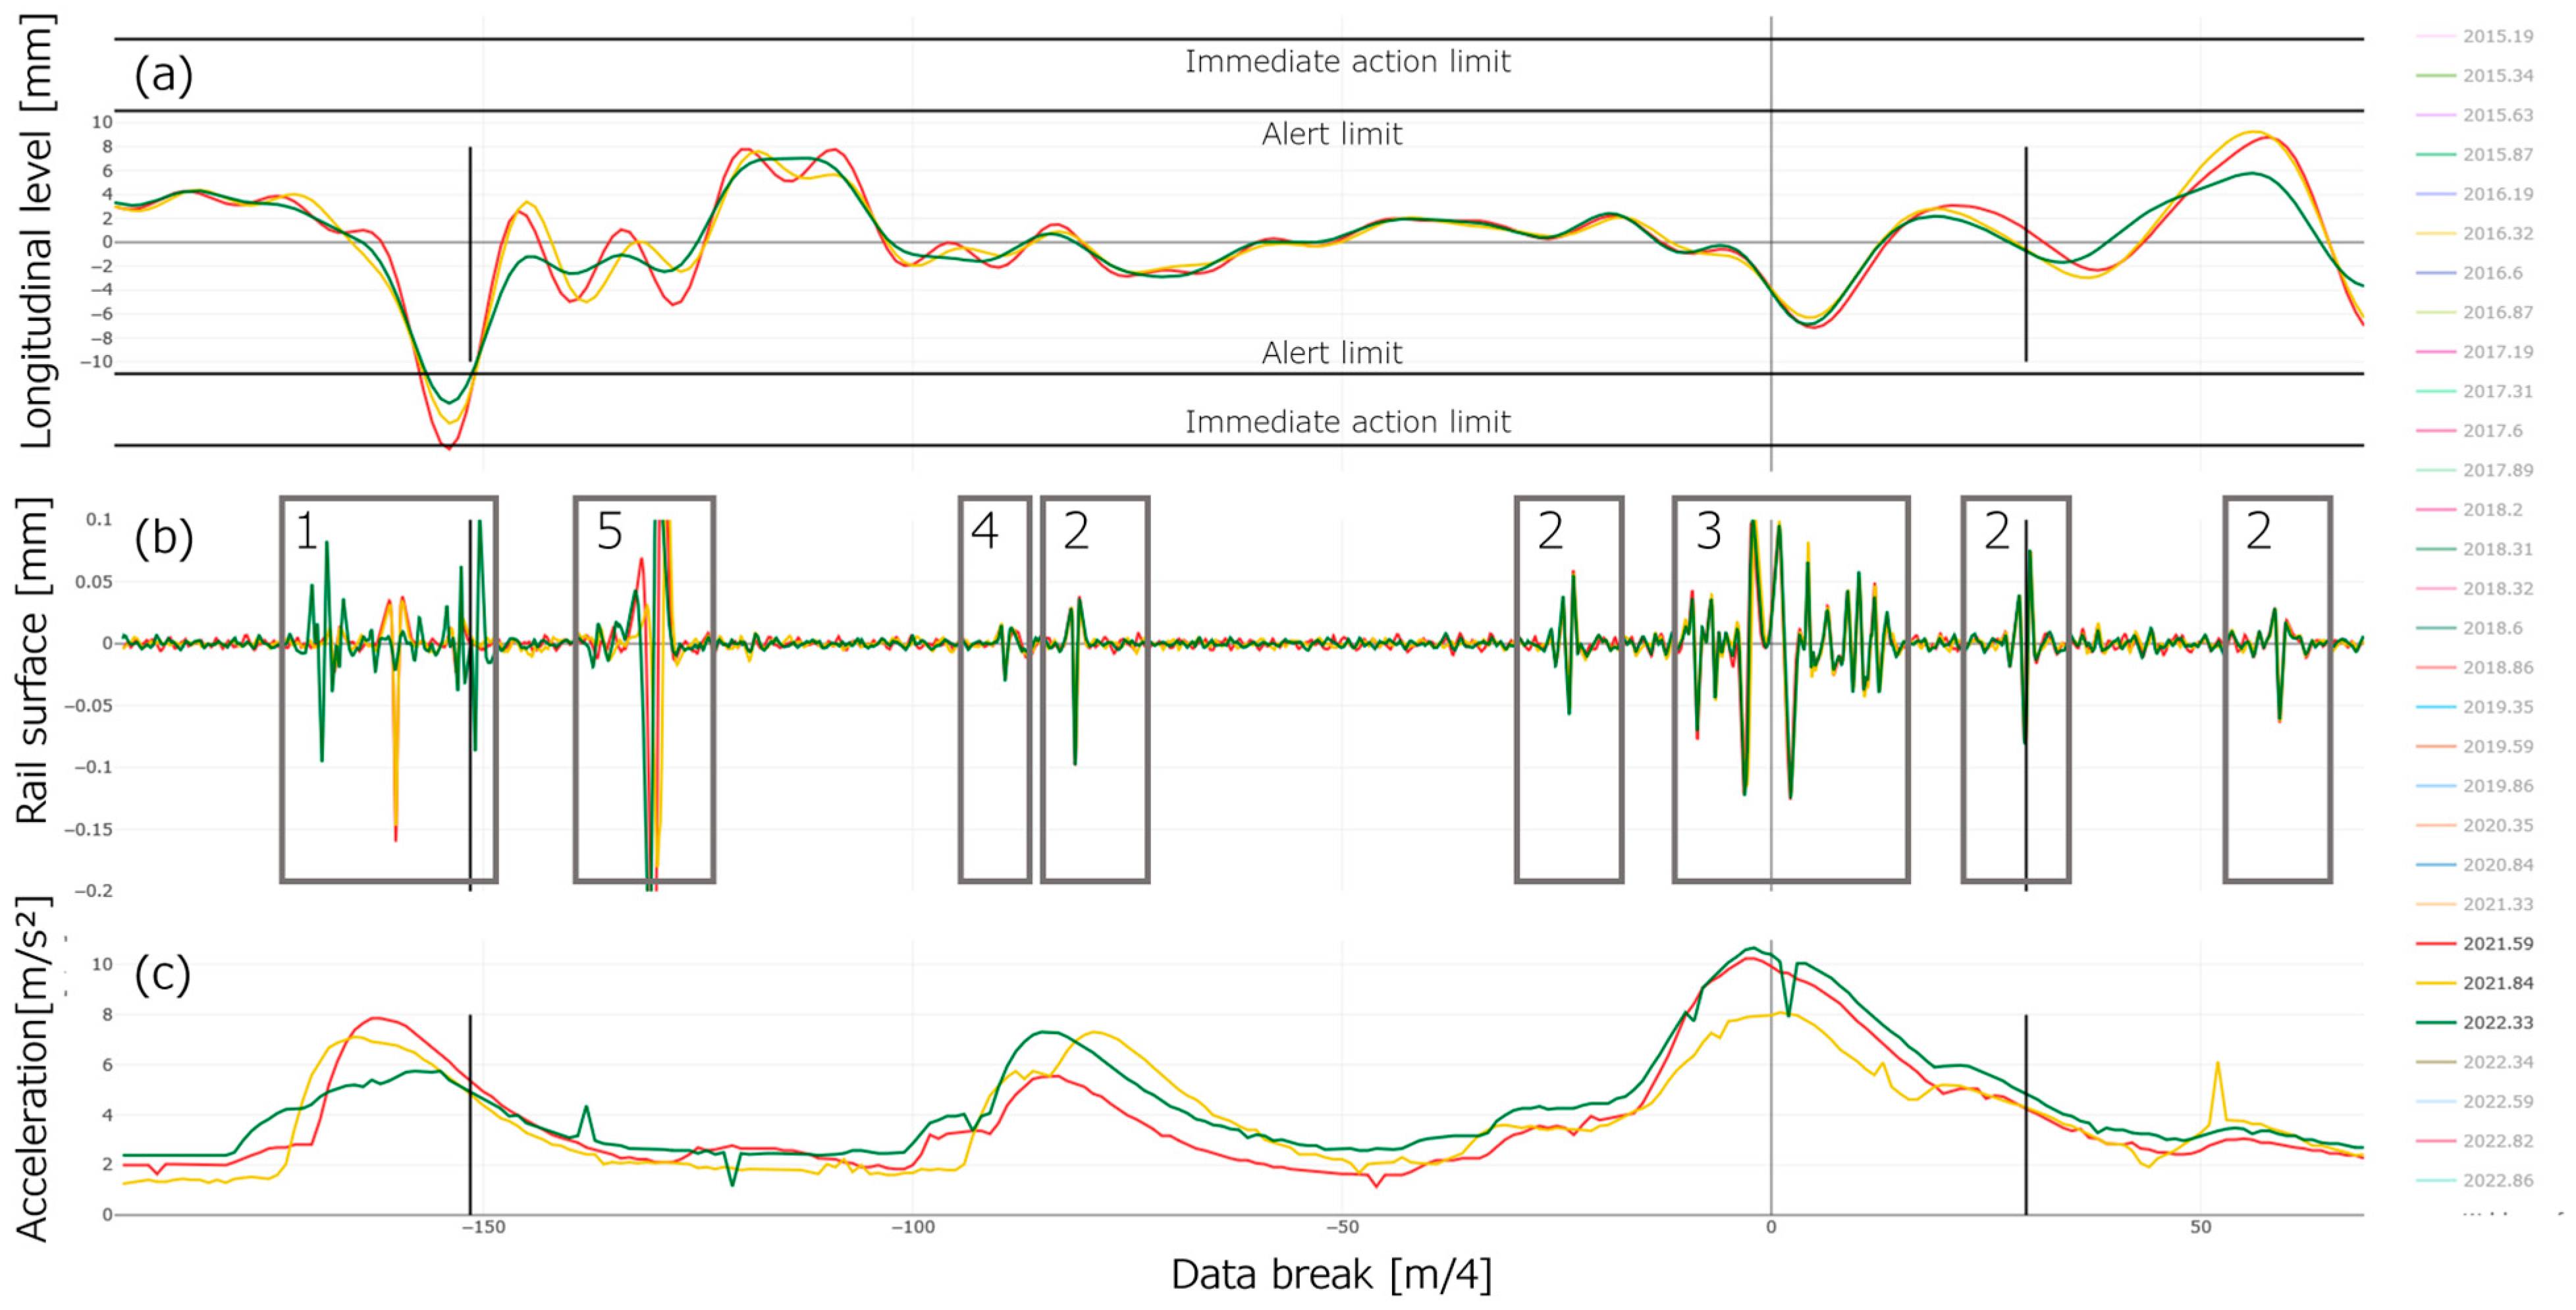
Beside the calculation of quality indicators, interactive raw data visualisation is essential for fully understanding the condition of a turnout. A snapshot of the interactive visualisation tool is shown in
Figure 4.
The figure is divided into the representation of the longitudinal level (a), rail surface (b) and axle-box acceleration (c). In practical use, it is useful to show and hide measurement runs depending on the needs of the evaluation. In this example, three of the measurement runs are faded in. Measurement run 2021.59 (red line) is the one where the immediate intervention threshold was exceeded (as discussed for
Figure 2a). From the raw data, the exact position of the failure can be determined at the transition area in front of the turnout. The following measurement run 2021.84 (orange line) shows that a local measure was taken at this point, and the isolated defect of track geometry was reduced. However, this was merely a local emergency measure. The third measurement run 2022.33 (green line) shows continuous tamping, which improves track geometry quality of the entire turnout. It is also obvious that a measure was taken at the insulated rail joint close to the critical failure, which is evident from the rail surface signal (
Figure 4b).
2.1.2. Ballast Condition Evaluation
The quality of ballast has a significant impact on the quality behaviour of turnouts. Ballast in good condition leads on the one hand to a stable track geometry due to its sharp-edged grain and on the other hand enables load distribution on several sleepers due to its elastic behaviour, thereby relieving the sleepers and rail fastenings. However, ballast of poor quality reduces both positive properties. Therefore, the condition evaluation of ballast is essential for the interpretation of system behaviour. We use the ballast condition index developed by Fellinger for this purpose [
29]. Index calculation is based on wavelength evaluations of the longitudinal level by power density spectra.
Figure 3c shows the index, again in form of time series. Horizontal lines divide the index value into 4 quality ranges, which have been calibrated and validated in past work. For the turnout shown, anomalies in the ballast bed can be spotted from 2019 to 2023. This issue will be discussed in detail in a later part of the paper.
2.1.3. Evaluation of Rail Surface Irregularities
When it comes to causes of poor turnout behaviour, short-wave irregularities must be considered. These effects lead to dynamic load effects and thus accelerate wear of components. We have recently published details on these interrelationships in [
22]. Typical places where short-wave irregularities occur are welds, isolated rail joints and rail defects. Due to the design of turnouts, several of these locations are present. Since turnouts of this size are usually transported as three pre-assembled panels that must be welded together on site, at least 14 joints are required (including both branches). Some of these joints are designed as insulated rail joints, essential for the train operation system. As the contact conditions between rail and wheel are disturbed by various influences, rail defects are also more likely to occur in the turnout area. Attention should therefore be paid to uneven rail surfaces when it comes to the overall understanding of quality behaviour.
For the evaluation of short-wave effects and their impact on track deterioration, we use the rail surface signal and axle-box accelerations, both measured with ÖBB’s measuring car. The rail surface measurement system measures irregularities in the middle of the rail head in a wavelength range of 20–1000 mm. Further details on this measurement can be found in [
1].
Figure 4b shows a filtered version of the rail surface signal for turnout T_R4F_21. Several effects can be observed in the signal, and labels have been added for clarity. An isolated rail joint (1), several welds (2) and the crossing nose (3) lead to considerable irregularities of the rail surface. Deflection (4) can be assigned to a rail defect. Deflection (5) is a measurement error given in every turnout and is caused by the transition between tongue rail and switch rail and should not be considered as an irregularity of the surface. Rail surface irregularities are one of the causes of vehicle reactions. Axle-box accelerations can be used to quantify vehicle reactions.
Figure 4c therefore illustrates axle-box accelerations of the measuring car. It can be clearly seen that any irregularity of the rail results in vertical accelerations of the wheels. We point out that the raw data of axle-box acceleration, which would have far more high-frequency components, is not stored on the measuring vehicle. An analysis process is performed on the vehicle to detect corrugations, resulting in the signal used here. While raw data would allow more analysis in many respects, the processed signal can still be used to quantify vehicle responses. For turnout T_R4F_21, the strongest vehicle reaction is caused by the frog and by insulated rail joints.
2.2. Quality Comparison of the Analysed Turnouts
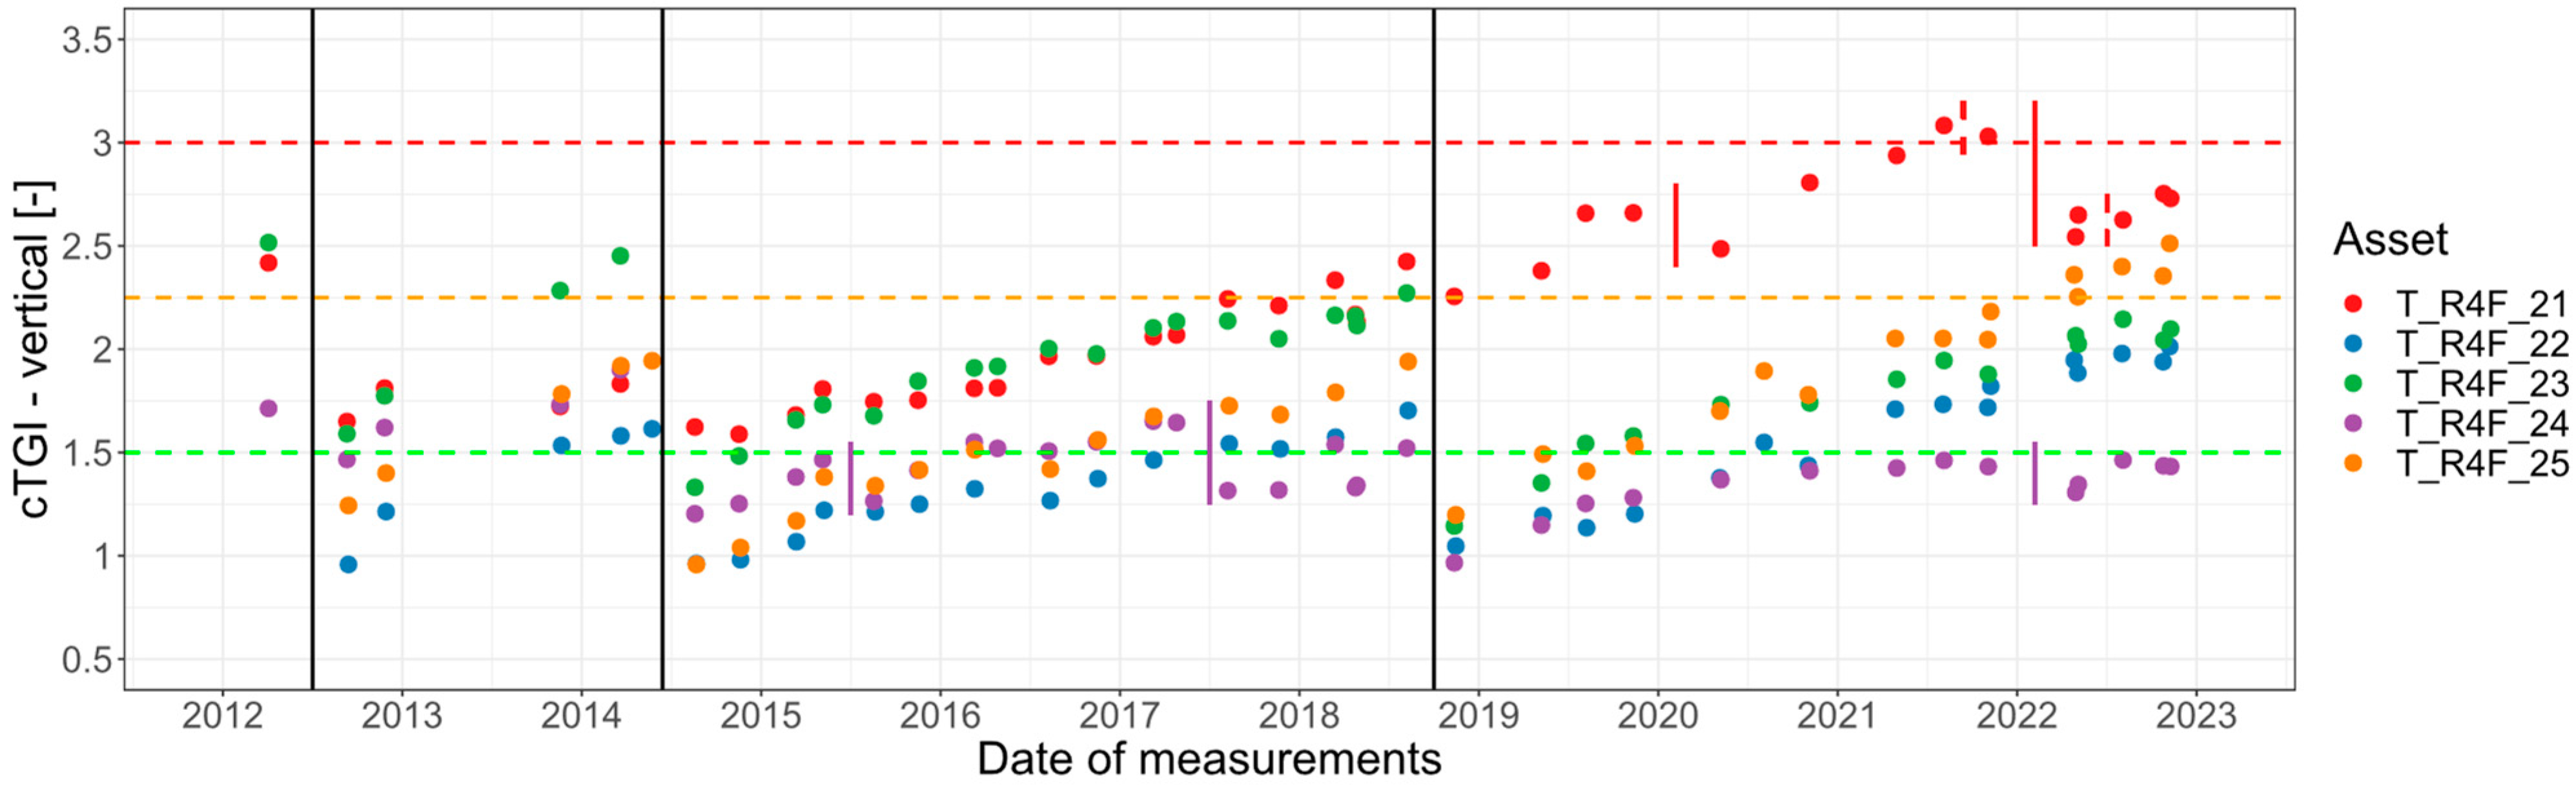
In this part of the work, the tools described above are used for quality comparison between the five turnouts analysed. The comparison starts with vertical track geometry (cTGI, utilisation rates and twist), as these parameters are the most important indicators for maintenance planning and at the same time an indication of poor system behaviour. The temporal development of the cumulative track geometry index in vertical direction for each turnout is shown in
Figure 5.
The horizontal dashed lines represent the same quality levels as introduced in
Figure 2b. Maintenance actions affecting the track geometry are represented by vertical lines, with black lines representing the tamping of each turnout, coloured solid lines representing the tamping of the respective turnout and coloured dotted lines representing local actions at critical spots. It can be seen that the average vertical track geometry of the turnouts behaves similar from 2012 to 2018.75. In the first years, track geometry deteriorates relatively quickly, but after tamping in 2014 quality of each turnout is good, and deterioration is also not excessive. A closer look at the period between 2014.5 and 2018.75 shows that two turnouts behave slightly worse than the others, namely T_R4F_21 and T_R4F_23. Their average track geometry is at a slightly higher level, and their deterioration rates are also slightly higher. Considering the daily load shown in
Figure 1, this is not surprising as it is higher for these turnouts than for T_R4F_22 and T_R4F_25. However, it is surprising that T_R4F_24, which has a similar daily load to T_R4F_21/23, behaves better than T_R4F_22/25. When looking at the evolution of T_R4F_24, improvements can be seen in 2015.5 and 2017.5. Using interactive raw data visualisation confirms the assumption that there must have been additional tamping actions for this turnout. These actions cannot be explained with the available tools but do explain the quality behaviour of T_R4F_24.
Due to tamping work at the end of 2018, track geometry of all turnouts besides T_R4F_21, but especially that of T_R4F_23, could be brought back to a good quality. Since then, T_R4F_21 has behaved significantly worse than the other turnouts. Even an additional tamping task in 2020 could not solve the problem. Only after a tamping task in 2022.0 could track geometry of T_R4F_21 be slightly improved. Nevertheless, the average quality of T_R4F_21 is still worse than the quality of the other turnouts. Looking at utilisation rates and twist values improves the understanding of the described development.
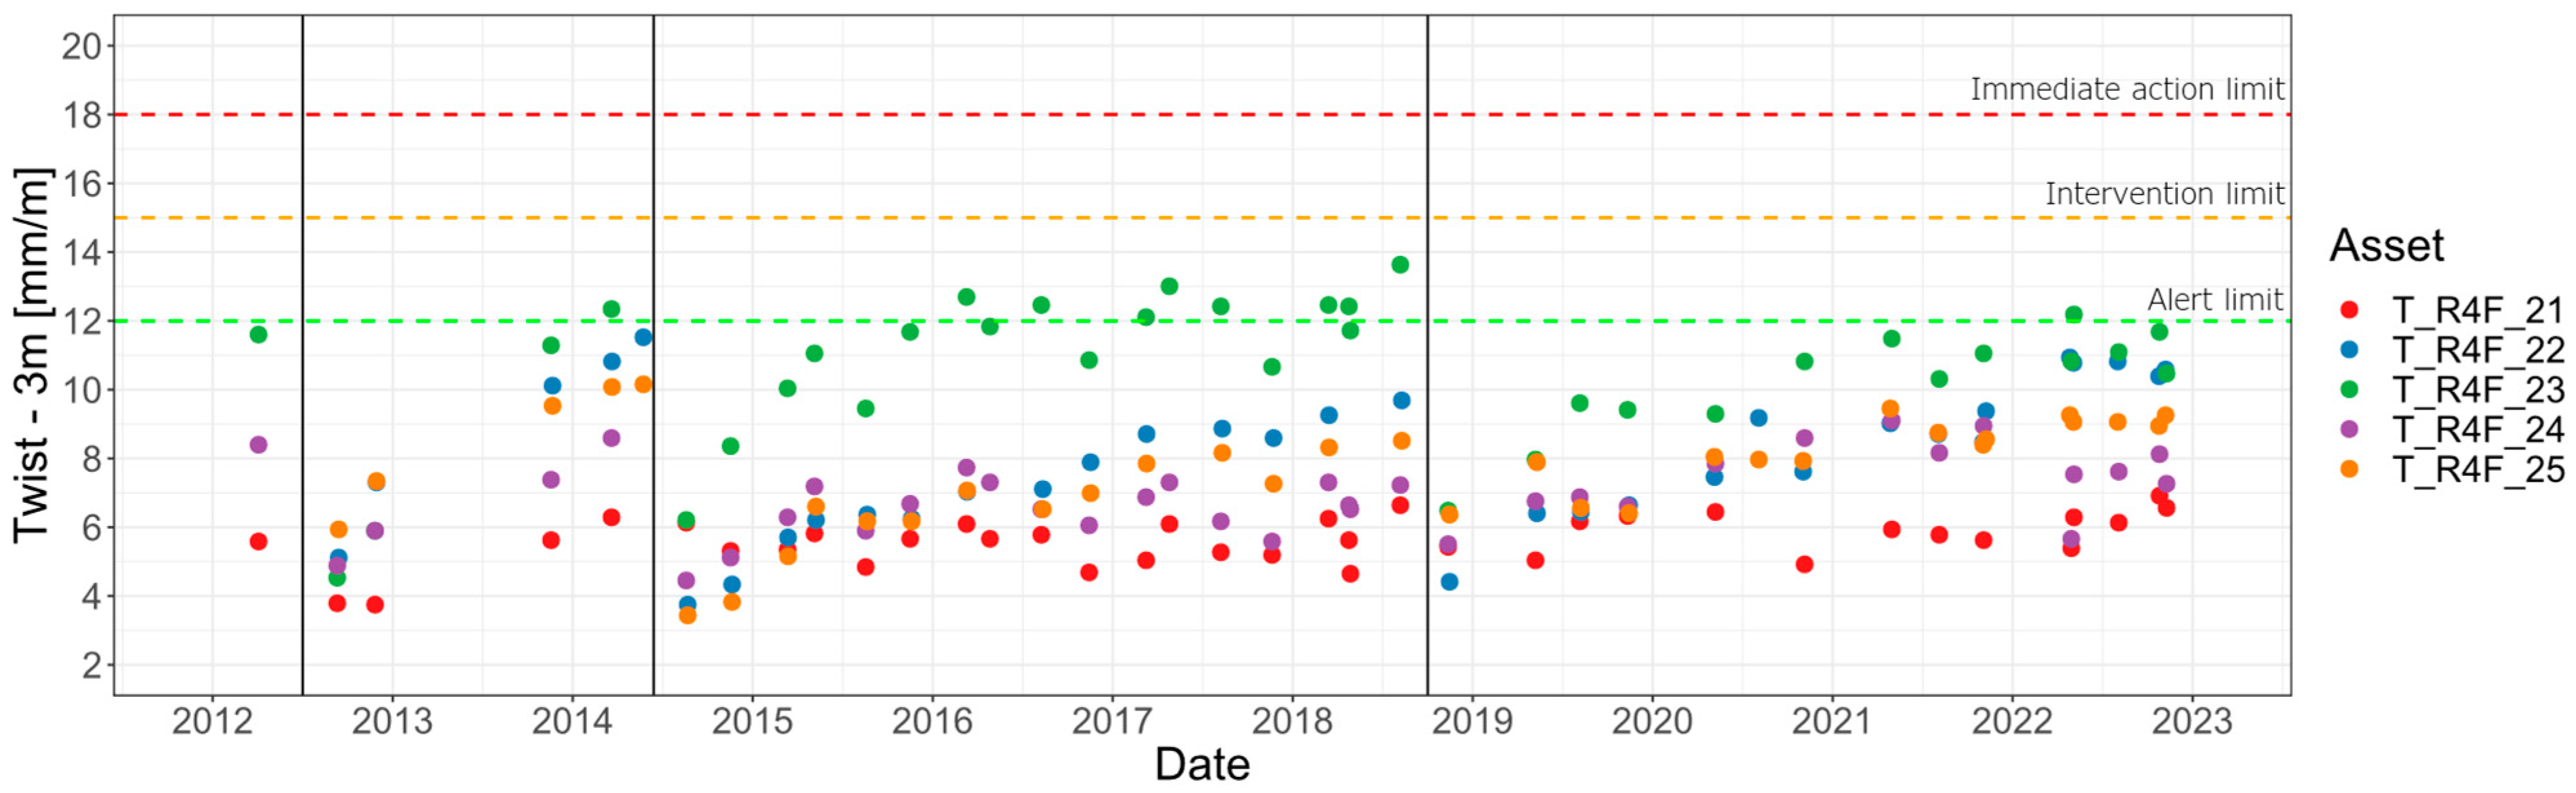
Figure 6 shows maximum twist values over time for the turnouts examined.
By including twist failures, it becomes clear why the average track geometry of turnout T_R4F_21 and turnout T_R4F_23 behaved similarly before 2018 and differently after tamping in 2018. For T_R4F_23, twist was the main problem until 2018; the alert limit was reached here. By eliminating the twist error in 2018, the main cause of poor track geometry was removed, and therefore average track geometry has improved significantly and sustainably. T_R4F_21, on the other hand, was not a problem for track workers in 2018, and no limits were reached. This is also confirmed by the utilisation rates, which are summarised in
Table 1.
The first column of the table summarises utilisation rates for the entire observation period, showing that T_R4F_21 is on average closest to the intervention limit. In addition, utilisation rates are summarised for the period between 2016 and 2018.75, the period immediately before tamping. During this period, T_R4F_23 was the most critical turnout, with utilisation rates up to 80%. T_R4F_21 is inconspicuous here. This further emphasises that T_R4F_21 appeared to be in a stable condition in 2018 with the tools available to track workers (raw signals of the longitudinal level and twist). However, this changed after 2018. Utilisation rates in the last years of the observation period are very high for T_R4F_21. With a maximum value of 1.2 (close to the IAL) and a mean value of 0.9, utilisation rates are significantly higher than for the other turnouts. This is also the reason why additional maintenance work has been carried out for T_R4F_21 in 2020.1, 2021.7, 2022.0 and 2022.5, with moderate success, as utilisation rates show.
Questions arise regarding the behaviour of turnout T_R4F_21. Why is the performance significantly worse since 2018? What are the root causes for deterioration? Why did the tamping tasks in 2018, 2020.1 and 2022.0 not improve the track quality? What suggestions can be given for future maintenance planning? The following part of the paper tries to answer these questions.
2.3. Causes for the Poor Performance of T_R4F_21
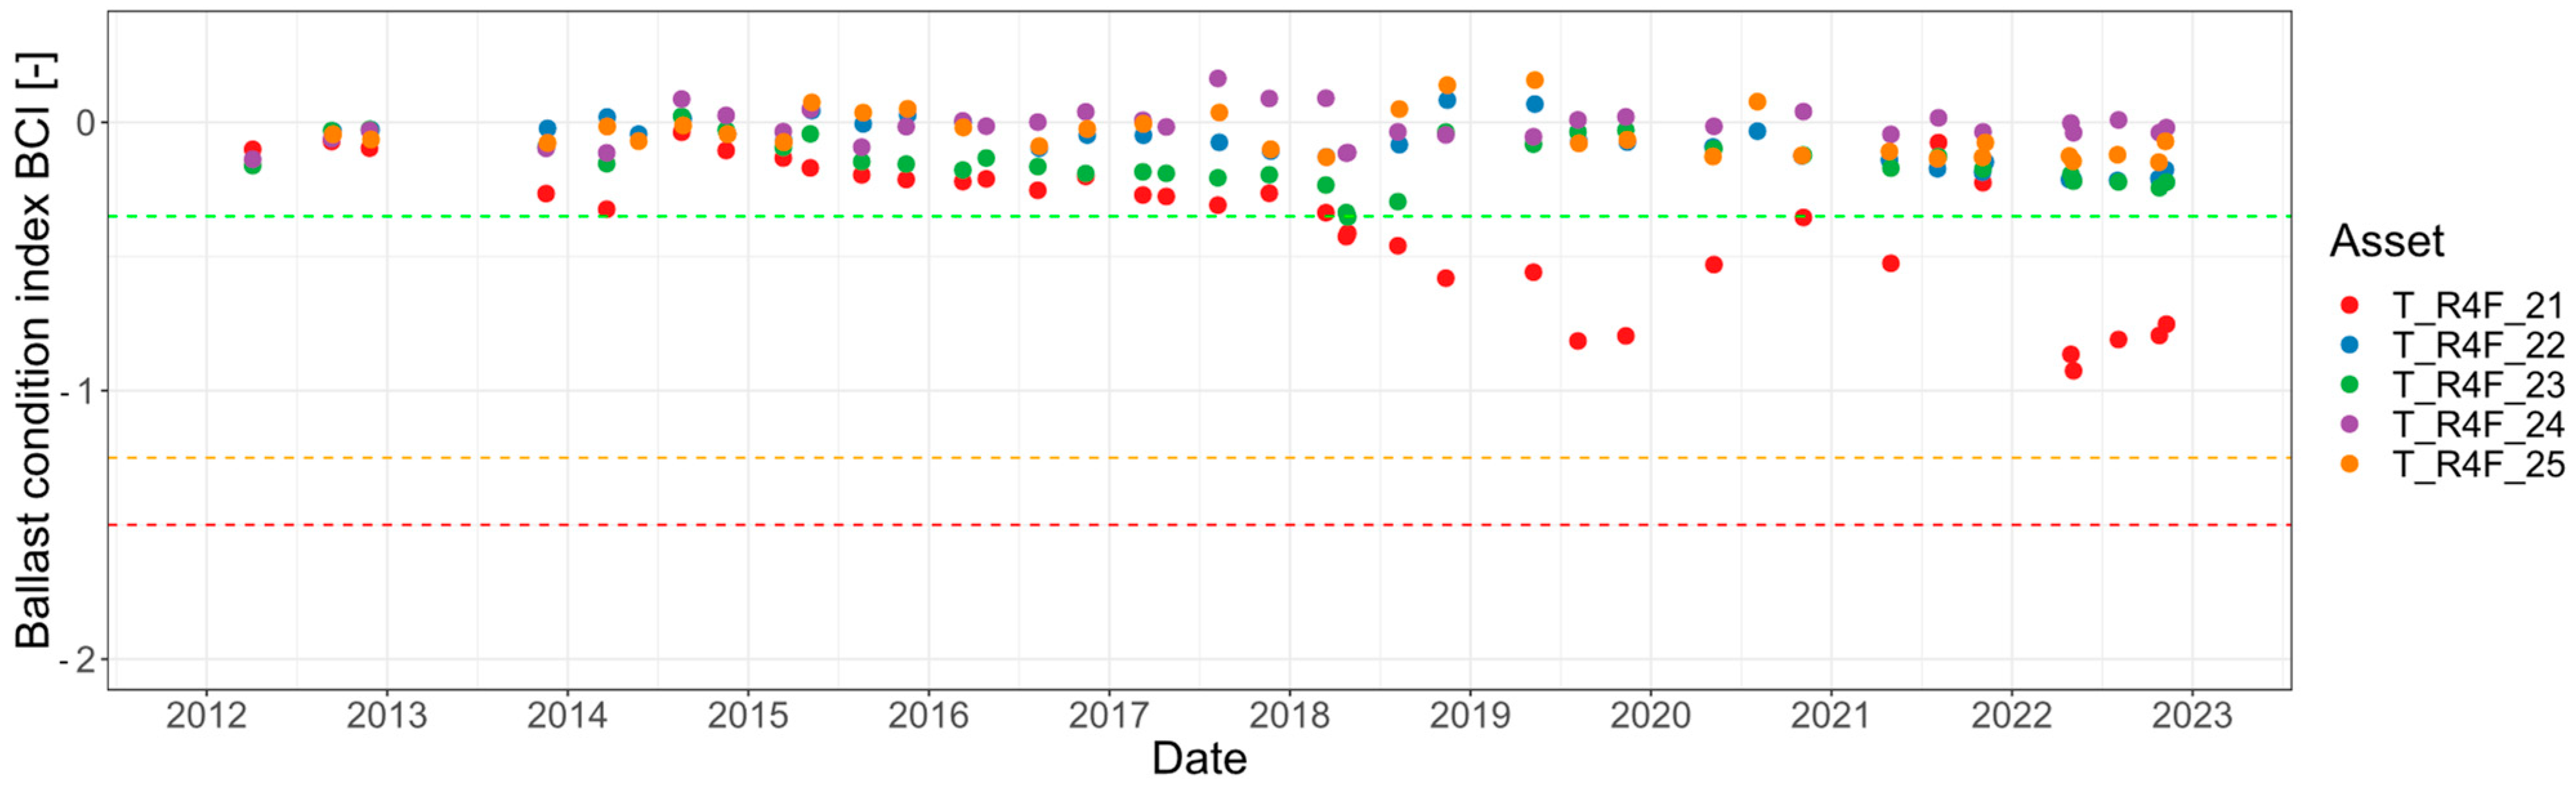
A possible explanation for the different behaviour of T_R4F_21 is the type of turnout itself. Although this turnout has practically the same boundary conditions, it was supplied by a different manufacturer. T_R4F_22–25 are turnouts from the main supplier of ÖBB and therefore a standardised product, while T_R4F_21 is a test turnout and therefore rarely installed in the network. A possibly poorer quality of the turnout and less experience of the track workers in proper maintenance could be reasons for a poorer quality behaviour of the turnout; however, there is no statistical evidence for these assumptions. We therefore want to give a technical overview of the causes of poorer quality behaviour. A significant technical difference becomes apparent when comparing our indication index for ballast degradation (
Figure 7).
Horizontal dashed lines within the figure describe the quality areas described in chapter 2.1.2. While the indicators for the other turnouts are above the green line, the plot clearly shows that the ballast of T_R4F_21 has shown anomalies since 2018. This corresponds exactly to the previously analysed behaviour of track geometry, as problems at the turnout have been visible since 2018. The poor ballast condition explains both higher deterioration rates of track geometry and low effectiveness of tamping measures. As the turnout is relatively young and the trend of ballast deterioration is exponential, a solution to the problem cannot be achieved by tamping measures alone. The author’s recommendation is to carry out ballast cleaning and thus stabilise system behaviour. However, consideration must be given to the cause of rapid ballast deterioration.
By reducing the calculation window for the ballast condition index and a sliding representation of the index, information about the distribution of good and bad areas can be obtained.
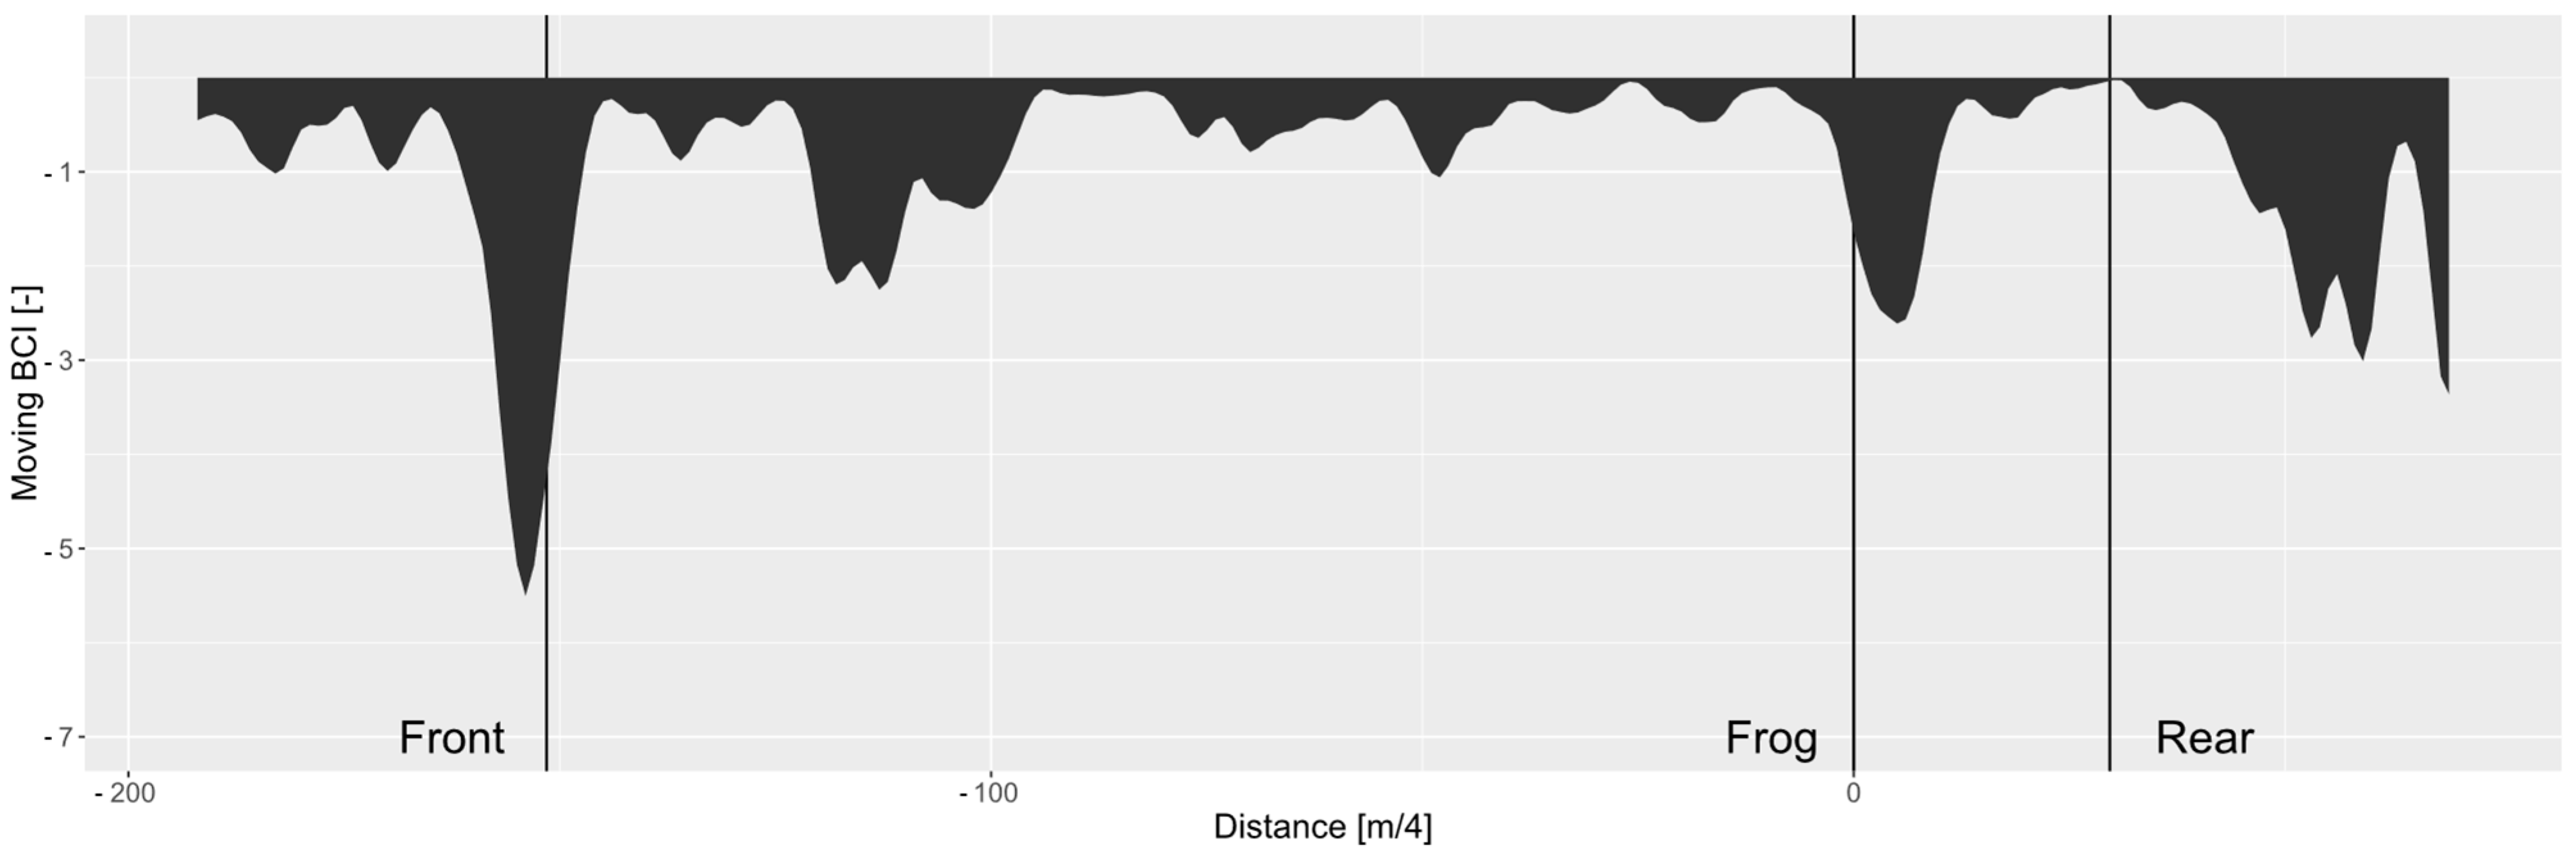
Figure 8 shows a sliding representation of the ballast condition index for the last measurement runs of turnout T_R4F_21.
Four critical areas can be identified with especially poor ballast condition. (1) The area around the crossing nose, (2) the transition zone in front of the turnout, (3) the transition zone to the rear of the turnout and (4) a spot within the switch panel of the turnout. Area 2 has the most serious problem and is therefore discussed in detail.
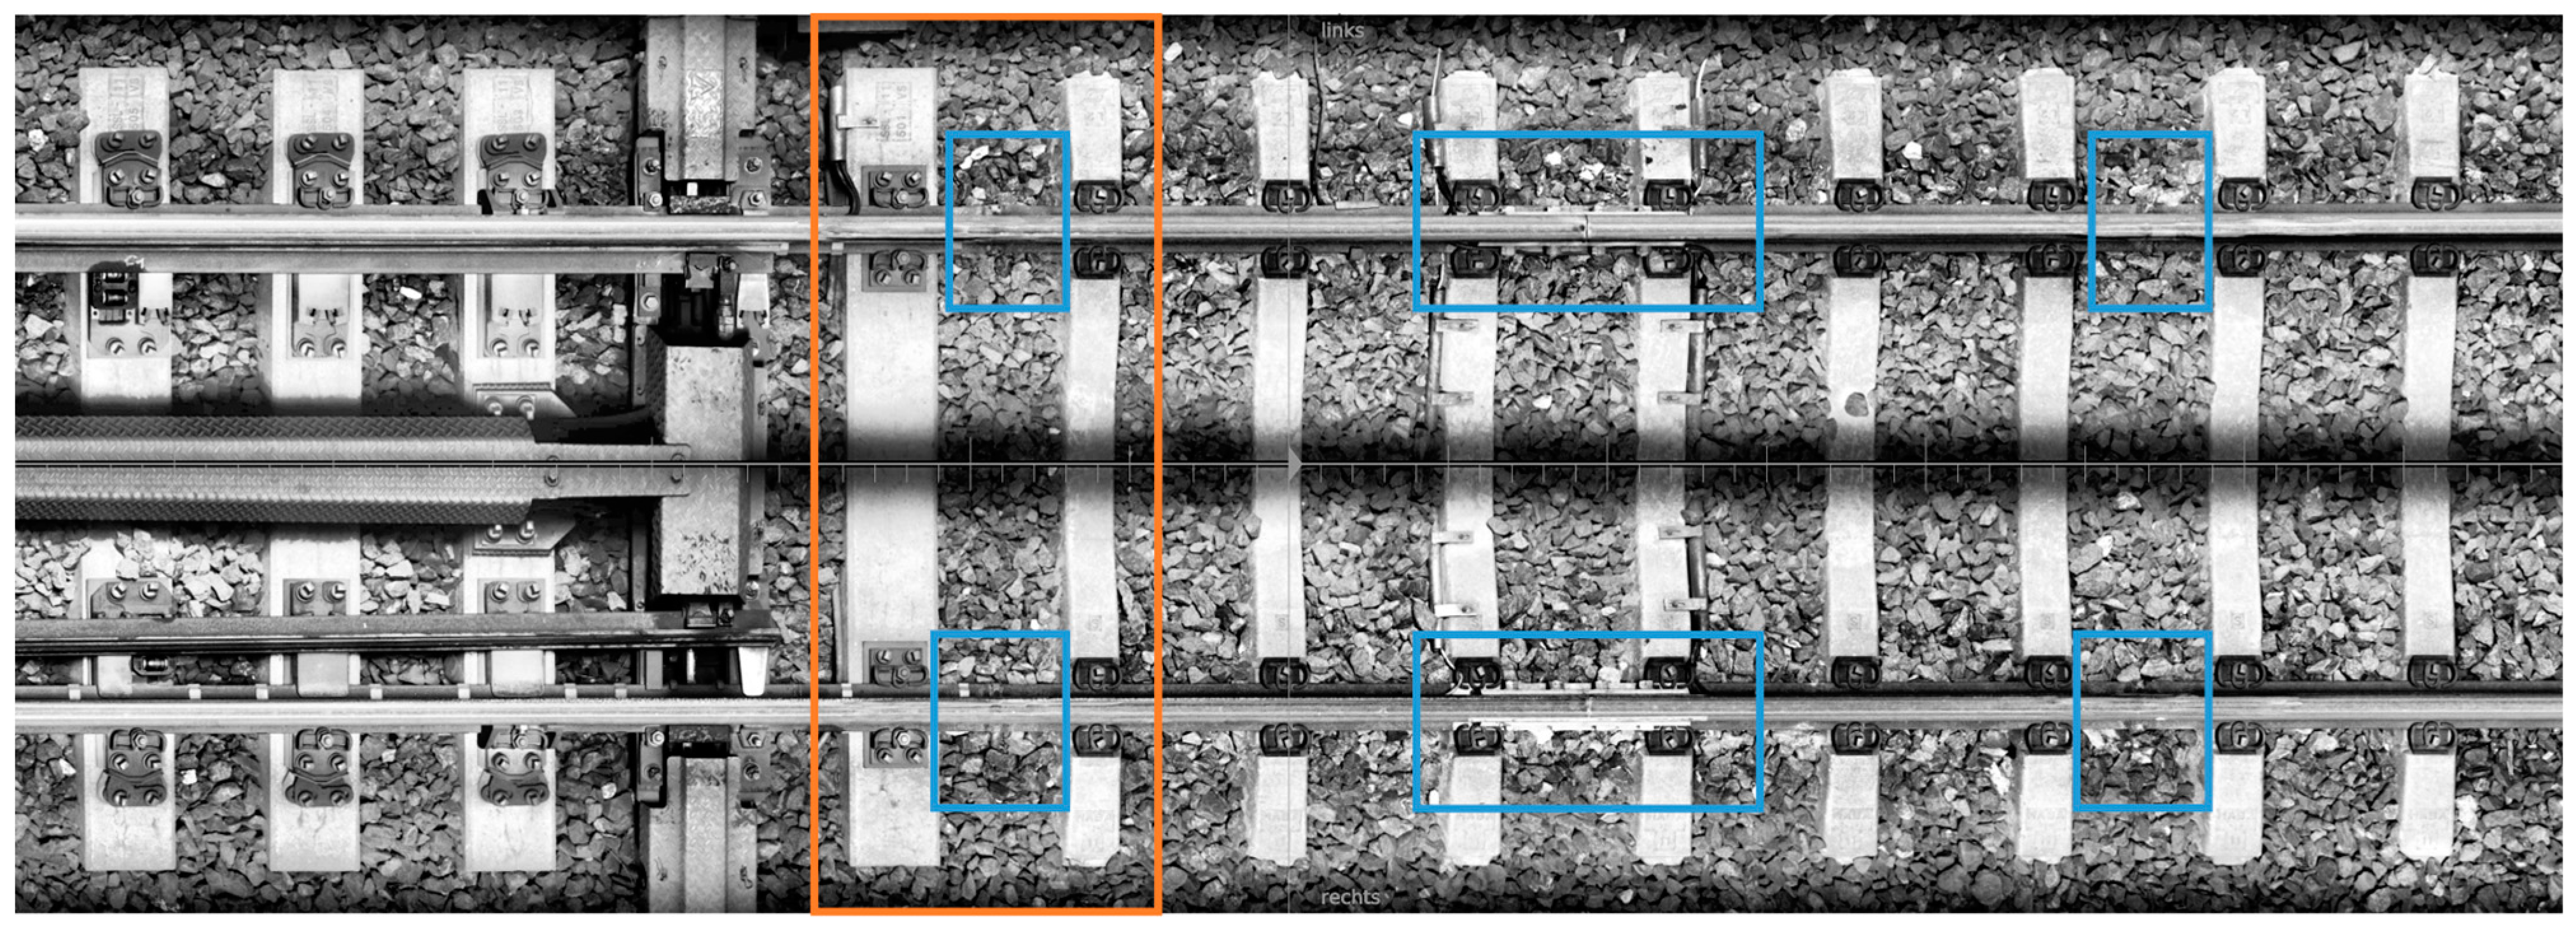
Figure 9 contains footage from the ÖBB track component video and shows the transition area in front of the turnout.
The track component video shows two possible causes for a rapid degradation of the ballast: (1) a change in sleeper geometry with a corresponding change in system stiffness (orange rectangle) and (2) an insulated rail joint with its associated welds (blue rectangles), for each rail. One of the welds is located directly at the transition zone from track sleepers to turnout sleepers. The condition of the insulated rail joint can be evaluated with the rail surface signal.
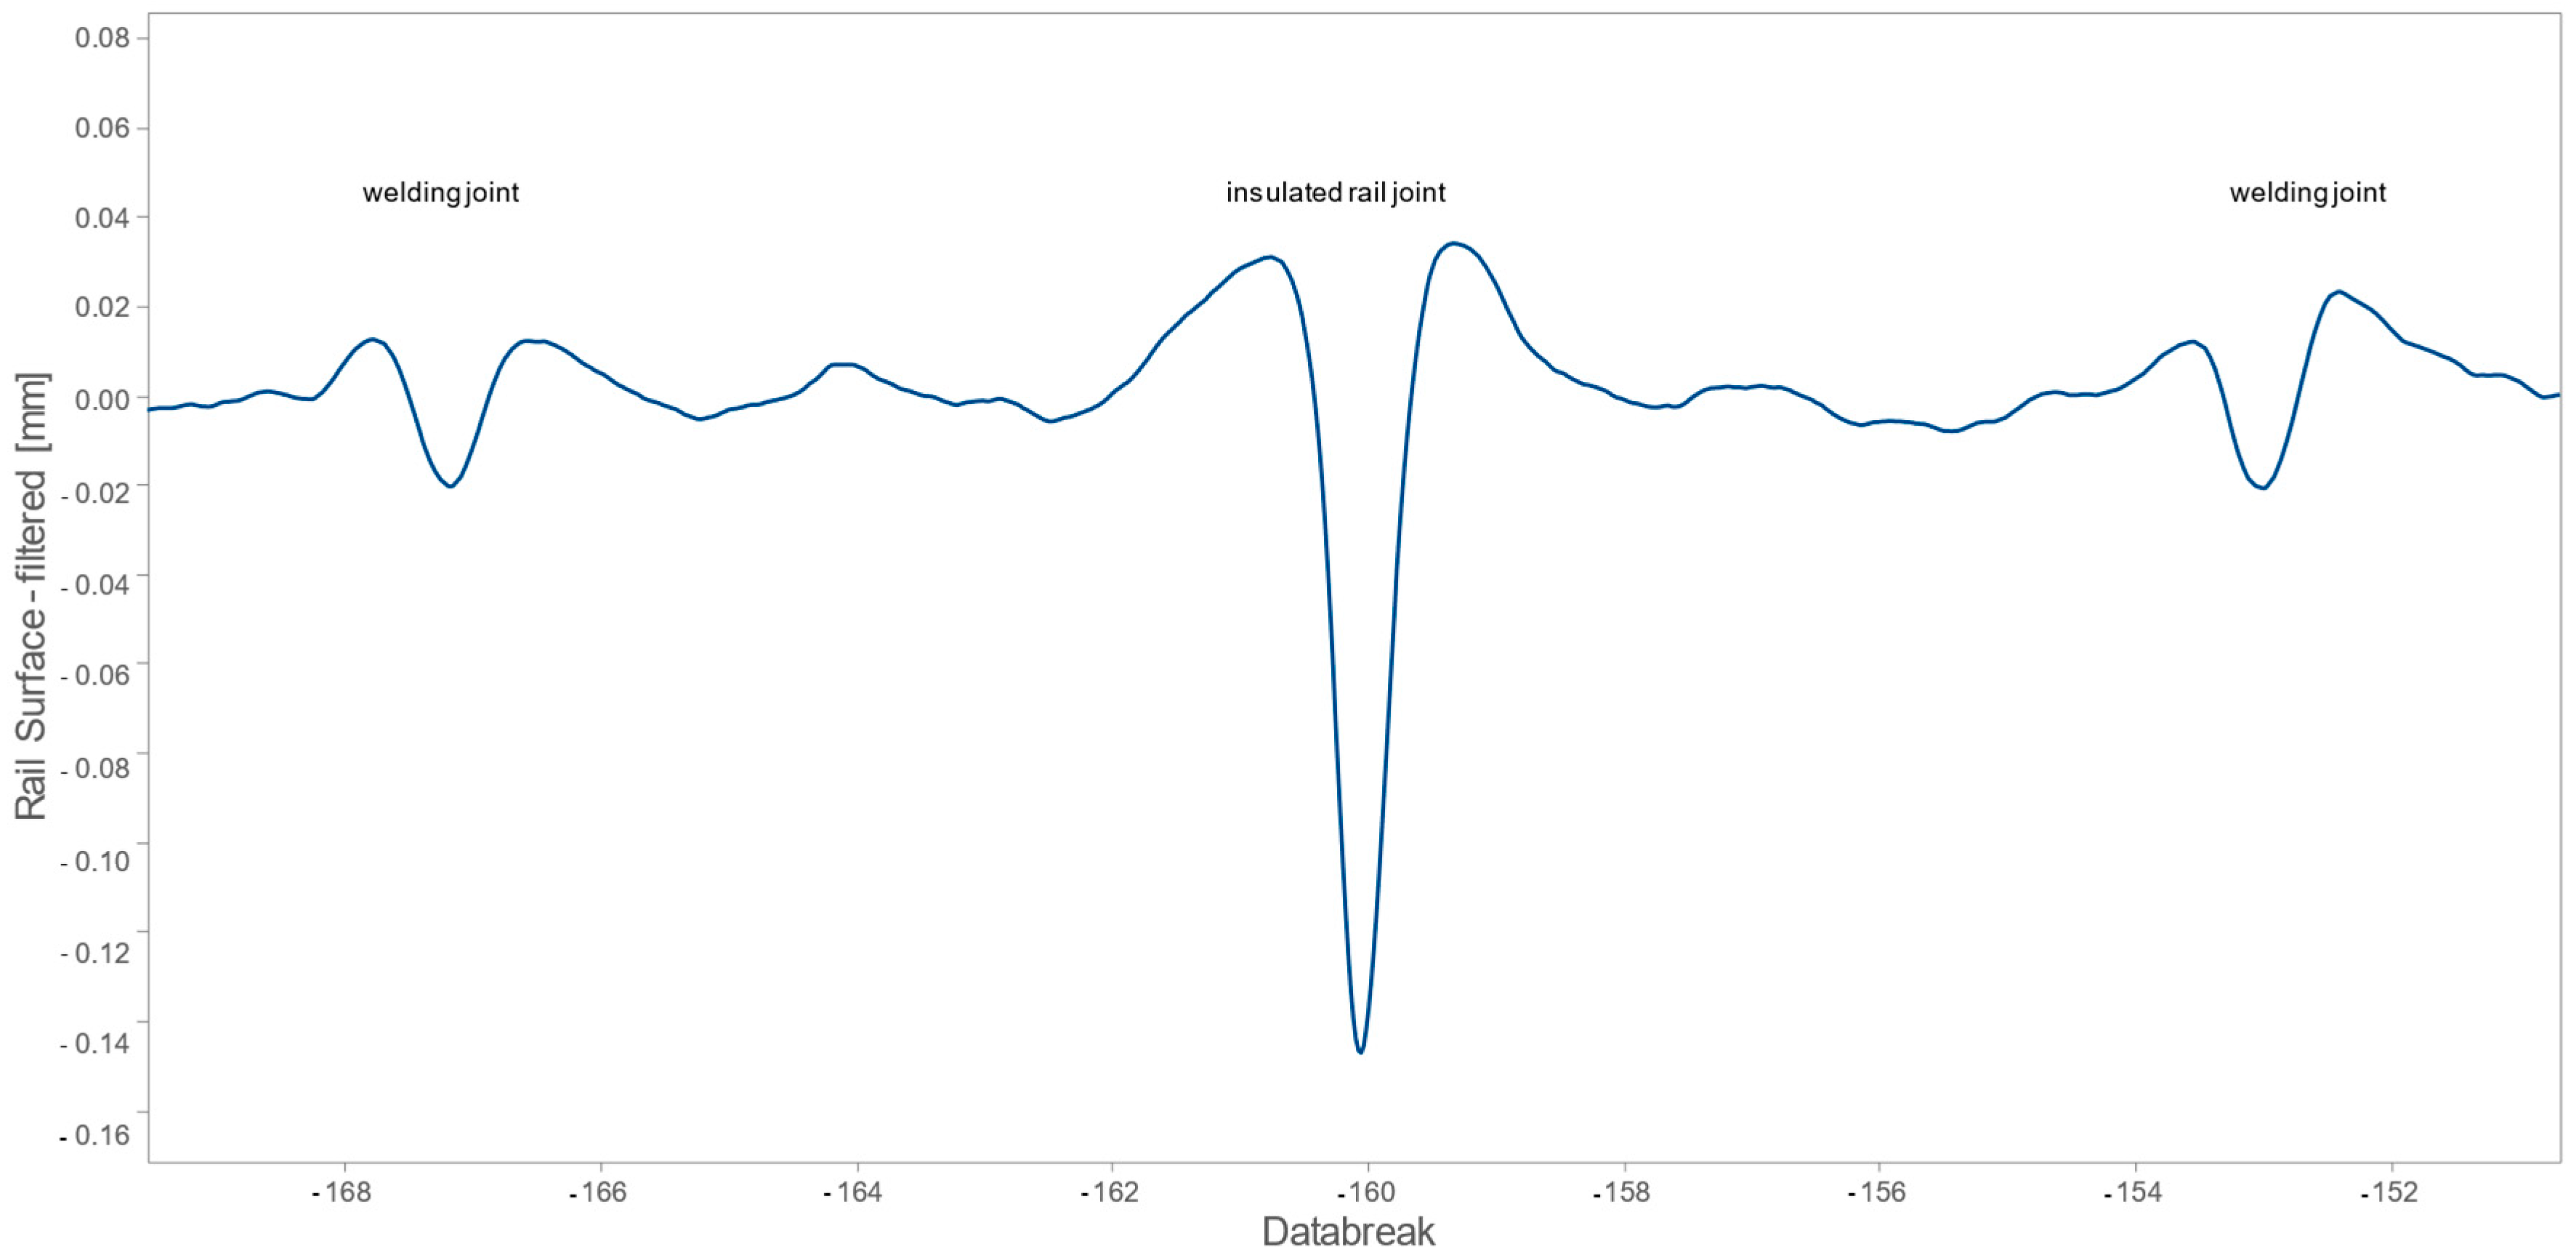
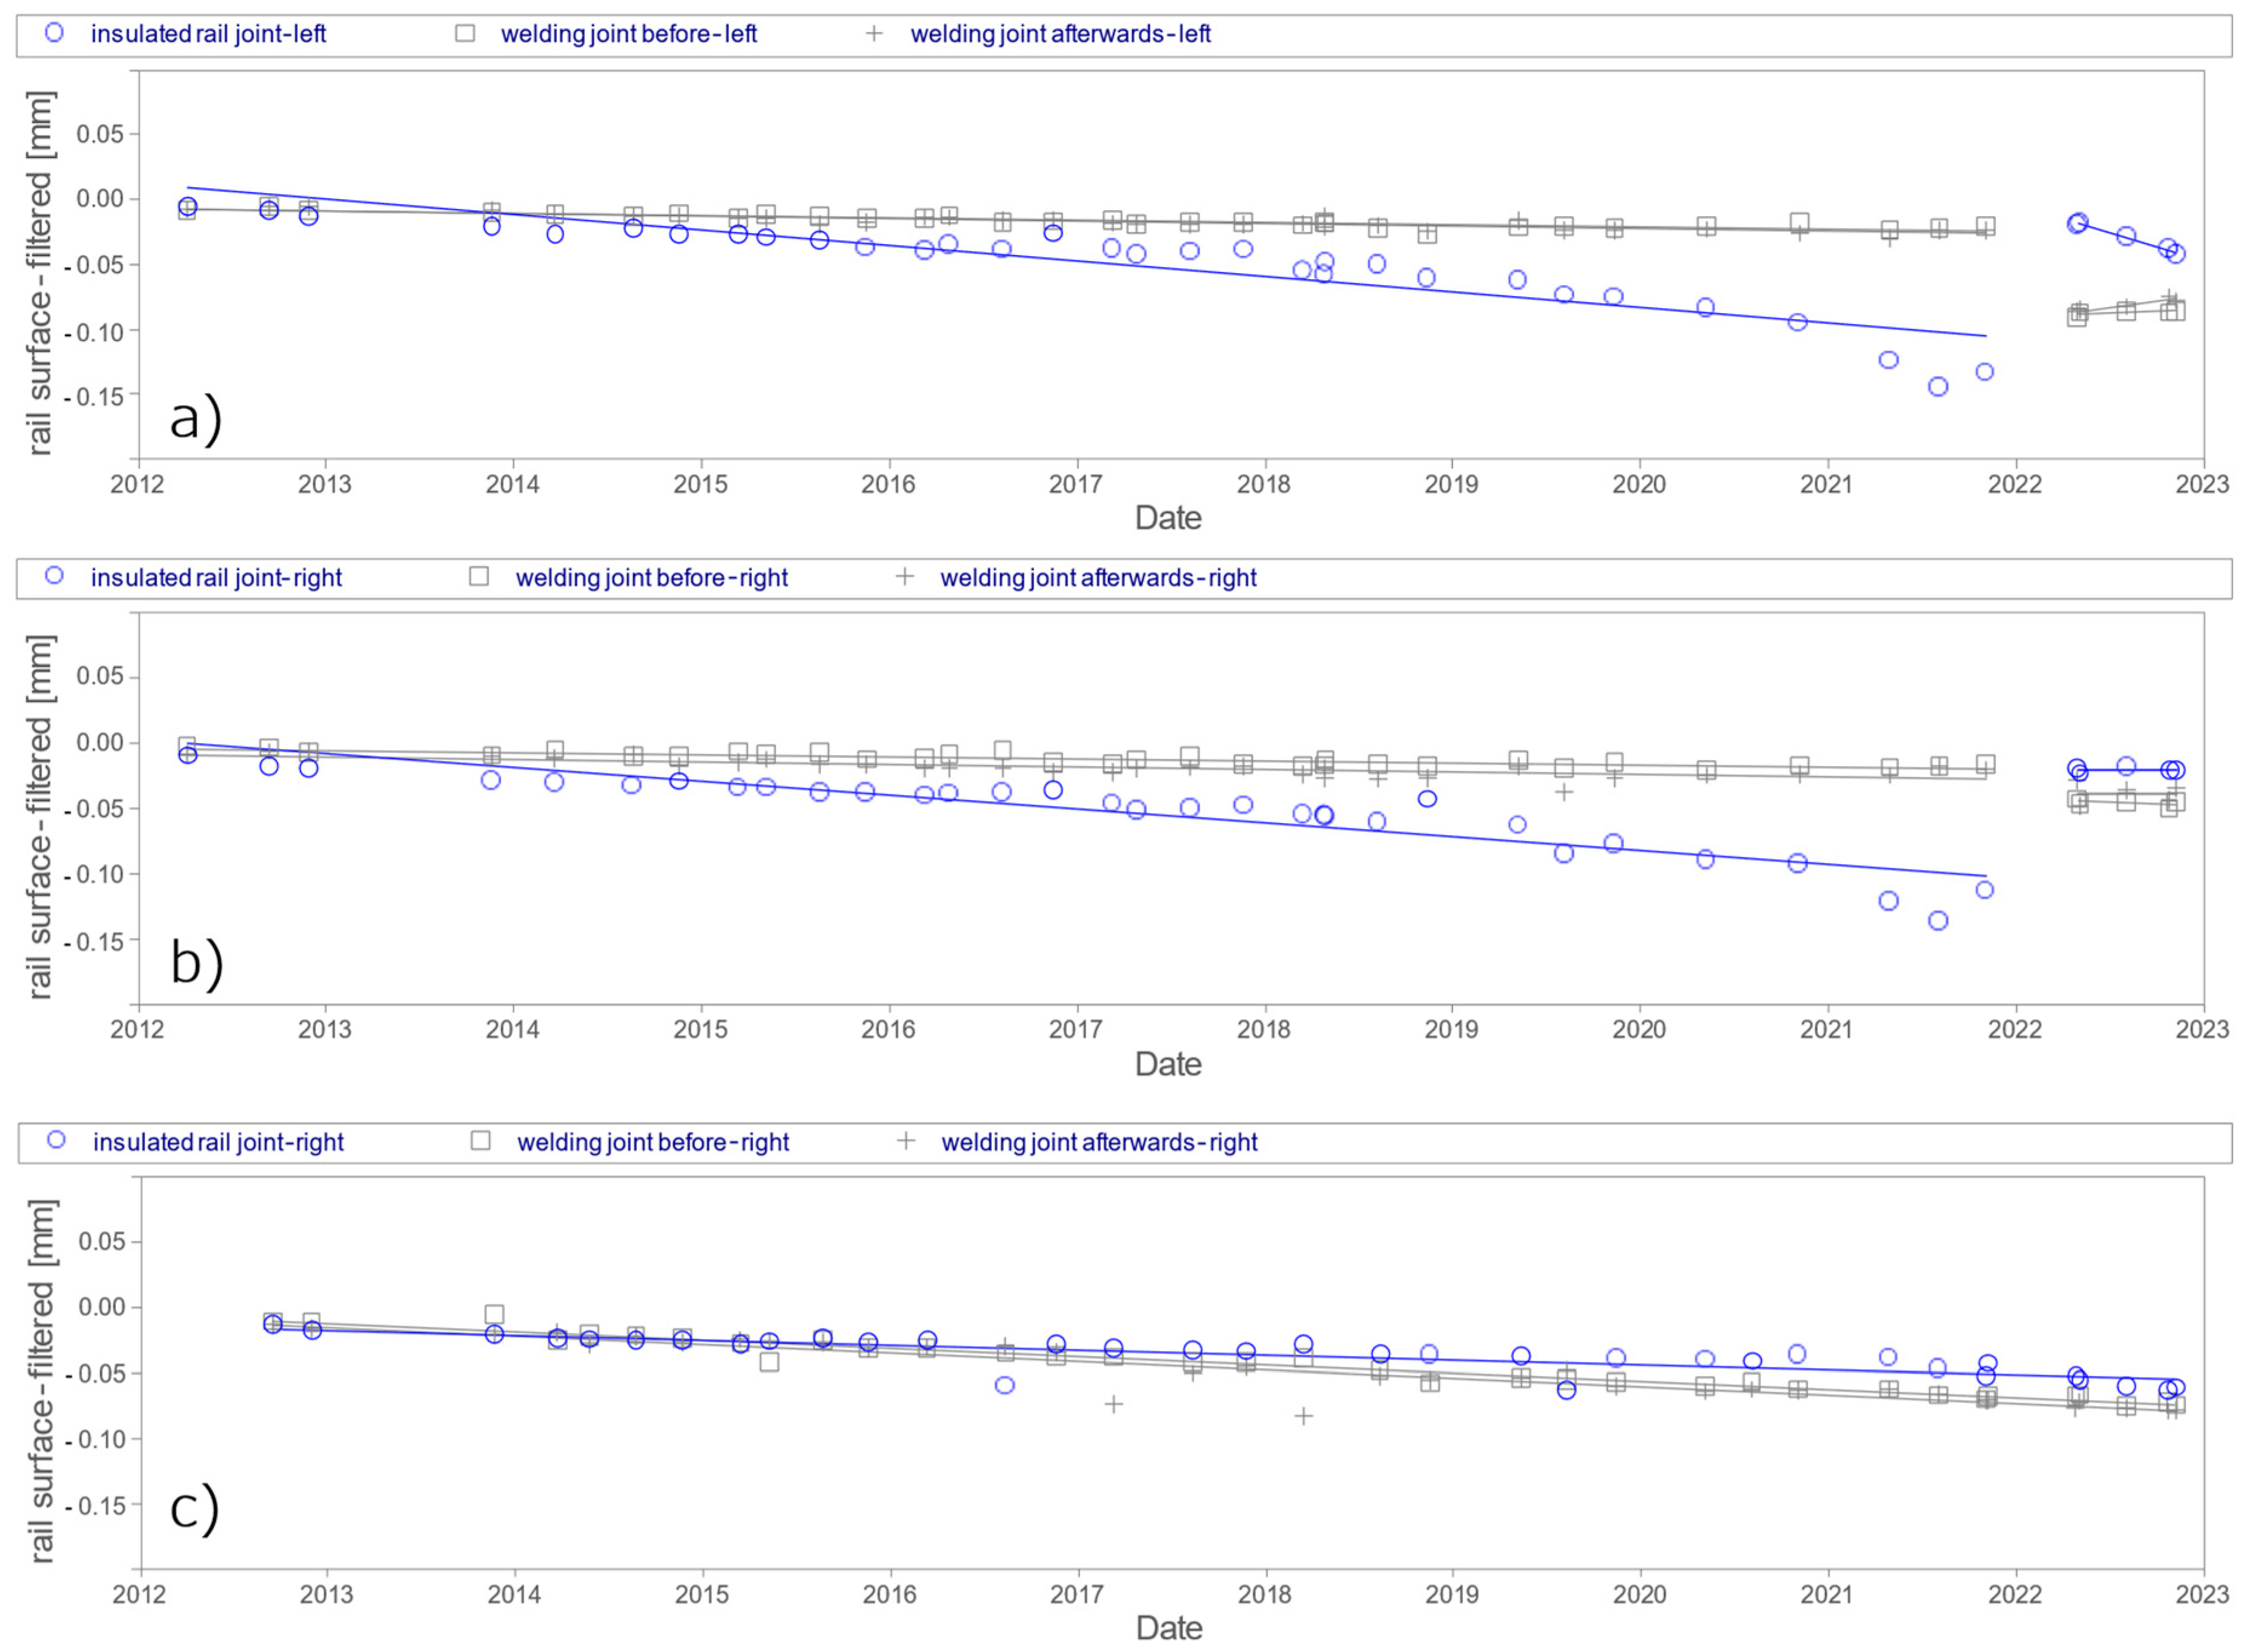
Figure 10 shows the typical characteristics of the filtered rail surface signal of an insulated rail joint and the welding joints of one measurement run. In this case, the insulated rail joint is already well worn.
In addition to the insulated rail joints in T_R4F_21, there is a comparable insulated rail joint available at turnout T_R4F_25. The boundary conditions are the same, except that in this case the insulated rail joint is located directly above the gap where the sleeper shape changes. To evaluate how these insulated rail joints and the weldings behave over time, a time series needs to be created. Therefore, the minimum of the rail surface signal from every measurement run is taken and plotted in a graph over time. The outcome is shown in
Figure 11.
When looking at the time series, it can be seen that in 2022 the insulated rail joints at T_R4F_21 were exchanged, which led to a jump in the trend. It can also be noted that the insulated rail joints at T_R4F_21 behave worse (
Figure 11a,b) than at T_R4F_25 (
Figure 11c). This is verifiable using the gradient of the linear regression, which is considered as the deterioration rate of the joints.
Table 2 includes these rates for the period before and after the exchange of the joints at T_R4F_21.
In the period before the exchange, the rates are about 3 times as high for the insulated rail joints at T_R4F_21 as for those at T_R4F_25. Furthermore, after the exchange, the right joint of the first turnout has virtually no deterioration, while the rate of the left joint is nearly 4 times as high as before. Why the left insulated rail joint behaves in this way is not clear from the data available. But it can be said that it will soon lead to necessary maintenance works or even to another exchange of the joint.
In addition, it is noticeable in the time series of
Figure 11a,b that the welding joints are in a worse condition after the exchange. This poor condition probably derives from welding work itself. By looking at the welding joints in
Figure 9, grinding marks on the rails above the welding joints are visible. They most likely result from grinding by hand, which left the rail surface in bad condition.
The detailed evaluation of T_R4F_21 shows that a combination of a worn insulated rail joint and the jump in stiffness due to the change in superstructure is responsible for the high deterioration of the ballast bed and the poor performance of the turnout. Similar evaluations were carried out for the other turnouts in order to compare them in terms of overall quality performance, critical spots and maintenance recommendations.
4. Discussion and Outlook
The tools developed prove to be useful for classifying the quality behaviour of turnouts and point out critical spots. Of course, the ranking depends on the underlying criteria. Is it the safety criticality of a problem or the cost of fixing the particular problem? Should the focus be on the current state, or are factors that have a negative impact on future behaviour of higher importance? These questions are up to the user of the toolbox, the infrastructure manager. In Austria, discussions on the introduction of these tools are ongoing, as the positive effect only occurs when track workers use these tools in their daily work. Decision-making can be simplified in this way, but decisions still have to be made by experts. The three research objectives stated in the introduction can be answered positively. The tools provided are suitable for comparing the quality behaviour of turnouts. For the turnouts investigated, causes for poor quality behaviour could be defined, and recommendations for measures could be given. For turnouts where this is not the case, in-depth theoretical and experimental research is recommended.
The missing steps of our research are threefold. (1) Evaluation tools for sleepers, frogs, substructures and switching devices need to be developed. We are currently working on this. (2) Additional considerations need to be made for turnouts with relevant traffic on the diverging branch, as the tools developed here are based on measurements from the thoroughgoing track. The tools are also not validated for more complicated switch designs, as these are only a minority in the network. (3) The developed tools need to be used for predicting future quality behaviour. Doing this will increase the level of automation of maintenance planning.


 ,
, 


