Article

Modelling the Interaction of Illuminations with a Sensor Matrix Used in Vision Systems

Faculty of Mechanical Engineering and Robotics, AGH University of Krakow, al. Mickiewicza 30, 30-059 Kraków, Poland
*
Author to whom correspondence should be addressed.
Appl. Sci. 2023, 13(19), 10641; https://doi.org/10.3390/app131910641
Submission received: 23 June 2023 / Revised: 18 September 2023 / Accepted: 22 September 2023 / Published: 25 September 2023

Abstract

:
The article discusses a method of modelling the interaction of industrial illuminators with sensor arrays used in industrial vision systems cameras. The research used a model containing a light source and a sensor matrix. As part of the research, the average intensity of electromagnetic radiation in the visible range on the surface of the sensor matrix was measured, as well as its analysis and interpretation using a model of illuminators. The light source is described based on the measurement of an authentic industrial illuminator, for which a photometric solid was determined using a photogoniometer and spectral irradiance with a spectroradiometer. A theoretical model of the matrix was prepared, enabling the selection and control of the parameters of its work. As part of the conducted research, the impact of changing the lighting model parameters, such as the photometric solid, spectral irradiance, and number of rays, and the effect of changing the matrix parameters, such as the dimensions, number of pixels, on the irradiance measurement, were checked. The results of simulation tests are presented for selected sets of models of the light source and for the model of sensors’ matrix. The summary presents the impact of changes in parameters adopted for models on the simulation results.

1. Introduction

The development of lighting techniques can be dated as early as 300,000 years ago, at the time of the discovery of fire by prehistoric people, who served as a source of heat and light. Bonfires, torches, the first tallow, and oil lamps made it possible to live in caves and create the first wall paintings, i.e., the first paintings. The first drawings painted in caves had to be made using artificial lighting. The development of lighting technology made it possible to build the first lighthouses and lamps installed on the streets. A wide range of light sources with different spectral characteristics and purposes is available. The selection of illuminators for a specific control or measurement task is carried out based on the analysis of the spectral characteristics of the illuminator and the study of its operating parameters.
Vision systems used in industrial applications use various types of illuminators selected for specific control or measurement tasks [1,2]. The basis of imaging is the registration of electromagnetic radiation in a selected spectral range on the sensor matrix. On this basis, a description of the scene in the form of a picture is created. The illuminator’s design and its operation’s spectral range have the most significant impact on the parameters of the recorded image [3,4]. However, it is also necessary to take into account the way the lighting interacts with the surface of the imaged object. The spectral range of electromagnetic radiation reaching the sensors built on the matrix from the illuminator is also influenced by the parameters of the lens. Equally important are the filters placed on the lens and filters applied directly to the sensor matrix. Significant disturbances in industrial conditions are introduced by unstable lighting of production halls and changes in solar lighting reaching the production stations. In addition, in the optical path between the illuminator, the illuminated object, and the sensor matrix, interference in the form of water vapour or vapours of various chemical compounds may occur in industrial conditions.
Measurements with vision systems carried out in laboratory conditions eliminate most disturbances [5]. However, in industrial settings, the interaction of lighting with the geometric structure of the surface is of great importance in surface imaging tasks. It has been shown that in industrial conditions, there is not only one type of interaction [6]. The most common combination of interactions between a light and a surface depends on the surface condition, which changes the radiation image recorded on the sensor matrix. For example, measurements of the parameters of the geometrical structure of the surface in terms of surface defects and surface roughness require an individual approach, which must consider the type of material and the conditions for the measurement. For example, measurements of the parameters of materials produced by selective laser sintering required the selection of the kind of lighting and a specialized optical path for the imaging method [7]. The choice of the type of illuminator is a crucial task from the point of view of industrial imaging. It is the task of the illuminator to indicate and strengthen the feature of the examined object in such a way that it is visible in the recorded image. The selection of the light source, the choice of the illuminator structure, the selection of the frequency of the illuminator, and the selection of the spectral range of the illuminator’s operation determine the success of the imaging process. The quality of the recorded image determines the possibility of using it in measurement and control tasks. It should be noted, however, that the illuminator parameters must be selected for a specific measurement task, taking into account the specific operating parameters of the vision system. The selection of industrial lighting should also consider the change in the working conditions of operators working on the production line. Issues related to the influence of electromagnetic radiation with given parameters on the speed of human reaction are described in the paper [8]. The article discusses the impact of parameters such as colour rendering index (CRI) and colour temperature (CCT) on human reaction speed. It also presents graphs of the electromagnetic radiation spectrum with different colour temperatures (CCT) and colour rendering factors (CRI).
The most popular device used for measuring spectral irradiance and reflectance is a spectroradiometer [9]. In this paper, it was used to measure the spectrum of electromagnetic radiation of an industrial illuminator ring light type. The spectroradiometer, in its built form, contains a CCD matrix (charge-coupled device). The CCD matrix is used for measurement of irradiance of each wavelength [10,11,12]. Electromagnetic radiation in the form of photons of a certain wavelength is incident on the matrix. This is possible because of the use of a concave–holographic diffraction grating or a system of mirrors and a diffraction grating. There are different constructions of spectroradiometers. The electromagnetic radiation responds to given pixels on the matrix of sensors separated by each wavelength. It is sensitive to the measurement irradiance of each wavelength of electromagnetic radiation.
In this work, an attempt was made to make a model of an industrial illuminator and a model of a sensor matrix in order to conduct preliminary research work and select the parameters of both elements for the implementation of measurement tasks. A model was adopted in which the ring illuminator emits radiation directly in the direction of the sensor matrix without the presence of a lens and additional interference in the optical path. For the model adopted in this way, simulation measurements of irradiance were made on the matrix model. The irradiance intensity at a given surface point was determined, which is the quotient of the electromagnetic radiation power and the surface area surrounding this point. The model was simplified to the light medium, which was given the parameters of the measured photometric solid and the spectrum of electromagnetic radiation.
The article presents the results of simulation studies and average irradiance and irradiance at a point on the sensor matrix as well as their analysis and interpretation. For research purposes, a virtual model of the workstation was made in dedicated software. The test stand consisted of a light source and a sensor matrix distant from it by a given distance. The sensor matrix model receives electromagnetic radiation falling on it, enabling the determination of the average irradiance of radiation falling on it. The tests were carried out for equal operating parameters of the illuminator model and selected parameters of the sensor matrix.
The research and simulations presented in the paper aim to develop a primary method of selecting the illuminator’s operating parameters and the sensor matrix’s type and parameters. This method can be used as the first step in designing vision systems to verify the assumptions made for the system. The work uses Ansys software to model optical and lighting systems. It uses a built-in module based on the Monte Carlo method to simulate electromagnetic radiation distribution. The work also uses illuminator measurements made with a goniophotometer. These measurements made it possible to enter the actual parameters of the illuminator into the simulation model. In addition, in the second chapter, research was performed and described using a spectroradiometer using the proprietary method in the photometric darkroom.
Section 2 describes the method of making measurements using a goniophotometer and spectroradiometer. The measurements were made in the dark room. The goniophotometer enables measurement of the intensity of lighting radiation and electromagnetic radiation in the visible range to obtain a photometric solid. The spectroradiometer, on the other hand, made it possible to perform spectral irradiance tests.
Section 3 presents the results of both experimental and simulation studies. The obtained photometric solid and the spectrum of electromagnetic radiation are shown here. The results of the simulation tests show a comparison of the results for the simulation during which 2 × 10⁵ and 2 × 10⁹ numbers of rays registered on the sensor matrix were generated. Section 4 summarizes the research results obtained.

2. Materials and Methods

2.1. Description of the Measuring Station

The research began with measurements made for the Ring Light industrial illuminator Ring Light type VLR-10RK0211 of SICK company. This ring construction is shown in the first figure. The LEDs of the illuminator are installed ring wise around the hole intended for mounting the lens. The optical axis of each diode is set parallel to the axis of the illuminator housing opening. The illuminance was measured as part of the research to determine the illuminator’s photometric body. Then, tests were carried out using a spectroradiometer to determine the spectrum of electromagnetic radiation emitted by the illuminator. The tested illuminator, according to the manufacturer’s data, CCS, emits radiation in the visible light range of white colour (Figure 1).
For the illuminator, a photometric solid was determined using a goniophotometer. The luxmeter used in measurement was SONOPAN L-400. The photometric body was measured using a goniophotometer under PN EN 13032-1. It is used to determine the luminosity of electromagnetic radiation in a system called C—gamma, used in work to carry out measurements [13]. During the measurements, the angle C between two closest half-planes was 15°, the difference between the two closest gamma angle was 2°, and the distance between the centre of light and the lux meter was 10 m (Figure 2).
The centre of the light is the point characterizing the light source. Most often, it is located at the intersection of the axis of symmetry of the output hole of a given source. Angle C is a double-sided angle between the output half-plane and a given half-plane. The output half-plane is referred to as the 0-half-plane. The angle by which we define it is the angle C0. The measure of angle C is determined depending on the number of half-planes. For example, for 25 half-planes (twice including the half-plane for the angle C = 0°, which is the same as the half-plane for the angle of 360°), the angle C between the half-planes is 15°. It is calculated from the following relationship: 360°/(n – 1). The letter n denotes the half-planes, which for the tests performed in work is 25.
The gamma angle is a plane angle lying on each half-plane. It is determined between the semi-straight line being the optical axis of a given illuminator with a beginning in the centre of illumination of the illuminator and a semi-straight line with a start in the centre of illuminators in any direction while maintaining a constant gamma angle. The gamma angle is between 0° and 180°.
It should be noted that the goniophotometer measurement is performed in the darkroom with fixed measurement parameters, such as the temperature of 25+/−1 °C and airflow velocity of 0.2 m/s. A photometric darkroom is a large room painted in black. Black absorbs radiation and ensures that light does not reach the meter from other directions. A goniometer and a lux meter are in the photometric darkroom at a given distance between the devices. The luminaire is mounted on the goniometer holder, which allows rotation by angle C and gamma angle and moves the luminaire. The illuminance with subsequent points of space around the industrial illuminator is measured using a lux meter. Then, using the law of the inverse of the square of the distance, the luminous intensity of a given measuring point is calculated. A detailed description discussing the use of the law of the inverse of the square of the distance in measurements is discussed in the work of Voudoukis [14].
Using a lux meter and goniometer measurement allows you to measure the illuminance E in a given direction at a photometer distance. The measurement data of each measuring point are saved to a file. Then, according to the law of the inverse of the square of the distance according to the formula (2), the luminous intensity is calculated and saved to a file with the extension: .ldt or .ies. The .ldt or .ies file also contain data such as the number of half-planes, gamma angles, the luminous flux, the half-angle of the light distribution, and so on.
Determination of illuminance using the law of the inverse of the square:
E = I R 2
where E—illuminance, I—luminous intensity in a given direction, and R—distance of the illuminators centre from the measuring head of the lux meter.
Based on Formula (1), by transforming it we get a procedure that allows us to calculate the luminosity. At the same time, the illuminance is obtained from measurements The distance R is the distance between the centre of light and the measuring head of the lux meter.
I = E · R 2
where E—illuminance, I—luminous intensity in a given direction, and R—distance of the illuminators centre from the measuring head of the lux meter.
Files of the type .ies or .ldt can be opened using the following software: QLumEdit, Dialux, and Speos 2023 R1.
The difference between illuminance and irradiation is that the former refers to visible light. Irradiance intensity, on the other hand, refers to the entire measured spectrum. The unit of illuminance is lm/m2. The unit of irradiance is W/m2.
The spectrum of electromagnetic radiation was also determined for the tested illuminator using a spectroradiometer. The spectroradiometer was GL Optic 5.0 Touch. A spectroradiometer is a measuring device used for measurements of radiometric light sources. The parameter measured by the spectroradiometer is the spectrum of electromagnetic radiation. On this basis, software dedicated to a given spectroradiometer is determined by the number of parameters describing the light source.
The spectroradiometer measurement was performed according to its procedures in the photometric darkroom. The illuminator is mounted on the handle. A spectroradiometer detector is placed in the light axis at a distance of d = 500 mm (Figure 3). The diagram of the measuring station is shown in the second figure. During the measurement, the radiation intensity, colour temperature, and colour rendering index were determined and in dedicated software for the spectroradiometer, a spectral graph of the electromagnetic radiation power of the illuminator was obtained. Figure 4 shows the determined spectral plot of the power of electromagnetic radiation. As part of the research, the illuminator’s correlated colour temperature of the source of electromagnetic radiation CCT = 13,284 K (CCT—Correlated Colour Temperature) was also determined. The colour rendering index was CRI = 85 (CRI—Colour Rending Index). The optical axis and the centre of light are indicated in Figure 4 and these concepts are explained in Section 2.2.

2.2. Simulation Test Method

A diagram of the measuring station used to conduct simulation tests is presented in Figure 4.
In the first step, the light centre for the illuminator was defined. The centre of light is located in the illuminator’s geometric centre. In the case of the illuminator under test, this is the centre of the opening that is located in it. Diodes are placed around the hole in three rows.
The simulation model defined the luminous centre in such a way that a solid was made: a cylinder with a base diameter of 1 mm and a height of 1 mm. It was given the material properties available in the Speos 2023 R1 software and that the material was set as opaque. The parameter defining the reflection from the material from which the luminous centre is modelled is also set to 0%.
The sensor matrix was placed at a distance of d = 500 mm from the base of the cylinder (centre of light). The die was laid parallel to the base of the cylinder (Figure 5). The optical axis of the illuminator and the axis passing through the intersection of the axis of symmetry of the matrix coincided. In the Speos 2023 R1 software, it is possible to give parameters to model radiation. The surface-emitting radiation was the surface of the base of the cylinder. The radiation emitted by it was given features such as a photometric body and electromagnetic radiation spectrum, which were measured in experimental studies. The luminous flux of the illuminator tested experimentally was approximately 337 lm.
Simulation tests were carried out on a sensor matrix with dimensions of 24.576 × 24.576 mm, for two-pixel sizes, and with dimensions x and y: 12 × 12 μm and 24 × 24 μm. The number of pixels on the sensor matrix was 2048 × 2048 for a smaller pixel. However, the number of pixels on the sensor matrix was 1024 × 1024 for a larger pixel (Figure 6).
The tests were carried out for two groups of simulations, i.e., for the number of generated rays. The generated radius is a vector with a length corresponding to the distance between the sensor matrix (at a given point) and the centre of the light. Rays are emitted from the light centre. The generation of rays is carried out pseudorandomly: 2 × 10 5 ,   2 ×   10 9 .
The Speos 2022 R1 software allows you to perform simulations with various parameters. There are three main types of simulation studies, which are called direct simulation, inverse simulation, and interactive simulation. The “direct simulation” simulation allows you to perform tests in which the rays are emitted from the source of electromagnetic radiation and fall on the sensor matrix. The “direct simulation” simulation was chosen to perform the simulation. The “inverse simulation” simulation allows you to perform a simulation in which rays are propagated from a camera or sensor towards a light source. This is known as reverse simulation. The third possibility, i.e., interactive simulation, allows visualization of the behaviour of light rays in the optical system. The visualization consists of the fact that the beams and their direction are visible in terms of the direction the rays propagate after passing through, for example, a diffuser or other material.
The main assumption of this research Is to change the parameters of the sensor matrix to gain knowledge about how the average irradiance of electromagnetic radiation falling on the sensor matrix will change. We chose a simulation method called direct simulation. The described simulation method involves such elements as the source of electromagnetic radiation, the irradiance sensor, and the light centre [15,16]. Each of the above simulations are based on the Monte Carlo algorithm. The Monte Carlo method is commonly used in software to generate and analyse electromagnetic radiation [17,18,19,20].
This is one of the best methods known so far for this type of calculation. How many rays we should generate to get the correct results may seem problematic. According to the literature, the number of rays emitted by the source should be increased to minimize the signal-to-noise ratio on the detector at a given resolution [19]. A typical number of rays is in the range from 10 5 to 10 8 . The authors of the paper checked the parameters for the number of rays   2 × 10 5   and 2 × 10 9 . Programs that use the Monte Carlo method to trace rays are used for complex optical analysis problems. The entire optomechanical system must be taken into account. In the article, however, the authors focused on a simplified model to show the problem’s essence. The value of the average irradiance of the entire sensor matrix depends firstly on the number of generated rays of the light source. Also, the value of the measured average irradiance of the sensor array changes for the same number of light source rays depending on the pixel size. It should be noted that simplifying the model and limiting it to only the light source and sensor allows you to avoid such phenomena as, for example, the deflection of rays at the edges. It is true that the Monte Carlo method works well in such systems. Nevertheless, it was decided that the best solution would be to check the model in which the light beam falls directly on the sensor matrix.
The “planar” method, available in the Speos 2023 R1 software, was used to calculate irradiance. It differs from the standard calculation of irradiance in that, in addition, the cosine of the angle between the normal to the surface and the incident radius to the surface appears in the formula. The formula for irradiance using the “planar” method and its graphic interpretation are given below.
E = I · c o s ( α ) R 2
where E—illuminance, I—luminous intensity in a given direction, R—distance of the centre of light from the measuring head of the lux meter, and a—angle between the normal to the surface and the radius incident to the surface (Figure 7).

3. Results

3.1. Experimental Results

The experimental tests were carried out according to the procedures described in Section 2.1. The results of experimental studies are presented below. Namely, the obtained photometric solid shown in Figure 8 and the spectrum of electromagnetic radiation shown in Figure 9. Figure 8 shows a cross-section of the industrial illuminator used in the research. The light centre of the illuminator is also marked. The figure shows a photometric solid generated in the Speos 2023 R1 software. A maximum luminous intensity of approximately 1000 cd/1000 lm was also determined.
Figure 9 shows the spectrum of electromagnetic radiation measured with a spectroradiometer. This is the spectrum of radiation characteristic of a cold white diode. For this reason, the highest intensity is visible in the wavelength region of about 460 nm, which corresponds to the colour blue.

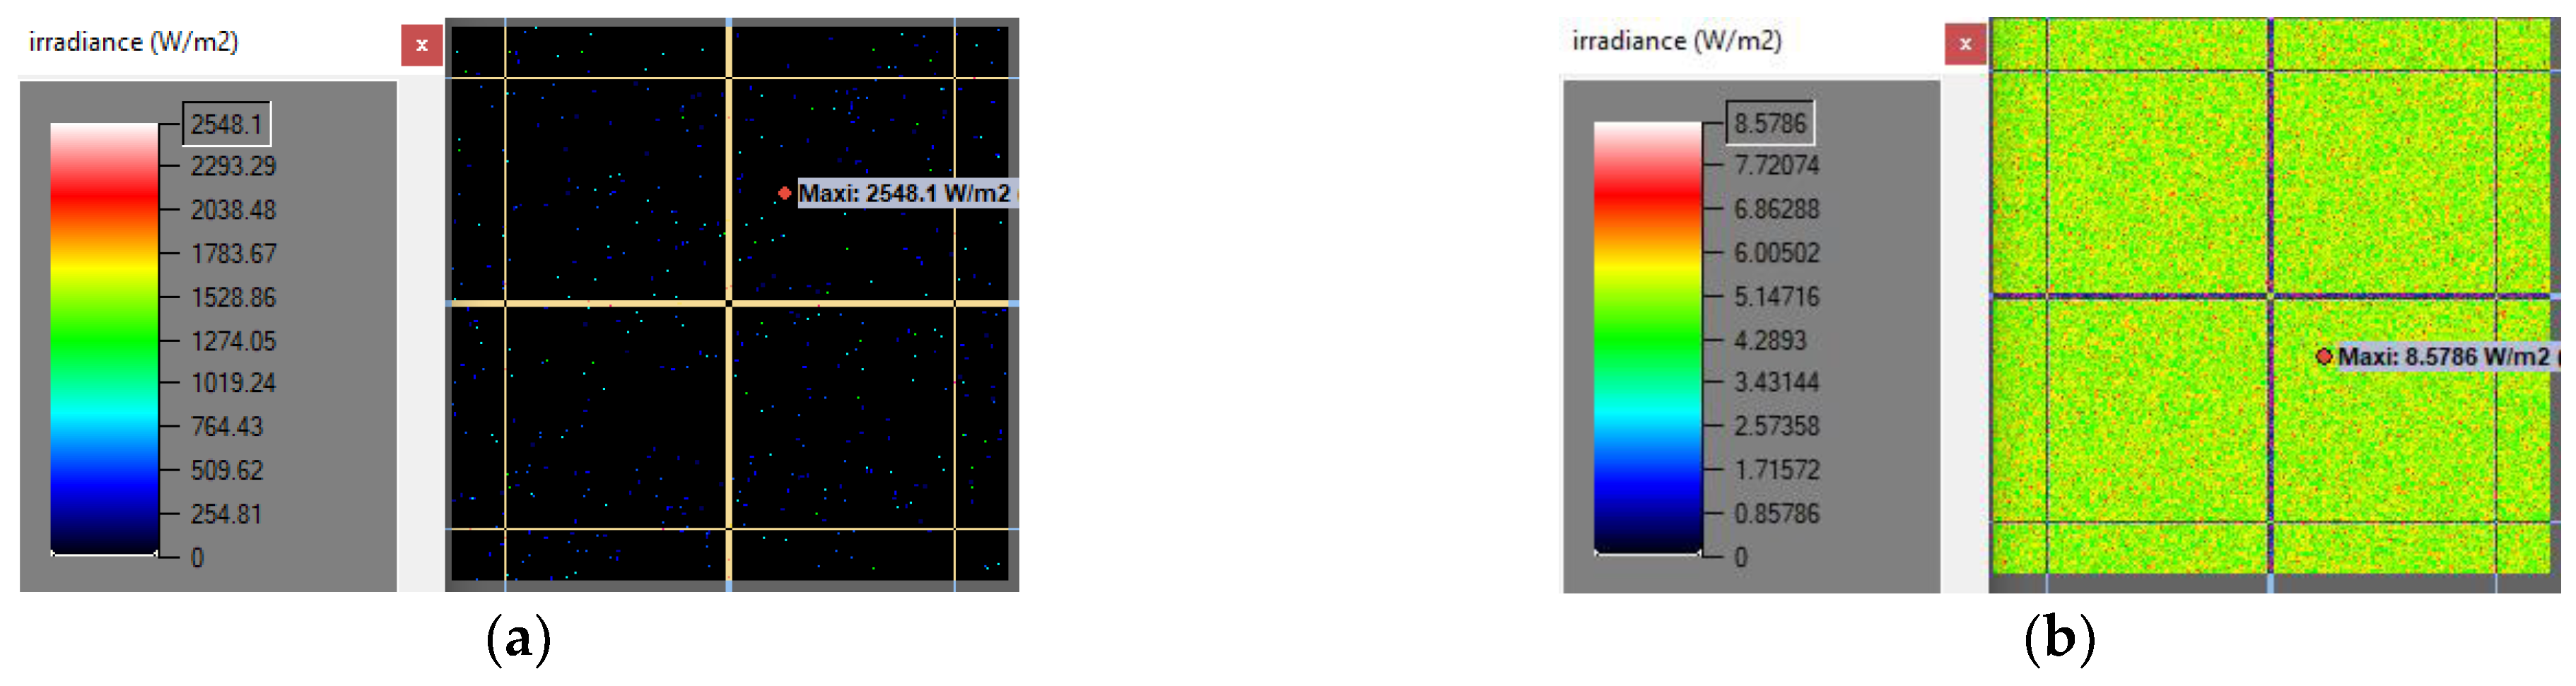
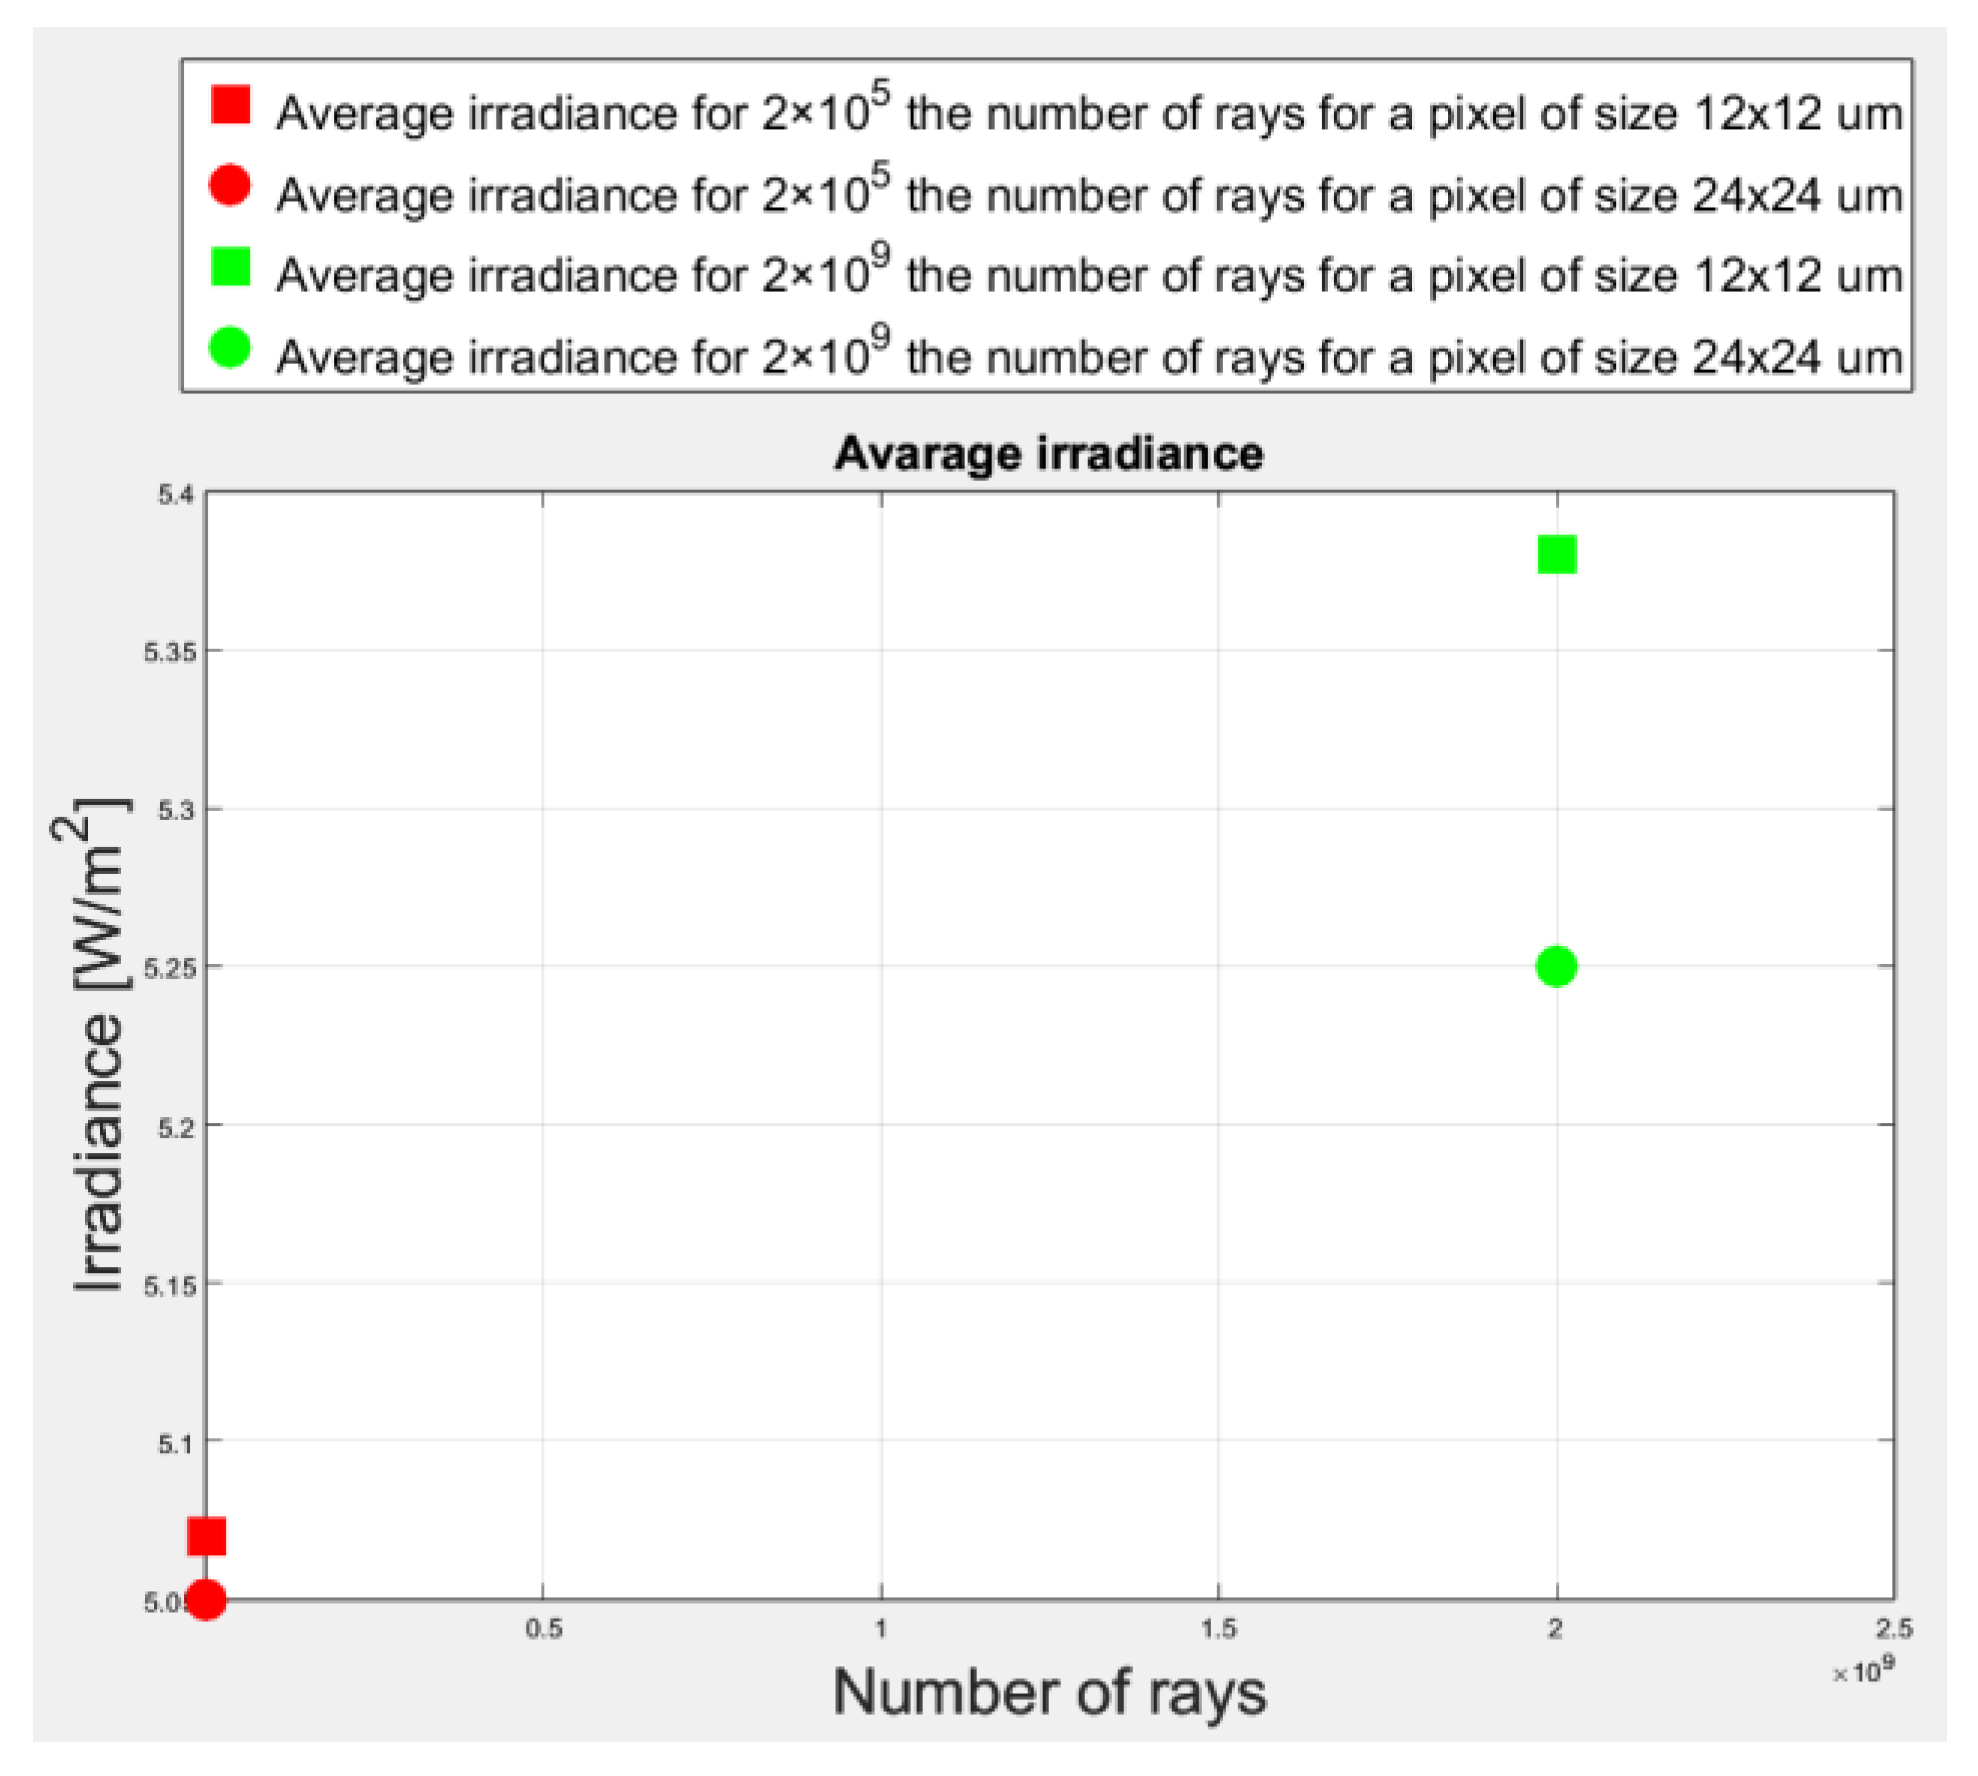
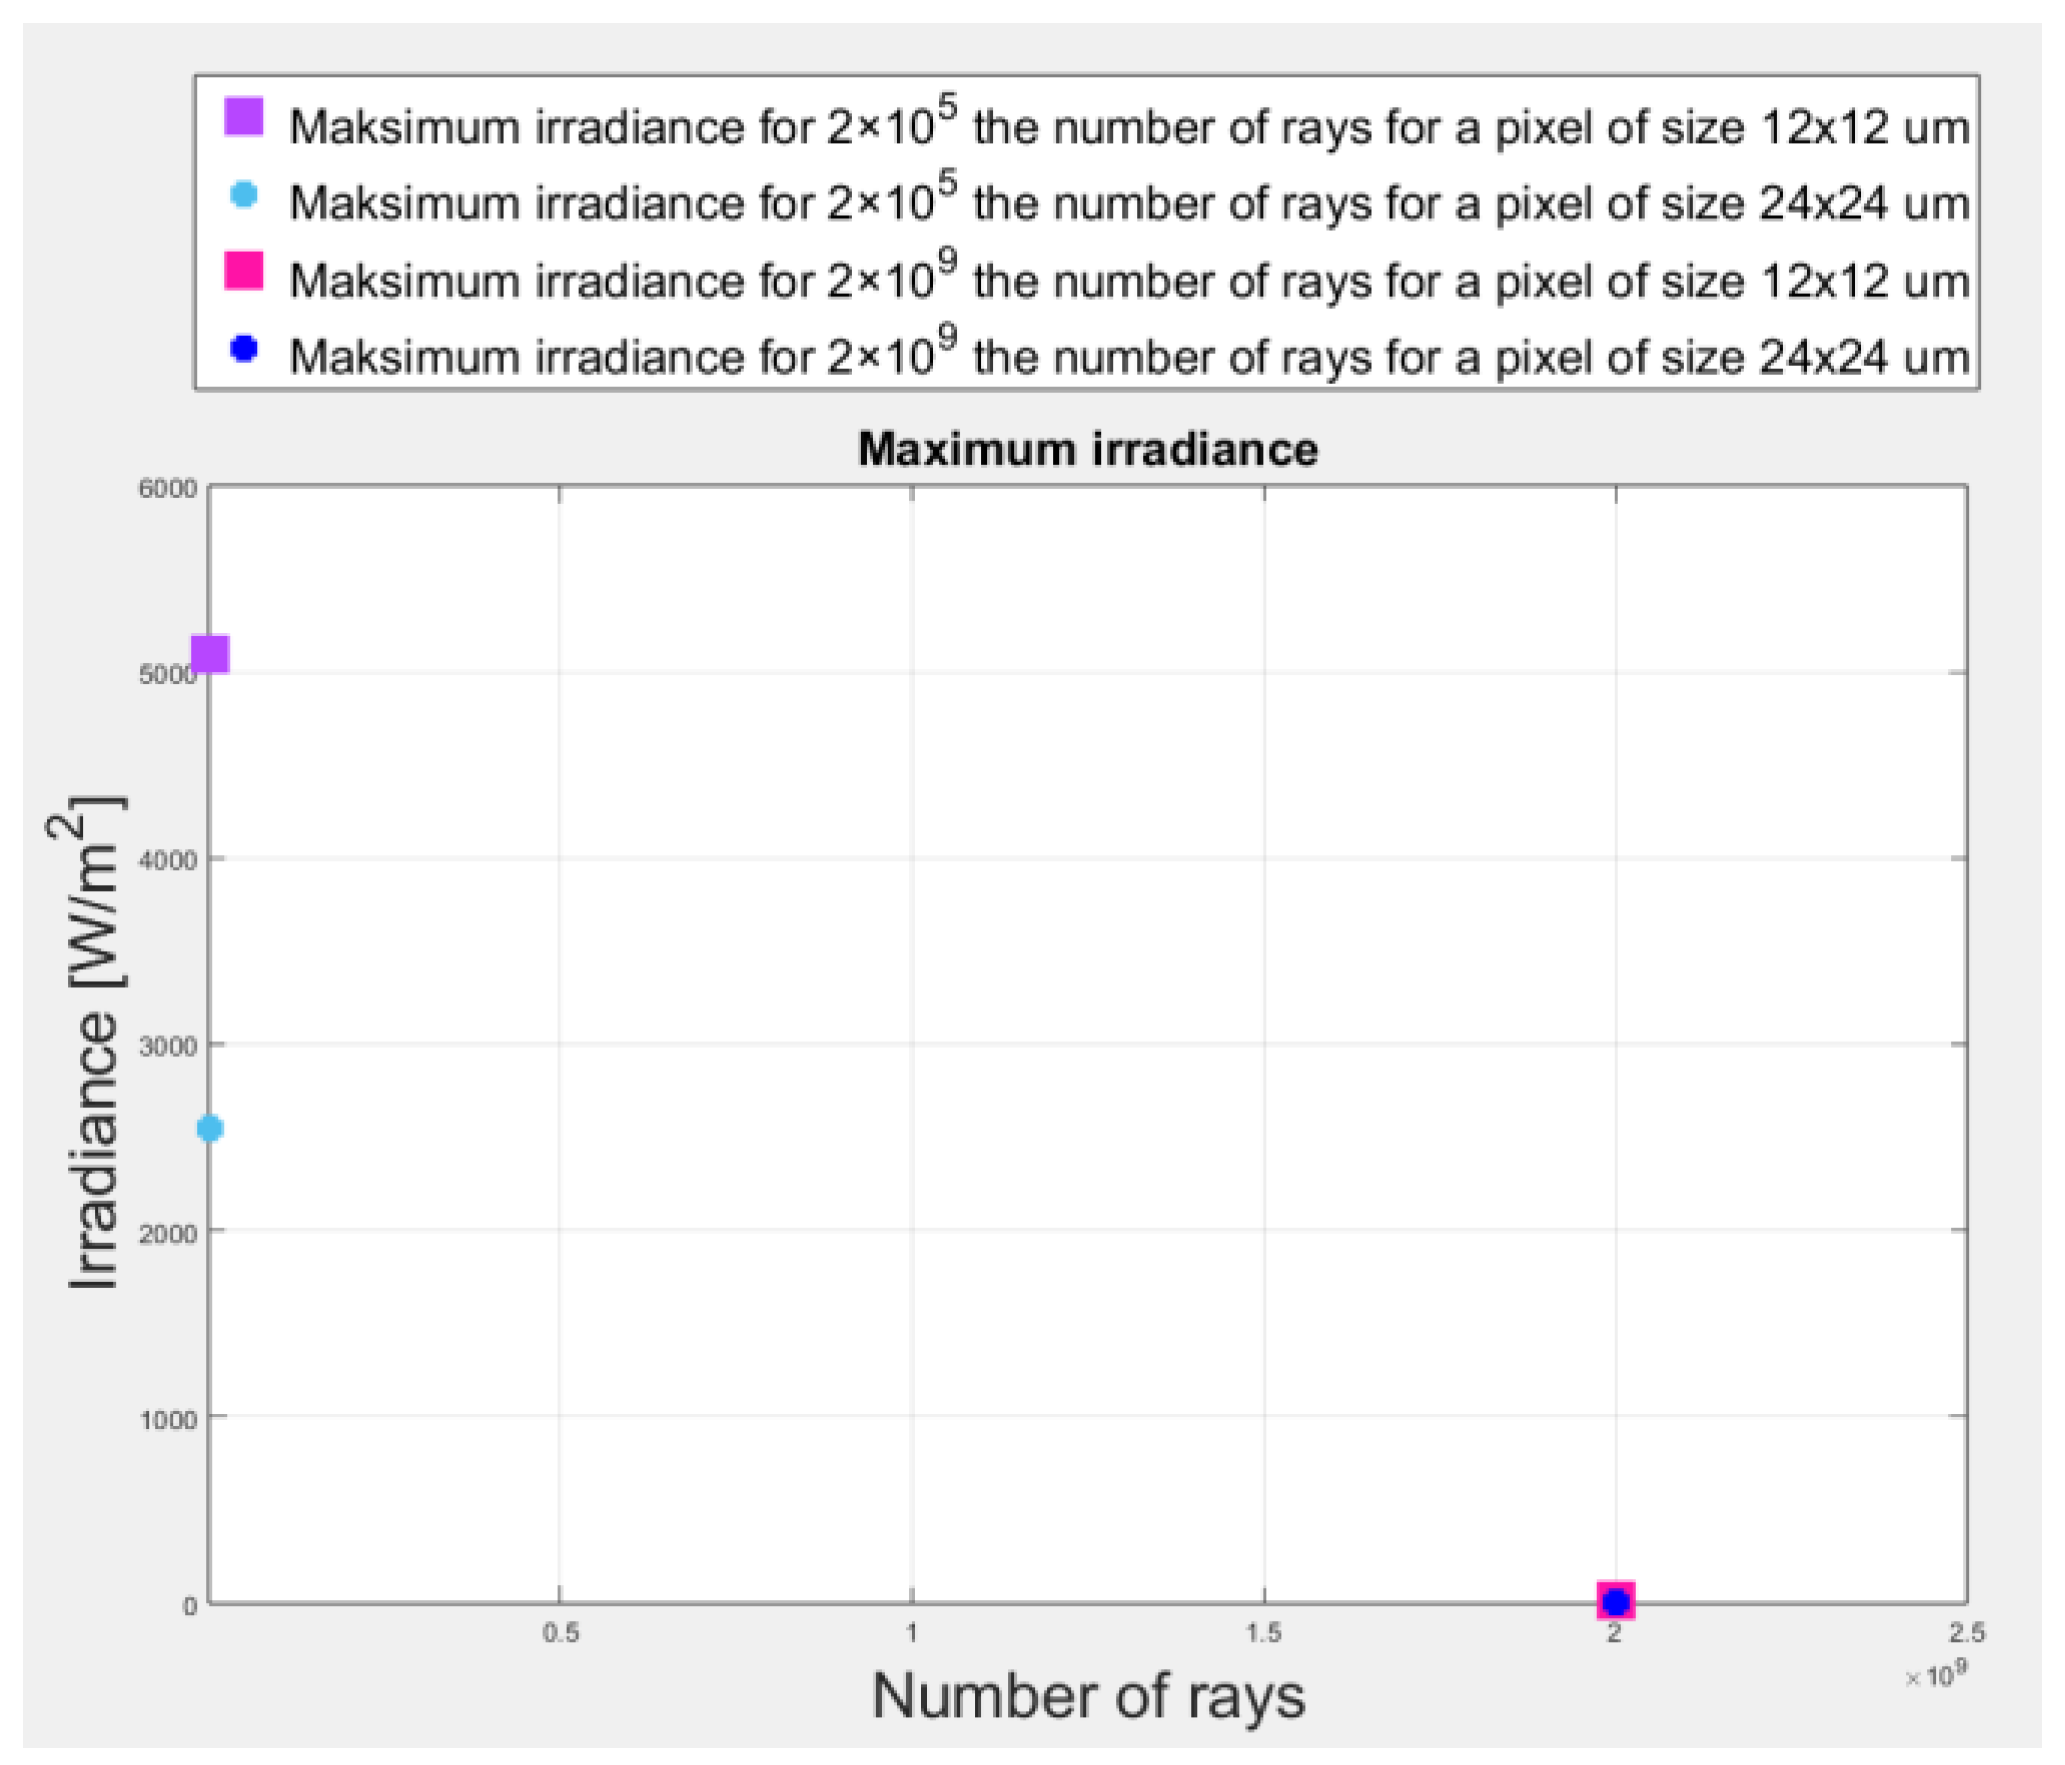
3.2. Simulation Results

Simulation tests were carried out for two groups of simulations, i.e., for the number of rays generated according to the description of the tests presented in Section 2.2. The size of the pixels on the sensor matrix also changed. The matrix had dimensions of 24.576 × 24.576 mm. The size of one pixel is 12 × 12 μm and 24 × 24 mm. Data are approximate to two decimal places (Table 1).
The table above shows that the average irradiance does not depend on the number of generated rays because the difference between the values for a different number of rays is not significant. Figure 10 presents the results of simulation tests showing sensor arrays on which irradiance values at points were recorded. The drawings also show a coloured scale. Each colour is assigned an irradiance value. The maximum value is listed. It is noticeable that with the increase in the number of rays, the maximum value recorded on the matrix at the point decreases. The uniformity of colours is also visible, which corresponds to a more even distribution of irradiance registered on the sensor matrix.
Test results for the sensor on which there were pixels of 24 × 24 μm. In this case as well, it can be seen from Table 2 above that the value of the average irradiance does not depend on the number of rays generated in the simulation. The difference between the values for 2 × 10⁵ and 2 × 10⁹ average irradiance is not significant.
Figure 11 presents the results of simulation tests showing sensor arrays on which irradiance values at points were recorded. The drawings also show a coloured scale. Each colour is assigned an irradiance value. The maximum value is listed. It is noticeable that with the increase in the number of rays, the maximum value recorded on the matrix at the point decreases. The uniformity of colours is also visible, which corresponds to a more even distribution of irradiance registered on the sensor matrix.
Figure 12 and Figure 13 are graphs of data, which are shown in Table 1 and Table 2. There are two plots of average irradiance and maximum irradiance. On graph 12, the results of average irradiance are shown. The big difference between values is noticeable for a smaller number of rays on the plot in Figure 13. There is a noticeable small difference in result (about 5.38–5.05 = 0.33 W/m2). Higher results were obtained for a bigger number of rays independently of the size of a pixel.
Figure 13 presents the maximum irradiance for every case. It is noticeable that the big difference in results is for a smaller number of rays ( 2 × 10 5 ). More uniform results correspond to ( 2 × 10 9 ) a larger number of rays.

4. Discussion

Interpreting the results is not easy.
We are not clear about what the reason is for such large discrepancies in test results during simulations with fewer light rays generated.
For a more significant number of rays, a higher average irradiance was recorded on the sensor matrix, regardless of the pixel size. For 2 × 10 5 , the value of the average irradiance is less than for the number of radii, that is, a smaller number of rays, 2 × 10 9 . The value of the maximum irradiance at a point on the sensor matrix is higher for smaller pixels. In photometry, it is assumed that deviations from the repetition of actual measurements can be up to 10–15%. In radiometry, such discrepancies (depending on the accuracy of the measurements) may not be acceptable.

5. Conclusions

For a larger number of rays, the difference between the minimum and maximum value at the measuring point on the sensor matrix is smaller than when we consider a smaller number of rays. What does that mean? Analysing the sensor matrix for the number of rays 2 × 10 5 and drawings with the results, you can see the difference between the minimum and maximum values. However, these differences in the number of rays are smaller, corresponding to greater uniformity of the irradiance distribution at the measuring point on the sensor matrix (the difference between the minimum and the maximum value is smaller than in the case of the number of rays). However, the value of the average irradiance recorded on the sensor matrix is similar in each of the simulation measurements. Therefore, it can be considered that this result is repeatable. However, it should be remembered that despite everything, when generating more rays, the results are slightly higher (in the case of tests by approx. 0.2–0.3 W/m) than for the generated smaller number of rays.
Developing a reliable method of selecting industrial illuminator simulation parameters would allow for preliminary tests at the design stage of vision measurement systems. Simulation models of illuminators will allow us to check the interaction of the illuminator with various surfaces and the construction of vision stations. This is a very important task from the perspective of designing a vision measurement system. The first stage of work involves recognizing the relationship between simulation parameters and their results. The results are verified based on actual laboratory measurements using available industrial illuminators.

Author Contributions

Conceptualization, J.W. and A.S.; methodology, J.W. and A.S.; validation, J.W. and A.S.; formal analysis, J.W. and A.S.; investigation, J.W. and A.S.; resources, J.W. and A.S.; data curation, J.W. and A.S.; writing—original draft preparation, J.W. and A.S.; writing—review and editing, J.W. and A.S.; visualization, J.W. and A.S.; supervision, A.S.; project administration, A.S.; funding acquisition, A.S. All authors have read and agreed to the published version of the manuscript.

Funding

This research was funded by AGH University of Krakow.

Institutional Review Board Statement

Not applicable.

Informed Consent Statement

Not applicable.

Data Availability Statement

The data presented in this study are available on request from the corresponding author.

Conflicts of Interest

The authors declare no conflict of interest.

References

  1. Duarte, B.; Feijão, E.; Goessling, J.W.; Caçador, I.; Matos, A.R. Pigment and Fatty Acid Production under Different Light Qualities in the Diatom Phaeodactylum Tricornutum. Appl. Sci. 2021, 11, 2550. [Google Scholar] [CrossRef]
  2. Song, P.; Wang, T.; Jiang, S.; Guo, C.; Wang, R.; Yang, L.; Zhou, Y.; Zheng, G. Freeform Illuminator for Computational Microscopy. Intell. Comput. 2023, 2, 0015. [Google Scholar] [CrossRef]
  3. Raggiunto, S.; Belli, A.; Lorenzo, P.; Piergiovanni, C.; Gattari, M.; Pierleoni, P. An Efficient Method for LED Light Sources Characterization. Electronics 2019, 8, 1089. [Google Scholar] [CrossRef]
  4. Zhao, F.; Van Derlofske, J.F. Side-Emitting Illuminators Using LED Sources. In Proceedings of the Design of Efficient Illumination Systems, San Diego, CA, USA, 10 November 2003; SPIE: New York, NY, USA, 2003; Volume 5186, p. 33. [Google Scholar]
  5. Grzybek, D.; Sioma, A. Creep Phenomenon in a Multiple-Input Single-Output Control System of a Piezoelectric Bimorph Actuator. Energies 2022, 15, 8267. [Google Scholar] [CrossRef]
  6. Sioma, A. 3D Imaging Methods in Quality Inspection Systems. In Proceedings of the Photonics Applications in Astronomy, Communications, Industry, and High-Energy Physics Experiments 2019, Wilga, Poland, 6 November 2019; SPIE: New York, NY, USA, 2019; p. 91. [Google Scholar]
  7. Struzikiewicz, G.; Sioma, A. Surface Topographic Features after Milling of Additively Manufactured AlSi10Mg Aluminum Alloy. Materials 2022, 15, 3604. [Google Scholar] [CrossRef] [PubMed]
  8. Dong, L.L.; Liu, P.; Lou, Q.; Xu, W.H. Study on the Influence of LED Spectrum on the Visual and Nonvisual Effects in the Interior Zone of Tunnels. J. Adv. Transp. 2021, 2021, 5339959. [Google Scholar] [CrossRef]
  9. Rammeloo, C.; Baumgartner, A. Spectroradiometer Calibration for Radiance Transfer Measurements. Sensors 2023, 23, 2339. [Google Scholar] [CrossRef] [PubMed]
  10. Sukhavasi, S.B.; Sukhavasi, S.B.; Elleithy, K.; Abuzneid, S.; Elleithy, A. Cmos Image Sensors in Surveillance System Applications. Sensors 2021, 21, 488. [Google Scholar] [CrossRef]
  11. Polatoğlu, A.; Özkesen, İ.C. Working Principles of CCD and CMOS Sensors and Their Place in Astronomy. Atatürk Univ. J. Anatol. Phys. Astron. 2022, 2, 51–59. [Google Scholar]
  12. Welden, R.; Jablonski, M.; Wege, C.; Keusgen, M.; Wagner, P.H.; Wagner, T.; Schöning, M.J. Light-Addressable Actuator-Sensor Platform for Monitoring and Manipulation of Ph Gradients in Microfluidics: A Case Study with the Enzyme Penicillinase. Biosensors 2021, 11, 171. [Google Scholar] [CrossRef]
  13. Legierski, M.; Michałek, P. Concept and Implementation of H-V Goniophotometer for Fast Measurement of Luminous Intensity Distribution in C-γ System. Prz. Elektrotechniczny 2020, 96, 75–78. [Google Scholar] [CrossRef]
  14. Voudoukis, N.; Oikonomidis, S. Inverse Square Law for Light and Radiation: A Unifying Educational Approach. Eur. J. Eng. Res. Sci. 2017, 2, 23. [Google Scholar] [CrossRef]
  15. ANSYS HELP. Available online: https://ansyshelp.ansys.com/account/secured?returnurl=/Views/Secured/corp/v221/en/Optis_UG_ASP/Optis/UG_ASP/planar_illuminance_180509.html (accessed on 4 February 2023).
  16. ANSYS HELP. Available online: https://ansyshelp.ansys.com/account/secured?returnurl=/Views/Secured/corp/v221/en/Optis_UG_ASP/Optis/UG_ASP/creating_an_irradiance_sensor_180507.html%23id_180507 (accessed on 4 February 2023).
  17. Pawlak, A.; Zaremba, K. A Monte-Carlo Simulation of an Indirect Lighting Installation Using Light Emitting Diodes (LEDs). Przegląd Elektrotechniczny 2013, 89, 215–217. [Google Scholar]
  18. Peterson, G.L. Stray Light Calculation Methods with Optical Ray Trace Software. In Proceedings of the Optical Design and Analysis Software, Denver, CO, USA, 27 September 1999; SPIE: New York, NY, USA, 1999; Volume 3780, pp. 132–137. [Google Scholar]
  19. Frasch, H.-J.J.; Steinmetz, G. Monte Carlo Methods in Ray-Tracing Software. In Proceedings of the Optical Design and Analysis Software II, Seattle, WA, USA, 5 September 2002; SPIE: New York, NY, USA, 2002; Volume 4769, p. 55. [Google Scholar]
  20. Freniere, E.R.; Gregory, G.G.; Hassler, R.A. Edge Diffraction in Monte Carlo Ray Tracing. In Proceedings of the Optical Design and Analysis Software, Denver, CO, USA, 27 September 1999; SPIE: New York, NY, USA, 1999; Volume 3780, pp. 151–157. [Google Scholar]
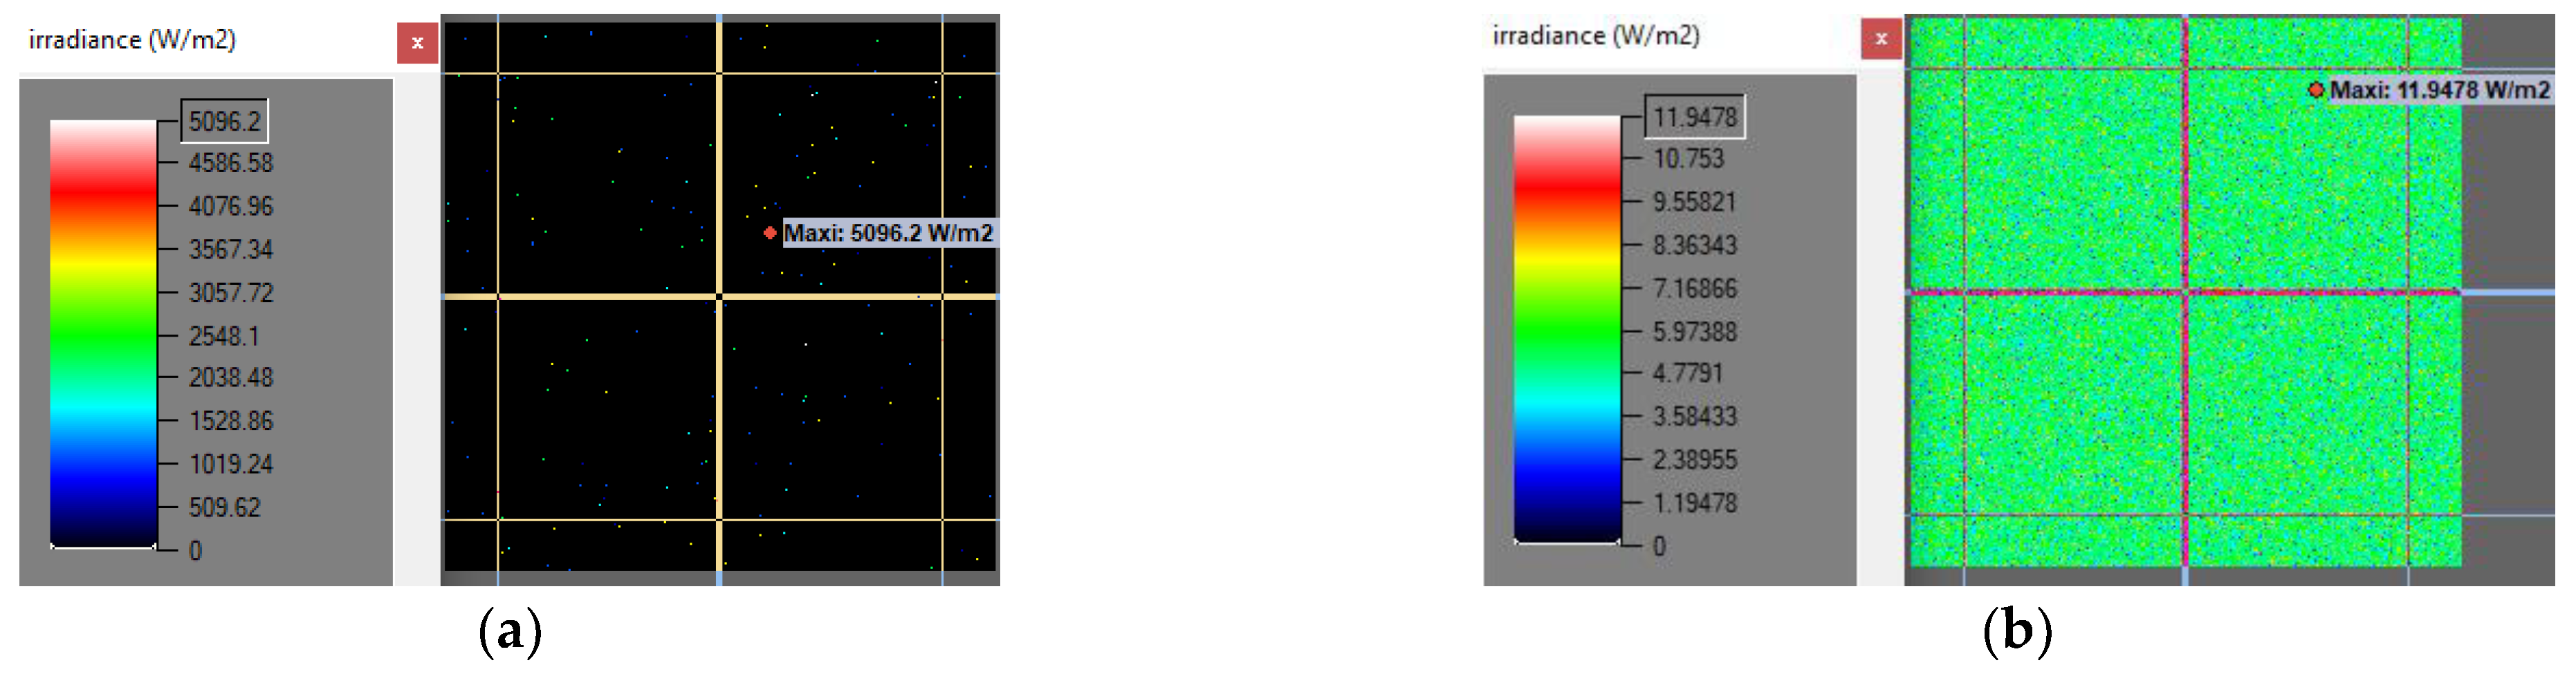
Figure 1. (a) Illuminator cross-section and sensor array and (b) view of the position with the illuminator marked and the illuminated surface.
Applsci 13 10641 g001
Figure 2. Diagram showing the method of goniophotometer measurement.
Applsci 13 10641 g002
Figure 3. Diagram of the measuring station showing the position of the illuminator to the spectroradiometer.
Applsci 13 10641 g003
Figure 4. Diagram of the measuring station.
Applsci 13 10641 g004
Figure 5. Diagram showing a model of the light centre and sensor matrix with the solid photometric model marked.
Applsci 13 10641 g005
Figure 6. Diagram showing an example of a sensor matrix and a single sensor (pixel).
Applsci 13 10641 g006
Figure 7. Graphical representation of the relationship between the normal to the surface and the radius incident to the surface.
Applsci 13 10641 g007
Figure 8. Generated photometric solid based on illuminance measurements.
Applsci 13 10641 g008
Figure 9. Electromagnetic radiation spectrum measured with a spectroradiometer.
Applsci 13 10641 g009
Figure 10. Sensor arrays with recorded results for a pixel size of 12 × 12 μm: (a) the number of rays 2 × 10 5 and (b) the number of rays   2 × 10 9 .
Applsci 13 10641 g010
Figure 11. Sensor arrays with recorded results for a pixel size of 24 × 24 μm: (a) the number of rays 2 × 10 5   a n d   ( b) the number of rays   2 × 10 9 .
Applsci 13 10641 g011
Figure 12. Graph of average irradiance for various parameters.
Applsci 13 10641 g012
Figure 13. Graph of maximum irradiance for various parameters.
Applsci 13 10641 g013
Table 1. Simulation results for pixel sizes of 12 × 12 mm.
Number of RaysValue of Average Irradiance Recorded on the Sensor Matrix [W/m2]The Value of the Maximum Irradiance Recorded on the Sensor Matrix [W/m2]
2 × 10 5 5.075096.2
2 × 10 9 5.3811.95
Table 2. Simulation results for 24 × 24 mm pixel sizes.
Number of RaysValue of Average Irradiance Recorded on the Sensor Matrix [W/m2]The Value of the Maximum Irradiance Recorded on the Sensor Matrix [W/m2]
2 × 10 5 5.052548.1
2 × 10 9 5.258.58
Disclaimer/Publisher’s Note: The statements, opinions and data contained in all publications are solely those of the individual author(s) and contributor(s) and not of MDPI and/or the editor(s). MDPI and/or the editor(s) disclaim responsibility for any injury to people or property resulting from any ideas, methods, instructions or products referred to in the content.

