Featured Application
Given the challenges of mobility and geriatric issues in old age, this study proposes a simple method, based on lifestyle parameters, to assess dementia trends. Geared towards individuals aged 60+ and caregivers, the approach could be widely adopted as a mobile app using the proposed machine learning model for gauging dementia risk.
Abstract
The study focuses on Alzheimer’s and dementia detection using machine learning, acknowledging their impact on cognitive health beyond normal aging. Data markers, rather than biomarkers, are preferred for diagnosis, allowing machine learning to play a role. The objective is to design and test a model for early dementia detection using lifestyle data from the National Health and Ageing Trends Study (NHATS). This could aid in flagging high-risk individuals and understanding aging-related parameter changes. Using NHATS data from 5000 individuals aged 60+, encompassing 1288 parameters over a decade, the study shortlists parameters relevant to dementia. Artificial neural networks and random forest techniques are employed to build a model that identifies key dementia-related parameters. Temporal analysis reveals features that exhibit declining social interactions, quality of life, and increased depression as individuals age. Results show the random forest model achieving an accuracy of 80% for dementia risk prediction, with precision, recall, and F1-score values of 0.76, 1, and 0.86, respectively. Temporal analysis offers insights into aging trends and elderly citizens’ lifestyles, using daily activities as parameters. The study concludes that NHATS data analysed using machine learning techniques aids in understanding aging trends and that machine learning models based on identified parameters can non-intrusively assist in clinical dementia diagnosis and trend-based detection.
1. Introduction
1.1. Background
In the span of 35 years, i.e., from 2015 to 2050, the world geriatric population i.e., people above 60 years, is expected to grow from 12% to around 22% [] This will raise major challenges for the health and social services of countries to cope with this demographic shift. One of the major challenges the authorities are going to face is how to manage dementia, a disease that affects the ageing population the most. dementia is a syndrome in which there is deterioration in memory, thinking, behaviour, and the ability to perform everyday activities [].
Dementia diagnosis relies more on data markers than biomarkers []. Part of the diagnosis protocol involves quantitatively graded cognitive tests. These tests are intrusive and require the patient to be subjected to questions that might alter the actual status of the patient and the patient’s mindset during a test. Our work, which uses National Health and Ageing Trends Studies (NHATS) data, is a step towards creating a non-intrusive protocol to diagnose dementia. The first part of this research revolves around the identification of important lifestyle parameters that influence and have a major impact on the onset of dementia and its progression.
1.2. What Is Dementia
Although dementia mainly affects older people, it is not a normal part of ageing. Worldwide, around 50 million people have dementia, and there are nearly 10 million new cases every year. dementia is one of the major causes of disability and dependency among older people worldwide. It is overwhelming for the people who have it, their caretakers, and their families. Each person is affected by dementia in different ways. These depend on the social, cultural, financial, and geographic background of the person. The signs and symptoms linked to dementia can be understood in three stages as highlighted in Table 1.

Table 1.
Stages of dementia.
Table 2 highlights differences between normal forgetfulness vs. forgetfulness due to dementia.
Table 2.
Normal Memory Loss vs. Abnormal Memory Loss [].
1.3. How Are Dementia and Alzheimer’s Related? [,]
Dementia is a broad term encompassing a range of symptoms characterized by cognitive decline, memory impairment, and alterations in thinking and behaviour. It does not represent a distinct illness but rather a collection of manifestations stemming from various underlying factors. dementia can hinder an individual’s ability to perform daily tasks and have adverse effects on their emotional and social well-being.
Alzheimer’s disease, on the other hand, is a specific contributor to dementia. It represents a gradual neurological condition causing memory loss, difficulties in logical reasoning and problem-solving, shifts in language and communication, and ultimately, a decline in overall cognitive functioning.
Considering that lifestyle factors predominantly correlate with progressive cognitive deterioration, our work is aimed at detecting dementia, primarily characterized by Alzheimer’s disease symptoms.
1.4. Standard Protocol for Dementia []
Practitioners look for signs and symptoms of dementia such as forgetfulness, loss of orientation, apathy, and loss of emotional control. If these are present, they look for signs of any impairment in activities of daily living such as social interactions, handling money, cooking, personal care, etc. The presence of these activities indicates the onset of dementia. Clinicians then perform the medical assessment by performing a physical examination and recording history, functional status, and physical statistics. In cases where deficits are detected based on clinical assessment, clinicians try to find whether causes of dementia are treatable via medication or tackling depression and via biomarkers detected in laboratory testing.
If symptoms of dementia persist, the advice varies based on the severity of dementia. In cases of mild impairment, the patient is reassessed on a half-yearly basis. If the symptoms are not mild, the standard protocol for the treatment of dementia is initiated.
1.5. Potential Role of Machine Learning
The early prognosis of dementia relies more on fine-tuned data marks than biomarkers (a naturally occurring molecule, gene, or characteristic by which a particular pathological or physiological process, disease, etc. can be identified). As mentioned earlier, initial identification and isolation of dementia are carried out using quantifiable tests and subjective tests which are ripe candidates for machine learning models []. With historical data available, an analytical and machine learning-based approach could be a promising tool for the prognosis of dementia. Among varied approaches, machine learning has the potential to facilitate a unified model of cognitive assessment based on historic data. This facilitates the conversion of this human-intensive activity into an automated process that reliably communicates trends to health care professionals. It is an important point when we consider that the ratio of health care providers to people who need health care is dismal. The ideal ratio of psychiatrists to the population is about 1:8000 to 10,000, but in low- to middle-income countries, it can be as low as 1 psychiatrist serving over 200,000 or more people [].
Vijay S. Nori et al. [] applied machine learning to deduce the onset of dementia. The data source was a de-identified national dataset of more than 125 million patients aged above 65 and their 10,000 clinical, pharmaceutical, and demographic variables (contrasted with lifestyle parameters in our work). This research aimed to identify a cohort of features from the dataset that have been proven significant in the development of a machine learning model to predict Alzheimer’s disease and related dementias (ADRD) 4–5 years in advance. They employed lasso regression and random forest (RF) to filter and shortlist significant parameters that had a significant impact on the onset of dementia. They shortlisted 50 features and developed a machine learning model using logistic regression to predict whether a given patient is at risk of ADRD or not. Ford E., Rooney P., et al. [] used prescription-based data to identify risk markers for dementia. Their study used the UK Clinical Practice Research Datalink (CPRD). This data set contains anonymized health care records of around 20 million people. The major features of data include medical diagnoses, primary and secondary referrals, and prescriptions as well as lifestyle information. The data is encoded in a multilevel vocabulary system referred to as ‘read codes’. Every read code signifies indicators of a health-related concept. There are more than 200,000 read codes classified into different chapters. Read codes are represented by a 5-byte alphanumeric code. The creators of the system used logistic regression with lasso, naive Bayes classifier, support vector machine, random forest, and neural networking to classify subjects into demented or non-demented. Naïve Bayes performed the least well, and the logistic regression method performed the best with an AUROC (area under the receiver operating characteristics) of 0.74. The top features that correlated with dementia were wandering and disorientation. Emmanuel A Jammeh et al. [] investigated cases of undiagnosed dementia in primary care. They used publicly available National Health Service (NHS) data. The objective of this study was to develop a machine learning model that can be used to detect dementia using routinely collected health data from the NHS. The model is useful in the detection of patients who may have dementia but have not been diagnosed with it. Input data were routinely collected in the form of ‘read encoded data’ from 18 consenting GPs for 26,483 patients aged above 65 years. ML techniques used were SVM, naïve Bayes, random forest, and logistic regression. The study outcome was a binary variable indicating diagnosis.
2. Materials and Method
2.1. Source Data
Our work uses data from the National Health and Ageing Trends (NHATS) study []. John Hopkins University, Westat, and the National Institute on Aging have an ongoing study called the NHATS (National Health and Ageing Trends Study). The study aims to track and observe more than 500 parameters of the past and present lifestyles of persons who are 65 years of age and above residing in the United States of America. This is a multi-disciplinary study with contributions from researchers in various fields such as geriatric medicine, demography, epidemiology, economics, etc. It also includes distinct markers that indicate whether the person is suffering from dementia or not.
NHATS sample collection commenced in 2011. In 2015, more subjects were added to the study to represent the older population. For subjects already enrolled in the study, interviews are carried out regularly on an annual basis to track how parameters vary over time. The NHATS initiative carries out interviews on monthly basis. If the respondent passes away, the respondent’s last interview becomes the last month of life interview. Racial diversity and fair old age representation are ensured by oversampling racially diverse and older people. The information collected from each individual spans various aspects of the interviewee’s physical, social, and technological environment. The study also collects information about how an individual carries out their daily life activities. Several screening tests are also part of this study. These screening tests help in recording the physical and cognitive capacity of a person. It is an ongoing longitudinal study that is carried out to understand the trajectory of old age disability []. This study contains data from around 4800 unique individuals, spanning 10 years (multi-domain data)—541 questions per individual. This data is available in the public domain for research. The data can be obtained after signing up to their portal [www.NHATS.org] (accessed on 21 April 2023). After accepting agreement to NHATS’s terms of use. There are 11 rounds of data available on the portal (one round for each year).
In the NHATS data, there are distinct parameters that indicate that an individual is suffering from dementia. An individual is marked as dementia patient if there is a formal report of diagnosis of dementia from a doctor or a proxy reports that the subject is unable to respond due to dementia. Screening test scores are also considered while deciding whether the subject is suffering from dementia or not. The protocol for deciding whether the subject is suffering from dementia or not is based on whether the cognitive, memory, and orientation evaluation test score is below 1.5 standard deviations of the mean in at least two faculties [,].
Since the NHATS gathers multi-domain, multi-disciplinary data, people from various disciplines and areas of interest have analysed it for various purposes. A major component of the study was a meta-analysis of the data itself.
- (1)
- Kasper and Freedman et al. studied the cohort profile of the NHATS study [] and used it to extend the study to the classification of people by their dementia status [].
- (2)
- Wu Xia et al. explored the longitudinal associations of stroke with cognitive impairment in older US adults using NHATs data from 2011 to 2019. They found that older adults who suffered strokes are at higher risk of dementia [].
- (3)
- TKM Cudjoe [] et al. constructed a typology of social isolation using data from NHATS and estimated the correlation between social isolation and health outcomes.
- (4)
- Vicki A. Freedman [] explored short-term changes in the prevalence of probable dementia using NHATS data and found that the prevalence of probable dementia declines over this period by 1.4% to 2.6% per year. Declines are concentrated among women, non-Hispanic whites, and black groups, and those with no vascular conditions or risk factors.
- (5)
- Cotton et al. [] established using NHATS data that use of social media is not detrimental to mental health in old age.
- (6)
- Le. G. et al. [] carried out study highlighting positive correlation between the existence of purpose in life with social network size using NHATS data.
- (7)
- Sutin et al. [] found that having a sense of purpose in life encourages people to participate in physical activity.
2.2. Motivation and Contribution of Our Work
Distinguishing between the symptoms of normal aging and the onset of dementia is not a straightforward task. The question of when and how healthy aging transitions into the early stages of Alzheimer’s disease (AD) remains a topic of limited understanding and active research [,,].
The NHATS offers valuable insights, going beyond simply identifying the presence or absence of disability. It provides us with nuanced measures of disability, shedding light on how older individuals and their families adapt, including the utilization of assistive devices, environmental modifications, and assistance from others.
The absence of a clear demarcation between the symptoms of normal aging and dementia, combined with the availability of a comprehensive dataset such as the NHATS, presents us with a unique opportunity to address this challenge.
As such, our contribution involves the development of a machine learning framework capable of unravelling the intricate relationships between various parameters and measures. This framework enables us to classify individuals into high-risk and low-risk categories using minimal input parameters derived from the NHATS dataset.
Our study is motivated by the need for data-driven dementia prognosis, the potential of machine learning techniques, and the accessibility of NHATS data.
Given the challenges associated with mobility in old age, a non-intrusive method that relies on lifestyle parameters without subjecting patients to invasive tests becomes increasingly important. In this paper, we introduce an approach that leverages machine learning techniques to fulfil this need.
The contribution of our work is as follows:
- Review of previous work done on the detection of dementia using machine learning techniques.
- Studying potential opportunities in applying machine learning techniques to NHATS data and gleaning important parameters that have a significant impact on the onset of dementia.
- Models designed based on this work can aid medical professionals as the first screening system that communicates important trends. Hence, they automate the human-intensive activity of preliminary filtering. We used artificial neural networks and random forest techniques for ML modelling.
- Discovery of several important parameters based on statistical methods and domain wisdom that have an impact on dementia such as lifestyle, economics, social circle, and factors that may not be part of the conventional framework of dementia detection, such as the use of technology (discussed in Section 2.3.3).
- Discovery, using temporal analysis, of lifestyle parameters that degrade with time.
We propose to design a machine learning model that can predict the onset of dementia based on the above parameters. Our research work focuses on finding the key parameters that have a significant impact on the onset of dementia and creating a model to detect the risk of the onset of dementia using information about the lifestyle of an individual.
2.3. Work Plan
The NHATS contains more than 400 parameters that give us information including but not limited to social, medical, and daily living aspects of the subjects under study. This data provides us an opportunity to identify the parameters of our day-to-day life that have an impact on the onset and severity of dementia. The NHATS takes place each year with previous participants as well as new ones. Each yearly iteration of this survey is called a round. In total, data for 11 rounds is available. We used data from Round 9 to establish initial framework and then used temporal analysis to see if the findings match across all rounds. The parameter types are divided into the faculties as listed in Table 3
Table 3.
General Classification of parameters.
In the given dataset, the parameters follow the naming convention as descried in Figure 1

Figure 1.
Naming convention. hc: (health condition); 9: round number; Disescn1: disease condition 1.
The parameter is prefixed by parameter type and interview round. We have total data from around 5000 individuals with around 1288 parameters. As the first step towards finding out vital parameters, we first need to clean the available data and identify which data is to be termed labelled data. We remove parameters that have more than 30% blank or null values and parameters that have same value for all patients.
Each parameter’s possible values and type are elaborately explained in the documentation provided along with the data. The parameter values are numeric. While most are categorical parameters, some are numerically ranged parameters. Table 4 lists meta data of two sample parameters.
Table 4.
Parameter Meta-data.
For example, the parameter ‘hc9disescn1’ is a categorical variable that may have values 1 (dementia reported in this interview), 7 (dementia reported in the previous interview), or −1 (indicates the absence of dementia).
2.3.1. Data Wrangling/Pruning
As mentioned earlier, we have total data from around 5000 individuals with around 1288 parameters. We need to remove irrelevant parameters that have no impact on dementia. To achieve this, we use a combination of statistical methods and use existing medical literature about dementia to shortlist relevant parameters).
2.3.2. Label Data
Since we are interested in creating a model for the detection of dementia, our labelled data consists of the parameters that give us a direct indication of the presence of dementia. After studying the NHATS Data Manual, we find that some parameters give such indications. Table 5 lists such indicative parameters.
Table 5.
Label Parameters.
It is important to note that if any of the above parameters flag dementia, the subject or the patient is flagged as having dementia, irrespective of the value of any other parameter. We drop rows for which all three fields, viz. hc9disescn9, cg9reascano1, and is9reasnprx1, lack data (i.e., value is equal to −1). After dropping the rows, we are left with 4831 (out of 5000) rows. In the next step, we derive a parameter ‘flag dem’ (value ‘0’ indicating no dementia and ‘1’ indicating dementia). Thus flag dem becomes our ‘label’ column. The next important step is shortlisting parameters.
2.3.3. Shortlisting Parameters
We use statistical methods and domain wisdom to shortlist relevant parameters for the study. The nature of parameters is ordinal; hence, we use Spearman’s correlation, which is especially suited for ordinal data [].
Spearman’s correlation can be expressed as following formula:
where:
p = 1 − ((6∑(di)2)/n(n2 − 1))
- p = Spearman’s rank correlation coefficient.
- di = difference between the two ranks of each observation
- n = number of observations
- Using domain wisdom
Based on the medical literature, we have shortlisted parameters based on domain wisdom. They include parameters such as the impact of social relationships [], spirituality and religion [], or quality of relationships []. Literature surveys of dementia indicate a major role of community and family in the onset of dementia. We have explored literature concerning the relationship between diabetes and dementia []. Based on the above literature, we have mapped/identified relevant parameters from NHATS data and shortlisted them in Table 6.
Table 6.
Domain Parameters.
We also add one more parameter that is not indicated in any literature to correlate with dementia, ‘te9cellphone’, just to investigate whether we could discover a parameter that may have an impact on dementia but hasn’t been marked as such. This is purely based on an intuition that the operation of technical gadgets involves some amount of cognitive exercise and keeps people connected to their social networks.
- Using Statistical Method
We calculate the Spearman’s correlation of parameters with the label parameter flag_dem. Table 7 shows the results and a few of the top correlated elements.
Table 7.
Statistical Parameters.
- Using Temporal Analysis
NHATS data consists of 10 rounds of interview questions. We also carried out temporal analysis of the above shortlisted parameters to see how they vary with time.
While the NHATS dataset includes subjects who participate in multiple rounds, it does not inherently support temporal analysis. There is no formal mechanism for tracking an individual’s progression across multiple rounds unless we undertake a multi-step data aggregation process. Our initial step involved aggregating subjects based on their subject-IDs across these multiple rounds, resulting in the creation of an individual-specific data frame (as illustrated in Figure 2). Furthermore, the trends in the data did not become readily discernible until we employed techniques such as lasso regression.
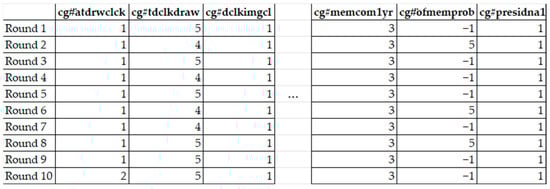
Figure 2.
Indicative view of data frame for individual. Columns indicate domain wisdom based and statistically significant parameters. We created 2251 data frames for each subject. The breakdown of the total number of subjects, both with and without dementia, is provided in Table 8.
Table 8.
Round details with dementia incidence breakdown.
Table 8.
Round details with dementia incidence breakdown.
| Round Index | Not Dementia | With Dementia |
|---|---|---|
| Round 1 | 2207 | 44 |
| Round 2 | 2193 | 68 |
| Round 3 | 2173 | 78 |
| Round 4 | 2154 | 97 |
| Round 5 | 2128 | 123 |
| Round 6 | 2110 | 141 |
| Round 7 | 2067 | 184 |
| Round 8 | 2041 | 210 |
| Round 9 | 1982 | 269 |
| Round 10 | 1979 | 272 |
We ensured that the data were a subset of total data to ensure that we only had data from individuals that had participated in all 10 rounds. The number decreases with each round because individual participants may have expired between these 10 rounds.
We created individual data frames for everyone, consisting of the parameters common in all 10 rounds, which are given in Figure 2.
For each individual data frame, we applied Spearman’s correlation to explain how these parameters vary in relation to dementia progression. We thus obtained individual correlation frame for each of the 2251 subjects. We use lasso regression methodology to identify relation and temporal variability of these parameters. Lasso regression serves as a regularization method, preferred over standard regression for enhanced prediction accuracy []. Operating via shrinkage, it pulls data points closer to the mean. Lasso promotes simpler, sparser models with fewer parameters, making it valuable for automated model selection tasks such as variable elimination.
We used these individual data frames as input to the lasso regression methodology to find how these parameters vary with time. We found that the parameters listed in Table 9 had maximum impact. Temporal analysis affirms that the parameters shortlisted from Round 9 data, using domain methods and statistical methods, are valid for all the rounds.
Table 9.
List of temporal analysis that have high impact (‘#’ indicates round number).
- List of Final Parameters
After carrying out domain wisdom, Statistical and Temporal analysis, we finalize the parameters that are presented in Table 10.
Table 10.
List of final parameters.
To maintain the integrity of the result, we ensured that all the shortlisted fields did not have more than 15% values missing. We removed parameters that have had than 15% null values.
One more precaution we needed to take was to ensure that the shortlisted parameters did not have a strong correlation and dependence amongst each other, which would introduce bias in any machine learning technique we were about to apply. We observed that there was no significant correlation amongst parameters, and we proceeded to the next steps for applying algorithms.
To ensure the integrity of data we remove rows that have an invalid response for the shortlisted parameters. This leaves us with a total of 4060 rows and 219 dementia-positive patients. The breakdown of control and dementia positive population is 3841 and 219, respectively. The data reflects real-life distribution. However, we also needed to ensure that our model was not affected by overfitting, so we need to balance the data. We used a selective sampling method to balance data. We undersampled the control population and finally, we obtained 219 control and 219 dementia subjects.
2.3.4. Choice of Machine Learning Method
The purpose of our study was not limited to the creation of a classification model of dementia based on data. We also needed information about how the model decides the onset of dementia. A large part of that process is understanding which parameter(s) have the greatest impact on the decision-making of the model. We chose the random forest algorithm for this purpose as it not only gives a classification model but also the relative importance of parameters for the model (unlike artificial neural networks, whose processing functions are a form of ‘black box’). To understand random forest algorithm, we need to discuss one of its critical components, the decision tree.
The decision tree algorithm is a machine learning method that constructs a hierarchical model resembling a tree to facilitate decision-making or prediction. It operates by iteratively dividing the dataset into smaller subsets, using the most informative features, creating a tree structure in which each internal node signifies a decision based on a feature and each leaf node signifies an outcome or prediction.
Random forest is an ensemble machine learning technique that enhances predictive accuracy while mitigating overfitting by amalgamating multiple decision trees. The algorithm accomplishes this by training numerous decision trees on random subsets of the dataset and then combining their predictions. Each individual tree in the forest makes its prediction independently, and the ultimate output is determined via a majority vote (in the case of classification) or an averaging process (for regression) [].
We also designed a second model using an artificial neural network. We used this secondary technique to check whether the accuracy of our random forest model was comparable to it. As mentioned earlier, ANNs being black boxes, we would not get any insights regarding the importance and impact of input parameters.
We randomly split the data into 80% for training and 20% for testing. We then applied the following algorithms to the data:
- (1)
- random forest
- (2)
- neural networks
The data was analysed using Python 3.0 using packages TensorFlow and sklearn. We applied 5-fold cross-validation for model validation.
The random forest algorithm also has the additional benefit of inferring the relative ranking of parameter’s impact on the onset of dementia. We used 100 estimators for random forest [].
For neural networks, the input shape indicated the number of parameters we were testing. The configuration of Neural Network is highlighted in Table 11.
Table 11.
Neural network configuration.
This architecture is typically referred to as a feedforward neural network or a multilayer perceptron (MLP). It is a type of artificial neural network where information flows in one direction from the input layer through one or more hidden layers (in our case, 2 hidden layers with 16 neurons each), and finally to the output layer (with 1 neuron and sigmoid activation) [].
We used the ‘Adam’ optimizer for the neural model for faster convergence towards minima. We used sigmoid as an activation function for the output layer as it is best suited for binary classification [].
3. Results
In this section, we present and discuss the salient features of the results. We have created two models. We discuss their analysis in the sections below:
3.1. Random Forest
We applied random forest classification to both balanced data and raw data (data without balancing). The accuracy without balancing data was 92%, and with balancing, we obtained an accuracy of 80%. First, we explored what parameters were important factors in classification. The important parameters are illustrated in Figure 3. Parameter Importance Ranking along with its description is highlighted in Table 12.
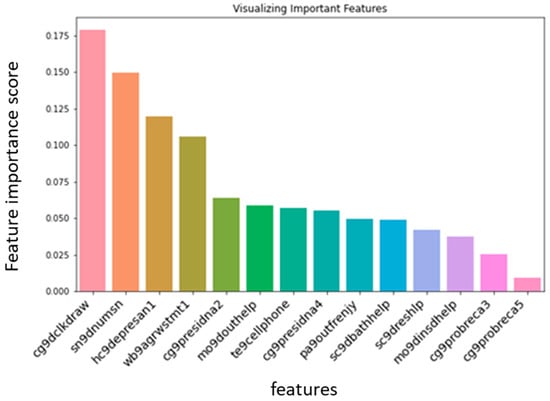
Figure 3.
Relative impact of each parameter on the onset of dementia.
Table 12.
Parameter Importance Ranking.
3.1.1. Feature Importance
- We found that the ability to draw a clock (cg9dclkdraw), the number of people in the social circle (sn9dnumsn), and self-perception of control had a significant impact on the onset of dementia (hc9depresan1, wb9agrwstmt1).
- One of the interesting findings was that the ability to use a cell phone is a major indicator of cognitive well-being. This is a significant non-intrusively obtained lifestyle parameter. (te9cellphone).
- Ability to recall the name of the head of state (cg9presidna2) and active social life also had a significant impact (pa9outfrenjy).
3.1.2. Accuracy Analysis
We achieved overall accuracy of 84% and precision of 76%. K-fold validation for K = 5 yielded accuracy of 85%, 82%, 88%, 90%, and 83%. Table 13 summarises the accuracy analysis. Table 14 explains the terms precision, recall, f10score, accuracy and Macro Avg.
Table 13.
Accuracy, precision, recall.
Table 14.
Information about terms related to accuracy.
3.2. Artificial Neural Network
Since our classification is binary, we use the binary cross-entropy method to calculate the loss in neural network. We achieved 93% accuracy without data balancing and 87% accuracy with data balancing.
Our purpose for designing a secondary model using an artificial neural network was to see if the ANN would provide accuracy comparable to random forest using the same data. We found that they had comparable accuracies. The ANN did not provide any other takeaways in terms of parameter importance.
Figure 4 depicts trends in training and validation loss. It follows the standard trend of decline with increasing training steps. Figure 5 shows trends in training and validation accuracy. Figure 4 and Figure 5 provide us with a visual measure of effectiveness of our training and testing data and procedure.
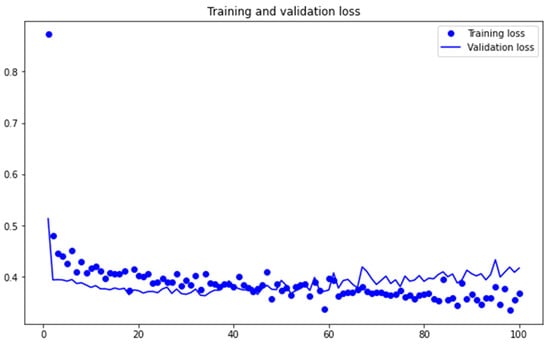
Figure 4.
Loss Metrics.
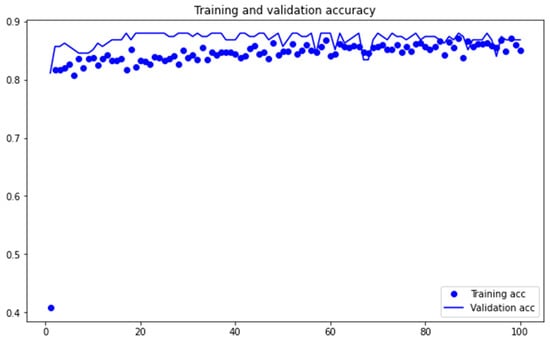
Figure 5.
Accuracy Metrics.
3.3. Temporal Analysis Parameters
In order to test whether we could reduce list of parameters further without affecting accuracy and recall, we applied the random forest algorithm to the parameters mentioned in Table 15:
Table 15.
Parameters identified during temporal analysis. ‘#’ refers to the NHATS round.
These are the parameters that had high temporal impact, as discussed in Section 2.3.3. (Using Temporal Analysis).
We observed that the model achieved an accuracy of 68%, which is lower than the accuracy of our earlier experiment with more parameters. This indicates that even though the above-mentioned parameters can be used to predict cognitive decline over time, they may not necessarily be sufficient to achieve good accuracy for classifying an individual into high risk or low risk categories of the onset of dementia.
4. Discussion
NHATS data provide significant insight into ageing trends and the lifestyle of elderly citizens. We used activities of daily living as parameters. We identified important parameters from these to create machine learning models that can assist in clinical methods of diagnosing dementia. More importantly, this model can help with non-intrusive detection of dementia based on available trends. This can ensure that people on the cusp of dementia receive treatment to prolong their quality of life.
There are several insights we gain through this study.
- The ability to draw a clock or not (cg9dclkdraw) is a strong indicator of dementia.
- We find that despite the intuitive sense of the relationship between diabetes and dementia, we did not find any significant impact between diabetes and dementia.
- The size of social circle, going out with friends and socializing have bearing on the onset of dementia. (sn9dnumsn, pa9outfrenjy).
- This data also tells us that there is a significant awareness among dementia patients about their cognitive decline. They are aware of the sense of losing control by stating that other people now control their day-to-day life. (wb9agrwstmt1—Perception of control of one’s own life).
- One of the major discoveries was that ability to use technology is strongly correlated with a delay in the onset of dementia (te9cellphone).
- Ability to recall the first and last name of the current head of state (cg9presidna2, cg9presidna4).
These insights helped us to design a testing protocol that consists of the above parameters. These can serve as input to our model to predict risk of onset of dementia.
Table 16 presents the compilation of selected questions for our proposed testing model, designed to categorize individuals as at either high risk or low risk for dementia. The responses to these questions can be taken as an input through a mobile application; a mobile app can then connect with the proposed machine learning model via an API (application programming interface) and provide binary risk assessment of whether the person is at risk of dementia or not. Most of the shortlisted questions belong to the NHATS cognitive battery subset. The NHATS has stated that it takes around 7 min on an average to administer the cognition related questions [].
Table 16.
List of questions for proposed protocol. (Structure of questions are in first person form’ they can be re-formed appropriately in cases where the responses are filled on behalf of the person).
When to Take the Survey?
Recognizing the initial stages of dementia holds significant importance as it allows for prompt diagnosis and the introduction of appropriate treatments. Patients are recommended to take dementia pre-clinical screen tests above the age of 65 irrespective of apparent normality of cognitive faculties [,] as prevalence of dementia doubles with every five years increments in age. The proposed survey can be carried out before the existing clinical protocol begins. The flow-chart for the protocol is highlighted in Figure 6.
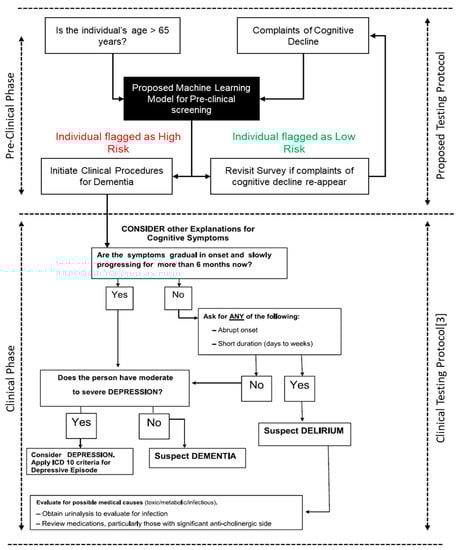
Figure 6.
Proposed Methodology flowchart.
Author Contributions
Conceptualization, A.Z.; Methodology, A.Z. and R.K.; Software, A.Z.; Validation, R.K.; Resources, O.K.; Writing—original draft, A.Z.; Writing—review & editing, R.K.; Supervision, R.K. and O.K.; Project administration, O.K. All authors have read and agreed to the published version of the manuscript.
Funding
This research received no external funding.
Institutional Review Board Statement
Not applicable.
Informed Consent Statement
Not applicable.
Data Availability Statement
No new data were created or analysed in this study. Data sharing is not applicable to this article.
Acknowledgments
For Data Source: National Health and Aging Trends Study. Produced and distributed by www.nhats.org with funding from the National Institute on Aging (grant number U01AG032947).
Conflicts of Interest
The authors declare no conflict of interest.
References
- Ageing and Health, World Health Organization. Available online: https://www.who.int/news-room/fact-sheets/detail/ageing-and-health (accessed on 4 October 2021).
- Dementia, World Health Organization. Available online: https://www.who.int/news-room/fact-sheets/detail/dementia (accessed on 2 September 2021).
- Shaji, K.S.; Sivakumar, P.T.; Prasad Rao, G.; Paul, N. Clinical Practice Guidelines for Management of Dementia. Indian J. Psychiatry 2018, 60, S312–S328. [Google Scholar] [CrossRef] [PubMed]
- Caughey, A. Dealing Daily with Dementia: 2000+ Practical Hints & Strategies for Carers; Calico Publishing Ltd.: Auckland, New Zealand, 2013; ISBN 9781877429071. [Google Scholar]
- Walters, K.; Hardoon, S.; Petersen, I.; Iliffe, S.; Omar, R.Z.; Nazareth, I.; Rait, G. Predicting Dementia Risk in Primary Care: Development and Validation of the Dementia Risk Score Using Routinely Collected Data. BMC Med. 2016, 14, 6. [Google Scholar] [CrossRef] [PubMed]
- Comprehensive Mental Health Action Plan 2013–2030; World Health Organization: Geneva, Switzerland, 2021; ISBN 978-92-4-003102-9.
- Nori, V.S.; Hane, C.A.; Martin, D.C.; Kravetz, A.D.; Sanghavi, D.M. Identifying Incident Dementia by Applying Machine Learning to a Very Large Administrative Claims Dataset. PLoS ONE 2019, 14, e0203246. [Google Scholar] [CrossRef] [PubMed]
- Ford, E.; Rooney, P.; Oliver, S.; Hoile, R.; Hurley, P.; Banerjee, S.; van Marwijk, H.; Cassell, J. Identifying Undetected Dementia in UK Primary Care Patients: A Retrospective Case-Control Study Comparing Machine-Learning and Standard Epidemiological Approaches. BMC Med. Inform. Decis. Mak. 2019, 19, 248. [Google Scholar] [CrossRef] [PubMed]
- Jammeh, E.A.; Carroll, C.B.; Pearson Stephen, W.; Escudero, J.; Anastasiou, A.; Zhao, P.; Chenore, T.; Zajicek, J.; Ifeachor, E. Machine-learning based identification of undiagnosed dementia in primary care: A feasibility study. BJGP Open 2018, 2, bjgpopen18X101589. [Google Scholar] [CrossRef]
- NHATS Research Help. 2020. Available online: https://nhats.org/researcher (accessed on 21 April 2023).
- Wennberg, A.M.; Gottesman, R.F.; Kaufmann, C.N.; Albert, M.S.; Chen-Edinboro, L.P.; Rebok, G.W.; Kasper, J.D.; Spira, A.P. Diabetes and Cognitive Outcomes in a Nationally Representative Sample: The National Health and Aging Trends Study. Int. Psychogeriatr. 2014, 26, 1729–1735. [Google Scholar] [CrossRef]
- Kasper, J.D.; Freedman, V.A. Findings from the 1st Round of the National Health and Aging Trends Study (NHATS): Introduction to a Special Issue. J. Gerontology. Ser. B Psychol. Sci. Soc. Sci. 2014, 69, S1–S7. [Google Scholar] [CrossRef]
- Kasper Judith, D.; Freedman, V.A. National Health and Aging Trends Study (NHATS) User Guide: Rounds 1–9 Final Release; Jahns Hopkins University School of Public Health: Baltimore, MD, USA, 2020. [Google Scholar]
- Kasper, J.D.; Freedman, V.A.; Spillman, B. Classification of Persons by Dementia Status in the National Health and Aging Trends Study: Technical Paper #5. In Baltimore: Johns Hopkins University School of Public Health. Available at www.NHATS.org (Issue July). 2013. Available online: https://www.nhats.org/sites/default/files/inline-files/DementiaTechnicalPaperJuly_2_4_2013_10_23_15.pdf (accessed on 21st August 2023).
- Freedman, V.A.; Kasper, J.D. Cohort Profile: The National Health and Aging Trends Study (NHATS). Int. J. Epidemiol. 2019, 48, 1044–1045. [Google Scholar] [CrossRef]
- Wu, X.; Fan, L.; Ke, S.; He, Y.; Zhang, K.; Yang, S. Longitudinal Associations of Stroke with Cognitive Impairment Among Older Adults in the United States: A Population-Based Study. Front. Public Health 2021, 9, 637042. [Google Scholar] [CrossRef]
- Cudjoe, T.K.M.; Roth, D.L.; Szanton, S.L.; Wolff, J.L.; Boyd, C.M.; Thorpe, R.J. The Epidemiology of Social Isolation: National Health and Aging Trends Study. J. Gerontol.-Ser. B Psychol. Sci. Soc. Sci. 2020, 75, 107–113. [Google Scholar] [CrossRef]
- Freedman, V.A.; Kasper, J.D.; Spillman, B.C.; Plassman, B.L. Short-Term Changes in the Prevalence of Probable Dementia: An Analysis of the 2011–2015 National Health and Aging Trends Study. J. Gerontol.-Ser. B Psychol. Sci. Soc. Sci. 2018, 73, S48–S56. [Google Scholar] [CrossRef] [PubMed]
- Cotten, S.R.; Ghaiumy Anaraky, R.; Schuster, A.M. Social Media Use May Not Be as Bad as Some Suggest: Implication for Older Adults. Innov. Aging 2023, 7, igad022. [Google Scholar] [CrossRef]
- Lee, G.; Martin, P. Testing the Reciprocal Relationship Between Social Networks and Purpose in Life Among Older Adults: Application of a Random Intercept Cross-Lagged Panel Model. J. Aging Health 2023, 35, 699–707. [Google Scholar] [CrossRef] [PubMed]
- Sutin, A.R.; Stephan, Y.; Kekäläinen, T.; Luchetti, M.; Terracciano, A. Purpose in life and accelerometer-measured physical activity among older adults. Psychol. Health 2023, 13, 1–15. [Google Scholar] [CrossRef] [PubMed]
- Irwin, K.; Sexton, C.; Daniel, T.; Lawlor, B.; Naci, L. Healthy Aging and Dementia: Two Roads Diverging in Midlife? Front. Aging Neurosci. 2018, 10, 275. [Google Scholar] [CrossRef] [PubMed]
- Ritchie, K.; Ritchie, C.W.; Yaffe, K.; Skoog, I.; Scarmeas, N. Is late-onset Alzheimers disease really a disease of midlife? Alzheimers Dement. 2015, 1, 122–130. [Google Scholar] [CrossRef]
- Mortamais, M.; Ash, J.A.; Harrison, J.; Kaye, J.; Kramer, J.; Randolph, C.; Pose, C.; Albala, B.; Ropacki, M.; Ritchie, C.W.; et al. Detecting cognitive changes in preclinical Alzheimers disease: A review of its feasibility. Alzheimers Dement. 2017, 13, 468–492. [Google Scholar] [CrossRef]
- Xiao, C.; Ye, J.; Esteves, R.M.; Rong, C. Using Spearman’s Correlation Coefficients for Exploratory Data Analysis on Big Dataset. In Concurrency and Computation: Practice and Experience; John Wiley & Sons, Inc.: Hoboken, NJ, USA, 2016; Volume 28. [Google Scholar] [CrossRef]
- Hsiao, Y.H.; Chang, C.H.; Gean, P.W. Impact of Social Relationships on Alzheimer’s Memory Impairment: Mechanistic Studies. J. Biomed. Sci. 2018, 25, 3. [Google Scholar] [CrossRef]
- Giannouli, V.; Giannoulis, K. Gazing at Medusa: Alzheimer’s Dementia through the Lenses of Spirituality and Religion. Health Psychol. Res. 2020, 8, 8833. [Google Scholar] [CrossRef]
- Harris, P.B. Dementia and Friendship: The Quality and Nature of the Relationships That Remain. Int. J. Aging Hum. Dev. 2013, 76, 141–164. [Google Scholar] [CrossRef]
- Meneilly, G.S.; Tessier, D.M. Diabetes, Dementia and Hypoglycemia. Can. J. Diabetes 2016, 40, 73–76. [Google Scholar] [CrossRef] [PubMed]
- Muthukrishnan, R.; Rohini, R. LASSO: A feature selection technique in predictive modeling for machine learning. In Proceedings of the 2016 IEEE International Conference on Advances in Computer Applications (ICACA), Coimbatore, India, 24 October 2016; pp. 18–20. [Google Scholar] [CrossRef]
- Schonlau, M.; Zou, R.Y. The random forest algorithm for statistical learning. Stata J. 2020, 20, 3–29. [Google Scholar] [CrossRef]
- Oshiro, T.M.; Perez, P.S.; Baranauskas, J.A. How Many Trees in a Random Forest? Lecture Notes in Computer Science (Including Subseries Lecture Notes in Artificial Intelligence and Lecture Notes in Bioinformatics), 7376 LNAI; Springer: Berlin/Heidelberg, Germany, 2012. [Google Scholar] [CrossRef]
- Sazli, M. A brief review of feed-forward neural networks. Commun. Fac. Sci. Univ. Ank. 2006, 50, 11–17. [Google Scholar] [CrossRef]
- Nwankpa, C.; Ijomah, W.; Gachagan, A.; Marshall, S. Activation Functions: Comparison of trends in Practice and Research for Deep Learning. arXiv 2018, arXiv:1811.03378. [Google Scholar]
- Panegyres, P.K.; Berry, R.; Burchell, J. Early Dementia Screening. Diagnostics 2016, 6, 6. [Google Scholar] [CrossRef]
Disclaimer/Publisher’s Note: The statements, opinions and data contained in all publications are solely those of the individual author(s) and contributor(s) and not of MDPI and/or the editor(s). MDPI and/or the editor(s) disclaim responsibility for any injury to people or property resulting from any ideas, methods, instructions or products referred to in the content. |
© 2023 by the authors. Licensee MDPI, Basel, Switzerland. This article is an open access article distributed under the terms and conditions of the Creative Commons Attribution (CC BY) license (https://creativecommons.org/licenses/by/4.0/).