
Drone-Based Monitoring and Mapping for LMO Confined Field Management under the Ministry of Environment


Abstract
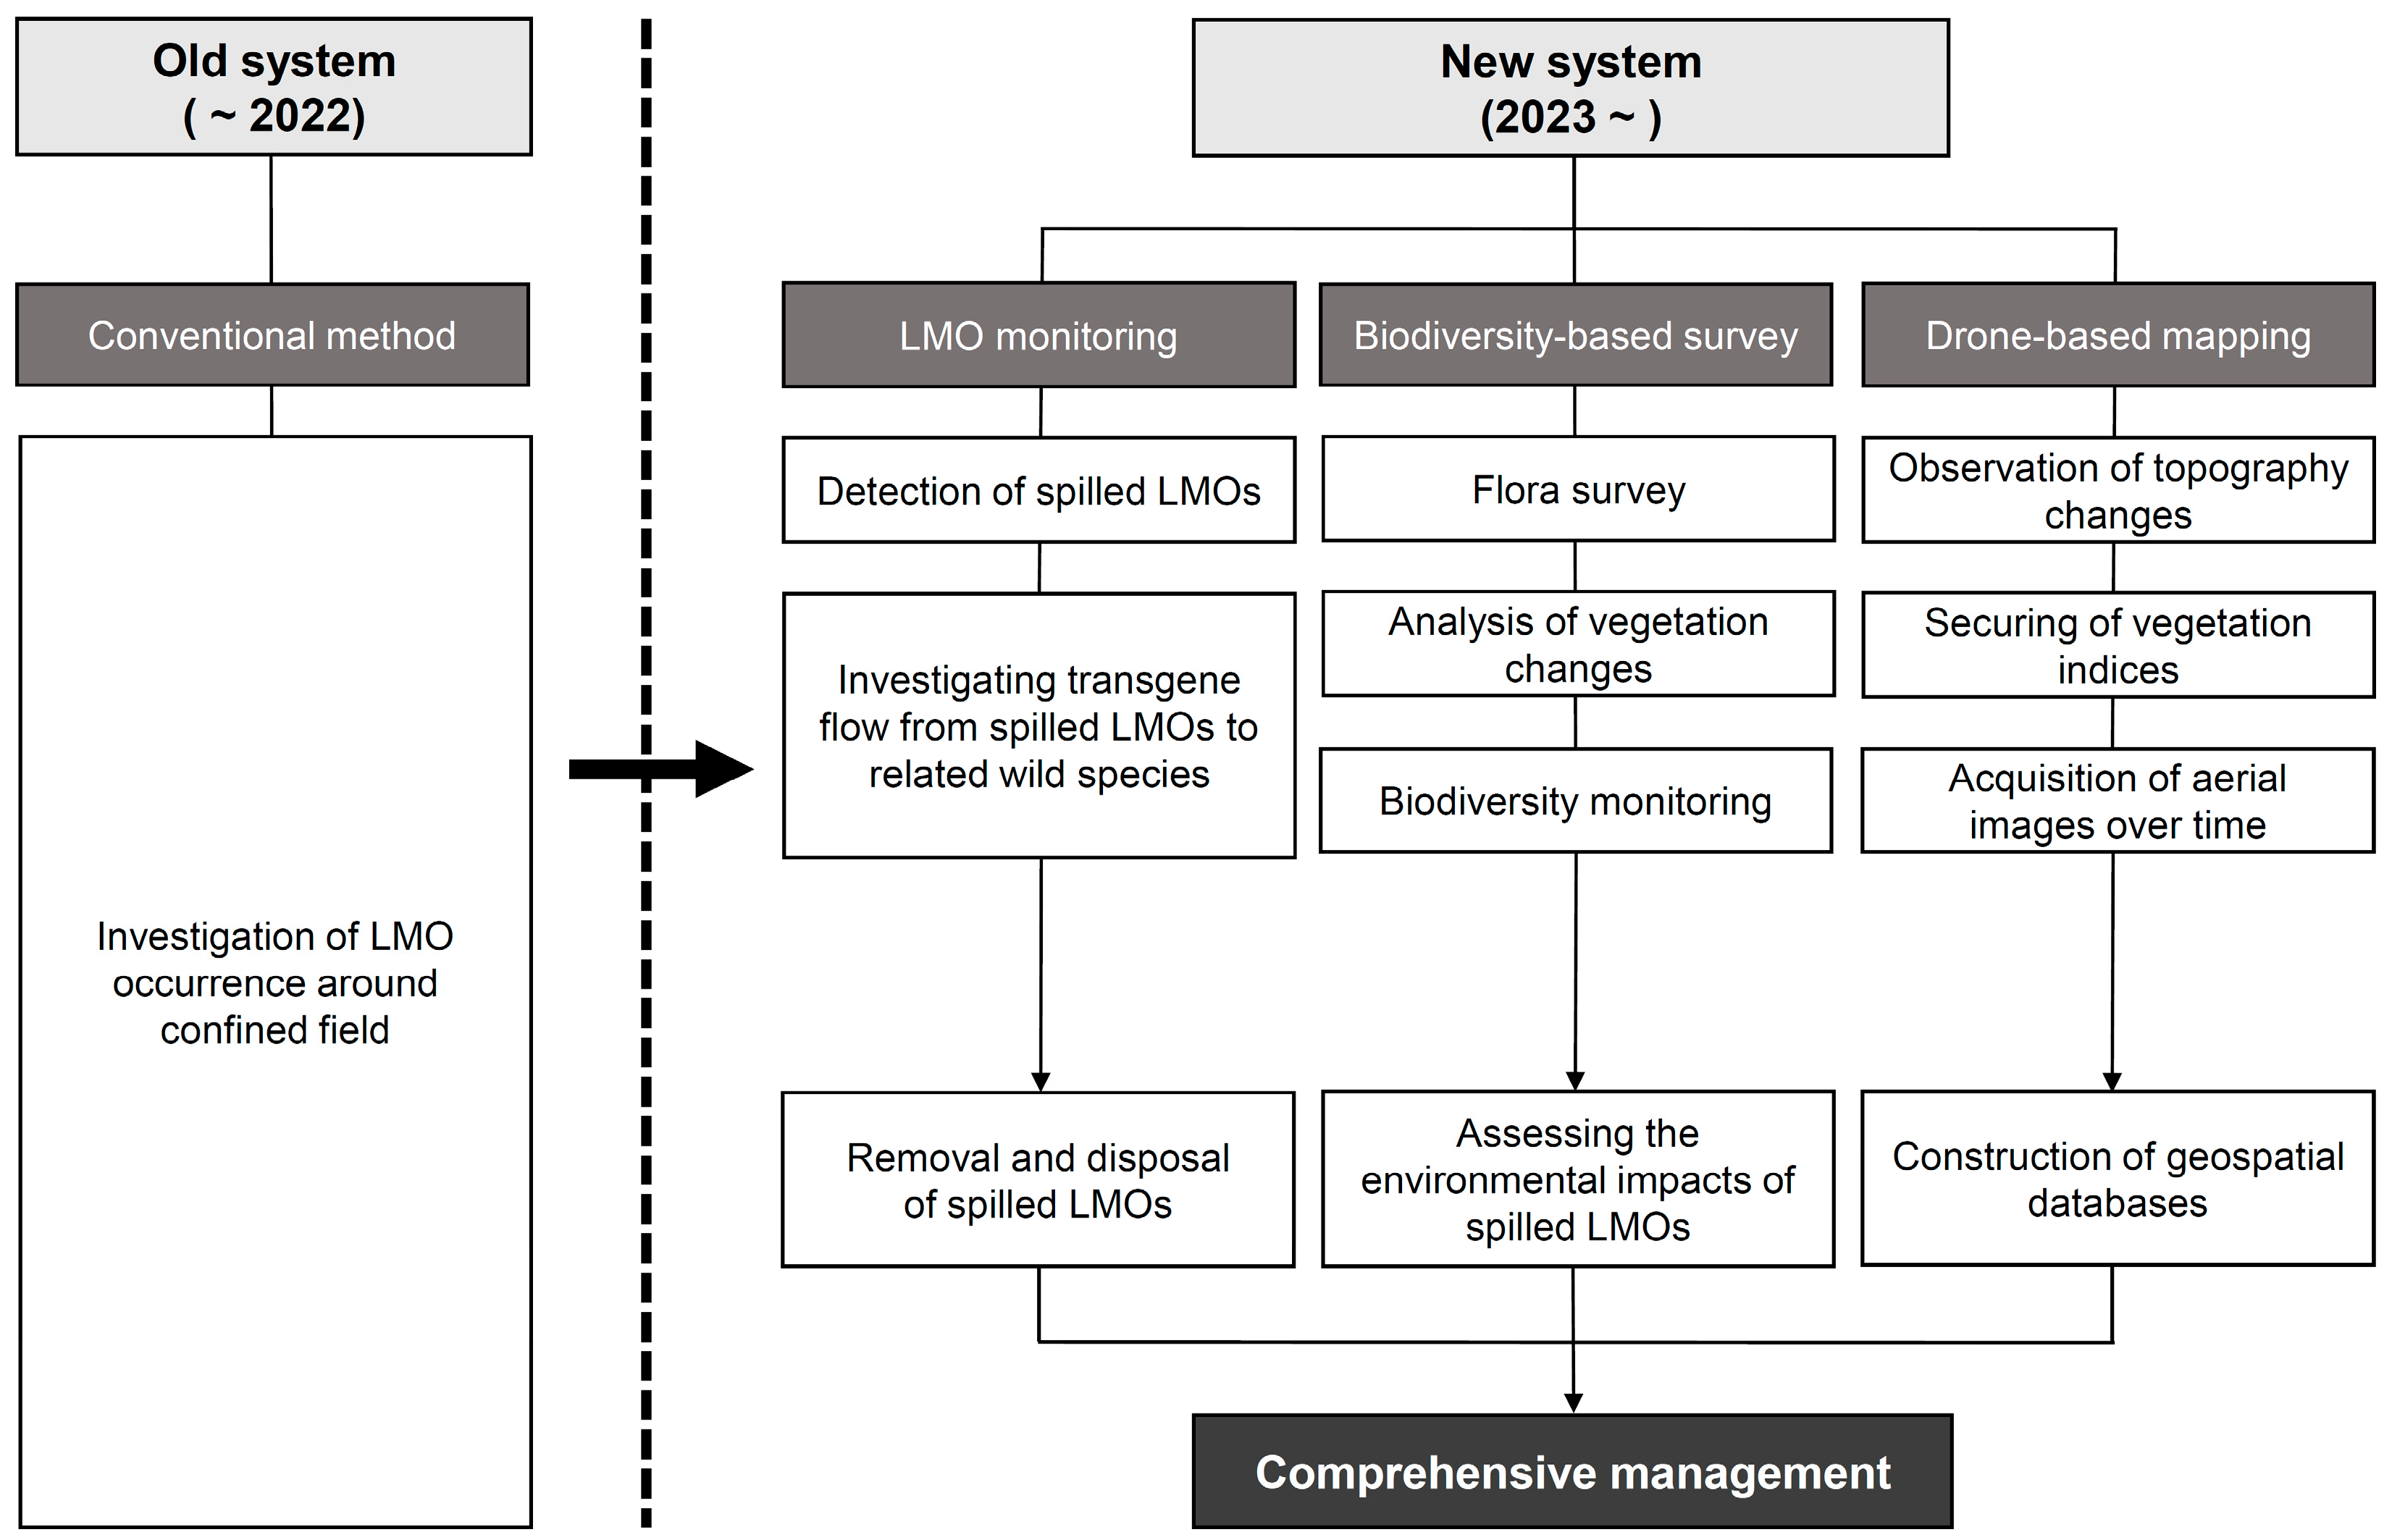
:1. Introduction
2. Materials and Methods
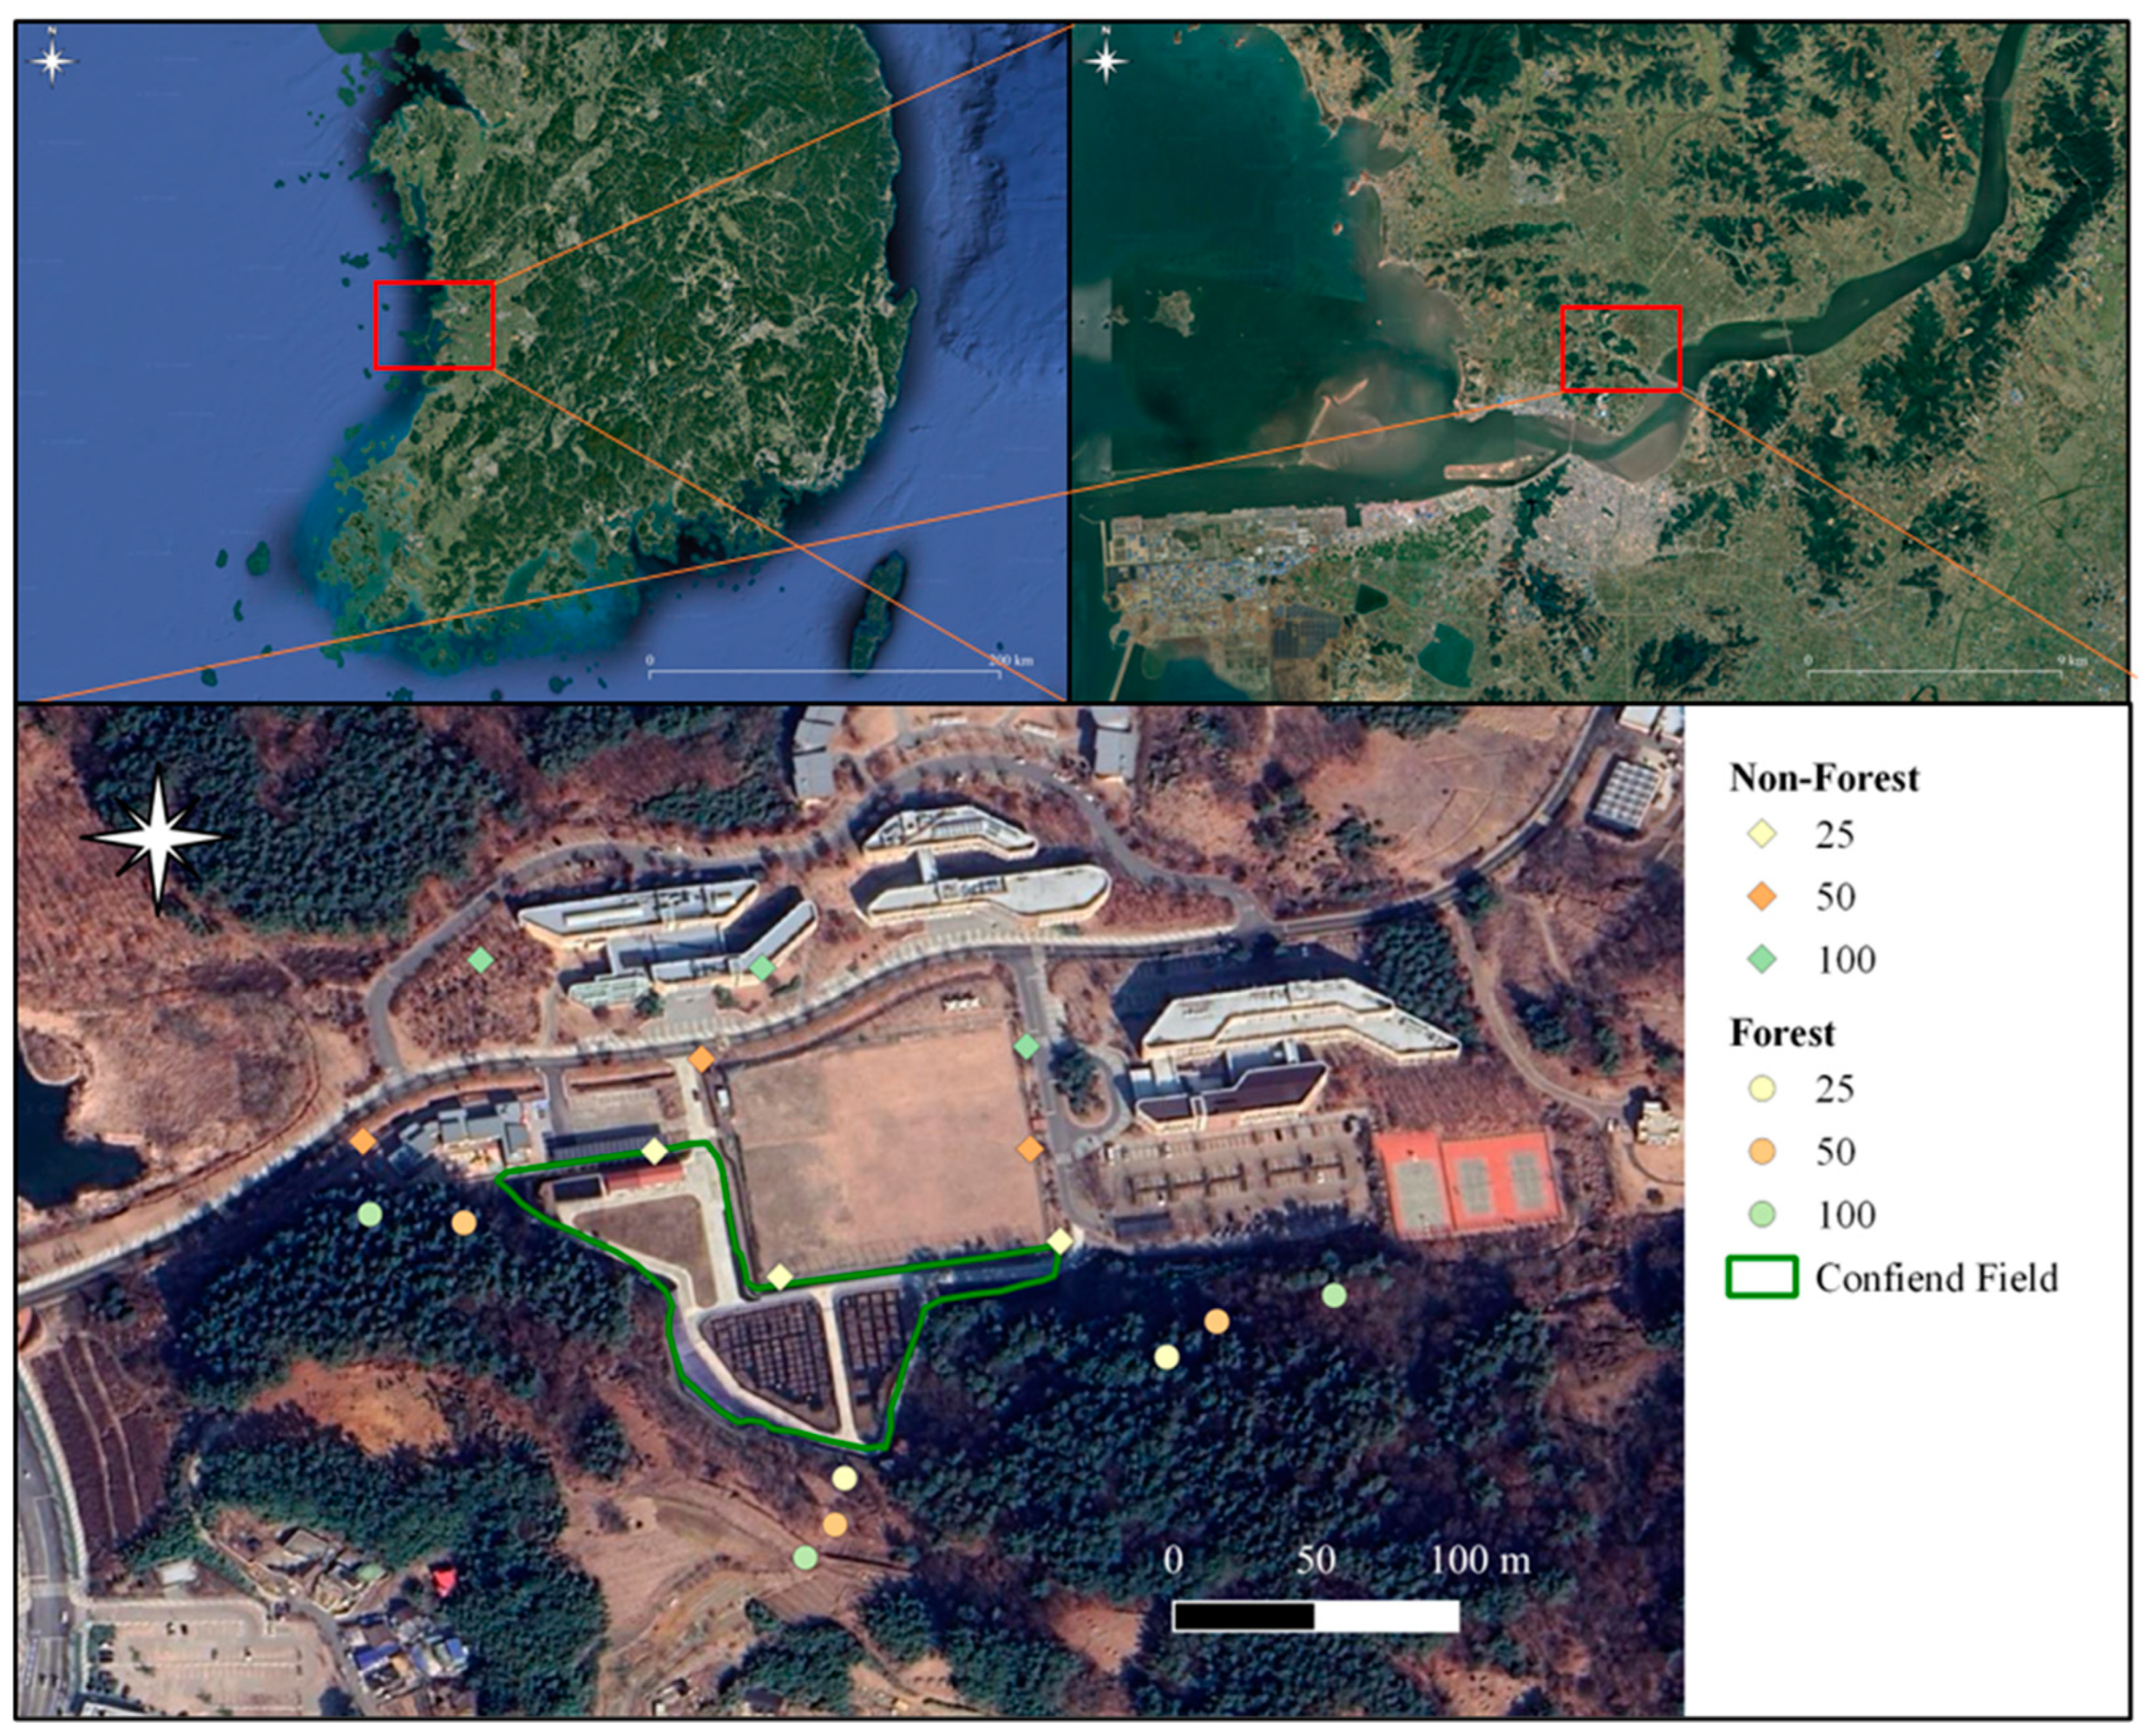
2.1. Study Area
2.2. Vegetation Survey
2.3. Diversity Statistics and Data Analysis
2.4. Image Acquisition Using Aerial Drone
2.5. Data Processing
3. Results and Discussion
3.1. Exploring Spatiotemporal Vegetation Dynamics Surrounding LMO Confined Fields: Insights from Comprehensive Wild Plant Surveys
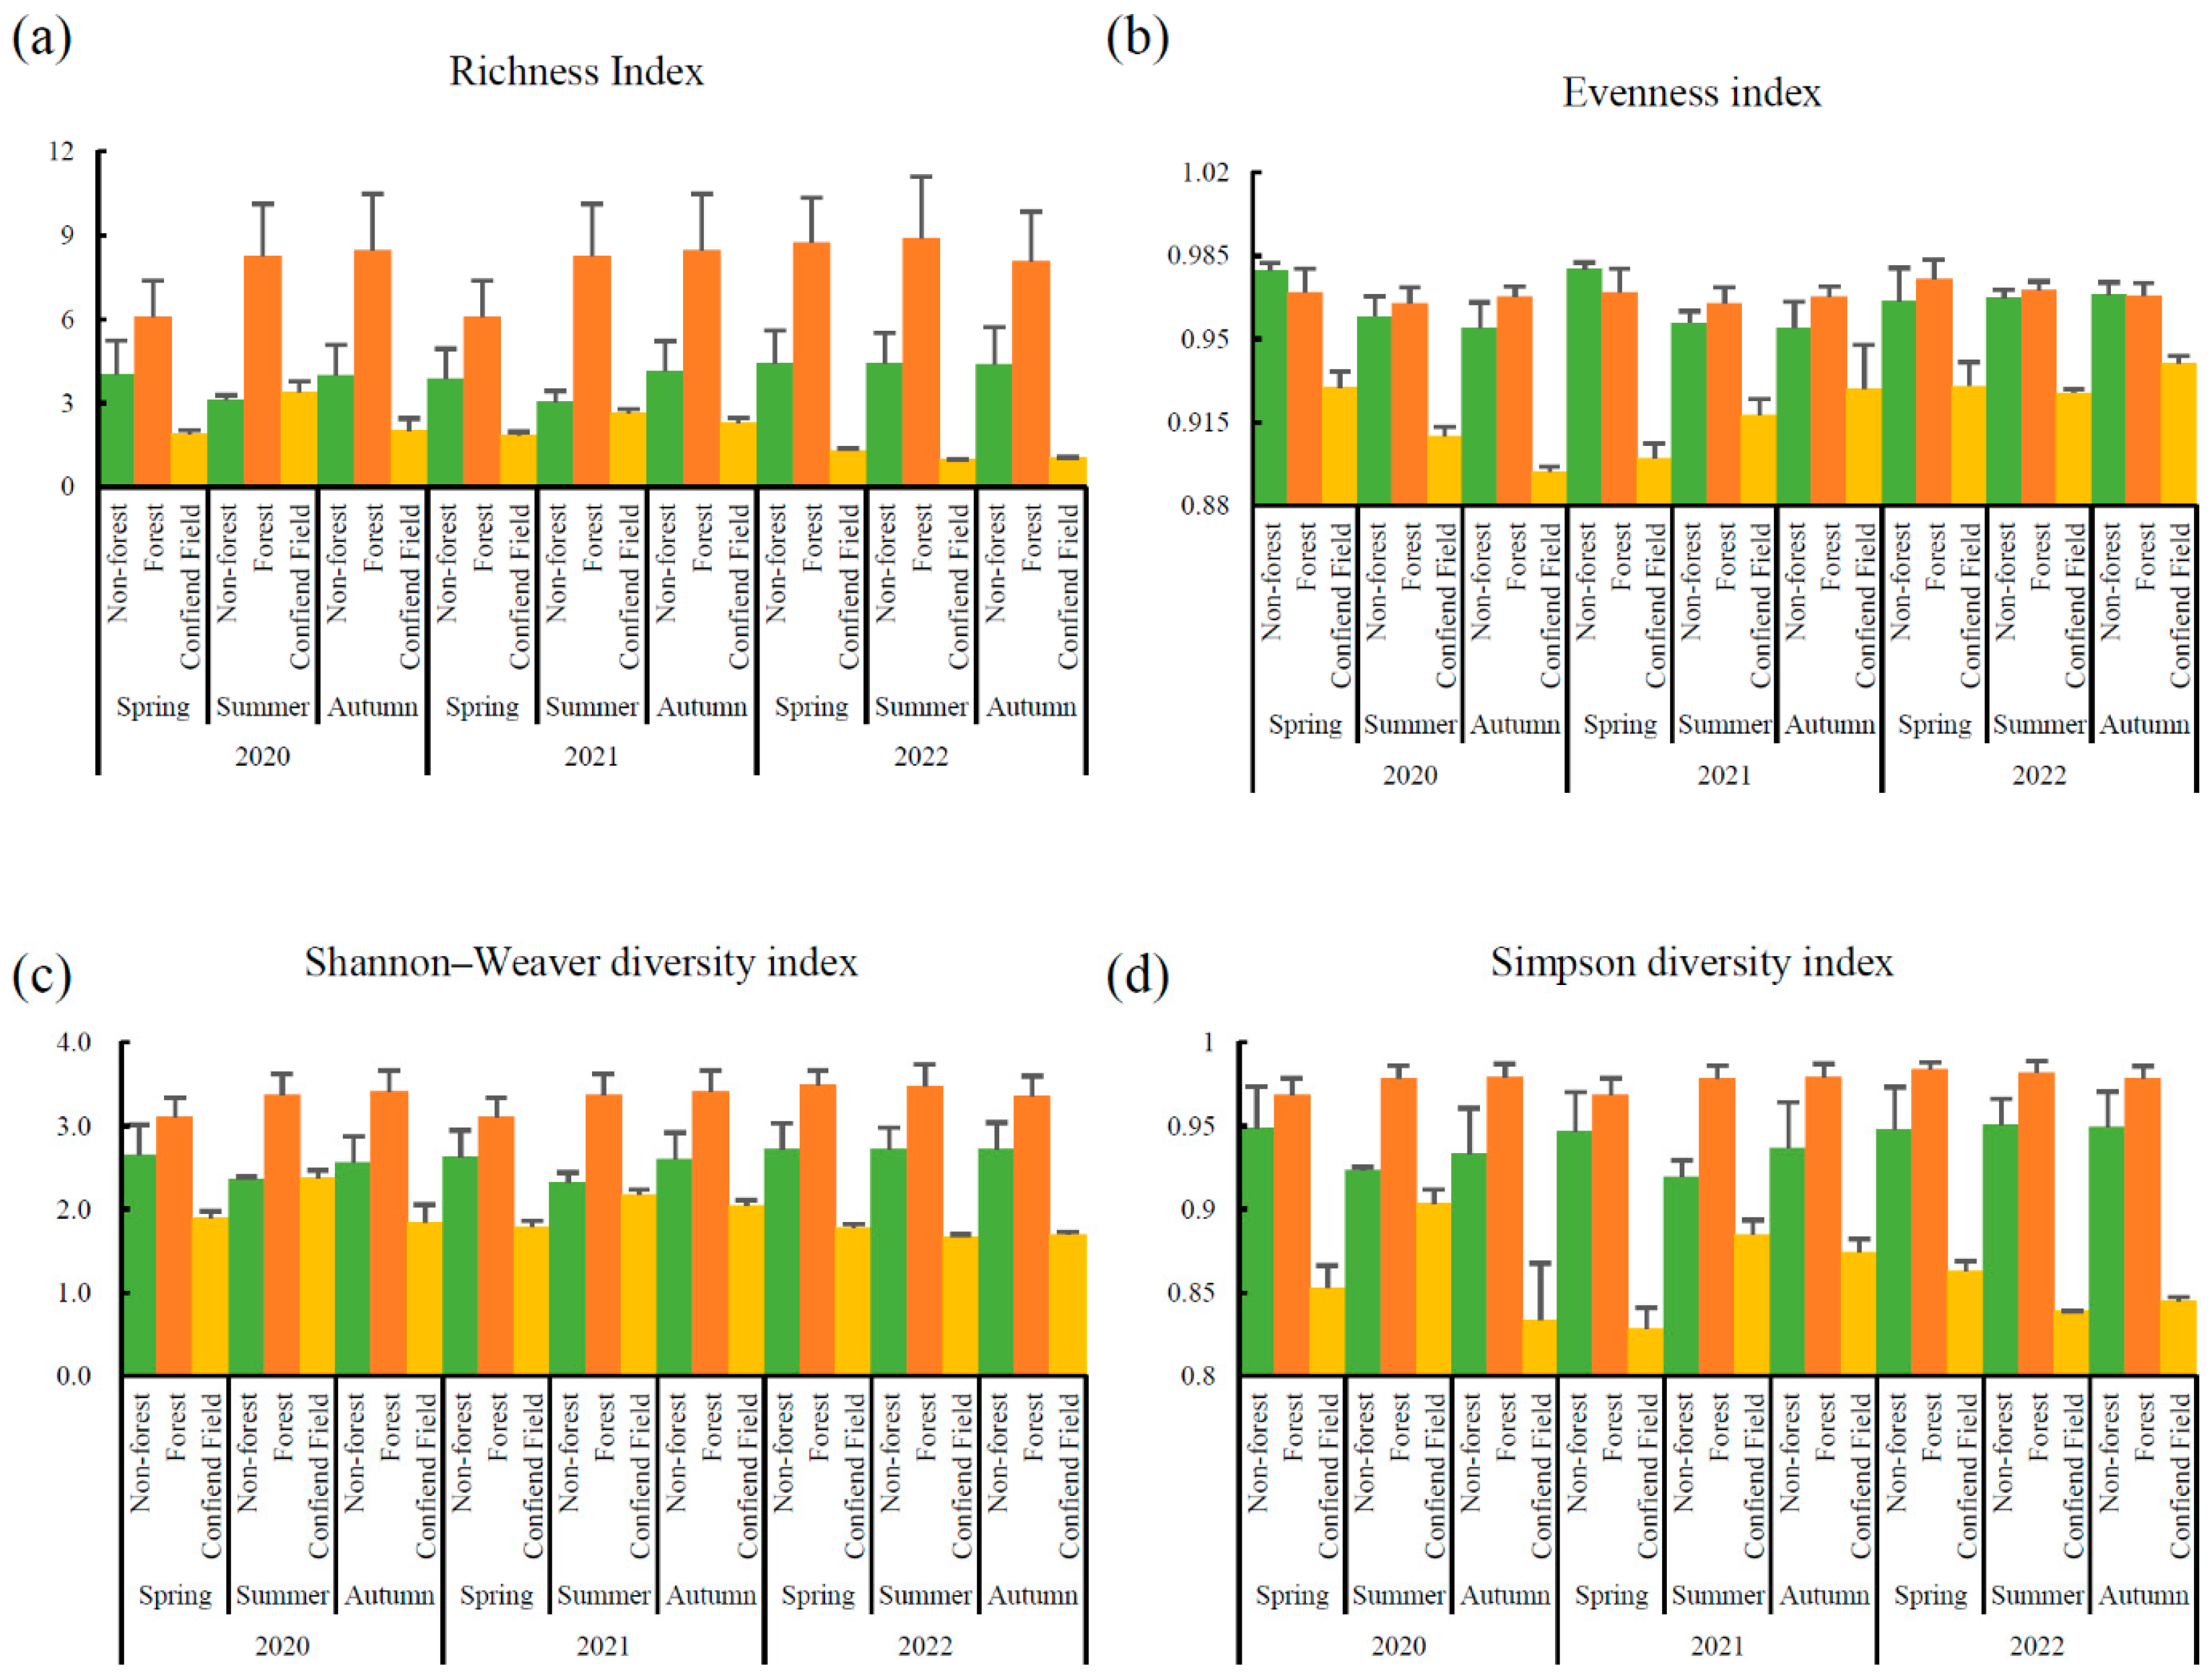
3.2. Unveiling Dynamic Species Diversity: Exploring Variations across Locations, Years, and Seasons
3.3. Discerning Variations in Plant Importance across Seasons, Distances, and Locations: Implications for LMO Confined Field Management
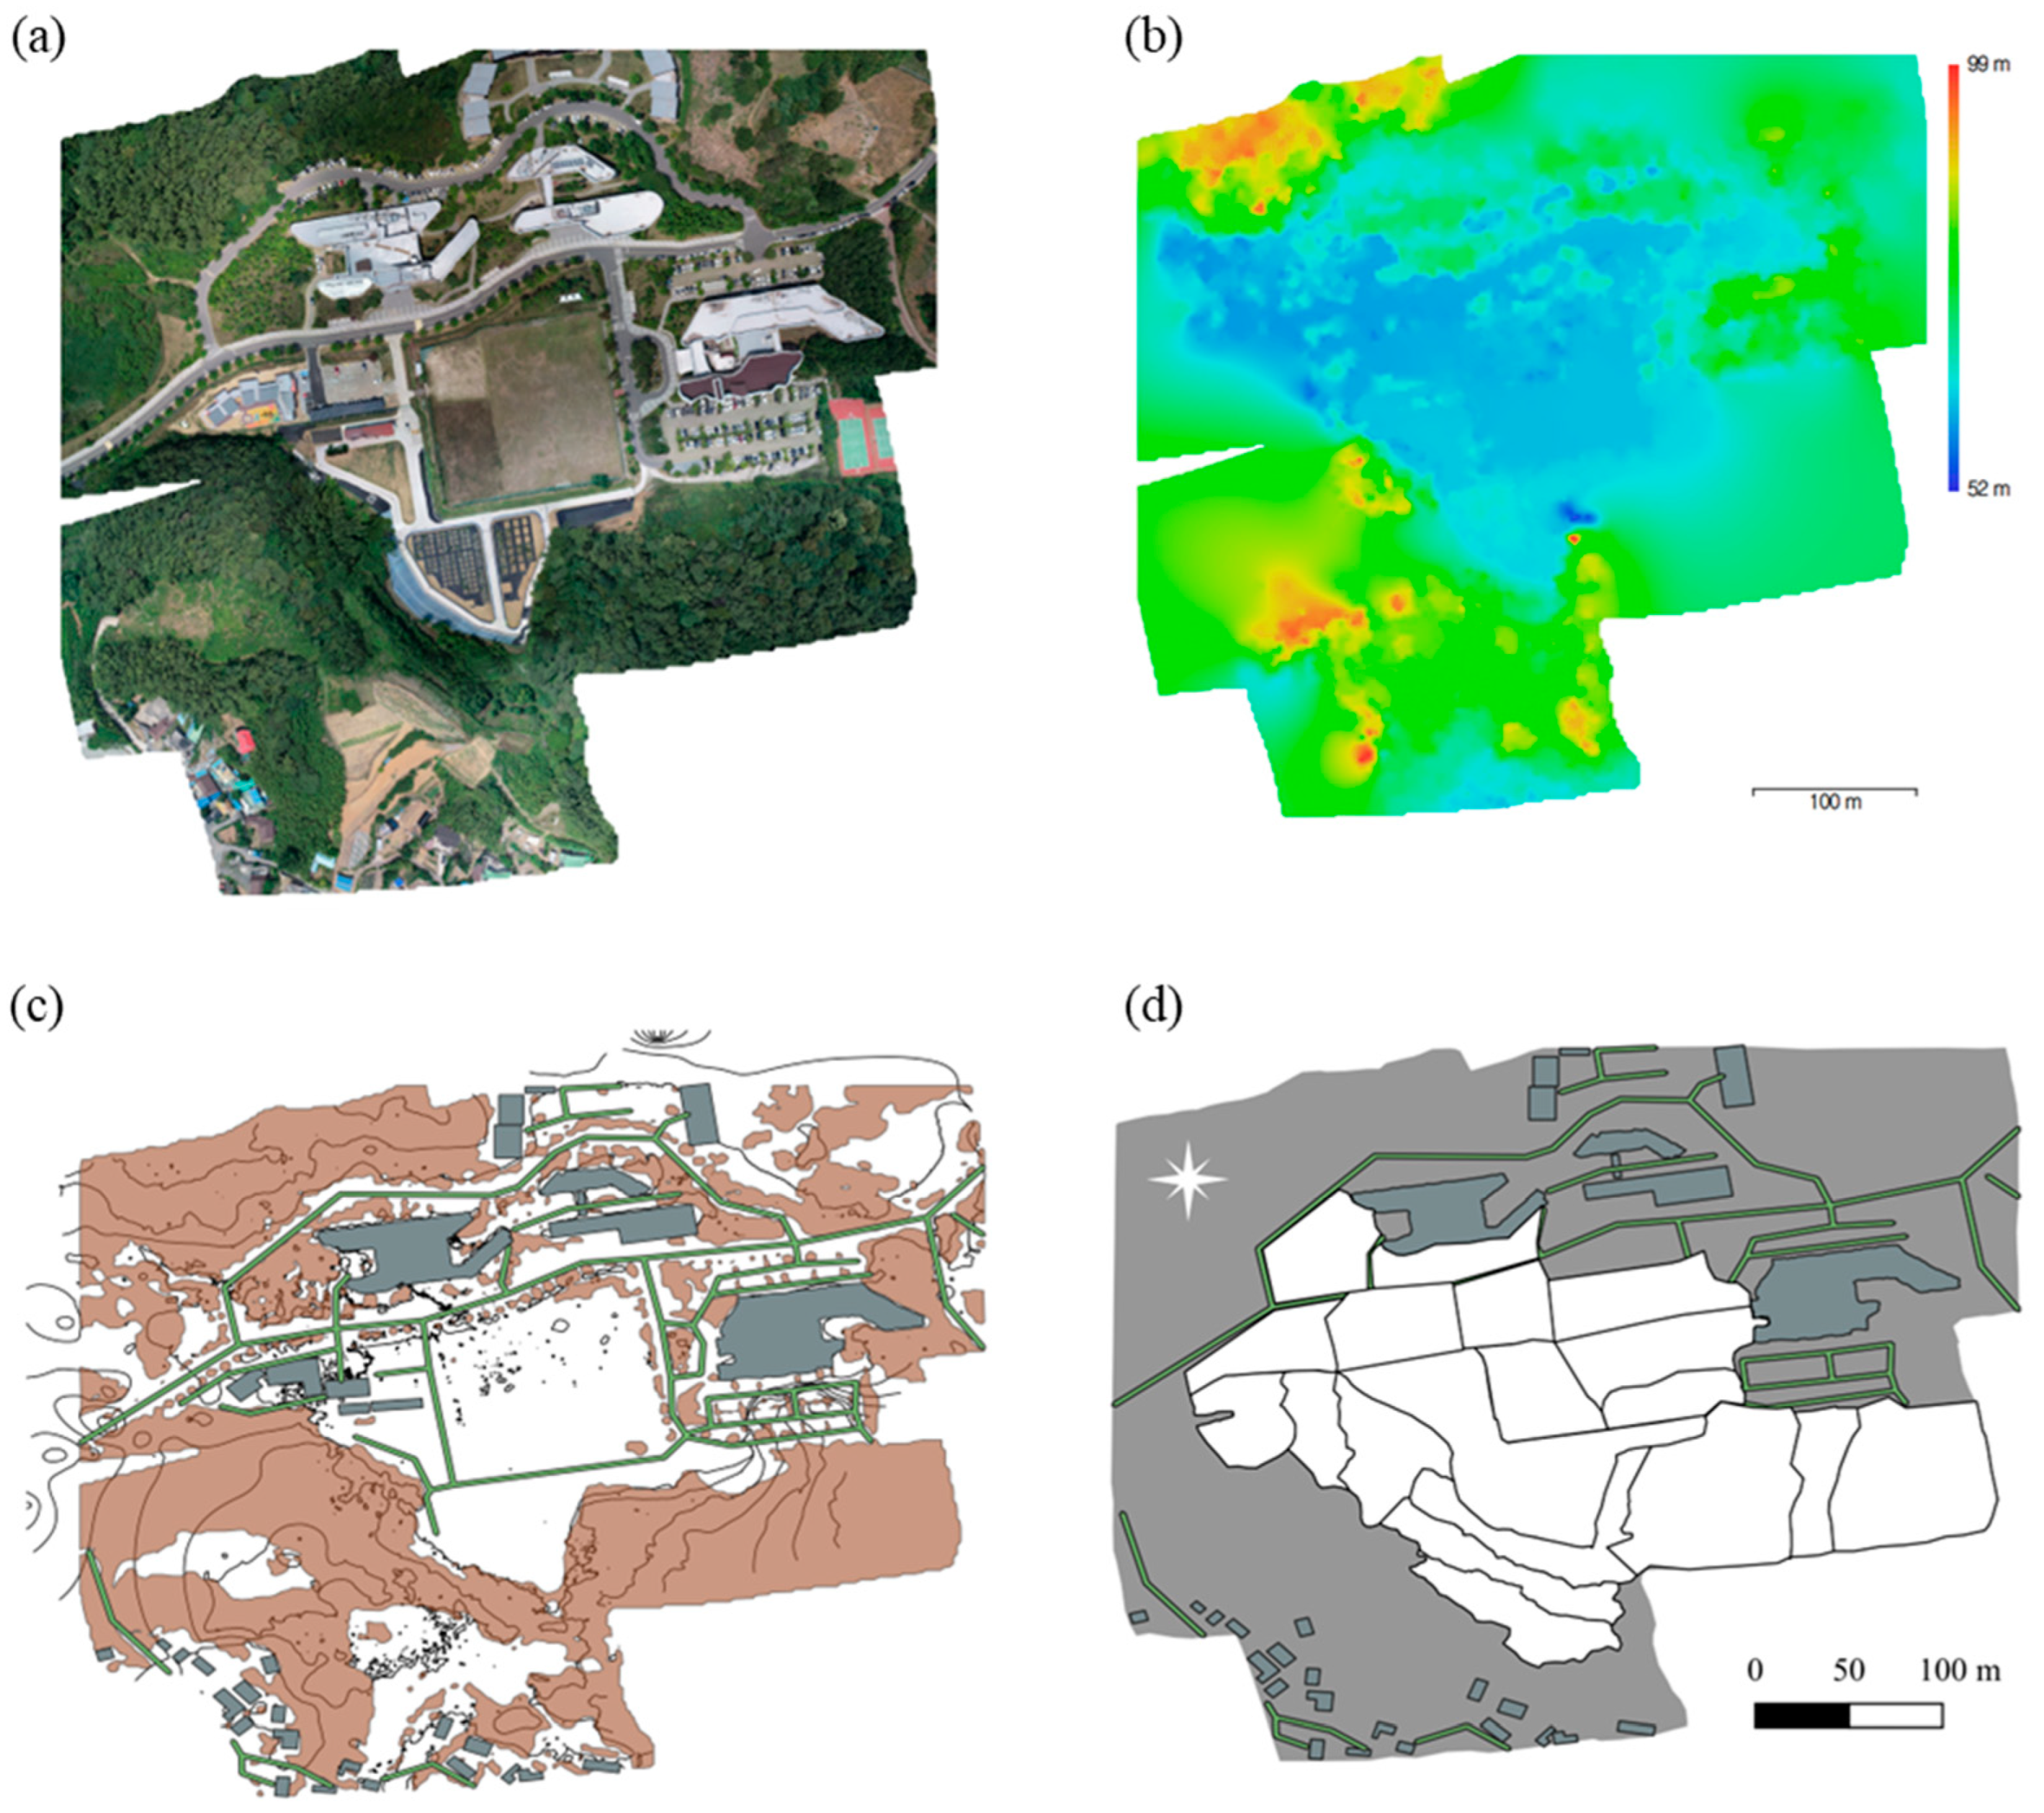
3.4. Aerial Reconnaissance for Precise Data Acquisition: Capturing Imagery at 150 m Altitude over 31.65 Hectares Using Drones
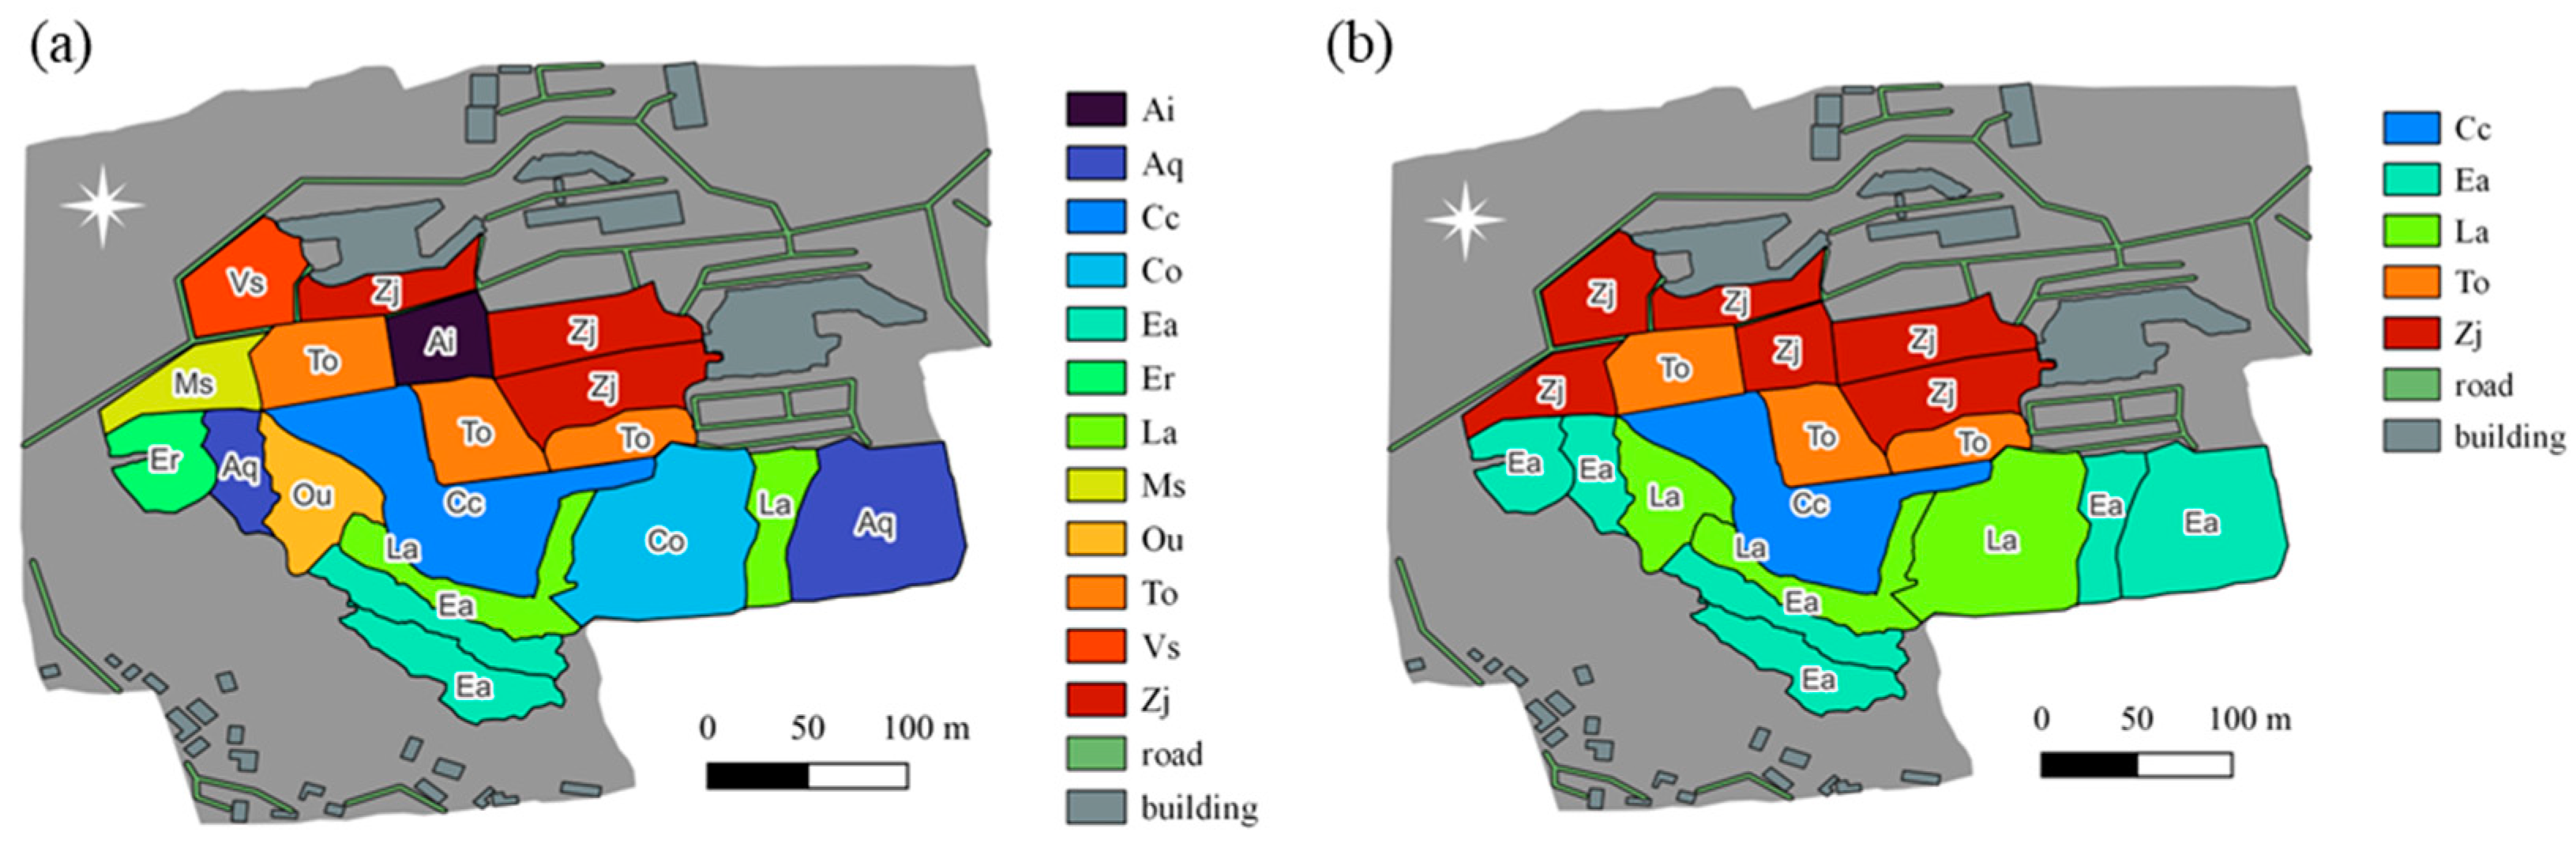
3.5. Elevating Vegetation Monitoring with Drones: Real-Time Insights and Species Dominance Mapping
4. Conclusions
Author Contributions
Funding
Institutional Review Board Statement
Informed Consent Statement
Data Availability Statement
Acknowledgments
Conflicts of Interest
References
- James, C. Global Status of Commercialized Biotech; GM Crops, 55l; ISAAA: Ithaca, NY, USA, 2019. [Google Scholar]
- Raybould, A. Ecological versus ecotoxicological methods for assessing the environmental risks of transgenic crops. Plant. Sci. 2007, 173, 589–602. [Google Scholar] [CrossRef]
- Prakash, D.; Verma, S.; Bhatia, R.; Tiwary, B.N. Risks and precautions of genetically modified organisms. Int. Sch. Res. Not. Ecol. 2011, 2011, 369573. [Google Scholar]
- Paoletti, C.; Flamm, E.; Yan, W.; Meek, S.; Renckens, S.; Fellous, M.; Kuiper, H. GMO risk assessment around the world: Some examples. Trends. Food. Sci. Technol. 2008, 19, S70–S78. [Google Scholar] [CrossRef]
- Alexandrova, N.; Georgieva, K.; Atanassov, A. Biosafety regulations of GMOs: National and international aspects and regional cooperation. Biotechnol. Equip. 2005, 19, 153–172. [Google Scholar] [CrossRef]
- EFSA Panel on Genetically Modified Organisms (GMO). Guidance on the environmental risk assessment of genetically modified plants. EFSA J. 2010, 8, 1879. [Google Scholar] [CrossRef]
- Züghart, W.; Benzler, A.; Berhorn, F.; Sukopp, U.; Graef, F. Determining indicators, methods and sites for monitoring potential adverse effects of genetically modified plants to the environment: The legal and conceptional framework for implementation. Euphytica 2008, 164, 845–852. [Google Scholar] [CrossRef]
- Chandler, S.; Dunwell, J.M. Gene flow, risk assessment and the environmental release of transgenic plants. Crit. Rev. Plant. Sci. 2008, 27, 25–49. [Google Scholar] [CrossRef]
- Dale, P.J.; Clarke, B.; Fontes, E.M. Potential for the environmental impact of transgenic crops. Nat. Biotechnol. 2002, 20, 567–574. [Google Scholar] [CrossRef]
- Morris, E.K.; Caruso, T.; Buscot, F.; Fischer, M.; Hancock, C.; Maier, T.S.; Meiners, T.; Müller, C.; Obermaier, E.; Prati, D.; et al. Choosing and using diversity indices: Insights for ecological applications from the German biodiversity exploratories. Ecol. Evol. 2014, 4, 3514–3524. [Google Scholar] [CrossRef]
- Esposito, M.; Crimaldi, M.; Cirillo, V.; Sarghini, F.; Maggio, A. Drone and sensor technology for sustainable weed management: A review. Chem. Biol. Technol. Agric. 2021, 8, 18. [Google Scholar] [CrossRef]
- Bhatnagar, S.; Gill, L.; Ghosh, B. Drone Image Segmentation Using Machine and Deep Learning for Mapping Raised Bog Vegetation Communities. Remote Sens. 2020, 12, 2602. [Google Scholar] [CrossRef]
- Olson, D.; Chatterjee, A.; Franzen, D.W.; Day, S.S. Relationship of Drone-Based Vegetation Indices with Corn and Sugarbeet Yields. Agron. J. 2019, 111, 2545–2557. [Google Scholar] [CrossRef]
- Traba, J.; Gómez-Catasús, J.; Barrero, A.; Bustillo-de la Rosa, D.; Zurdo, J.; Hervás, I.; Pérez-Granados, C.; García De la Morena, E.L.; Santamaría, A.; Reverter, M. Comparative assessment of satellite-and drone-based vegetation indices to predict arthropod biomass in shrub-steppes. Ecol. Appl. 2022, 32, e2707. [Google Scholar] [CrossRef] [PubMed]
- Bolch, E.A.; Hestir, E.L.; Khanna, S. Performance and Feasibility of Drone-Mounted Imaging Spectroscopy for Invasive Aquatic Vegetation Detection. Remote Sens. 2021, 13, 582. [Google Scholar] [CrossRef]
- Martinez, J.L.; Lucas-Borja, M.E.; Plaza-Alvarez, P.A.; Denisi, P.; Moreno, M.A.; Hernández, D.; González-Romero, J.; Zema, D.A. Comparison of Satellite and Drone-Based Images at Two Spatial Scales to Evaluate Vegetation Regeneration after Post-Fire Treatments in a Mediterranean Forest. Appl. Sci. 2021, 11, 5423. [Google Scholar] [CrossRef]
- Schad, L.; Fischer, J. Opportunities and risks in the use of drones for studying animal behavior. Methods Ecol. Evol. 2022, 14, 1864–1872. [Google Scholar] [CrossRef]
- Raoult, V.; Colefax, A.P.; Allan, B.M.; Cagnazzi, D.; Castelblanco-Martínez, D.; Ierodiaconou, D.; Johnston, D.W.; Landeo-Yauri, S.; Lyons, M.B.; Pirotta, V.; et al. Operational Protocols for the Use of Drones in Marine Animal Research. Drones 2020, 4, 64. [Google Scholar] [CrossRef]
- Li, X.; Huang, H.; Savkin, A.V. Autonomous Navigation of an Aerial Drone to Observe a Group of Wild Animals With Reduced Visual Disturbance. IEEE Syst. J. 2022, 16, 3339–3348. [Google Scholar] [CrossRef]
- Li, X.; Huang, H.; Savkin, A.V.; Zhang, J. Robotic Herding of Farm Animals Using a Network of Barking Aerial Drones. Drones 2022, 6, 29. [Google Scholar] [CrossRef]
- Vayssade, J.-A.; Arquet, R.; Bonneau, M. Automatic activity tracking of goats using drone camera. Comput. Electron. Agric. 2019, 162, 767–772. [Google Scholar] [CrossRef]
- Ivanova, S.; Prosekov, A.; Kaledin, A. A Survey on Monitoring of Wild Animals during Fires Using Drones. Fire 2022, 5, 60. [Google Scholar] [CrossRef]
- Corbau, C.; Buoninsegni, J.; Olivo, E.; Vaccaro, C.; Nardin, W.; Simeoni, U. Understanding through drone image analysis the interactions between geomorphology, vegetation and marine debris along a sandy spit. Mar. Pollut. Bull. 2023, 187, 114515. [Google Scholar] [CrossRef] [PubMed]
- NIBR. National List of Species of Korea; National Institute of Biological Resources: Incheon, Republic of Korea, 2020. Available online: https://www.kbr.go.kr/jfile/readDownloadFile.do?fileId=ARTICLE_1657&fileSeq=1 (accessed on 16 August 2023).
- Han, S.M.; Nam, K.H. Assessing the potential invasiveness of transgenic plants in South Korea: A three-year case study on sunflowers. J. Ecol. Environ. 2022, 46, 19. [Google Scholar] [CrossRef]
- Braun-Blanquet, J. Pflanzensociologie; Springer: Wien, Austria, 1964. [Google Scholar]
- Pielou, E.C. Shannon’s formula as a measure of specific diversity: Its use and misuse. Am. Nat. 1966, 100, 463–465. [Google Scholar] [CrossRef]
- Simpson, E.H. Measurement of diversity. Nature 1949, 163, 688. [Google Scholar] [CrossRef]
- Marglef, D.R. Information theory in ecology. Gen. Syst. 1958, 3, 36–71. [Google Scholar]
- Pielou, E.C. Ecological Diversity; Wiley Interscience: New York, NY, USA, 1975. [Google Scholar]
- Gazol, A.; Tamme, R.; Takkis, K.; Kasari, L.; Saar, L.; Helm, A.; Pärtel, M. Landscape- and small-scale determinants of grassland species diversity: Direct and indirect influences. Ecography 2012, 35, 944–951. [Google Scholar] [CrossRef]
- Šipoš, J.; Chudomelová, M.; Vild, O.; Macek, M.; Kopecký, M.; Szabó, P.; Hédl, R. Plant diversity in deciduous temperate forests reflects interplay among ancient and recent environmental stress. J. Veg. Sci. 2020, 31, 53–62. [Google Scholar] [CrossRef]
- Zhang, Y.; Chen, H.Y.H.; Taylor, A. Multiple drivers of plant diversity in forest ecosystems. Glob. Ecol. Biogeogr. 2014, 23, 885–893. [Google Scholar] [CrossRef]
- Ni, M.; Deane, D.C.; Li, S.; Wu, Y.; Sui, X.; Xu, H.; Chu, C.; He, F.; Fang, S. Invasion success and impacts depend on different characteristics in non-native plants. Divers. Distrib. 2021, 27, 1194–1207. [Google Scholar] [CrossRef]
- Fawcett, D.; Panigada, C.; Tagliabue, G.; Boschetti, M.; Celesti, M.; Evdokimov, A.; Biriukova, K.; Colombo, R.; Miglietta, F.; Rascher, U.; et al. Multi-scale evaluation of drone-based multispectral surface reflectance and vegetation indices in operational conditions. Remote Sens. 2020, 12, 514. [Google Scholar] [CrossRef]
- Ruwaimana, M.; Satyanarayana, B.; Otero, V.; Muslim, A.M.; Syafiq A, M.; Ibrahim, S.; Raymaekers, D.; Koedam, N.; Dahdouh-Guebas, F. The advantages of using drones over space-borne imagery in the mapping of mangrove forests. PLoS ONE 2018, 13, e0200288. [Google Scholar] [CrossRef] [PubMed]
- Kedia, A.C.; Kapos, B.; Liao, S.; Draper, J.; Eddinger, J.; Updike, C.; Frazier, A.E. An integrated spectral–structural workflow for invasive vegetation mapping in an arid region using drones. Drones 2021, 5, 19. [Google Scholar] [CrossRef]
- Resop, J.P.; Lehmann, L.; Hession, W.C. Drone Laser Scanning for Modeling Riverscape Topography and Vegetation: Comparison with Traditional Aerial Lidar. Drones 2019, 3, 35–49. [Google Scholar] [CrossRef]
- Von Bueren, S.K.; Burkart, A.; Hueni, A.; Rascher, U.; Tuohy, M.P.; Yule, I. Deploying four optical UAV-based sensors over grassland: Challenges and limitations. Biogeosciences 2015, 12, 163–175. [Google Scholar] [CrossRef]
- Borgogno Mondino, E.; Gajetti, M. Preliminary considerations about costs and potential market of remote sensing from UAV in the Italian viticulture context. Eur. J. Remote Sens. 2017, 50, 310–319. [Google Scholar] [CrossRef]


| Location | Year | Plant Growth Form (%) | Life Form (%) | Origin (%) | ||||||||||
|---|---|---|---|---|---|---|---|---|---|---|---|---|---|---|
| Herb | Shrub /Tree | Tree | Shrub | Herb /Shrub | Graminoid | Fern | Annual | Annual /Biennial | Biennial | Perennial | Native Plant | Non -Native Plant | ||
| Confined field | 2020 | 50.0 | 0 | 0 | 4.5 | 0 | 27.3 | 4.5 | 52.4 | 19.0 | 0 | 28.6 | 76.2 | 23.8 |
| 2021 | 52.4 | 0 | 4.8 | 4.8 | 4.8 | 19.0 | 0 | 40.0 | 15.0 | 5.0 | 40.0 | 70.0 | 30.0 | |
| 2022 | 41.7 | 0 | 8.3 | 8.3 | 8.3 | 8.3 | 0 | 45.5 | 9.1 | 0 | 45.5 | 63.6 | 36.4 | |
| Forest 25 m | 2020 | 35.9 | 1.3 | 6.4 | 11.5 | 1.3 | 10.3 | 7.7 | 23.4 | 3.9 | 1.3 | 71.4 | 85.7 | 14.3 |
| 2021 | 22.1 | 0 | 8.8 | 14.7 | 0 | 7.4 | 1.5 | 7.6 | 12.1 | 0 | 80.3 | 97.0 | 3.0 | |
| 2022 | 37.7 | 0 | 3.8 | 13.2 | 0 | 11.3 | 7.5 | 30.8 | 7.7 | 0 | 61.5 | 88.5 | 11.5 | |
| Forest 50 m | 2020 | 25.6 | 0 | 7.0 | 11.6 | 2.3 | 16.3 | 11.6 | 20.4 | 5.6 | 1.9 | 72.2 | 90.7 | 9.3 |
| 2021 | 22.0 | 0 | 10.0 | 16.0 | 2.0 | 16.0 | 8.0 | 21.4 | 4.8 | 2.4 | 71.4 | 92.9 | 7.1 | |
| 2022 | 22.0 | 0 | 10.0 | 16.0 | 2.0 | 16.0 | 8.0 | 16.3 | 4.1 | 0 | 79.6 | 93.9 | 6.1 | |
| Forest 100 m | 2020 | 36.1 | 0 | 3.3 | 9.8 | 3.3 | 18.0 | 8.2 | 28.8 | 5.1 | 1.7 | 64.4 | 84.7 | 15.3 |
| 2021 | 36.5 | 0 | 3.2 | 14.3 | 3.2 | 12.7 | 3.2 | 33.9 | 3.2 | 3.2 | 59.7 | 88.7 | 11.3 | |
| 2022 | 46.9 | 0 | 3.1 | 10.9 | 1.6 | 14.1 | 3.1 | 30.2 | 4.8 | 4.8 | 60.3 | 84.1 | 15.9 | |
| Non-Forest 25 m | 2020 | 63.4 | 0 | 0 | 0 | 0 | 24.4 | 2.4 | 47.5 | 7.5 | 7.5 | 37.5 | 62.5 | 37.5 |
| 2021 | 67.7 | 0 | 0 | 0 | 3.2 | 12.9 | 3.2 | 33.3 | 3.3 | 13.3 | 50.0 | 73.3 | 26.7 | |
| 2022 | 63.4 | 0 | 2.4 | 2.4 | 2.4 | 19.5 | 2.4 | 50.0 | 2.5 | 7.5 | 40.0 | 62.5 | 37.5 | |
| Non-Forest 50 m | 2020 | 62.5 | 0 | 0 | 3.1 | 0 | 12.5 | 3.1 | 38.7 | 3.2 | 6.5 | 51.6 | 61.3 | 38.7 |
| 2021 | 66.7 | 0 | 0 | 4.8 | 0 | 14.3 | 4.8 | 45.0 | 5.0 | 5.0 | 45.0 | 70.0 | 30.0 | |
| 2022 | 63.0 | 0 | 3.7 | 0 | 3.7 | 18.5 | 3.7 | 34.6 | 3.8 | 7.7 | 53.8 | 61.5 | 38.5 | |
| Non-Forest 100 m | 2020 | 47.4 | 0 | 2.6 | 0 | 0 | 31.6 | 0 | 45.9 | 2.7 | 8.1 | 43.2 | 62.2 | 37.8 |
| 2021 | 62.5 | 0 | 0 | 0 | 0 | 20.8 | 0 | 39.1 | 0 | 4.3 | 56.5 | 65.2 | 34.8 | |
| 2022 | 51.5 | 0 | 3.0 | 0 | 0 | 21.2 | 3.0 | 37.5 | 3.1 | 3.1 | 56.3 | 65.6 | 34.4 | |
| Source | DF | Richness Index | Evenness Index | Shannon Diversity Index | Simpson Diversity Index | ||||
|---|---|---|---|---|---|---|---|---|---|
| F | p | F | p | F | p | F | p | ||
| Year | 2 | 0.95 | 0.393 | 11.71 | <0.001 | 0.77 | 0.466 | 0.20 | 0.818 |
| Location | 2 | 160.89 | <0.001 | 330.15 | <0.001 | 254.93 | <0.001 | 415.33 | <0.001 |
| Season | 2 | 1.59 | 0.213 | 5.72 | 0.006 | 0.66 | 0.523 | 1.17 | 0.318 |
| Year × Location | 4 | 1.31 | 0.279 | 4.33 | 0.004 | 2.12 | 0.091 | 2.69 | 0.041 |
| Year × Season | 4 | 0.93 | 0.456 | 6.01 | <0.001 | 1.06 | 0.385 | 2.92 | 0.029 |
| Location × Season | 4 | 2.07 | 0.097 | 2.87 | 0.032 | 2.97 | 0.027 | 5.26 | 0.001 |
| Year × Location × Season | 8 | 0.73 | 0.666 | 5.86 | <0.001 | 1.43 | 0.207 | 4.35 | <0.001 |
Disclaimer/Publisher’s Note: The statements, opinions and data contained in all publications are solely those of the individual author(s) and contributor(s) and not of MDPI and/or the editor(s). MDPI and/or the editor(s) disclaim responsibility for any injury to people or property resulting from any ideas, methods, instructions or products referred to in the content. |
© 2023 by the authors. Licensee MDPI, Basel, Switzerland. This article is an open access article distributed under the terms and conditions of the Creative Commons Attribution (CC BY) license (https://creativecommons.org/licenses/by/4.0/).
Share and Cite
Han, S.M.; Lee, J.R.; Nam, K.-H. Drone-Based Monitoring and Mapping for LMO Confined Field Management under the Ministry of Environment. Appl. Sci. 2023, 13, 10627. https://doi.org/10.3390/app131910627
Han SM, Lee JR, Nam K-H. Drone-Based Monitoring and Mapping for LMO Confined Field Management under the Ministry of Environment. Applied Sciences. 2023; 13(19):10627. https://doi.org/10.3390/app131910627
Chicago/Turabian StyleHan, Sung Min, Jung Ro Lee, and Kyong-Hee Nam. 2023. "Drone-Based Monitoring and Mapping for LMO Confined Field Management under the Ministry of Environment" Applied Sciences 13, no. 19: 10627. https://doi.org/10.3390/app131910627
APA StyleHan, S. M., Lee, J. R., & Nam, K.-H. (2023). Drone-Based Monitoring and Mapping for LMO Confined Field Management under the Ministry of Environment. Applied Sciences, 13(19), 10627. https://doi.org/10.3390/app131910627