1. Introduction
Over the past decade, the graphical user interface (GUI) has proven to be the most promising component in the software development lifecycle due to the user-friendly interactions and experiences it provides. In addition, it is an essential component of most of today’s software programs [
1]. However, it is crucial to test graphical user interfaces (GUIs) to assure system dependability, which is essential for maintaining the operation of software products and the satisfaction of end users [
2]. GUI testing entails performing a methodical analysis of the user interface’s graphical elements, interactive components, and visual design to verify that it satisfies the criteria and functionalities outlined as intended [
3]. Commonly, various techniques, such as manual-based, record-and-replay, and model-based, are employed for GUI testing [
4]. However, the traditional manual testing methodologies for GUIs exhibit certain limitations regarding efficiency, coverage, and scalability as the complexity of the software system increases [
5]. To overcome these issues, significant efforts have been made to integrate machine learning (ML) techniques, including decision tree (DC), random forest (RF), support vector machine (SVM), etc., with GUI testing. This integration has the capacity to enhance testing methodologies, improve accuracy, and hasten the identification of defects, thus improving the GUI’s performance [
6].
The creation of automated testing processes, such as watir, jmeter, selenium, etc., that can learn from historical data, adapt to changing software environments, and provide valuable insights to developers and testers is enabled through ML algorithms [
7]. One of the primary benefits of using ML in GUI testing is that it improves the testers’ ability to effectively manage large-scale and complicated GUI designs [
8]. However, conventional testing approaches cannot readily accommodate the extensive design space and diverse user interactions that modern applications demand [
9,
10]. The recurring patterns of user behavior and interactions might be automatically taught by the machine learning algorithms, which would facilitate more complete testing coverage without the need for operator involvement [
11,
12]. Additionally, the use of ML makes it possible for GUI testing to develop dynamically with the program, reacting to changes in the GUI as well as the associated functionality [
13]. However, ML algorithms depend heavily on sufficient and representative training data; insufficient data can cause suboptimal testing outcomes that limit the system’s consistency [
14]. To resolve this issue, this study proposes a novel framework called “Finite state testing for GUI with test case prioritization using ZScore-Bald Eagle Search (Z-BES) and Gini Kernel-Gated recurrent unit (GK-GRU)” that effectively satisfies the user requirements.
1.1. Problem Statement
The prevailing limitations of this research include:
Conventional methods often lack the adaptability to handle complex software, resulting in insufficient coverage of high-risk areas.
Prevailing approaches uncover the hidden flaws and unintended behaviors in complex software systems.
When dealing with intricate and extensive GUI designs, existing approaches exhibit limited scalability.
1.2. Objectives
The Z-BES algorithm prioritizes the test cases, focusing on critical areas and efficiently allocating resources for better issue resolution.
The STD visualization provides a comprehensive understanding of system behavior, helping identify gaps and ensuring alignment with expectations.
The utilization of RL and fuzzy logic enables accurate labeling of test case outcomes, improving overall evaluation precision.
2. Related Literature Survey
A previously proposed automatic simulation-based testing approach [
15] combined domain expert knowledge and autonomous systems’ operating and environmental parameters. During the testing procedure, type-2 fuzzy logic was applied to facilitate the robust management of data uncertainty. The efficacy of this procedure was demonstrated experimentally. However, this strategy necessitated a significant time investment and resources and required specialized knowledge.
A testing technique for Android apps was also proposed that encompassed an app classifier, test scripting language, state graph modeler, activity classifier, and test adapter [
16]. The framework automated the customization of test scripts for different apps and activities. The empirical evaluation provided evidence that the classifiers’ performance was significantly above average. However, the usefulness of the framework was constrained to applications with intricate user interfaces.
The YOLOv5 algorithm that enhanced the mobile app interface element recognition significantly improved the analysis accuracy and identification of minute components [
17]. The experimental findings confirmed its superiority in GUI element identification, demonstrating promise for future development in robot testing automation for mobile applications. However, due to the automated nature of the system, a potential for bias existed.
A test prioritization system grounded in the RL method for user interface testing has also been developed [
18]. The associated study sought to maximize the number of detected test defects while simultaneously lowering the necessary testing quantity. The findings demonstrated that the method successfully gained insightful knowledge of the test cases and the linkages between them. Despite this, the system had greater computing expenses, particularly when dealing with applications on a large scale.
A distributed state model inference approach for the GUI testing tool was proposed [
19]. The methodology that allowed for the inference of a centralized model made use of a distributed architectural framework. The experiment demonstrated the feasibility of using a model with a distributed approach and the lower time requirement compared with models that are not distributed. However, the system required a large amount of memory and computing power, leading to potential scalability restrictions. The systems, namely, interactive event-flow graphs, GUI-level guidance, and enhanced crowd testers’ coverage, have been previously described. The interactive event-flow graphs consolidated the interactions of the testers into a single directed graph, facilitating the visual evaluation of previously tested scenarios. In spite of this, the information that was provided through the interactive event-flow graphs was difficult to read and evaluate.
A deep learning (DL)-centric end-to-end trainable model for GUI similarity and isomorphic GUI identification was established [
20]. Visually identifying GUI items while using a DL was required to complete the task. Relative entropy was utilized to allow the measurement of variations in GUI. In addition, the comparison results demonstrated the efficiency of the method. However, the model’s performance was relatively sensitive to differences in the GUI design.
A distributed state model inference for scriptless GUI testing has been developed previosly. To conduct effective GUI tool testing, the procedure included empirical evaluation and an approach that did not require scripts. Therefore, the distributed system performed significantly better than the GUI validation test. The performance of the system was hindered by the exclusion of non-deterministic components in the model.
A previous study incorporated GUI modeling and test coverage analysis [
21]. In this work, the unified modeling language (UML) was utilized to structure the GUI components. The test cases were then automatically generated from the UML models and underwent test coverage analysis, efficiently achieving GUI testing based on user perspectives. However, this model required extensive testing time.
An automated GUI functional test was presented based on Simplified Swarm Optimization (SSO) [
22]. SSO established the relevant test cases to implement the GUI testing. Moreover, an event-interaction graph (EIG) was created to determine the optimal testing for the GUI tools. This system retained the effective performance of GUI testing but exhibited local optimization issues.
Thus, previous research reveals that GUI testing is generally performed via ML and DL models. Models tend to sustain better performance in GUI testing and fault identification to attract users. However, many traditional models face certain challenges, including a lack of data analytics, inefficiency due to variations, massive memory requirements, loss of power, high computational complexity, and limited resources. These types of drawbacks mainly affect the testing outcomes and cause poor performance. Hence, the proposed system focuses on test case prioritizing-based GUI testing, which can more efficiently address the common limitations of traditional models. The proposed work effectively satisfies user requirements by utilizing well-organized frameworks, such as GK-GRU and Z-BES.
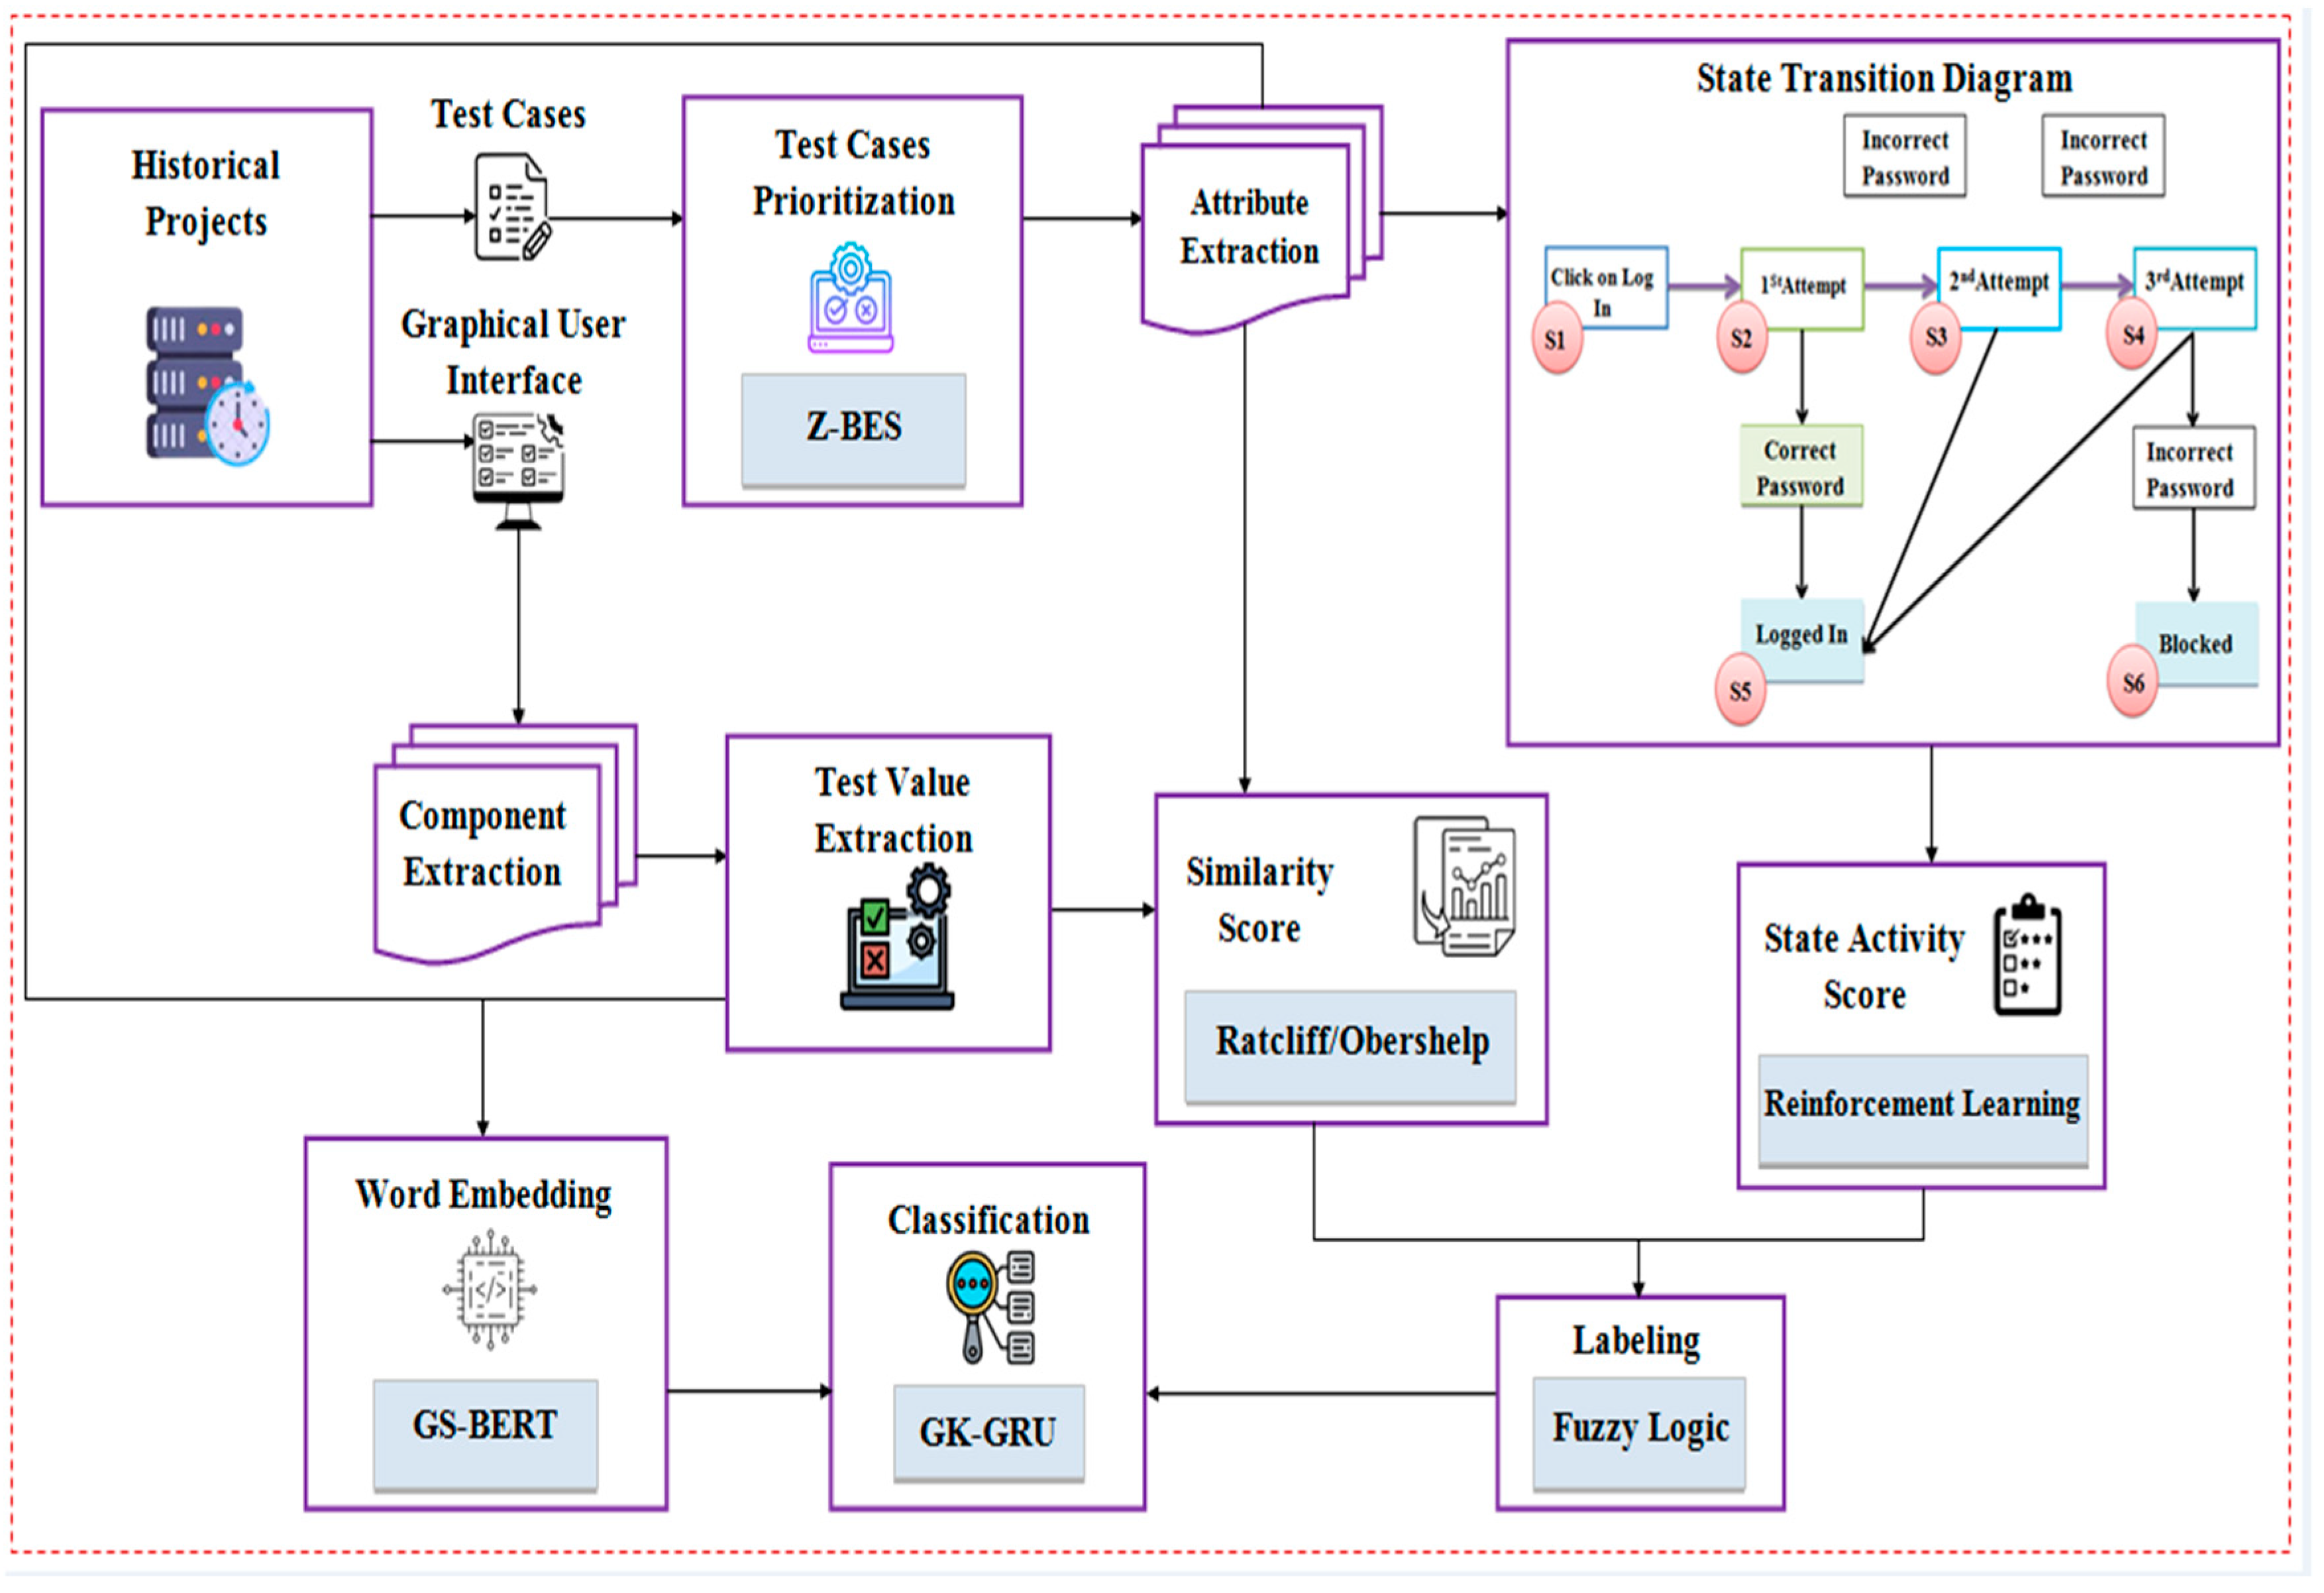
3. Proposed Methodology
The proposed technique aims to identify potential mismatches between GUI designs and test cases, ultimately determining whether the GUI meets the requirements which is shown in
Figure 1.
3.1. Historical Projects
The historical project dataset was gathered, comprising the GUI files, test cases, and logs of past testing activities.
3.1.1. Test Cases
Test cases (
Tc), which outline the steps and expected results when testing the software, are predefined scenarios. Test cases (
Tc) are represented as follows:
where
Rq specifies the requirements,
S signifies scenarios,
St exemplifies outline steps, and
Eout implies the expected outcomes.
3.1.2. Test Case Prioritization
The Tc are prioritized based on their importance and potential impact on the project. By prioritizing Tc, testing efforts are concentrated on areas most likely to impact the project’s success. The Tc is prioritized by Z-BES. The BES algorithm achieves optimum solutions with a low number of repetitions. However, due to the influence of mean calculations, the BES algorithm cannot readily determine the optimal areas. The utilization of the mean may not be appropriate for distributions that exhibit significant skewness, which might result in delayed convergence. To mitigate this, the ZScore technique is introduced.
Selecting Stage
The Bald Eagle test population (test cases
is represented as:
The fitness function (high prioritized
is then defined as follows:
During hunting, the
selects the optimal spot within a chosen search area, which is expressed as follows:
where
specifies a random number from 0 to 1,
is the parameter that controls the position changes,
implies the new position,
symbolizes the best location,
represents the
position of all
,
delineates the current position of the
,
is the mean of the
, and
is the standard deviation of the
.
Searching Stage
assesses prey within the chosen search area during this phase. The optimal position
is defined as follows:
where
implies the next position of the
, and
and
signify scaling factors.
Swooping Stage
The
moves toward its target prey from the optimal position in the search space:
here,
and
are the controlling parameters. Therefore, the
is represented as:
The pseudo-code for Z-BEO is presented in Algorithm 1 as follows:
| Algorithms 1 Pseudo-code for Z-BEO |
Input: Test cases
Output: High Prioritized Test Case
Begin
Initialize
Calculate
For i = 1 to Maxi do
Select the search space using
Search the prey in the search space using
Swoop the prey with
If
Return
Else
i = i + 1
End If
End For
End |
3.1.3. Attribute Extraction
The important attributes, namely test case ID, test date, version, prerequisites, form name, test data, test scenario, testcase description, step details, expected result, actual result, and customer assigned priority, are extracted from the
. The extracted attributes
provide context and information about each test case and are defined as:
where
denotes the maximum number of attributes.
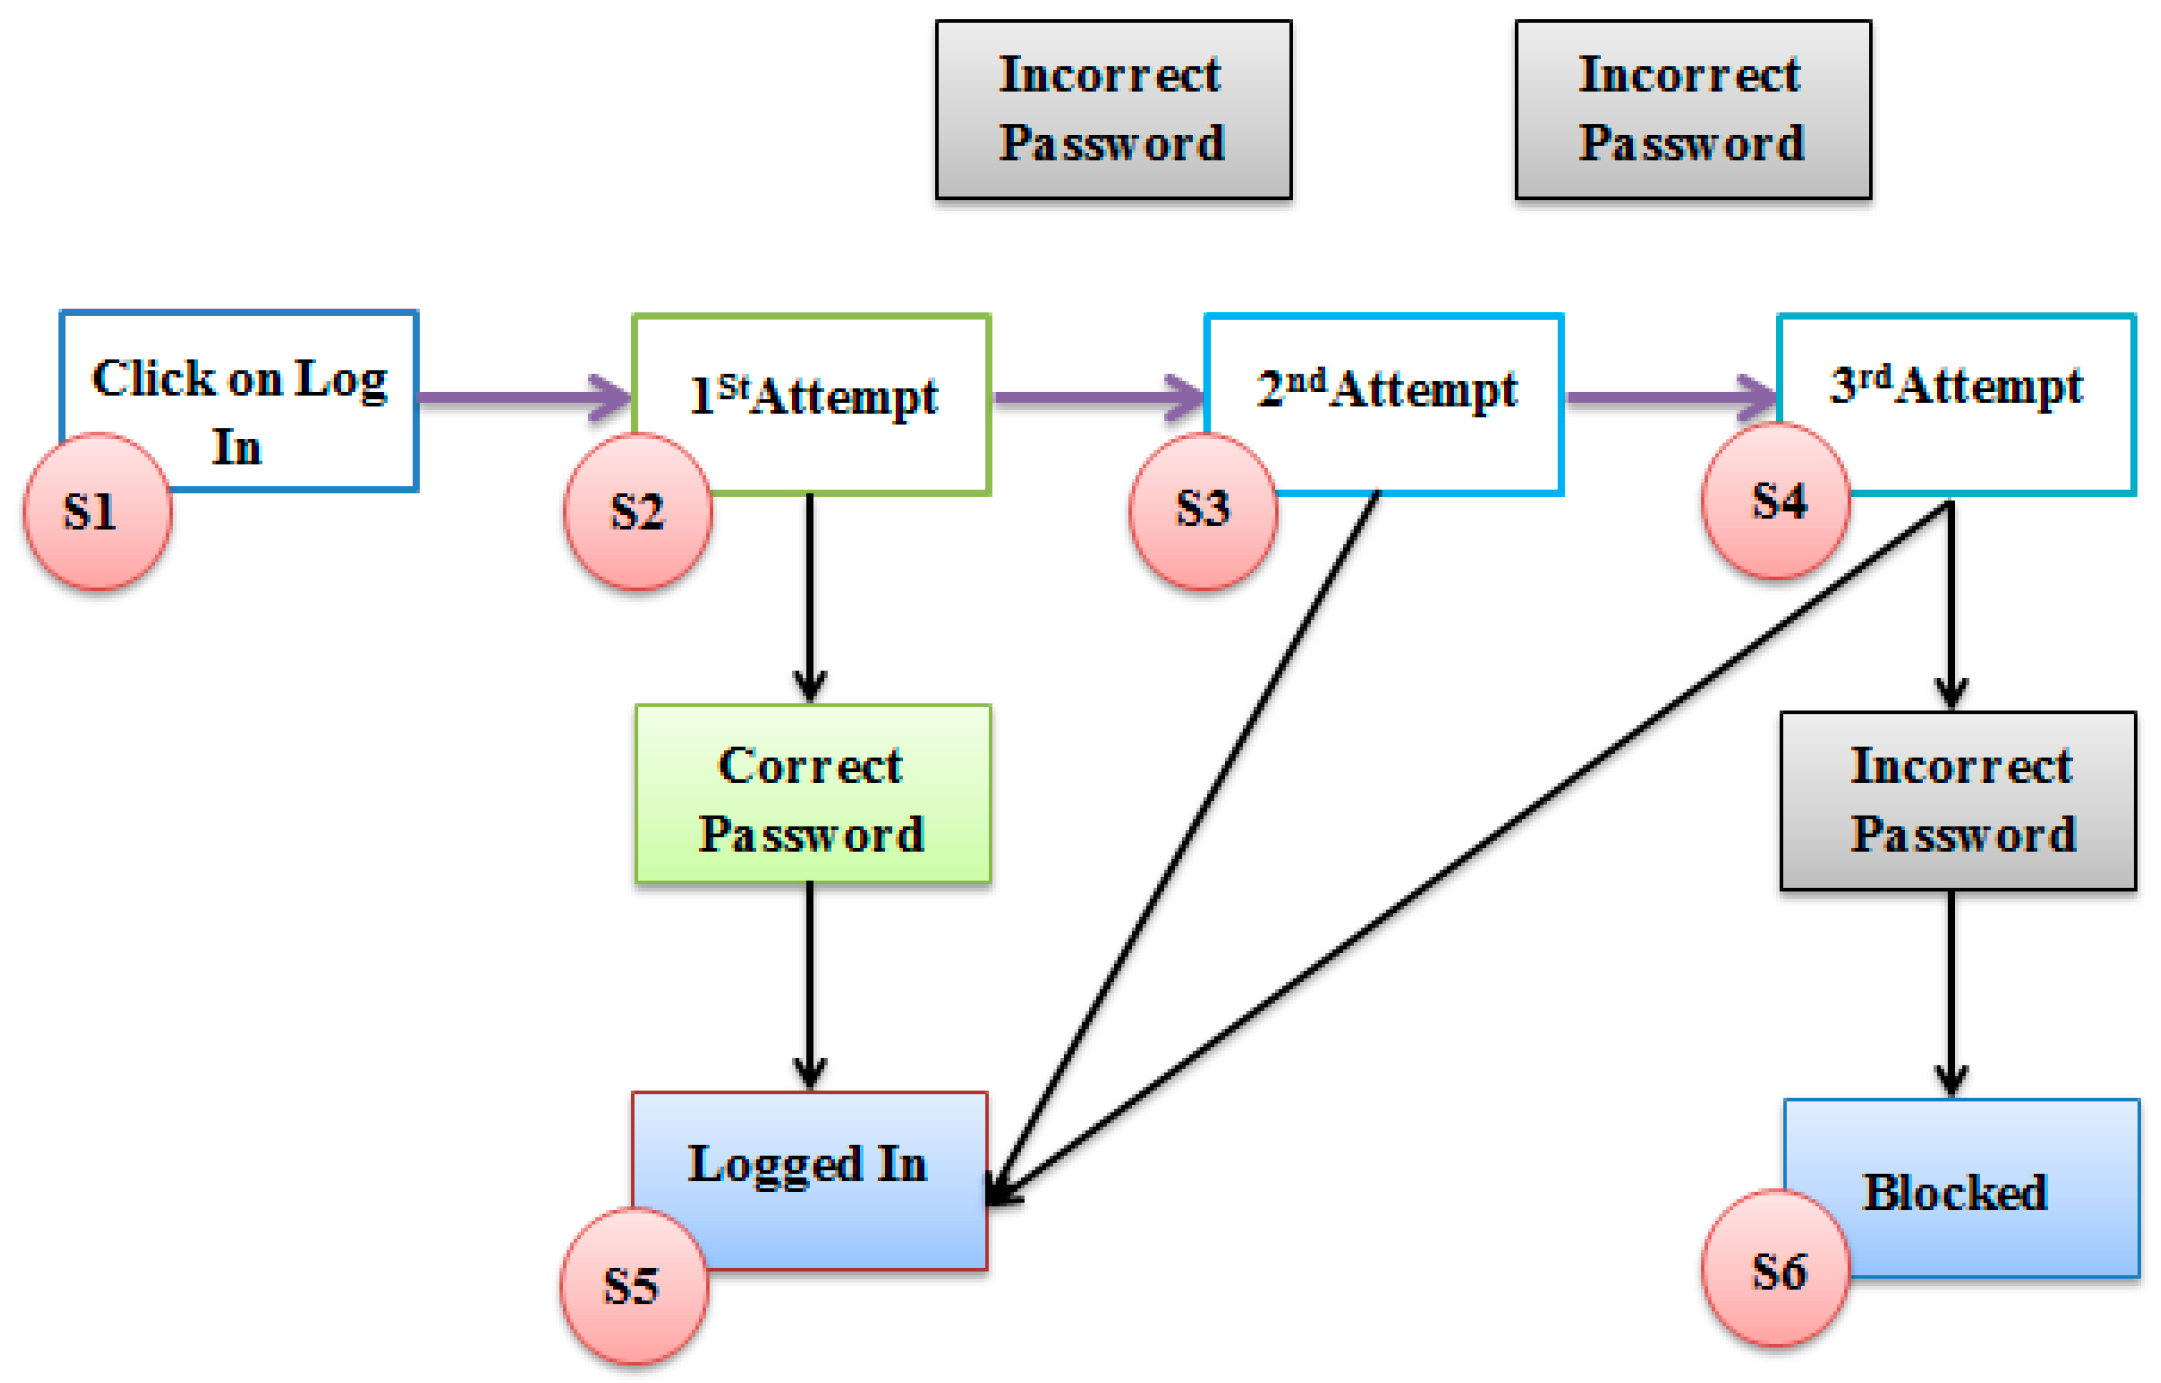
3.1.4. State Transition Diagram
The STD is generated using
, which provides a clear overview of how the system behaves and transitions between different states. By visualizing all possible state transitions, the diagram can reveal missing or unintended transitions that could result in errors. The STD has been presented in
Figure 2.
3.1.5. State Activity Score
Based on the STD parameters, the SAS is computed to quantify the relative importance of each state within the system’s behavior. For the score assignment, the RL is utilized. The RL offers advantages in assigning SAS owing to its adaptability to dynamic systems, enabling the algorithm to learn and optimize score assignments centered on interactions and outcomes.
Learning Environment: The RL agent interacts with an environment via different states and takes action to maximize cumulative rewards .
Z-value Learning: The uses expected cumulative rewards (-values) to make decisions. Primarily, -values are often initialized randomly.
Reward Feedback: The receives from the environment for each taken. These guide the toward desirable outcomes.
Updating Z-Values: After each
, the
-values are updated using Equation (10):
where the learning rate is implied as
, the discount factor is notated as
, and
and
specify the next state and action, respectively.
SAS: The SAS is derived from the -values of each state. Higher -values specify more active or valuable states. The SAS is notated as .
3.2. GUI
The GUI is based on historical projects. GUIs make software user-friendly by providing a visual and intuitive way for users to interact with software.
3.2.1. GUI Components
The different
GUI components
, namely buttons, labels, checkboxes, and radio buttons, are identified. This information guides further analysis and testing strategies. The different
GUI components
are mathematically termed as:
3.2.2. Text Value Extraction
The next step involves extracting the text content associated with each component. This comprises extracting labels, instructions, options, messages, and any other textual information presented to users. The text values of the
GUI are represented as follows:
where
signifies the sum of text content from all
GUI elements and
implies the maximum text values.
3.2.3. Similarity Score
Here, by comparing
with the
, a similarity score
is determined. This comparison helps assess how closely the textual content in the
GUI aligns with the expected behavior as specified in the test cases. The
is computed by the Ratcliff/Obershelp similarity technique. The
is estimated by:
where
specifies the length of the longest common subsequence
,
signifies the length of
, and
implies the length of
.
If is high, the text content aligns closely, suggesting that the requirement has not changed and the GUI design is likely accurate. Contrarily, if is low, a significant difference exists in the text values, indicating a potential mismatch between the GUI design and the requirement.
3.3. Labelling
Subsequently,
and
are inputted into a fuzzy algorithm to determine a label
. If the similarity score and SAS are higher, the test case result is designated as “pass.” However, if either or both scores are low, the test case result is designated as “fail.” The proposed work uses the fuzzy algorithm to establish an interpretation of pass or fail based on the combination of these two significant scores. This is presented as:
3.4. Word Embedding
Here, word embedding is performed by the text values of the GUI components and the test case attributes . Word embedding converts the textual information into numeric vectors, enabling the GK-GRU to process and analyze the data more effectively. The process of word embedding is executed using the GS-BERT algorithm. Although BERT demonstrates proficiency in understanding natural language, it may encounter challenges in appropriately recognizing word order and the impact of word positions. To address this concern, the Gaussian sinusoid encoding method is incorporated into BERT. This entails the incorporation of sinusoidal functions into the positional embeddings (PE) utilized by BERT, enhancing the model’s capacity to accurately determine the relative position of words in a given sequence. Consequently, the utilization of GS-BERT results in enhanced numerical embeddings of textual data.
Primarily, the input text
, which is the combination of
and
, is broken into sub-words. Each token is then represented as a word embedding vector
presented as follows:
where
delineates tokens and
is the word-to-vector function.
PEs are added to the word embeddings to convey sequence order. Here, by using the GS function, the PE is performed and represented as follows:
where
implies the position,
specifies the dimension at index
, and
symbolizes the maximum position.
Thereafter, the multi-head self-attention
computes weights, which indicate the importance of each word’s relation to others. This output is then linearly transformed to produce the final attention representation:
where
, and
are query, key, and value matrices, respectively, and
is the dimension of keys.
A stack of transformer encoder layers
captures contextual relationships and produces the numeric vectors
:
where
computes attention-based representations of the
,
is a neural network for enhancing the attention output, and
converts
to the transformed output
.
3.5. Classification
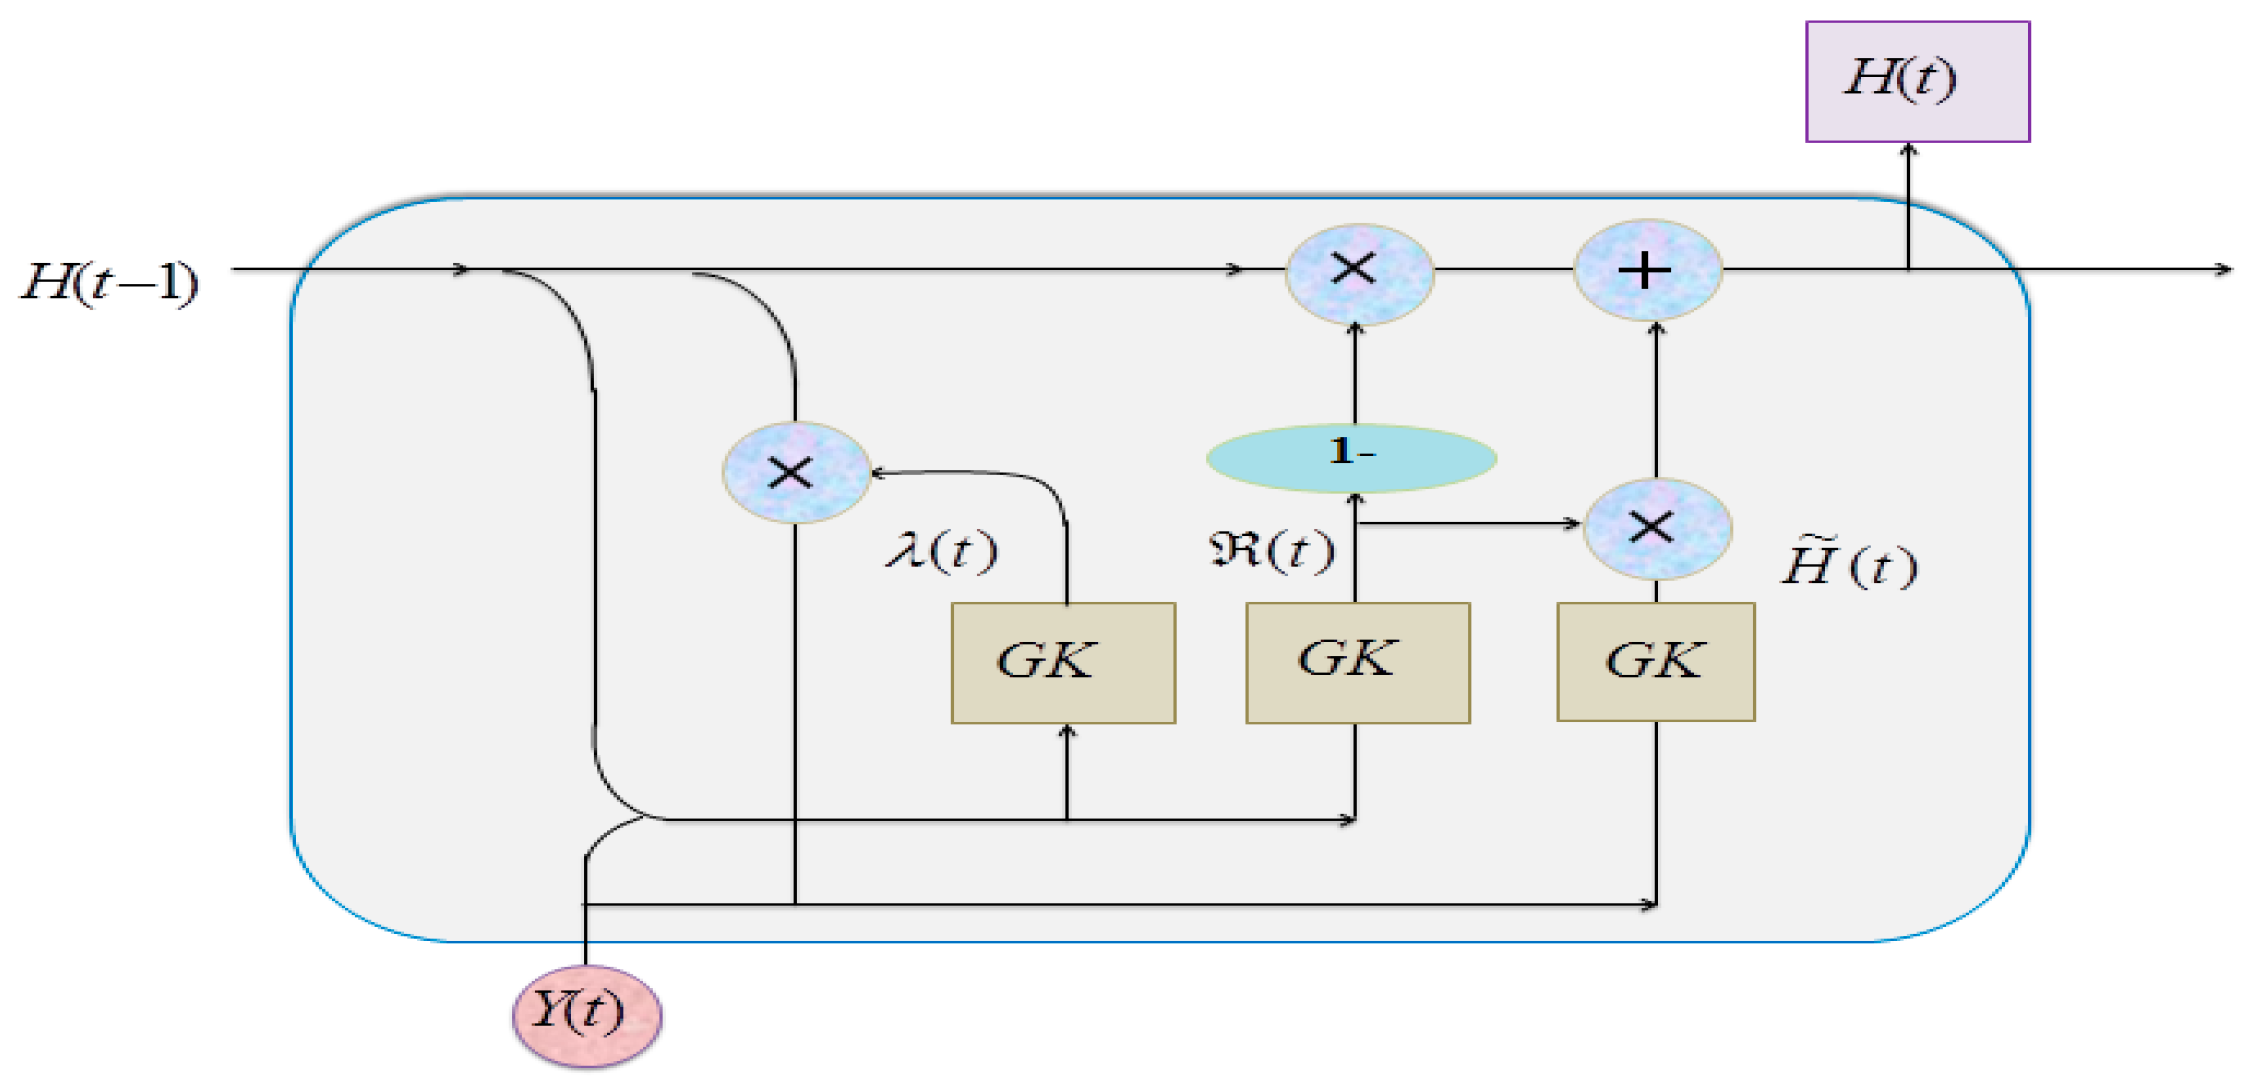
Finally, and their corresponding labels , collectively designated , are fed into the GK-GRU, which accurately predicts whether the test cases pass or fail.
GRU, which is faster than LSTM, utilizes less memory; however, GRU models may encounter challenges, such as slow learning efficiency and extended training times. Hence, the GK function is introduced to address these concerns. This function is designed to enhance the learning process within the GRU architecture, aiming to mitigate issues associated with prolonged training durations and optimize model performance. The GK-GRU architecture is presented in
Figure 3.
The
is inputted to the GK-GRU, represented by Equation (22):
Update gate
: The
controls how much of the previous memory to retain and how much of the new information to incorporate:
Here,
is the Gini kernel activation function, represented as:
where
is the error function, which maps
to the range between 0 and 1.
Reset Gate
: The
is computed to determine how much of the previous hidden state
to forget:
The candidate activation
is computed as per Equation (26), representing the new information to be added to the memory cell:
and memory cell
are updated using the
and
.
where
signifies the time step, while
,
, and
are weight matrices, and
determines whether the testcase is designated as a pass or fail.
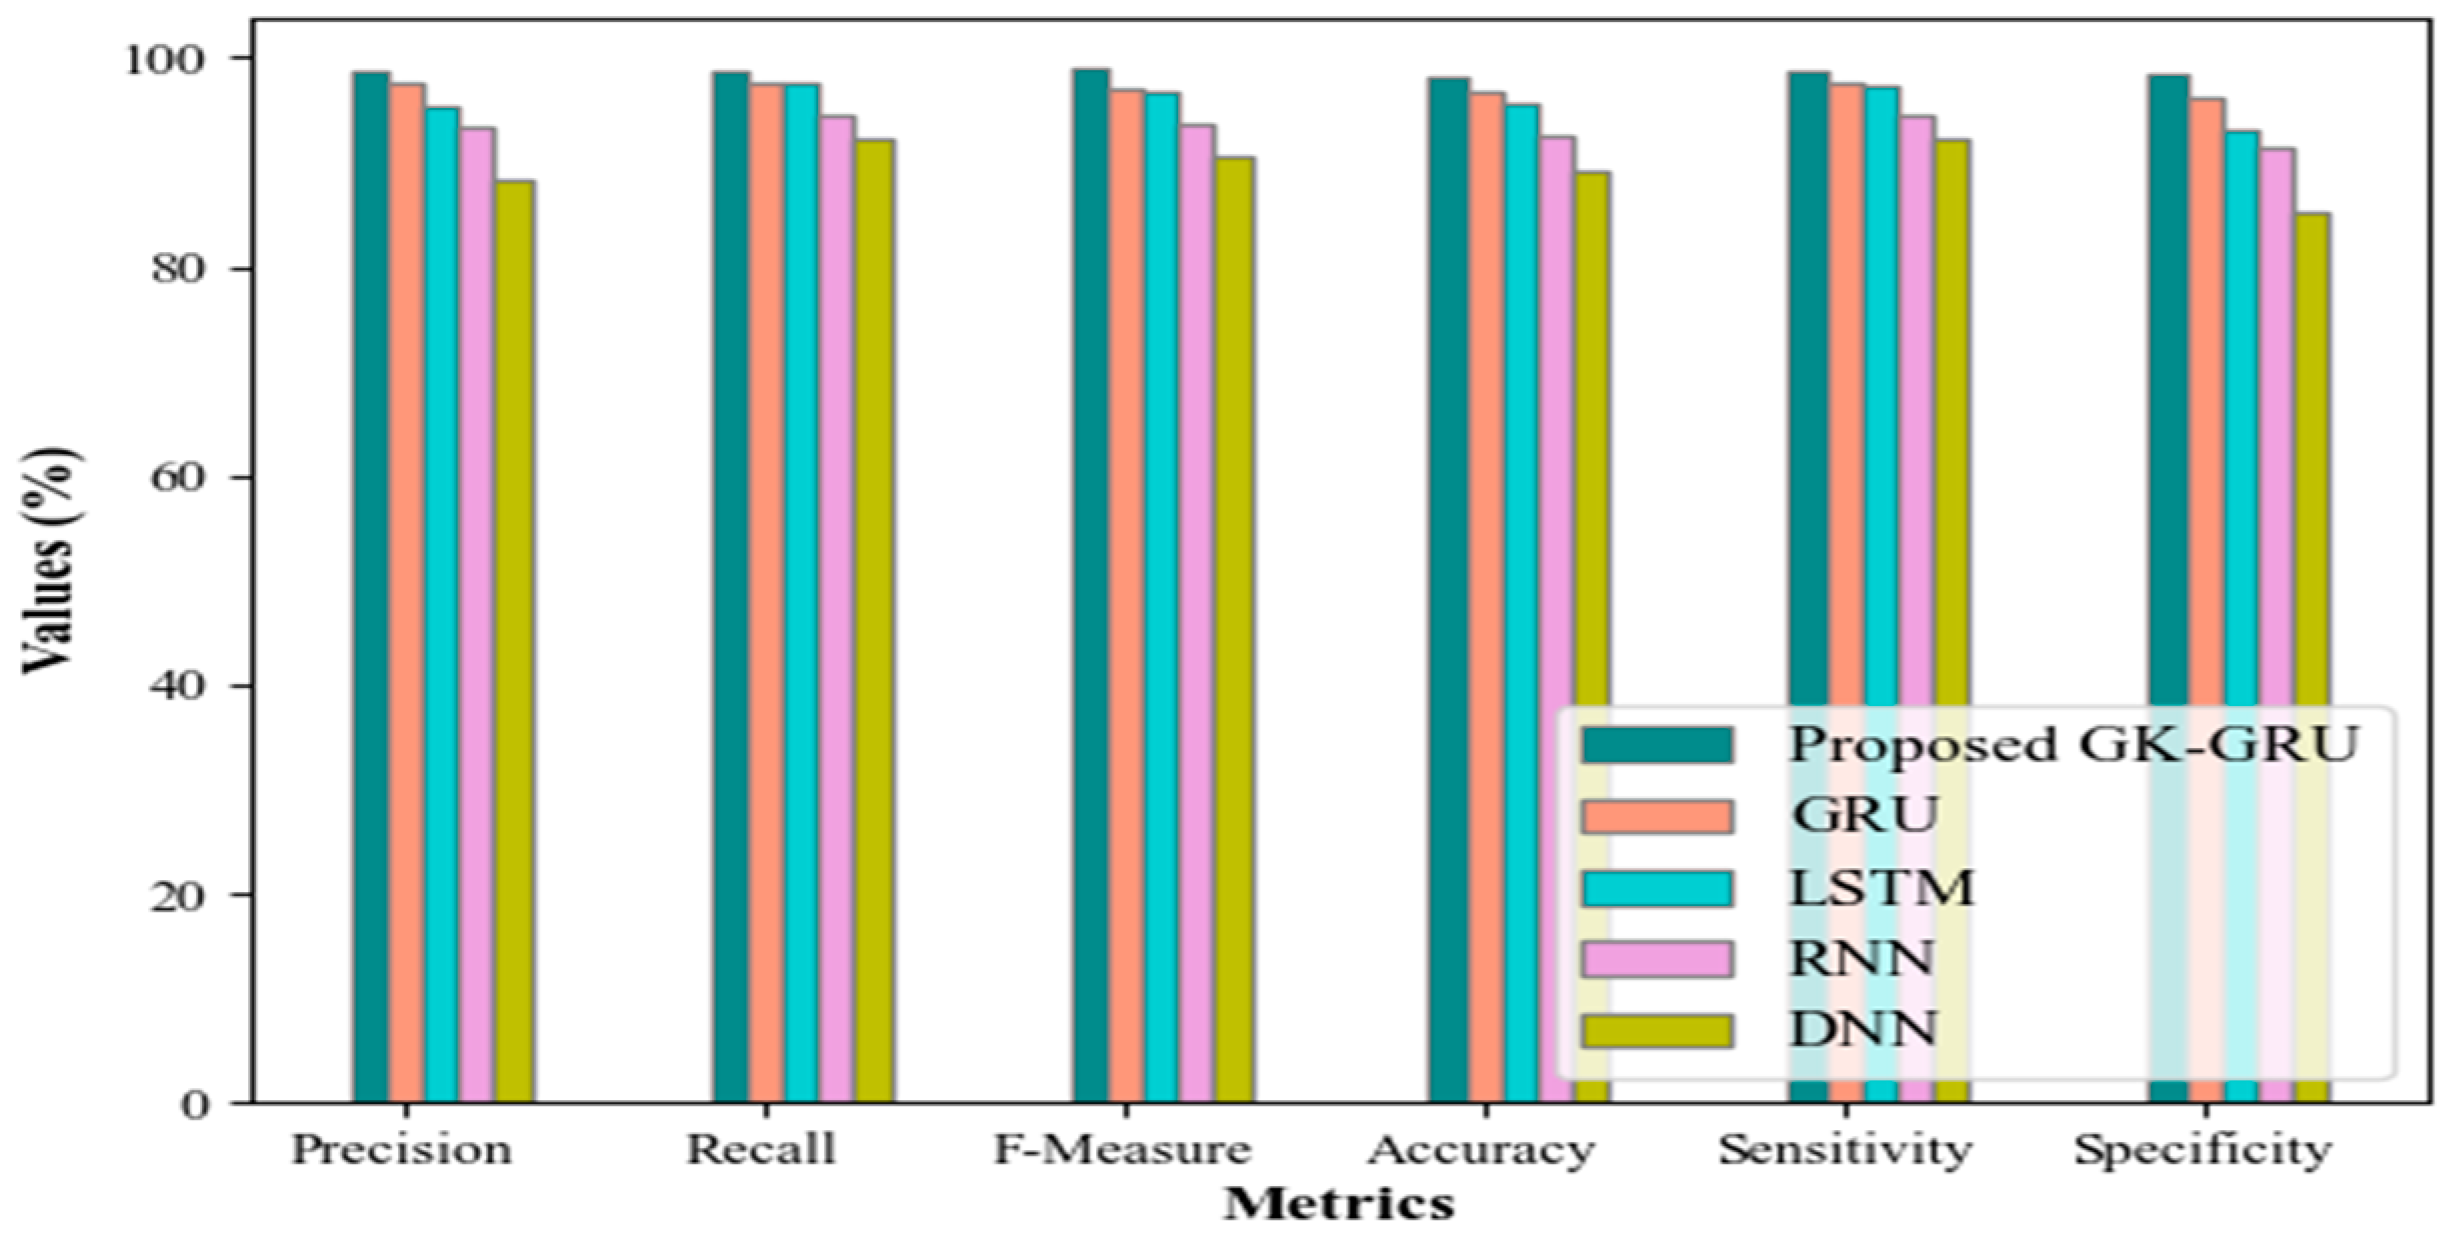
5. Conclusions
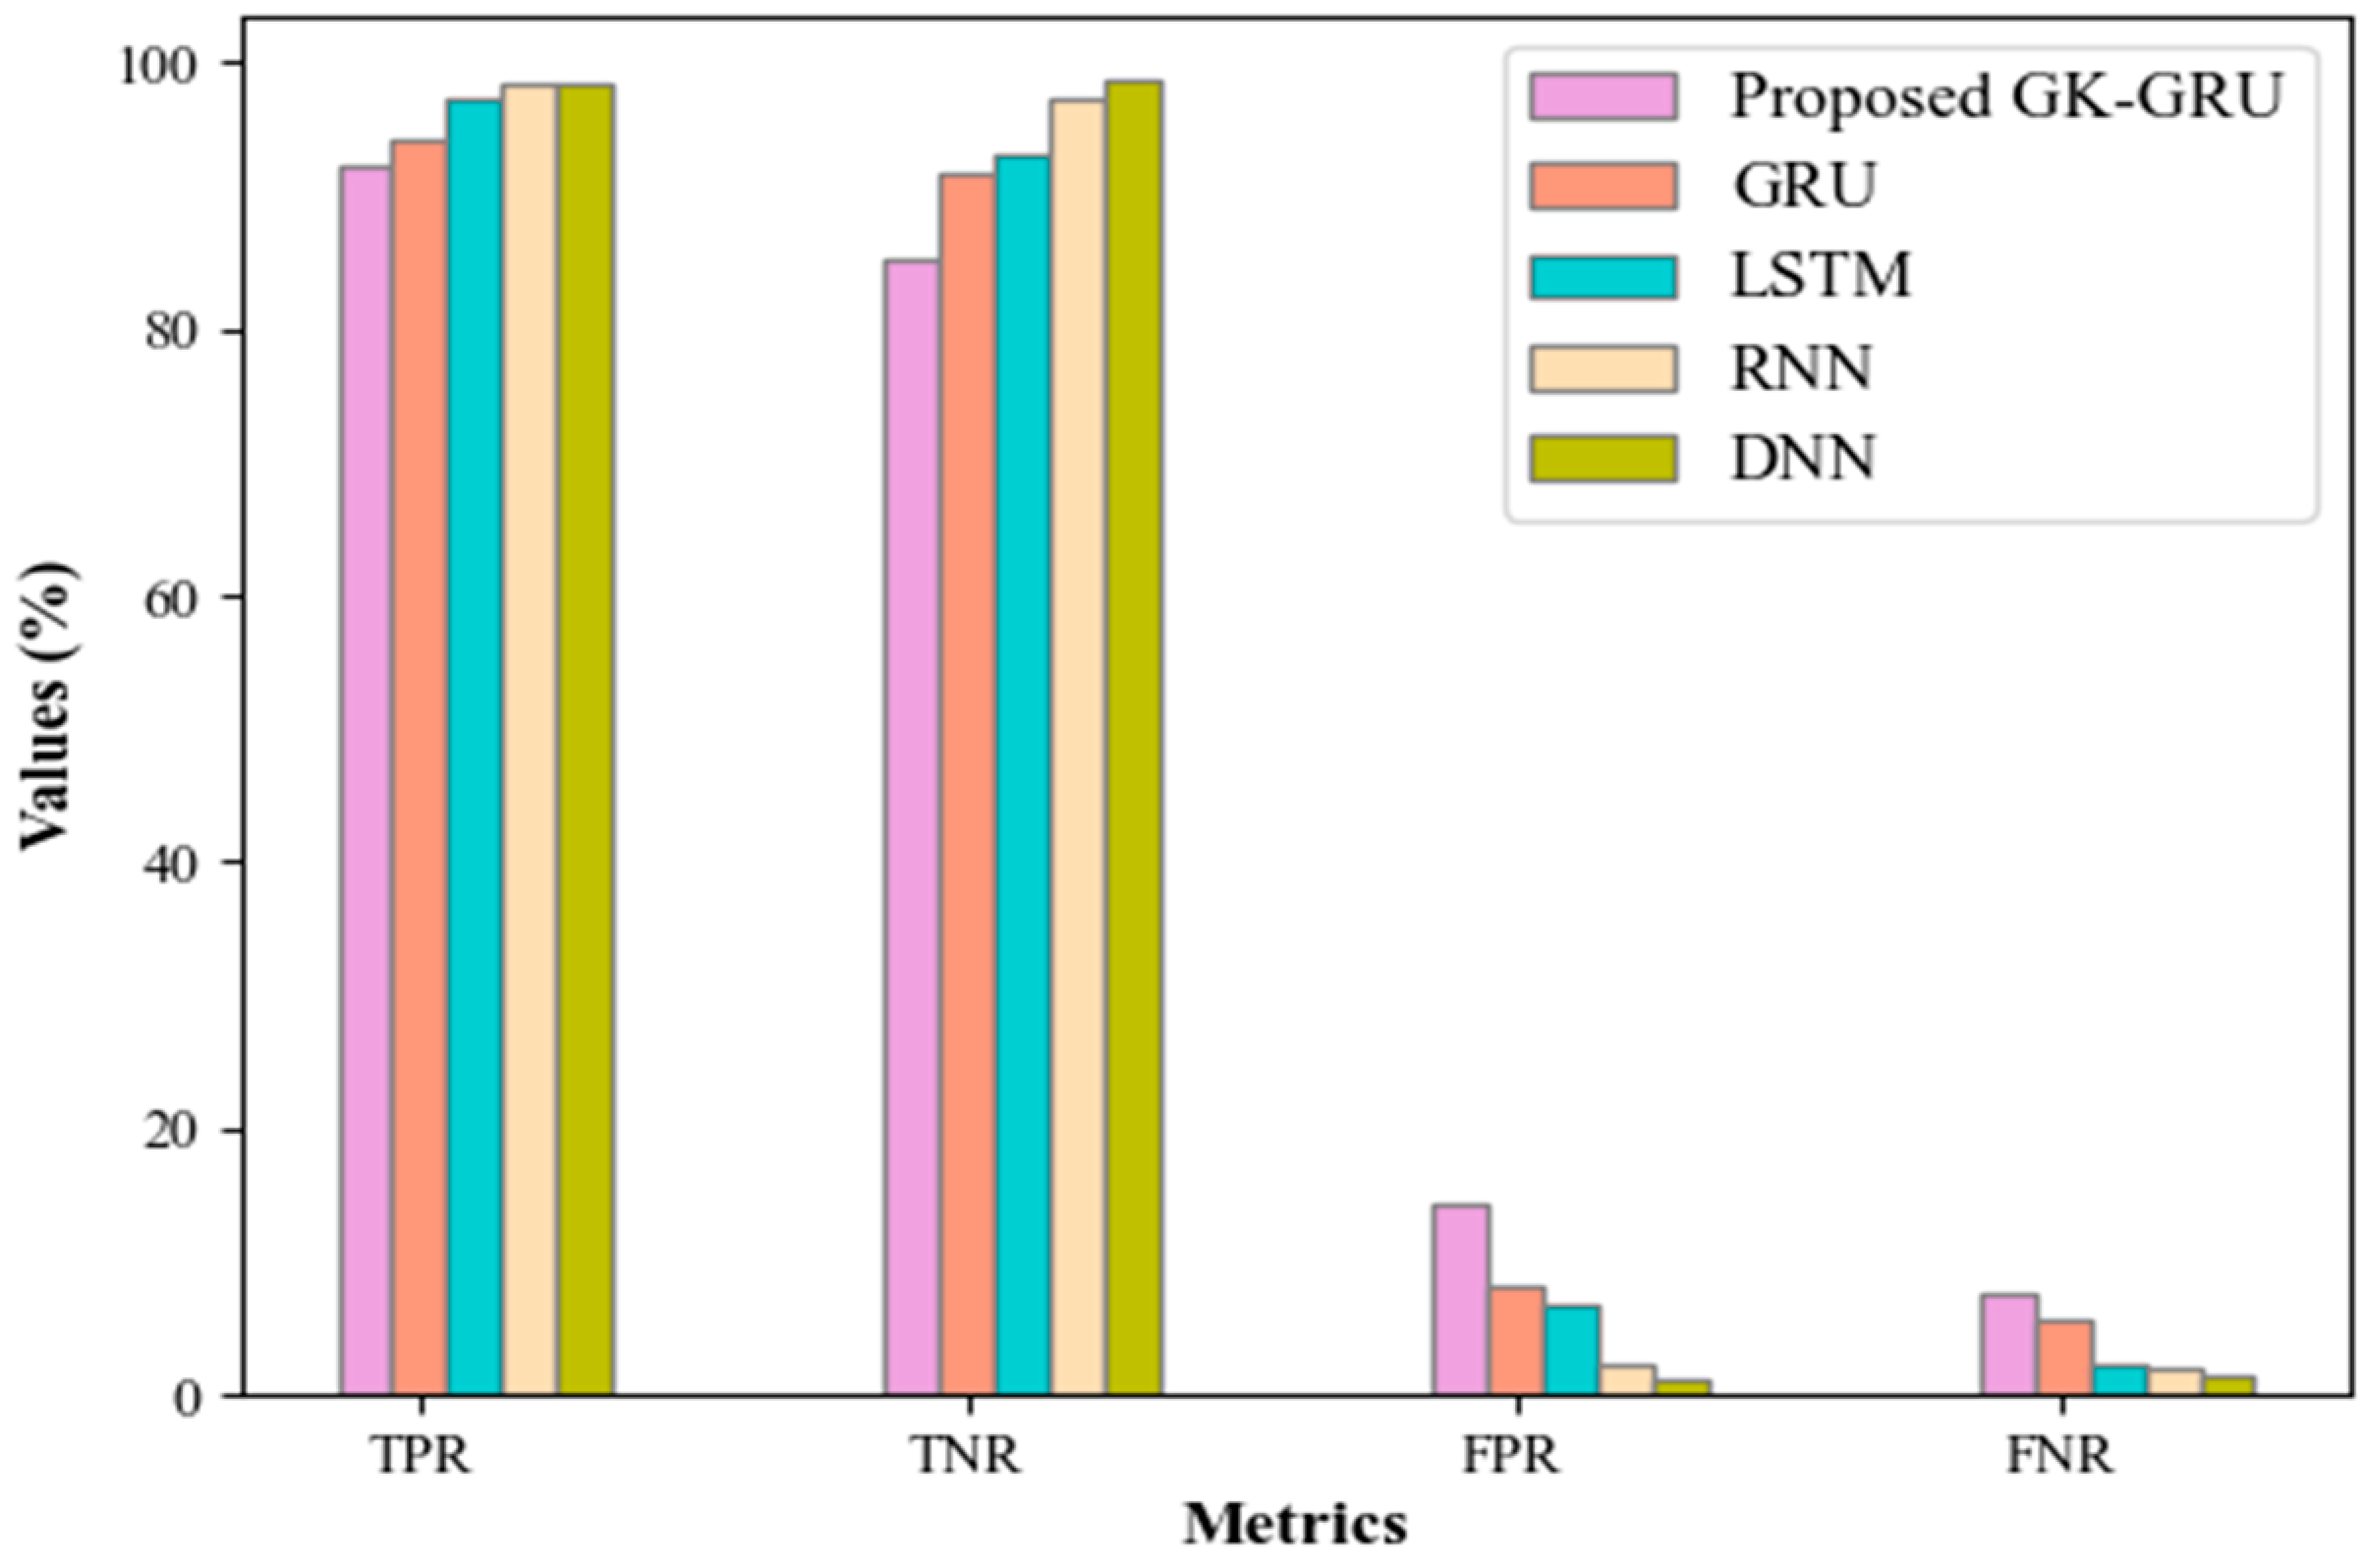
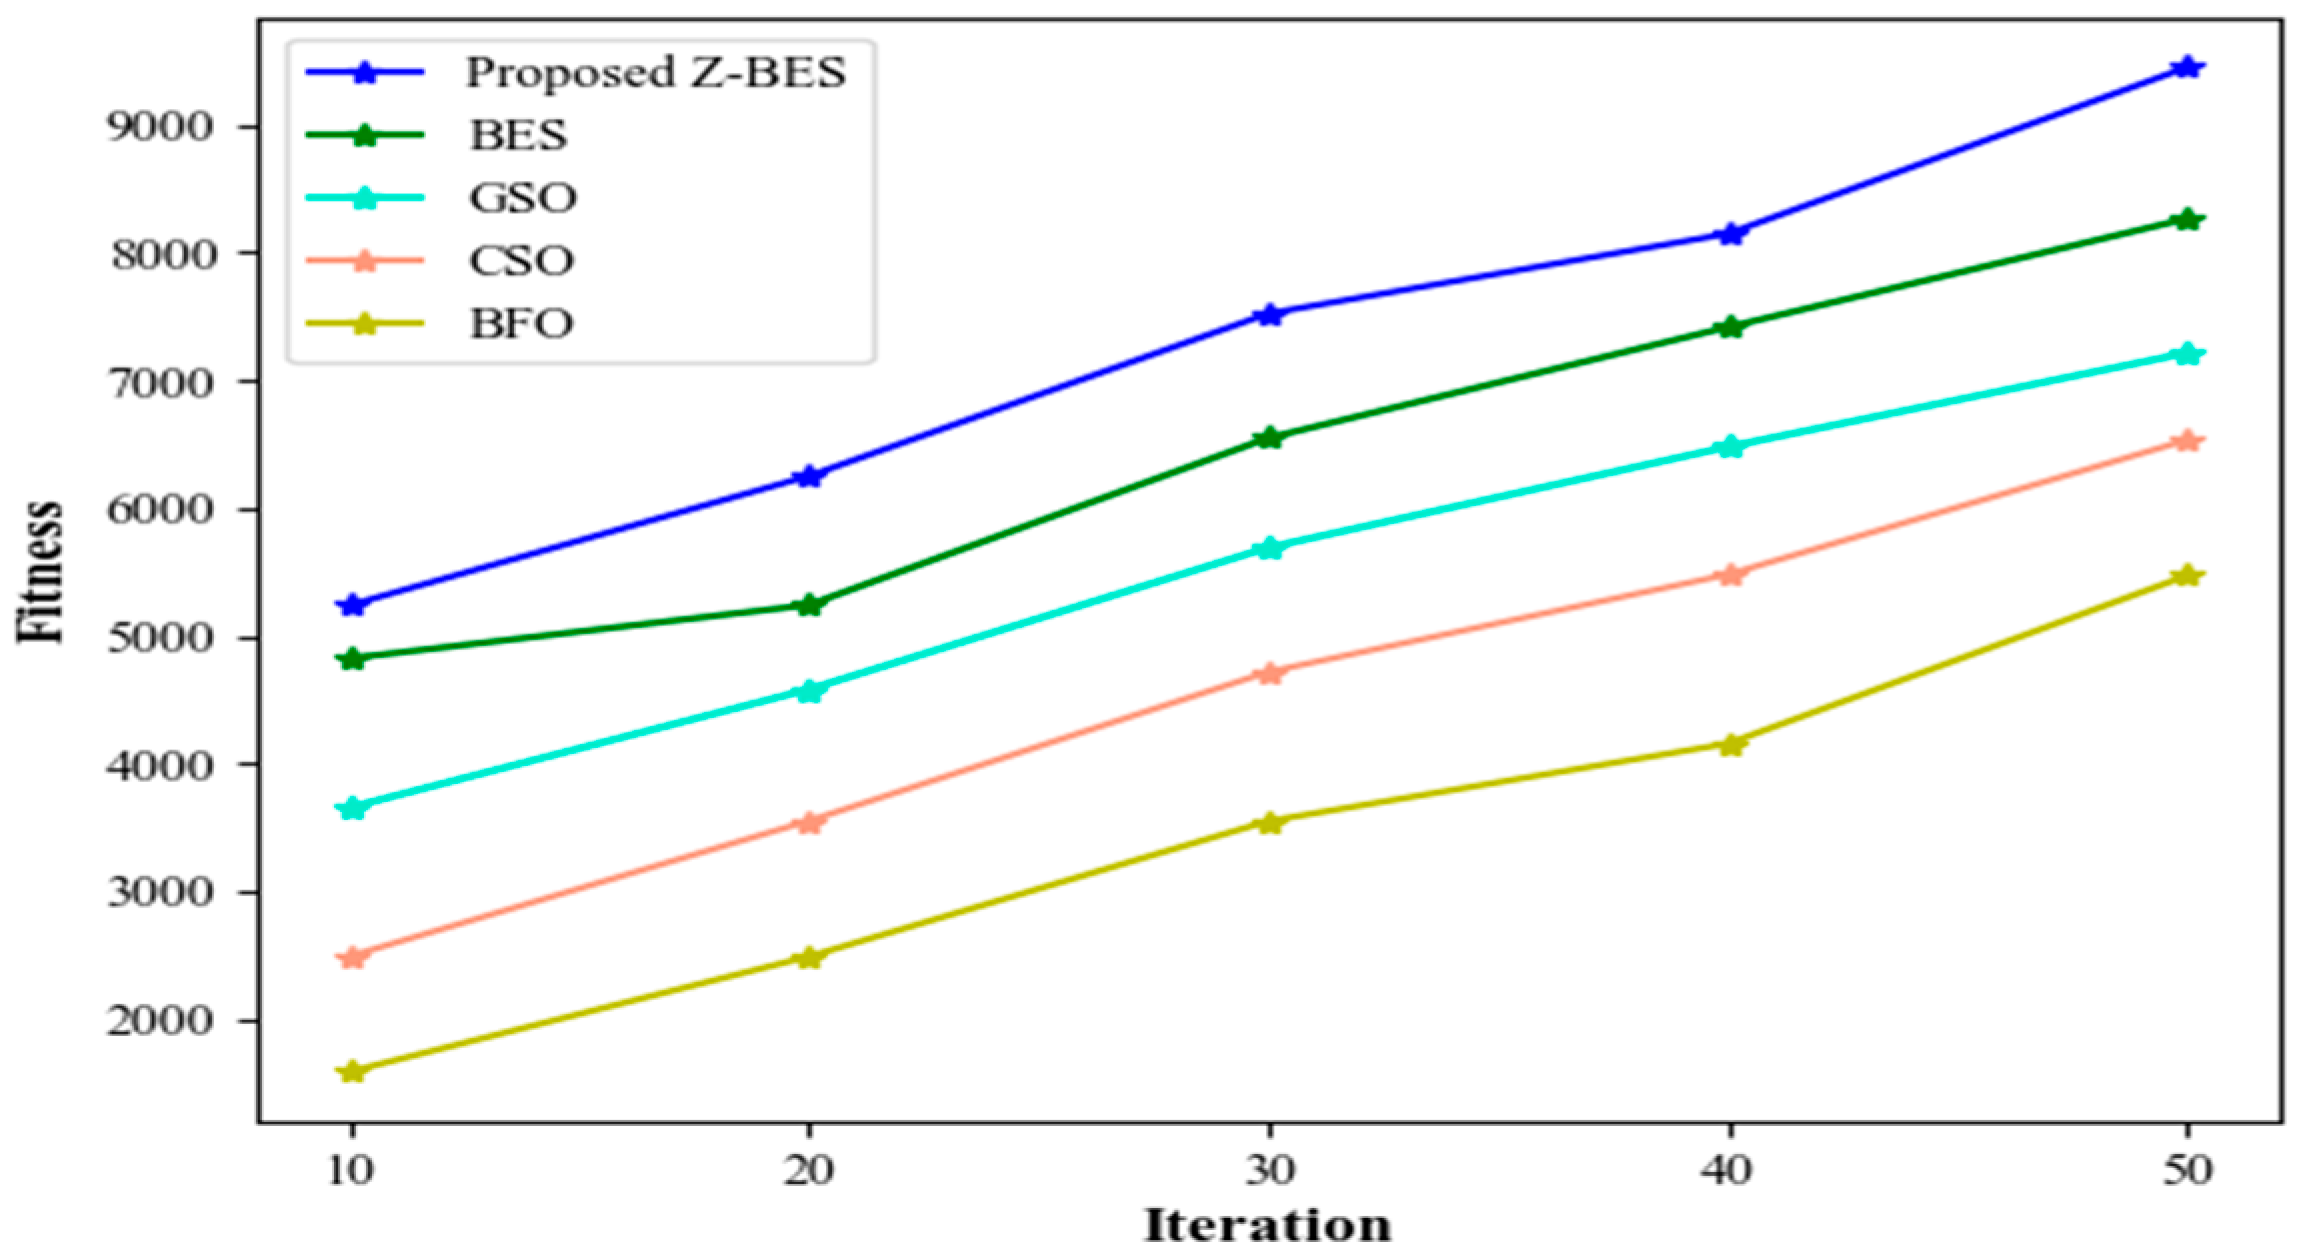
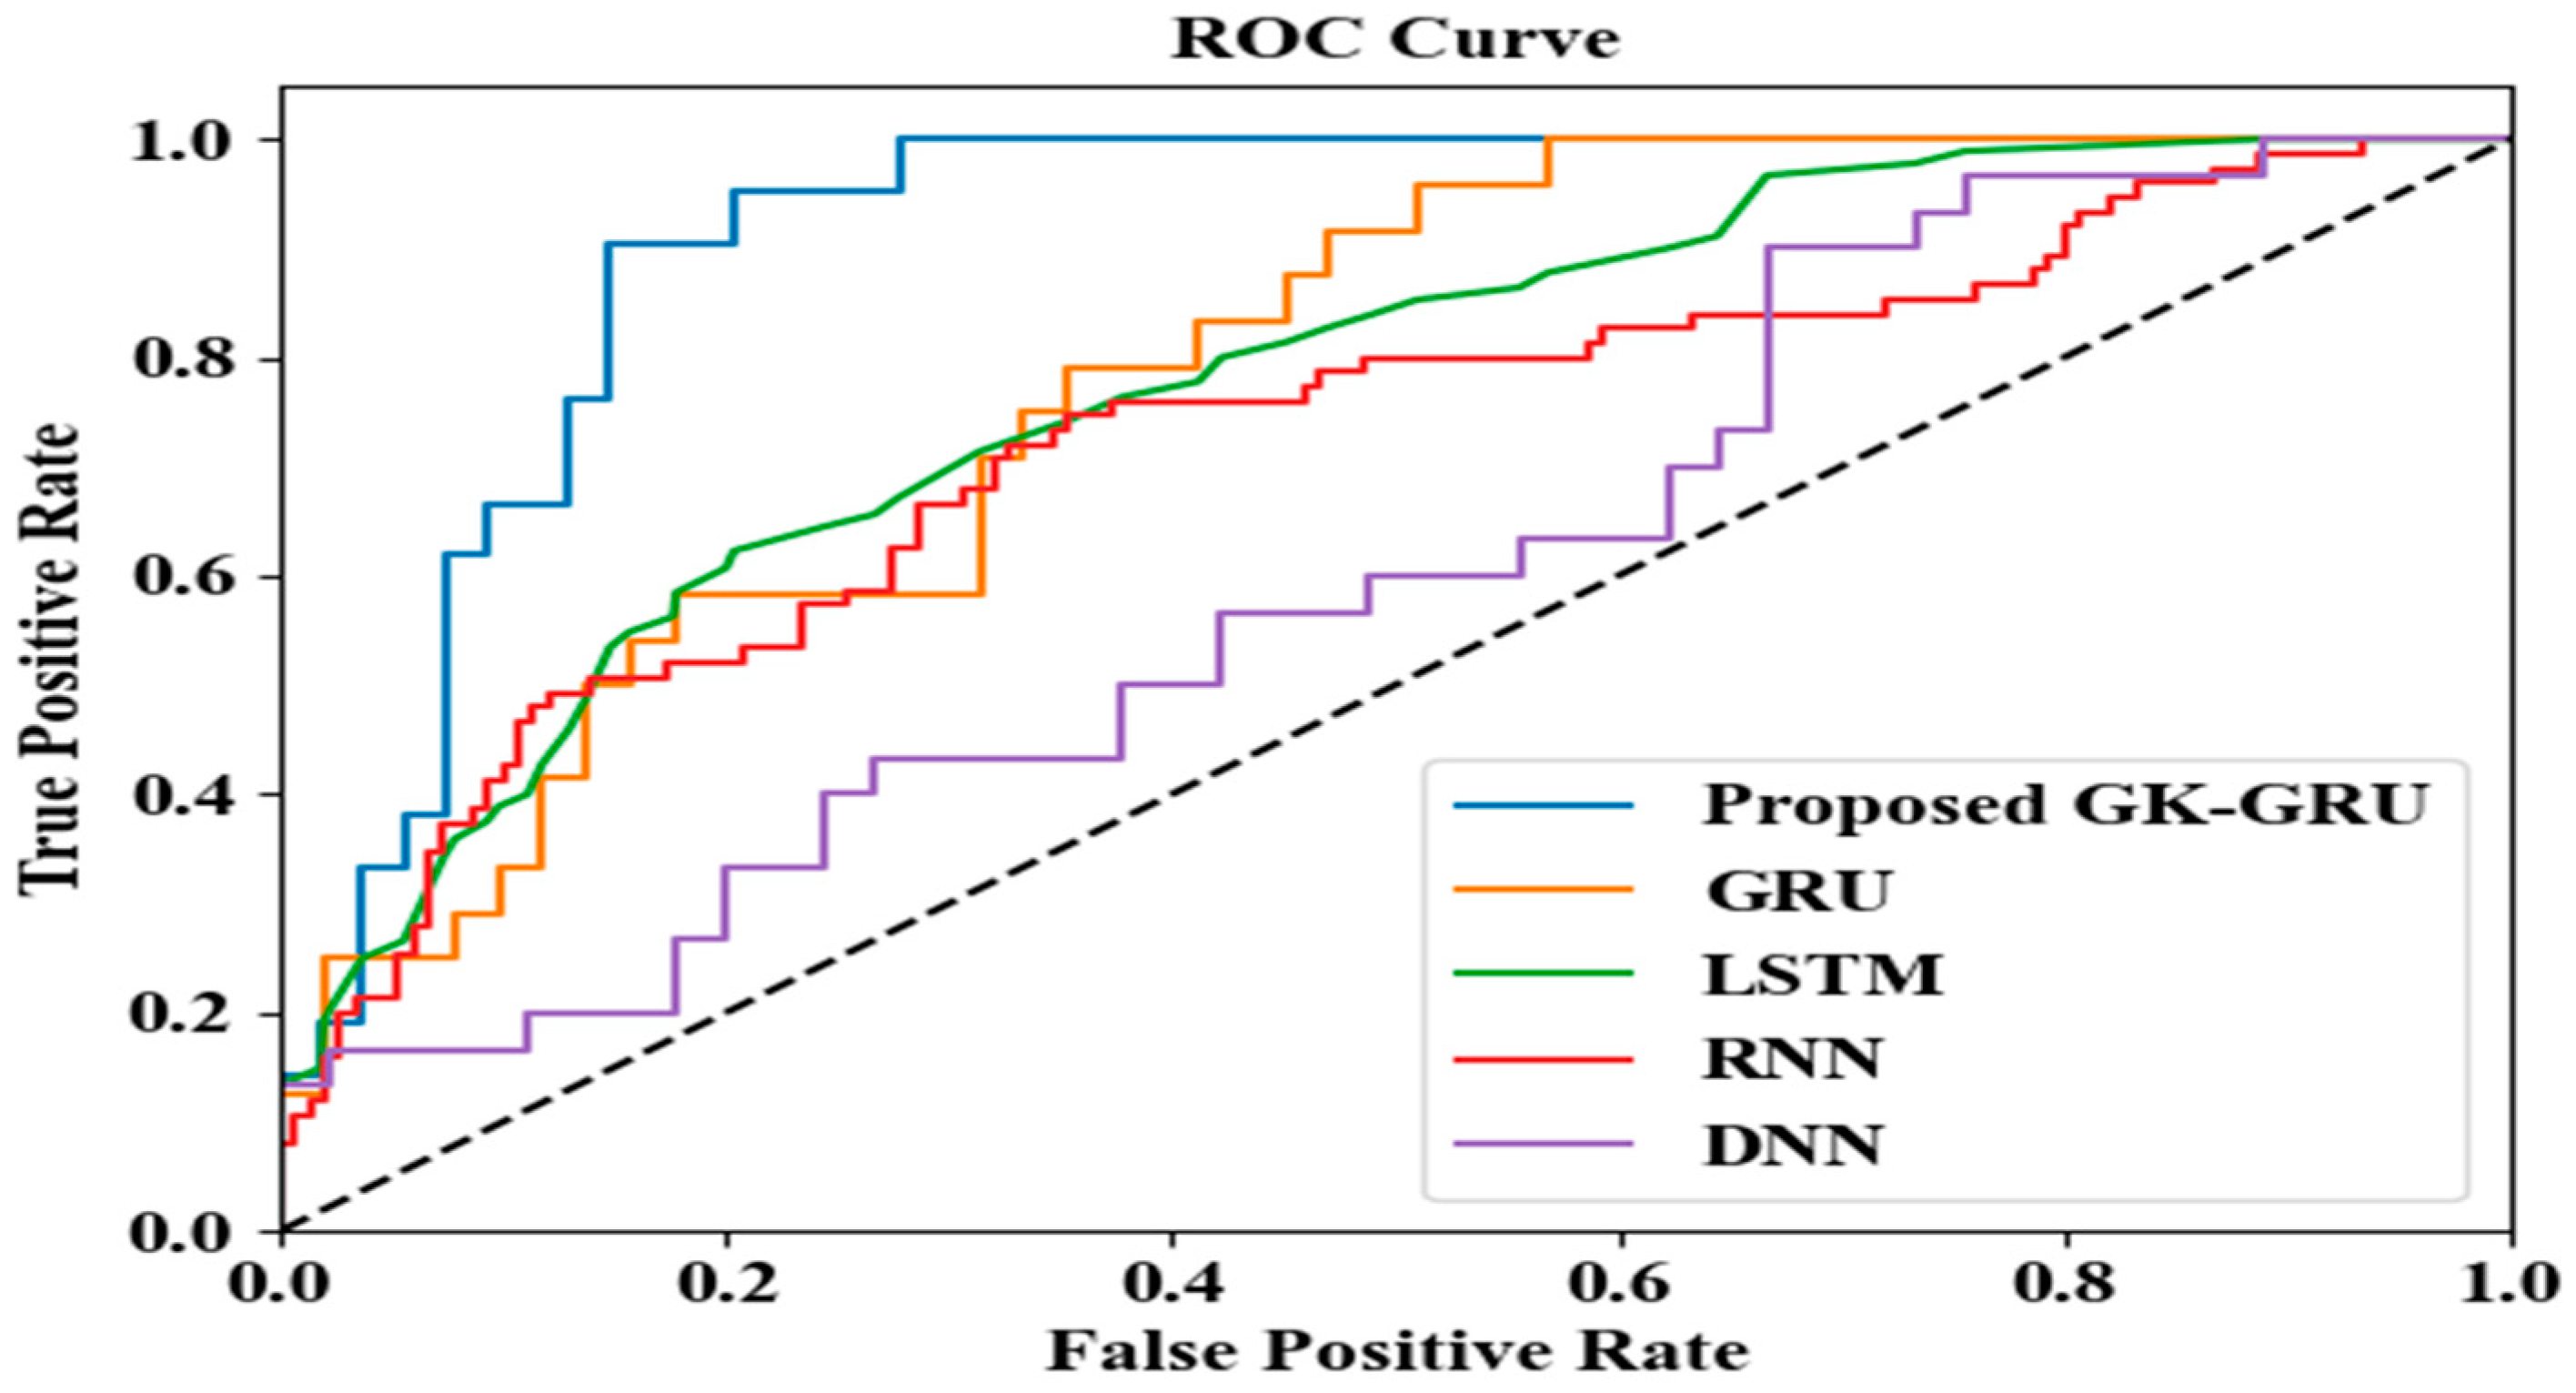
By combining Z-BES prioritization and the GK-GRU model, the proposed “finite state testing for GUI with test case prioritization using Z-BES and GK-GRU” framework tackles GUI testing challenges. The proposed technique’s performance has been validated by experimentation analyses. The developed Z-BES gains a minimum prioritization time of 5587 at the 10th iteration, which improves the GUI testing process. Likewise, the proposed GK-GRU demonstrates impressive performance metrics, including 98.85% precision, 98.64% recall, 98.95% F-measure, 98.15% accuracy, 98.65% sensitivity, and 98.46% specificity. Moreover, the proposed GK-GRU requires an average of 38,945 ms for the training process, which reduces the time requirements. Furthermore, the proposed technique exhibits low error values and a 98% efficiency rate. Overall, the proposed technique outperforms the prevailing systems and is more reliable and robust. In this work, GUI testing was performed based on the similarity between GUI component text values and test case attribute values, along with state transition. Although this framework performs well for GUI testing, it has small error rates due to the missing GUI appearance and activity attributes that are not well-structured or follow unconventional design patterns. In the future, GUI segmentation might be applied to distinguish the GUI components (e.g., shapes, colors, visual layouts, and activity diagrams) to improve the performance of GUI testing.


