Abstract
Structural analysis is crucial for airfield pavement evaluation and plays a critical role in ensuring airfield operation safety and efficiency. Traditionally, the evaluation has relied on the Heavy Weight Deflectometer (HWD) test. This method encounters challenges, including interruptions in airfield operations, limited coverage of inspection locations, and extensive time required for data collection and analysis. In the presented research, a remote method for the measurement and analysis of runway pavement structural deflection induced by transiting aircraft was introduced, employing a Remote Laser Doppler Vibrometer (RLDV). First, a test system was developed to acquire deflection measurements of airport pavements using RLDV. To address inaccuracies arising from minor angle measurements and fixed-end beam vibrations, vibration correction methods were developed and validated. Thereafter, a linear regression model was constructed using data from both RLDV and HWD measurements, yielding a correlation coefficient of 0.94. This correlation highlights the reliable utility of RLDV in analyzing pavement structural response. The objective of this research is to present a novel approach for the evaluation of pavement structural performance.
1. Introduction
Extended exposure to prolonged heavy loads from both traffic and environmental factors leads to continuous degradation of the structural performance of airfield pavements [1]. Structural analysis is crucial for airfield pavement evaluation and plays a critical role in ensuring airfield operation safety and efficiency [2].
Traditionally, the evaluation of airport pavement structural performance has been divided into two main categories: destructive and non-destructive testing methods [3]. Destructive tests, encompassing core sampling and splitting tensile strength experiments, provide insights into the material and structural properties [4]. While they offer outstanding accuracy, these tests introduce damage and pose safety risks to the pavement structure [5].
On the other hand, non-destructive testing relies primarily on various types of deflectometers. As classified by Epps et al., deflectometers, based on their load application, can be subdivided into static, steady-state, falling weight, and dynamic categories [6]. Of these, Heavy Weight Deflectometers (HWDs), as falling weight deflection measuring equipment, are predominantly selected for gauging airport pavement deflection, which is attributed to their straightforward operation and minimal disruption to pavement structural integrity [7]. Using the deflection bowl information derived from HWD assessments [8], the modulus of pavement structure can be retroactively determined [9,10,11], leading to a precise evaluation of pavement structural health. Dynamic deflectometers, such as Traffic Speed Deflectometers (TSD) [12] and Laser Dynamic Deflectometers (LDD) [13,14], can achieve measurement speeds of up to 90 km/h [15], enabling high-speed continuous structural performance testing. Nevertheless, these methods encounter challenges, including interruptions in airfield operations, limited coverage of inspection locations, and extensive time required for data collection and analysis [7,8,9,10,11,12,13,14,15].
To address the limitations of traditional pavement assessment methods, smart runway technology has been introduced and undergone significant advancement due to the relentless advancements in sensor technology and communication systems [16]. This is achieved by embedding sensors within airport runways to capture the dynamic response of the pavement during aircraft movement [17,18]. For instance, the U.S. Federal Aviation Administration (FAA) embedded a wide array of sensors at Denver International Airport, including strain gauges and seismic detectors, which were used to monitor strain data and evaluate the structural performance of the pavement [19,20,21]. Brill and his associates analyzed the correlation between rigid pavement deflection and temperature shifts based on sensor data from three rigid pavement slabs at Hartsfield–Jackson Airport in Atlanta [22]. Similarly, Cook et al. installed strain gauges on runways at Newark Liberty International Airport to monitor the risk of pavement slippage and shoving failure caused by interlayer delamination [23,24]. Furthermore, Xie deployed FBG sensors on rigid pavement panels to analyze the relationship between vertical shear strain and bottom tensile strain under load [25]. The U.S. Army Corps of Engineers Research and Development Center implemented earth pressure cells, asphalt strain gauges, multi-depth deflectometers, and other sensors in a runway pavement repair project in 2019 to monitor runway conditions [26]. Ling et al. developed a framework and key technology for smart runways using a variety of embedded sensors [27]. These innovations were implemented in the construction of runways at both Shanghai Pudong International Airport and Chengdu Tianfu International Airport [17,27]. While the incorporation of intelligent sensors mitigates the shortcomings of traditional testing methods, such as regular inspections and runway occupancy, the predominantly used embedded sensors present difficulties for intelligent upgrades at operating airports [17,18,19,20,21,22,23,24,25,26,27].
The advancement of remote sensing technology has brought forth fresh prospects for intelligent assessment of runway structural performance [28,29]. The Remote Laser Doppler Vibrometer (RLDV), an innovative optical instrument, leverages the Doppler effect and the heterodyne interference principle to measure the surface vibrations of objects [30]. Presently, this device finds wide-ranging applications in fields such as evaluating rock block stability [31], detecting internal flaws in concrete structures [32], supervising the condition of hydropower dams [33], and analyzing the vibration patterns of aircraft blades [34]. These applications have achieved precise, non-contact monitoring of vibrations in civil engineering structures.
This study introduces a remote method for the measurement and analysis of runway pavement structural deflection induced by transiting aircraft with a Remote Laser Doppler Vibrometer (RLDV). A design framework was proposed for a vibration monitoring system for rigid pavements that incorporates RLDV technology. Subsequently, an appropriate data correction method was developed and validated to address challenges associated with minor angle measurements and vibrations from fixed-end beams. Thereafter, the reliability of RLDV in measuring pavement deflection was established by analyzing the correlation between RLDV and HWD deflection data. Conclusively, an assessment technique for pavement structural performance was established based on deflection test data gathered using RLDV.
2. Remote Laser Vibration Measurement System
This section elucidates the measurement principle and the performance attributes of RLDV chosen within this research. Considering the unique attributes of the airport runway, an optimal schema for deploying the testing system is formulated, and pivotal challenges to be addressed are identified.
2.1. Remote Laser Doppler Vibrometer
In practical applications, RLDV can precisely target a predetermined deflection testing position with the assistance of a high-definition camera. The optical head radiates a measuring laser with a frequency of ‘’ towards the testing position. Upon passing through the first polarizer (BS1), the laser is bifurcated into a measuring laser and a reference laser. The reference laser then experiences Bragg diffraction, altering the frequency to ‘’, where ‘’ is the modulation frequency of the acousto-optic modulator. Following its trajectory through the second polarizer (BS2), the measuring laser undergoes diffuse reflection on the vibrating surface, causing the frequency of the reflected laser to shift to ‘’, where ‘’ is the Doppler frequency shift instigated by the vibrating surface. Ultimately, the reflected laser interferes with the reference laser post-beam splitter (BS3), and the photodetector transmutes the optical signal into an electrical one [35]. A time-domain vibration velocity curve is derived via demodulation and integrated to obtain the measured surface displacement.
The RLDV model used in this study is LV-RFS01, with a measuring wavelength of 1550 nm, a measuring distance of up to 100 m, and a speed resolution of 1 um/s. Figure 1 shows the Remote Laser Doppler Vibrometer and its testing principle.
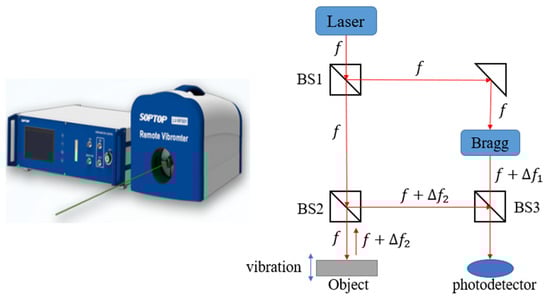
Figure 1.
Remote Laser Doppler Vibrometer and testing principle.
2.2. Deflection Test Scheme Based on RLDV
The scheme proposed in this study, based on RLDV for pavement deflection testing, is illustrated in Figure 2. RLDV is mounted on a fixed-end beam outside the runway sideline, positioned at an elevation of 1 m. The deflection measurement point is situated at the outer margin of the aircraft wheel paths, at a distance of 25–30 m from the laser, and encompasses a testing angle of 1.9–2.2°. This approach is distinguished by its non-interference with regular airport runway traffic and its capacity for non-contact, long-term runway performance monitoring.
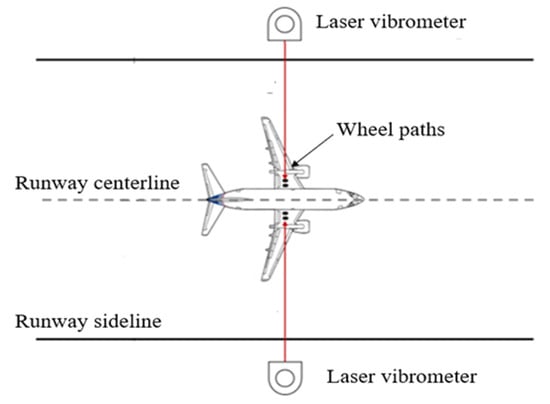
Figure 2.
Runway deflection detection scheme based on RLDV.
Nonetheless, two significant issues persist within this system framework: (1) the imposition of the small angle installation leads to the measurement result reflecting the component of runway pavement vibration in the direction of the measurement angle, (2) the fixed-end beam influenced by aircraft load and natural factors vibrates, which results in the measurement data comprising two parts: the vibration of the runway pavement and the beam itself. Consequently, subsequent efforts focus on addressing these two aspects: compensation for angle and vibration of the fixed-end beam.
3. Compensation Methods
Addressing the aforementioned issues within the system, this section focuses on rectifying both the small angle measurement discrepancies and the fixed-end beam vibrations using appropriate methodologies. The efficacy of these compensation techniques is further ascertained and enhanced via experimental validation.
3.1. Angle Compensation
Deflection refers to the vertical displacement experienced by the pavement due to the weight exerted by vehicles or aircraft. The vibrational data gathered using RLDV represents the velocity component of this vertical pavement vibration, measured in the direction of the respective angle. Consequently, the equation below (Equation (1)) demonstrates the conversion relationship between the pavement’s vertical vibrational velocity and the monitoring data collected by RLDV.
where and , respectively, represent pavement vibration velocity and values measured by RLDV in the direction of laser incidence angle .
This research carried out indoor validation experiments focused on the angle compensation methodology. The experimental setup was arranged as follows: RLDV was positioned at a height of 1 m to capture vibration data from a standard shaker located at distances of 15 m, 25 m, and 35 m from the laser. The vertical vibrational speed of the shaker was set at 40 mm/s, and the frequency at 80 Hz. Figure 3 illustrates the vibration data collection experiments using RLDV under three distinct operational conditions. The measurement point was identified as the green area illuminated by the laser on the shaker, as confirmed by high-definition images captured by the camera.
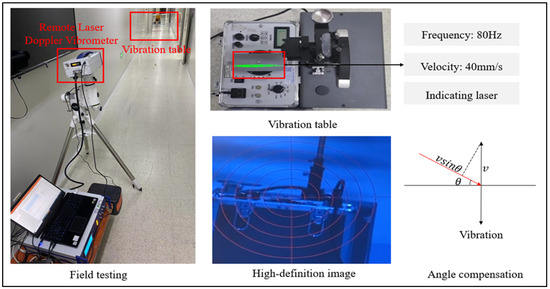
Figure 3.
Angle compensation verification experiment.
Figure 4 and Table 1, respectively, display the vibration data acquired by RLDV under three distinct operational conditions. The initial vibration velocities recorded were 2.57 mm/s, 1.57 mm/s, and 1.08 mm/s. Following angular compensation utilizing Equation (1), the resultant values were 38.45 mm/s, 39.20 mm/s, and 37.95 mm/s. The experimental discrepancies for the three operational conditions were calculated as 3.88%, 2.00%, and 5.13%, respectively. Another condition was carried out in the validation experiment of angular compensation. A reflector was placed above the shaker, which served to change the direction of the obliquely incident measurement beam to the vertical direction. Figure 4d shows the vibration data collected at a measuring distance of 35 m with a reflector, with the result of 39.97 mm/s and an error of 0.08%.
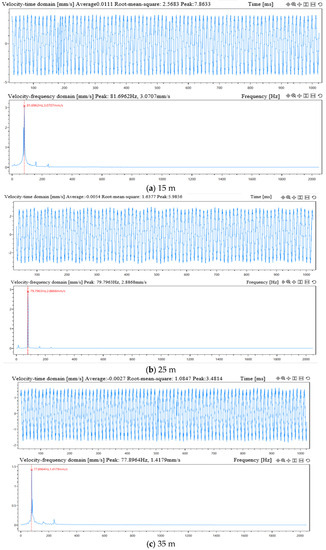
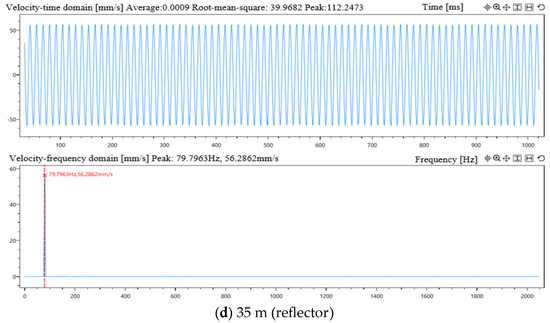
Figure 4.
Vibration experiment data collection results. (a) Condition 1: the distance between the RLDV and the observation point is 15 m; (b) Condition 2: the distance between the RLDV and the observation point is 25 m; (c) Condition 3: the distance between the RLDV and the observation point is 35 m; (d) Condition 4: the distance between RLDV and the observation point is 35 m and with reflector.

Table 1.
Analysis of angle compensation experimental results.
Upon analyzing these outcomes, it was observed that the measured values across all three experimental sets were marginally lower than the standard value. Moreover, the error under the reflector condition is only 0.08%. In contrast to vertical incidence, tilted incidence of the measuring beam results in part of the laser light reflecting off the measuring surface and being difficult to be received by the photodetector, which reduces the signal strength and results in measuring errors. Thus, this deviation can be attributed to energy loss during small-angle measurement. However, the compensatory impact of the formula proved to be highly effective, with the maximal error being 5.13%.
3.2. Vibration Compensation
To address the vibration issue of the fixed-end beam under external disturbances, this research employs accelerometers for vibration compensation. This approach is predicated on the principle of acquiring time-domain vibration acceleration at the beam’s location [36]. Subsequently, the acceleration data undergoes a Fourier transformation to identify the principal vibration frequency of the fixed-end beam. The systematic error in the raw testing data, caused by the vibration of the fixed end beam, is then filtered out. Following this, the time-domain graph of the pavement vibration is generated by integrating the processed data. Consequently, an appropriate compensation algorithm was devised, and a GUI interface was designed.
3.2.1. Experimental Validation
The goal of this validation experiment is to assess the reliability of the vibration compensation algorithm and refine it based on the resultant data. The experimental setting consisted of two indoor-scaled cement concrete slabs of 2.5 m × 2.5 m × 0.26 m. The Heavy Weight Deflectometer (HWD) was utilized to simulate the dynamic loads of an aircraft on the concrete slabs. Two sets of RLDVs were divided into control and experimental groups to measure the vibration at the identical point on the slab during HWD operation. Given the RLDV’s capability to measure with nanometer-level precision, one was selected for the control group and affixed to a long beam at an elevated position. The ends of these beams were secured to a steel frame outside of the experimental site to minimize vibrational influence. The RLDV and accelerometer of the experimental group were affixed onto the fixed-end beams and used to measure the ground vibration and the vibration of the fixed-end beams, respectively. The fixed-end beams of specified dimensions were securely attached both ends to the concrete piers of 0.25 m in height. The accelerometer features a measuring range of 50 g and a sensitivity of 100 mV/g. The experiments were conducted 30 times under respective loads of 80 kN, 100 kN, 120 kN, 140 kN, and 160 kN. Field testing is depicted in Figure 5. To ease installation, the RLDV optical head was chosen for these experiments.
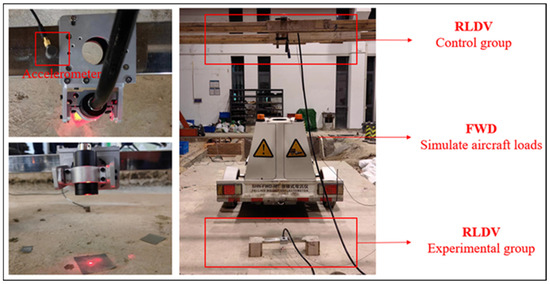
Figure 5.
Compensation algorithm experimental validation.
3.2.2. Experimental Data Processing and Analysis
- Fourier Transform
The Fourier transform plays a pivotal role in signal processing. Researchers frequently transform complex time-domain signals into more tractable signals in the frequency domain. When a continuous time-domain signal satisfies the absolute integrability condition, it can be depicted by a series of sine and cosine functions, as represented in Equation (2) [37]:
This implies that the Fourier transform facilitates the transformation of a continuous pavement vibration function into a continuous frequency spectrum. Owing to the complexity of real-world pavement vibration conditions, the time-domain function of the pavement vibration is converted into the frequency domain via Equation (3). This conversion aids in the analysis of the pavement’s vibration characteristics.
where t and w are the continuous spatial variable and continuous time variable.
- Filter Selection
Filters can be classified into various types based on the filter approximation method, including Butterworth filters [38], Bessel filters [39], and Chebyshev filters [40]. Notably, the Butterworth filter is characterized by its uniformly flat amplitude-frequency traits within the passband and monotonically decreasing amplitude-frequency characteristics in the transition band. As such, it is extensively employed in the realm of signal processing. Consequently, for the processing of vibration signals in this study, the Butterworth filter was chosen.
- Vibration Data Processing and Analysis
Through our research and analysis, the raw data of RLDV measurements consist of fixed end beams and pavement vibration. The vibration of the fixed-end beams can be detected by means of accelerometers. The quadratic integration of the accelerometer data revealed that the peak vibration impact of the fixed-end beams generated by the external conditions was 13 µm under 100 kN, as shown in Figure 6. The peak value of pavement vibration for the control group was 101.88 µm according to Table 2, and the effect of fixed end-beam vibration accounted for 12.76%, which could not be ignored.
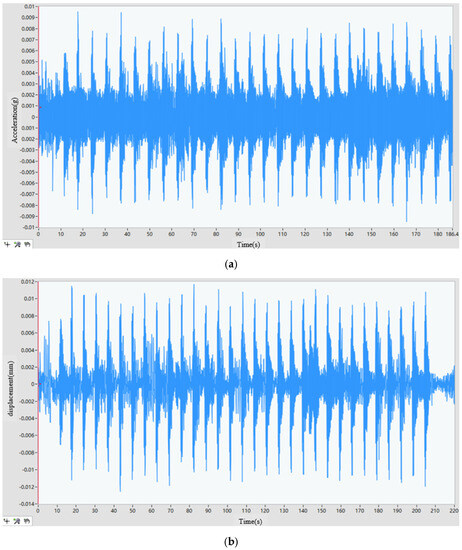
Figure 6.
Fixed-end Beam Vibration Displacement (100 kN). (a) Vibration acceleration of fixed-end beam; (b) Vibration displacement of fixed-end beam after quadratic integration.
Table 2.
Analysis of Vibration compensation experimental results.
Figure 7 shows the flowchart for vibration compensation of RLDV test data. Each step can be further described as follows.
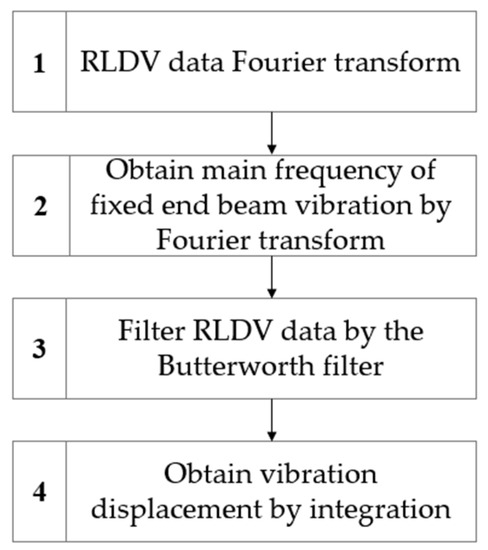
Figure 7.
Flowchart for vibration compensation of RLDV test data.
Step 1. Apply Fourier transform to the vibration data and analyze the vibrational characteristics of the concrete slab. Figure 8a,b, respectively, depict the collected pavement vibration data under a 100 kN load from both the experimental and control groups using RLDV. The comparison indicates that both sets of vibration data exhibit the same frequency range of 30 to 50 Hz. However, the experimental group registered a substantial vibration signal in the low-frequency band, ranging from 0 to 30 Hz, possibly attributed to the vibration of the fixed-end beam.
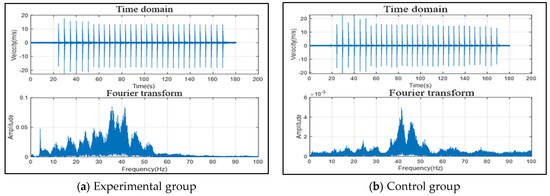
Figure 8.
RLDV data and Fourier transform (100 kN). (a) Vibration measurement data and Fourier transform of the experimental group; (b) Vibration measurement data and Fourier transform of the control group.
Step 2. Conduct a Fourier transform on the accelerometer data to analyze the vibrational characteristics of the fixed-end beam. Figure 9 shows the vibration data collected by the accelerometer under a load of 100 kN and the frequency domain results after Fourier transformation. It demonstrates that the primary vibration frequency range of the fixed-end beam spans from 0 to 40 Hz.
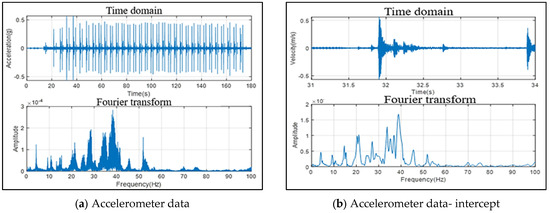
Figure 9.
Accelerometer data and Fourier transform (100 kN). (a) Vibration measurement data and Fourier transform of the accelerometer; (b) Intercept vibration measurement data and Fourier transform of the accelerometer.
Step 3. Extract the pavement vibration data of the same time-domain from the experimental group RLDV, as depicted in Figure 9, and utilize a Butterworth high-pass filter to eliminate low-frequency vibration signals. Figure 10a,b, respectively, illustrate the vibration data before and after the filtering process. Comparing the vibration curves before and after filtering, Figure 10b eliminates some low-frequency vibration.
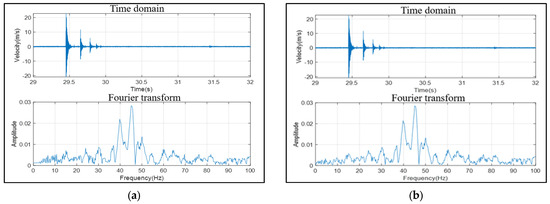
Figure 10.
Filtering of vibration data (100 kN). (a) Vibration data before filtering from RLDV; (b) Vibration data after filtering via the Butterworth filter.
Step 4. The time-domain vibration curves from the experimental and control groups are integrated to derive the vibration displacements of the concrete slab, as demonstrated in Figure 11. The waveforms, the magnitudes, and the frequency oscillations of the displacement curves were very similar in the experimental and the control groups.
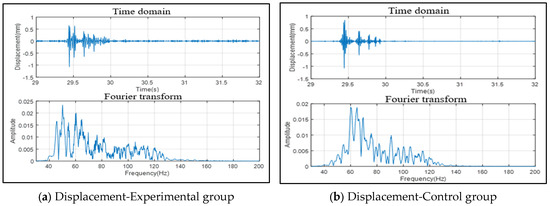
Figure 11.
Displacement of concrete slab (100 kN). (a) Displacement vibration of the experimental group; (b) Displacement vibration of the control group.
For the remaining sets of experimental data, Steps 1–4 were iteratively performed to derive the displacement curve of the concrete slab. The peak values of the pavement displacement curve, or the pavement deflection, were extracted for the experimental and control groups under five different load levels. Table 2 presents the average pavement deflection values for the experimental and control groups under the five loading levels. As per Table 2, the pavement deflection in the experimental group is marginally smaller than that in the control group due to the removal of effective vibration information during the filtering process. The maximum measurement errors across all five sets of experiments were 6.48%, a value less than 12.76%, signifying that the preliminary compensation method for the vibration of the fixed-end beam is effective. Future work should focus on optimizing the compensation algorithm using the currently obtained experimental data.
4. Reliability Analysis of RLDV Tests
The reliability of the test results generated by the Remote Laser Doppler Vibrometer (RLDV), a novel non-contact pavement deflection testing apparatus proposed in this study, is subject to scrutiny. As such, a comparative analysis of its testing results with other deflectometers is required to ascertain its reliability. Given the widespread usage and recognized reliability of the Heavy Weight Deflectometer (HWD) in current deflection tests, it was selected as the control group. This study conducted deflection tests using both HWD and RLDV on a full-scale outdoor concrete slab, with the measurement point situated at the edge of the HWD load plate. The horizontal distance between the measuring point and the Remote Laser Doppler Vibrometer was 35 m, and the vertical height between the measuring point and the optical head was 1 m. The deflection at the measuring points at five different load levels of 80 kN, 100 kN, 120 kN, 140 kN, and 160 kN was evaluated, with each load level repeated 10 times. The peak of the RLDV test data was obtained after angle compensation and vibration compensation had been applied.
Figure 12 illustrates the correlation analysis between results obtained from the RLDV and HWD tests. A linear fitting equation was established, linking the deflection values derived from both testing methods. The coefficient of determination (), serving as the evaluation metric for the linear regression model, yields a value of 0.94. This suggests a strong correlation between the RLDV and HWD test outcomes. Thus, the reliability of RLDV for detecting pavement deflection has been substantiated.
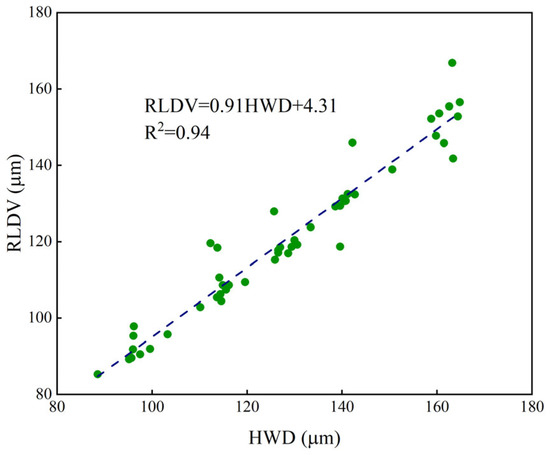
Figure 12.
Correlation analysis of RLDV and HWD.
5. Conclusions
This research introduces a novel pavement deflection testing method utilizing a Remote Laser Doppler Vibrometer (RLDV). This study presents a design scheme for runway deflection tests based on RLDV and proposes compensation methodologies for addressing small angle measurement and fixed-end beam vibration issues inherent in the design scheme. The precision of these compensation methodologies has been experimentally verified and optimized. Lastly, a regression analysis models the relationship between RLDV and Heavy Weight Deflectometer (HWD) test data. We draw the following conclusions:
- The proposed deflection test scheme satisfies the non-stop, non-contact testing requirements at airports.
- The employed angle compensation and vibration compensation methodologies have demonstrated effective data processing. The vibration compensation method reduces the effect of fixed beam vibration on detection from 12.76% to 6.48%.
- There is a strong correlation between the RLDV and HWD test results, evidenced by an value of 0.94. This suggests that RLDV holds significant potential for intelligent detection of airport runway structural performance.
The experiments in this study have been carried out on indoor or outdoor cement concrete slabs. The RLDV has not yet been successfully applied to the field structural evaluation of airport runways. Therefore, it is not possible to assess the effect of aircraft type, speed, moisture, special weather conditions, etc., on vibration signal collection and the RLDV test.
Future enhancements will center around the acquisition of more data to refine the test scheme design and the associated compensation methodologies. Application of this test scheme to evaluate the structural performance of airport runways constitutes the forthcoming step in our research endeavor. The future work plan is as follows:
- Apply the RLDV to airport runway structural performance field tests and analyze the effects of aircraft, load, environment, and other factors on vibration signals and RLDV tests.
- Optimize the applied compensation method using extensive field experimental data.
- Establish a systematic measurement and evaluation system to provide a convenient and efficient method for evaluating pavement performance, including RLDV installation, data processing, performance analysis, etc.
Author Contributions
Conceptualization, G.Y., Y.T. and X.Z.; methodology, Y.T. and X.Z.; software, G.Y. and L.L.; validation, G.Y., X.Z. and Y.T.; formal analysis, Y.T. and X.Z.; investigation, X.Z. and L.L.; resources, Y.T.; data curation, X.Z.; writing—original draft preparation, X.Z.; writing—review and editing, X.Z.; visualization, X.Z. and L.L.; supervision, G.Y.; project administration, G.Y.; funding acquisition, Y.T. All authors have read and agreed to the published version of the manuscript.
Funding
Supported by the Fundamental Research Funds for the Central Universities.
Institutional Review Board Statement
Not applicable.
Informed Consent Statement
Not applicable.
Data Availability Statement
The data presented in this study are available on request from the corresponding author.
Acknowledgments
The authors acknowledge Sunny Optical Intelligence Corporation for the technical support for the installation and operation of RLDV during the experiment.
Conflicts of Interest
The authors declare no conflict of interest.
References
- Fathi, A.; Mazari, M.; Saghafi, M.; Hosseini, A.; Kumar, S. Parametric study of pavement deterioration using machine learning algorithms. In International Airfield and Highway Pavements Conference 2019; American Society of Civil Engineers: Reston, VA, USA, 2019. [Google Scholar]
- Bruno, S.; Del Serrone, G.; Di Mascio, P.; Loprencipe, G.; Ricci, E.; Moretti, L. Technical proposal for monitoring thermal and mechanical stresses of a runway pavement. Sensors 2021, 21, 6797. [Google Scholar] [CrossRef] [PubMed]
- Brown, M.; Wright, D.; M’Saoubi, R.; McGourlay, J.; Wallis, M.; Mantle, A.; Ghadbeigi, H. Destructive and non-destructive testing methods for characterization and detection of machining-induced white layer: A review paper. CIRP J. Manuf. Sci. Technol. 2018, 23, 39–53. [Google Scholar] [CrossRef]
- Rivard, P.; Saint-Pierre, F. Assessing alkali-silica reaction damage to concrete with non-destructive methods: From the lab to the field. Constr. Build. Mater. 2009, 23, 902–909. [Google Scholar] [CrossRef]
- Sanjay, R.; Tejeshwini, S.; Mamatha, K.H.; Dinesh, S.V. Comparative study on structural evaluation of flexible pavement using BBD and FWD. Mater. Today Proc. 2022, 60, 608–615. [Google Scholar] [CrossRef]
- Epps, J.A.; Monismith, C.J. Equipment for Obtaining Pavement Condition and Traffic Loading Data; National Cooperative Highway Research Program: Washington, DC, USA, 1986; pp. 10–11. [Google Scholar]
- Jean, R.; Thomas, A.; Hervé, D.B.; Cédric, S.; Michaël, B. Influence of interface properties on heavy weight deflectometer test results. Road Mater. Pavement Des. 2022, 23 (Suppl. S1), 162–177. [Google Scholar]
- Shrestha, S. Development of Structural Condition Thresholds for TSD Measurements. Ph.D. Thesis, Virginia Tech, Blacksburg, VA, USA, 2017. [Google Scholar]
- Broutin, M. Assessment of Flexible Airfield Pavements Using Heavy Weight Deflectometers. Development of a FEM Dynamical Time-Domain Analysis for the Backcalculation of Structural Properties. Ph.D. Thesis, Ecole des Ponts ParisTech, Paris, France, 2010. [Google Scholar]
- Pigozzi, F.; Coni, M.; Portas, S.; Maltinti, F. Implementation of deflection bowl measurements for structural evaluations at network level of airport pavement management system. In Proceedings of the FAA—Worldwide Airport Technology Transfer Conference—Innovations in Airport Safety and Pavement Technology, Galloway, NJ, USA, 5–7 August 2014; pp. 5–7. [Google Scholar]
- Zhang, J.; Lv, Q.; Shi, W.; Li, G.; Zhang, J. Refinement of a deflection basin area index method for rigid pavement. Shock Vib. 2021, 2021, 8684596. [Google Scholar] [CrossRef]
- Katicha, S.; Flintsch, G.; Diefenderfer, B. Ten years of traffic speed deflectometer research in the United States: A review. Transp. Res. Rec. 2022, 2676, 152–165. [Google Scholar] [CrossRef]
- Da Paiva, C.E.L.; Da Franco Peixoto, C.; Da Melo Correia, L.F.; Aguiar, P.R. Evaluation between two Brazilian railway tracks. J. Civ. Eng. Archit. 2011, 5. [Google Scholar] [CrossRef]
- Fontul, S.; Neves, J.; Gomes, S.V. Monitoring of Pavement Structural Characteristics. In Advances on Testing and Experimentation in Civil Engineering: Geotechnics, Transportation, Hydraulics and Natural Resources; Springer International Publishing: Cham, Switzerland, 2022. [Google Scholar]
- Zofka, A.; Sudyka, J.; Sybilski, D. Assessment of pavement structures at traffic speed. In Bearing Capacity of Roads, Railways and Airfields; CRC Press: Boca Raton, FL, USA, 2017; pp. 585–588. [Google Scholar]
- Wijesundara, M.; Azevedo, R. Silicon Carbide Microsystems for Harsh Environments; Springer Science & Business Media: Berlin/Heidelberg, Germany, 2011; p. 22. [Google Scholar]
- Zhao, H.; Wu, C.; Wang, X.; Zheng, Y. Pavement condition monitoring system at shanghai pudong international airport. In Pavement Materials, Structures, and Performance; ASCE Library: Reston, VA, USA, 2014; pp. 283–295. [Google Scholar]
- Alghadeir, A.; Sakran, H.A. Smart airport architecture using internet of things. Int. J. Innov. Res. Comput. Sci. Technol. 2016, 4, 2347–5552. [Google Scholar]
- Lee, X.; Hovan, M.; King, R. Runway instrumentation at Denver International Airport development of database. In Proceedings of the Aircraft/Pavement Technology in the Midst of Change ASCE, Air Transport Division, Airfield Pavement Committee American Society of Civil Engineers, Seattle, DC, USA, 17–20 August 1997. [Google Scholar]
- Dong, M.; Hayhoe, G.F.; Fang, Y.W. Runway instrumentation at Denver International Airport: Dynamic sensor data processing. In Proceedings of the Aircraft/Pavement Technology in the Midst of Change ASCE, Air Transport Division, Airfield Pavement Committee American Society of Civil Engineers, Seattle, DC, USA, 17–20 August 1997. [Google Scholar]
- Dong, M.; Hayhoe, G.F. Denver International Airport Sensor Processing and Database; Federal Aviation Administration, Office of Aviation Research: Washington, DC, USA, 2000.
- Brill, D.R.; Flynn, R.M.; Pecht, F. FAA Rigid Pavement Instrumentation at Atlanta Hartsfield-Jackson International Airport. In Proceedings of the 2007 Worldwide Airport Technology Transfer Conference Federal Aviation Administration American Association of Airport Executives, Atlantic City, NJ, USA, 16–18 April 2007. [Google Scholar]
- Cook, K. Detecting interlayer delamination in asphalt airport pavements using strain gage instrumentation systems. Ph.D. Thesis, University of Hawaii, Manoa, Honolulu, 2014. [Google Scholar]
- Cook, K.; Garg, N.; Singh, A. Detection of delamination in the HMA layer of runway pavement structure using asphalt strain gauges. J. Transp. Eng. 2016, 142, 04016047. [Google Scholar] [CrossRef]
- Xie, J.; Li, H.; Gao, L.; Liu, M. Laboratory investigation of rutting performance for multilayer pavement with fiber Bragg gratings. Constr. Build. Mater. 2017, 154, 331–339. [Google Scholar] [CrossRef]
- Doyle, J.D.; Cox, B.C.; Tingle, J.S.; Hodo, W.D.; Carr, H.T.; Donovan, P.R. Construction of Instrumented “Smart” Runway. In Airfield and Highway Pavements; ASCE Library: Reston, VA, USA, 2021; pp. 120–132. [Google Scholar]
- Ling, J.; Fang, Y.; Zhang, J.; Wu, Z.; Zhao, H.; Shen, R. Framework and key technologies of airport smart runway. China Civ. Eng. J. 2022, 55, 120–128. [Google Scholar]
- Rostworowski, A. Developing the intelligent airport. J. Airpt. Manag. 2012, 6, 202–206. [Google Scholar]
- Datla, R.; Chalavadi, V.; Mohan, C.K. A multimodal semantic segmentation for airport runway delineation in panchromatic remote sensing images. In Proceedings of the 14th International Conference on Machine Vision (ICMV 2021), Rome, Italy, 8–12 November 2021. [Google Scholar]
- Castellini, P.; Martarelli, M.; Tomasini, E.P. Laser Doppler Vibrometry: Development of advanced solutions answering to technology’s needs. Mech. Syst. Signal Process. 2006, 20, 1265–1285. [Google Scholar] [CrossRef]
- Ma, G.; Sawada, K.; Saito, H.; Uehan, F.; Yashima, A. Study on evaluating rock block stability by using a remotely positioned laser Doppler vibrometer. GEOMATE J. 2012, 2, 247–252. [Google Scholar] [CrossRef]
- Sugimoto, T.; Sugimoto, K.; Kosuge, N. High-speed noncontact acoustic inspection method for civil engineering structure using multitone burst wave. Jpn. J. Appl. Phys. 2017, 56, 07JC10. [Google Scholar] [CrossRef]
- Klun, M.; Zupan, D.; Lopatič, J. On the application of laser vibrometry to perform structural health monitoring in non-stationary conditions of a hydropower dam. Sensors 2019, 19, 3811. [Google Scholar] [CrossRef] [PubMed]
- Wang, Q.; Zhu, J.; Dai, J. Research on blade modal testing method based on 3D scanning laser Doppler vibration measurement technology. In Proceedings of the 2nd International Conference on Electronic Science and Automation Control, Suzhou, China, 16–17 May 2020. [Google Scholar]
- Tomasini, E.P.; Castellini, P. Laser Doppler Vibrometry; Springer: Berlin/Heidelberg, Germany, 2020; p. 7. [Google Scholar]
- Wu, T.; Liang, T.; Shuai, S. Accurate structural displacement monitoring by data fusion of a consumer-grade camera and accelerometers. Eng. Struct. 2022, 262, 114303. [Google Scholar] [CrossRef]
- Zak, J.; Korzynska, A.; Pater, A. Fourier Transform Layer: A proof of work in different training scenarios. Appl. Soft Comput. 2023, 145, 110607. [Google Scholar] [CrossRef]
- Yao, S.; Collins, T.; Jančovič, P. Hybrid method for designing digital Butterworth filters. Comput. Electr. Eng. 2012, 38, 811–818. [Google Scholar] [CrossRef]
- Pradeep, K.C.; Vipin, G.; Ram, B.P. Fourier-Bessel representation for signal processing: A review. Digit. Signal Process. 2023, 135, 103938. [Google Scholar]
- Alberto, C.; Giovanni, L.S. A study about Chebyshev nonlinear filters. Signal Process. 2016, 122, 24–32. [Google Scholar]
Disclaimer/Publisher’s Note: The statements, opinions and data contained in all publications are solely those of the individual author(s) and contributor(s) and not of MDPI and/or the editor(s). MDPI and/or the editor(s) disclaim responsibility for any injury to people or property resulting from any ideas, methods, instructions or products referred to in the content. |
© 2023 by the authors. Licensee MDPI, Basel, Switzerland. This article is an open access article distributed under the terms and conditions of the Creative Commons Attribution (CC BY) license (https://creativecommons.org/licenses/by/4.0/).